
94% of researchers rate our articles as excellent or good
Learn more about the work of our research integrity team to safeguard the quality of each article we publish.
Find out more
ORIGINAL RESEARCH article
Front. Neurosci., 18 January 2023
Sec. Brain Imaging Methods
Volume 16 - 2022 | https://doi.org/10.3389/fnins.2022.1031163
This article is part of the Research TopicNovel Perspectives and Improvements in fMRI Functional Connectivity Analysis Methods Used to Investigate Brain Networks and Cognitive Mechanisms in HumansView all 8 articles
 Zhisen Li1†
 Xiaoxia Hou2†Yanli Lu1Huimin Zhao2Meixia Wang2Bo Xu2Qianru Shi2Qian Gui2Guanhui Wu2Mingqiang Shen2Wei Zhu2Qinrong Xu2Xiaofeng Dong2Qingzhang Cheng2Jibin Zhang1Hongxuan Feng2*
Objective: To investigate the changes of brain network in epilepsy patients without intracranial lesions under resting conditions.
Methods: Twenty-six non-lesional epileptic patients and 42 normal controls were enrolled for BOLD-fMRI examination. The differences in brain network topological characteristics and functional network connectivity between the epilepsy group and the healthy controls were compared using graph theory analysis and independent component analysis.
Results: The area under the curve for local efficiency was significantly lower in the epilepsy patients compared with healthy controls, while there were no differences in global indicators. Patients with epilepsy had higher functional connectivity in 4 connected components than healthy controls (orbital superior frontal gyrus and medial superior frontal gyrus, medial superior frontal gyrus and angular gyrus, superior parietal gyrus and paracentral lobule, lingual gyrus, and thalamus). In addition, functional connectivity was enhanced in the default mode network, frontoparietal network, dorsal attention network, sensorimotor network, and auditory network in the epilepsy group.
Conclusion: The topological characteristics and functional connectivity of brain networks are changed in in non-lesional epilepsy patients. Abnormal functional connectivity may suggest reduced brain efficiency in epilepsy patients and also may be a compensatory response to brain function early at earlier stages of the disease.
Epilepsy is a chronic seizure disorder characterized by abnormal neuronal activity causing recurrent neurological disturbances (Lv et al., 2014). Currently, the incidence of epilepsy is about 1–2% worldwide (Falco-Walter, 2020). Long-term recurrent seizures can lead to functional impairment, cognitive decline and mental abnormalities, seriously affecting patients’ health and quality of life. The 2017 edition of the International League Against Epilepsy Guidelines divides epilepsy etiologies into 6 categories: structural, genetic, infectious, metabolic, immune, and unknown etiology (Fisher, 2017). The diagnosis of epilepsy relies on clinical, electrophysiological, and imaging techniques. Non-lesional epilepsy (NLE) is defined as a type of epilepsy without definite lesions in conventional imaging examinations such as CT and MRI (Zhang et al., 2011), so its clinical etiological diagnosis is relatively difficult.
As recent medical imaging technology is developing rapidly, resting state functional magnetic resonance imaging (rs-fMRI) has been increasingly used in brain network research (Songjiang et al., 2021). Blood oxygen level dependent (BOLD) imaging is an emerging functional imaging technique that indirectly reflects the temporal and spatial distribution of neuronal activity in the brain by detecting changes in oxygen levels in the brain tissue, thus reflecting changes in the neural network of the brain tissue (Detre, 2006). At present, scholars increasingly recognize that the human brain is composed of a complex functional network with topological properties. Through graph theory analysis (GTA), the complete brain can be divided into different nodes and edges, so as to construct the structure or function network of the brain (Zhang et al., 2010b). Independent component analysis (ICA) can extract different functional brain network components in the resting state on the basis of data-driven model. The above methods are now widely used to analyze brain networks in a variety of central nervous system disorders (Sendi et al., 2020; Liu et al., 2021).
In our research, we studied the topological properties of brain networks in NLE patients based on BOLD-fMRI, and further analyzed the functional connectivity between brain networks. By understanding the interconnections between different brain networks and the abnormal changes that may be caused by these connections, we can explore the underlying pathophysiological mechanisms of the occurrence and development of patients with non-focal epilepsy.
Twenty-six NLE patients diagnosed by the Department of Neurology, Suzhou Hospital Affiliated to Nanjing Medical University, from June 2018 to April 2022 were enrolled in this study (1 patient was excluded because of excessive head movement). Inclusion criteria: (1) patients met the 2017 international league against epilepsy (ILAE) epilepsy diagnostic criteria (Fisher et al., 2017); (2) no intracranial lesions were found on routine imaging examination; (3) without other physical or mental diseases; (4) right-handed; (5) no contraindications to MRI examination. All patients were clinically assessed by a detailed epileptic history, neurological and psychiatric evaluation, electroencephalogram and cranial MRI. Forty-two normal healthy volunteers matched to the epilepsy group in terms of sex, handedness, age, and education were recruited as controls. All healthy controls were proved without neuropsychological history and definite intracranial lesions on routine MRI. All subjects were assessed for neuropsychological and cognitive status by the Hamilton Anxiety Scale (HAMA), the Hamilton Depression Scale (HAMD), and the Montreal Cognitive Assessment (MoCA). The study was approved by the Ethics Committee of Suzhou Hospital Affiliated to Nanjing Medical University, and written informed consent was obtained from each subject.
Routine MRI sequences and resting-state BOLD sequences were performed using a Siemens Skyra 3.0T MR scanner with an 8-channel head coil. All subjects remained closed-eyed, awake and quiet during the examination. Conventional MRI sequences included transverse T1WI, T2WI, FLAIR, and DWI, sagittal T2WI. BOLD-fMRI parameters: TR:2720 ms, TE:30.0 ms, layer thickness: 3.0 mm, layer spacing: 0 mm; FOV:260 mm × 260 mm, matrix :192 × 192, turning Angle 2°, 15°.
We used the DPABI toolbox version 4.0 to preprocess fMRI images of all subjects. The specific process was as follows :(1) removal of the acquisition data at the first 5 time points; (2) time layer correction; (3) removal of images of subjects with head movements exceeding 3 mm or 3° by head movement correction; (4) Dartel alignment; (5) removal of linear drift in the BOLD signal; (6) regression of white matter signal, cerebrospinal fluid signal and Friston24 head motion parameters; (7) band-pass filtering (0.01–0.08 HZ).
The brain network nodes were defined using the AAL90 template. The AAL90 template divided the brain into 90 regions, each brain region was considered as a node in the brain network, and functional connections were defined as edges. The time series of each brain region were extracted from the preprocessed functional data, and the Pearson correlation coefficients were calculated for the BOLD time series between brain regions. Fisher’s Z-transformation was done on the correlation coefficients as the connected edge values between the nodes in the network, so that a 90*90 network matrix was obtained for each subject. The graphic model of the brain functional network was constructed by a binary connection matrix. The lower limit of sparsity was automatically estimated according to Gretna software (Watts and Strogatz, 1998; Wang et al., 2015), and the upper limit of sparsity was selected according to the small-world property sigma > 1.1 for more than 90% of the subjects. The topological properties including global efficiency (Eglob), local efficiency (Eloc), clustering coefficient (Cp), shortest path length (Lp), normalized clustering coefficient (γ), normalized shortest path length (λ), small-worldness parameters (σ)over network sparsity thresholds of 5%–28% with an increment of 1% were analyzed. We calculated the area under the curve (AUC) values of each index, and finally analyzed the AUC values for comparison between groups.
The pre-processed data were decomposed into functional networks using the grouped ICA component of the Functional Magnetic Resonance Toolbox (GIFT v4.0a).1 The software automatically calculated 31 independent components. Prior to ICA decomposition, the data were subjected to a dimensionality reduction operation using the principal component analysis method. To ensure the stability of the results, we repeated the ICA 20 times using ICASSO tool. Finally, the spatial distribution maps and time series of independent components for each individual subject were obtained using the GICA reverse reconstruction method. The components were selected empirically from the results: (1) high activation regions of functional network components should be in the gray matter and have less overlap with cerebrospinal fluid, white matter, and ventricles (2) time series of functional network components were dominated by low frequency components. As shown in Figure 1, the 10 network components of interest included the anterior default mode network (aDMN), posterior default mode network (pDMN), left frontoparietal network (LFPN), right frontoparietal network (RFPN), salience network (SN), dorsal attention network (DAN), ventral attention network (VAN), sensorimotor network (SMN), auditory network (AN), and visual network (VN).
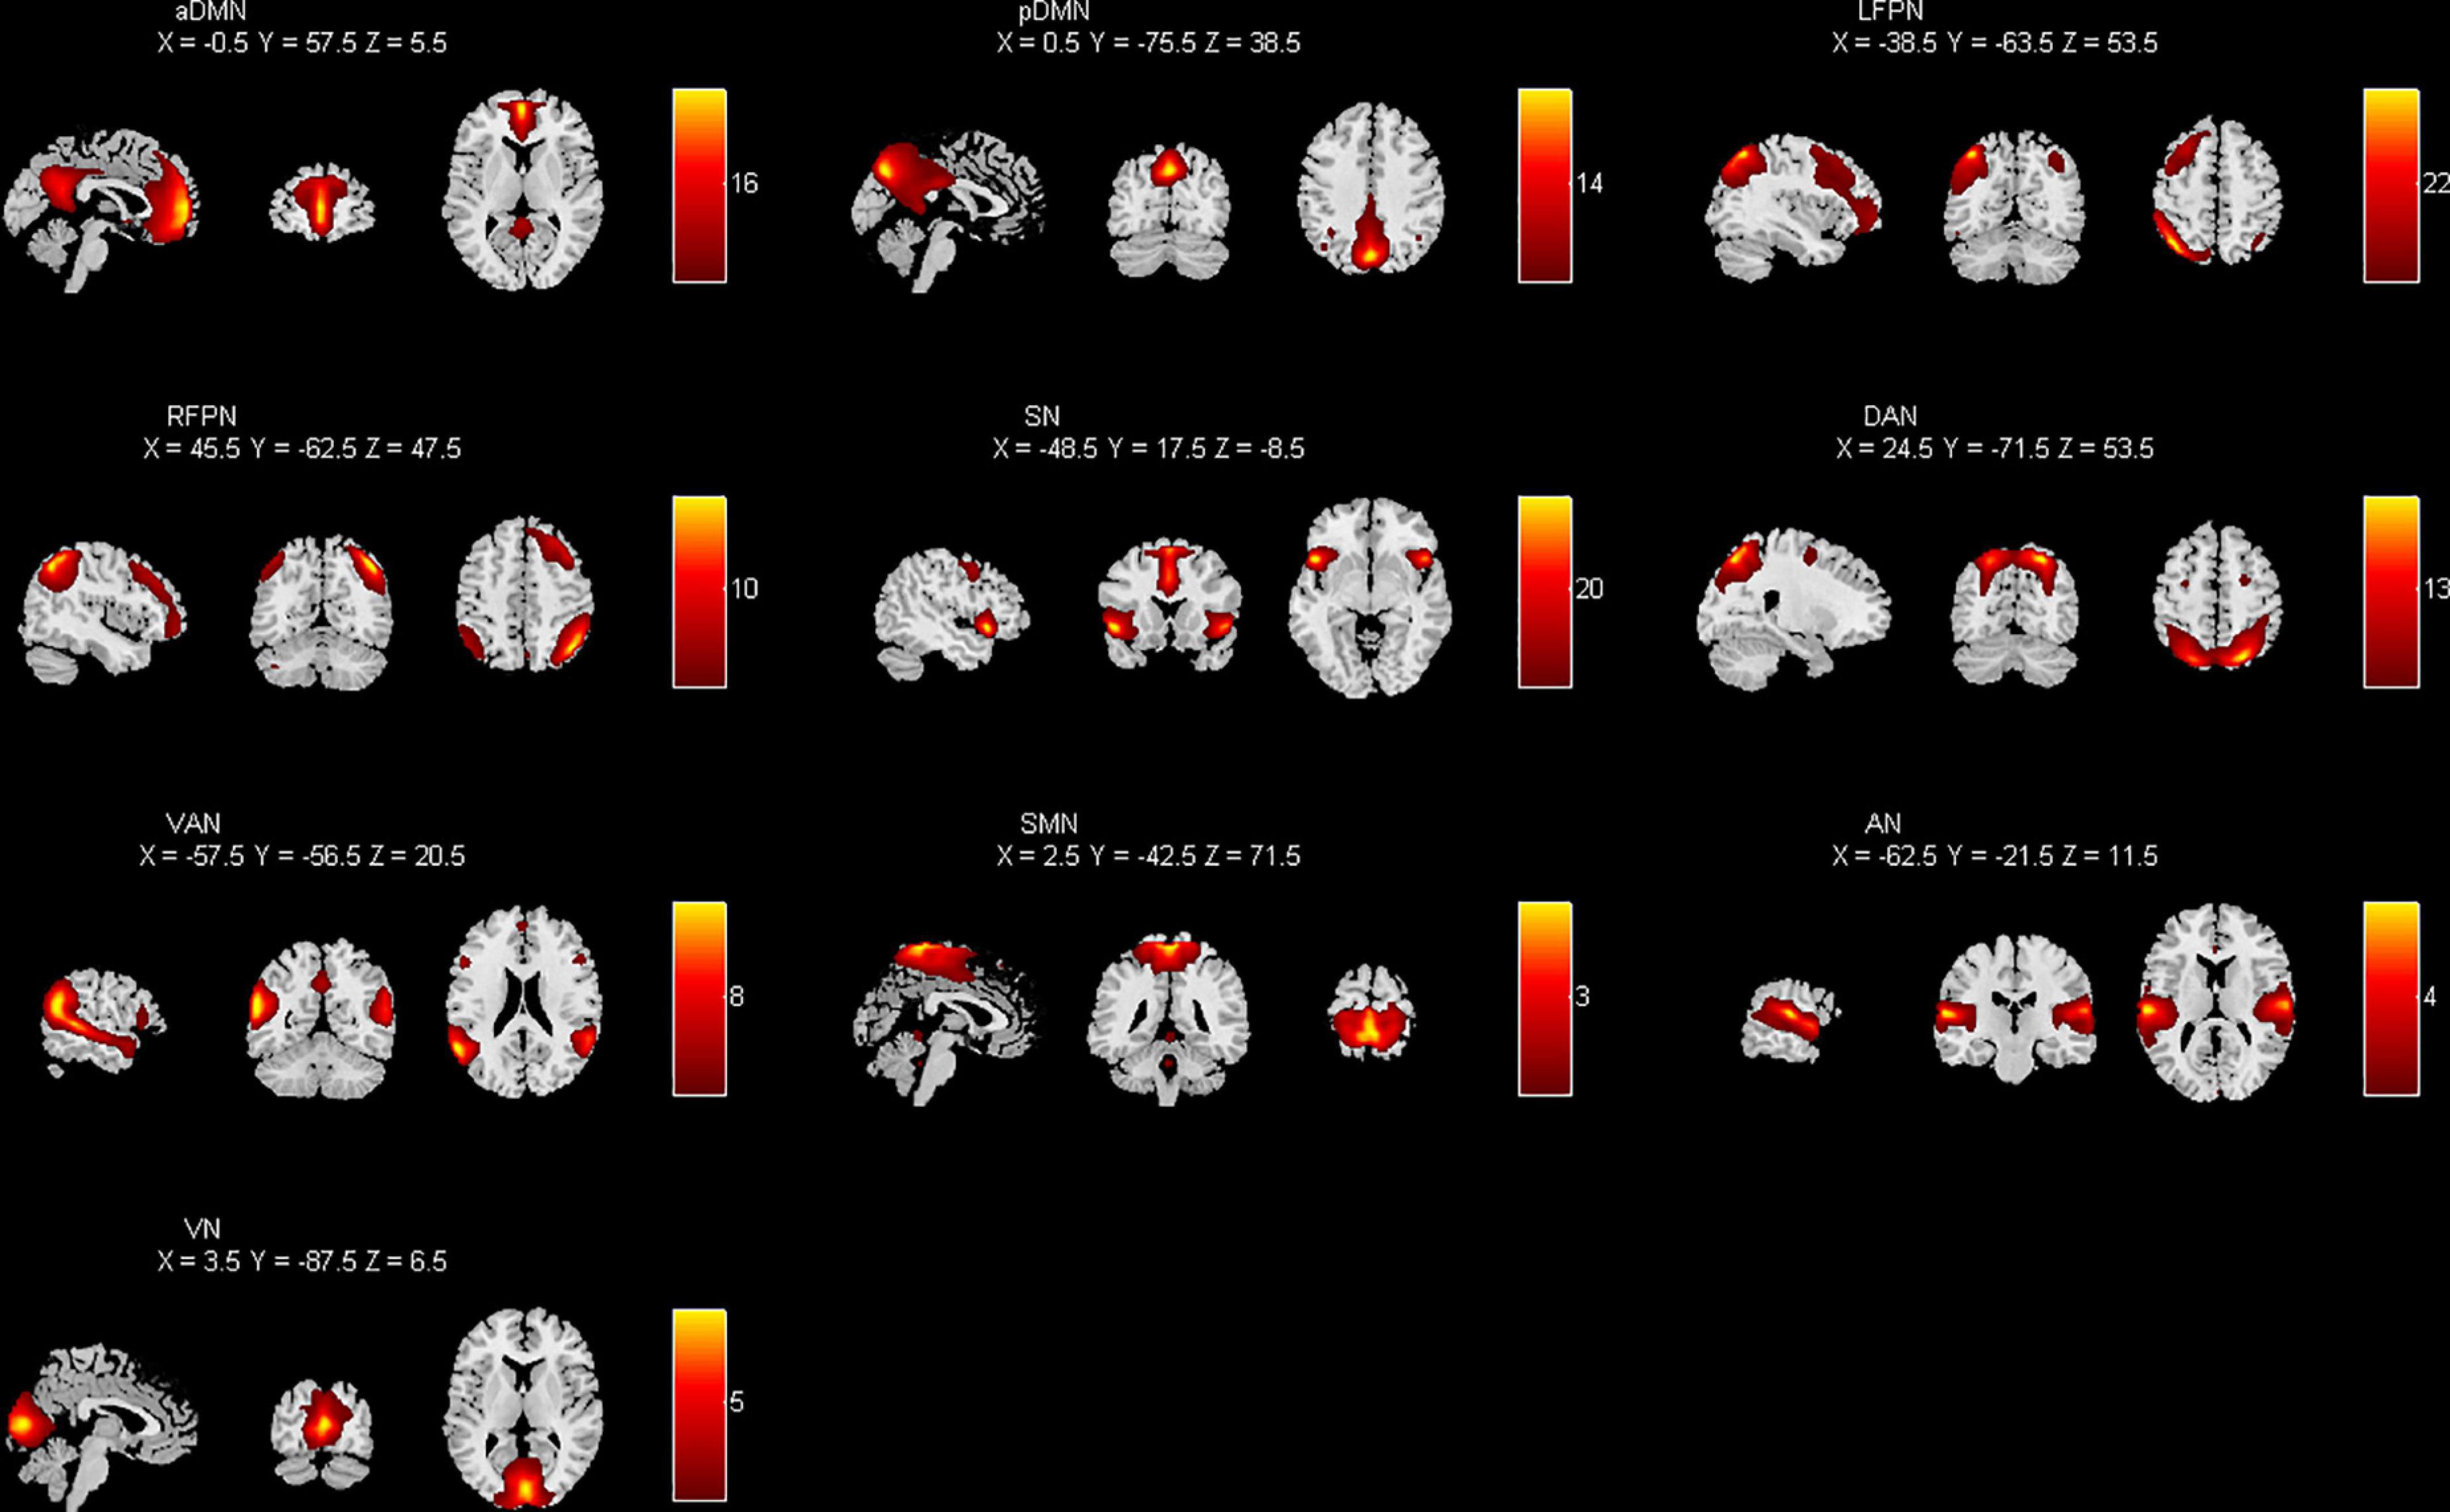
Figure 1. Spatial distribution of each brain network component by applying independent component analysis (ICA) extraction.
The time series of each interesting component were obtained for post-processing using the Mancovan toolbox in GIFT. Noise reduction was performed on the components of the above 10 networks by first de-linearizing the time series and then filtering them with a low-pass filter with a high frequency cutoff of 0.15 Hz. Finally, the Pearson correlation coefficients were calculated for the time series after the noise reduction of the independent components to construct the FNC matrix.
Statistical analysis was performed by SPSS22.0. The measurements that conformed to a normal distribution (e.g., age, years of education, HAMA scores, HAMD scores, MoCA scores) were compared by independent sample t-tests. The enumeration data expressed as frequencies or percentages were compared using χ2-test. The AUC values of brain network topology indicators, the edge-connected functional connectivity matrices, and the FNC matrices were compared using two independent samples t-tests. P < 0.05 indicated statistically significant difference.
There were 26 epilepsy patients in total participated in our research, of which 1 was finally excluded due to poor quality of cranial magnetic resonance imaging. All enrolled epileptic patients’ clinical information were listed in Table 1. There were no differences in age, gender, years of education, anxiety and depression assessment and cognitive assessment between two groups (Table 2).
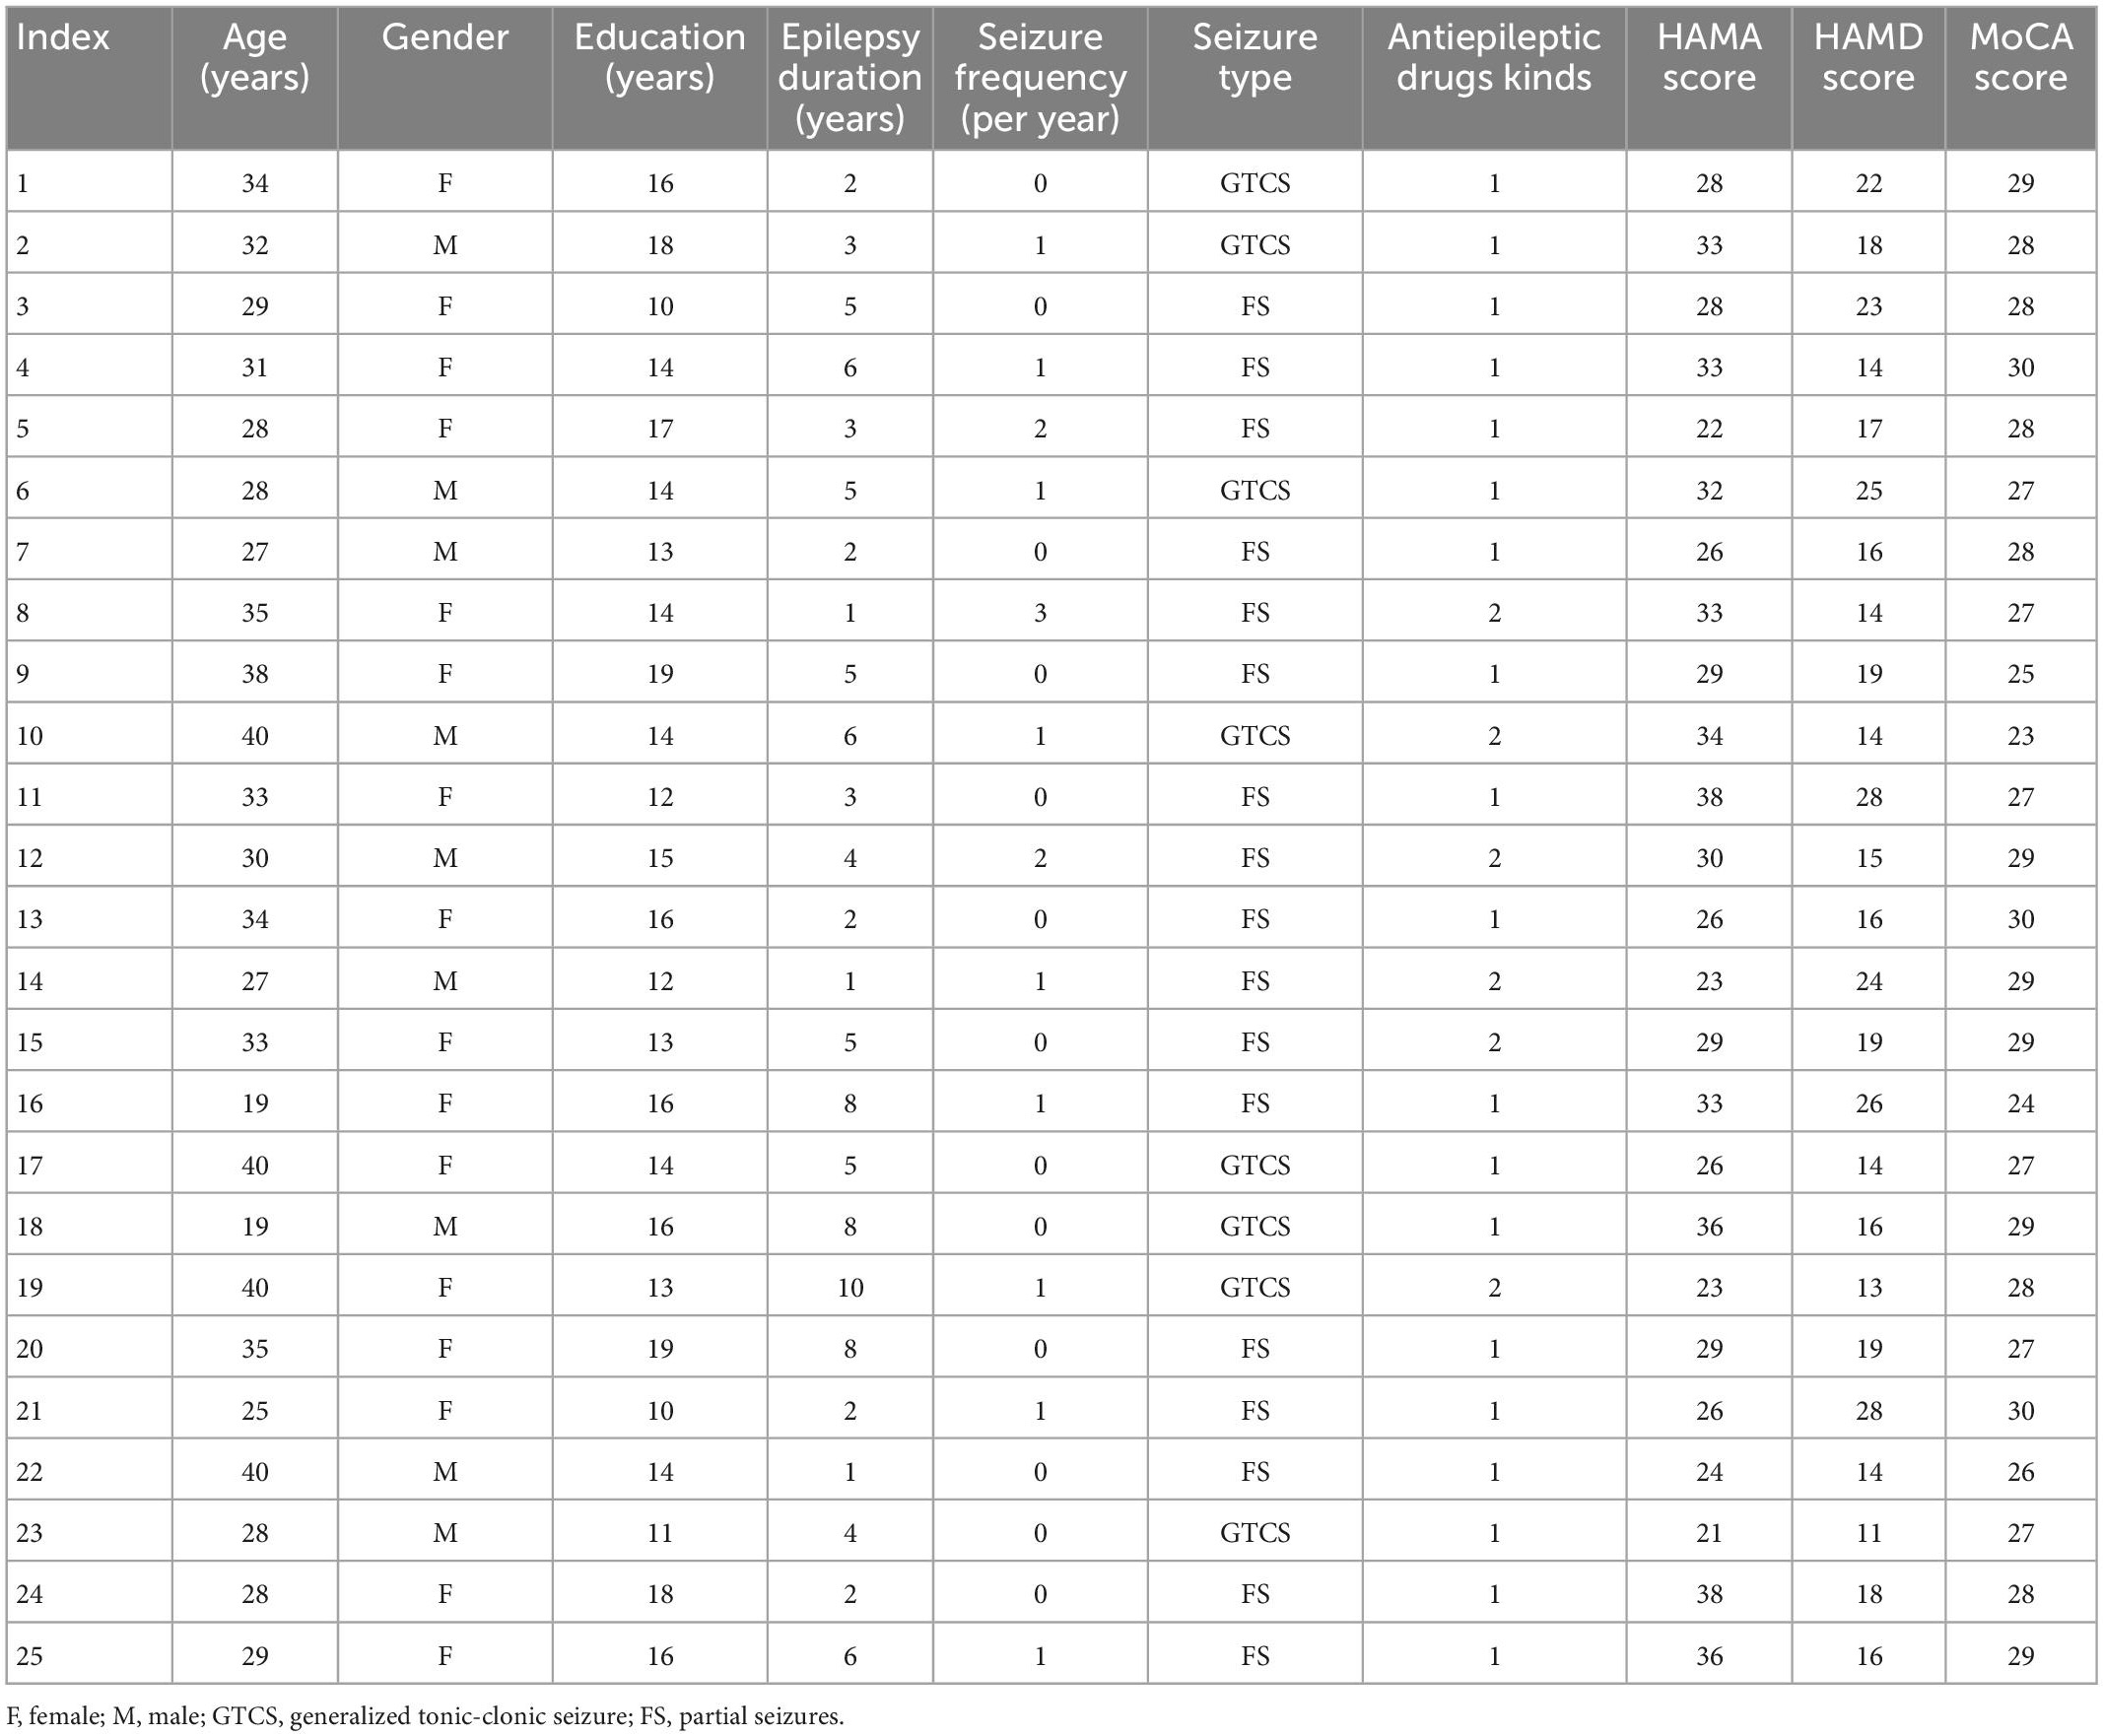
Table 1. Clinical information of non-lesional epilepsy (NLE) patients.
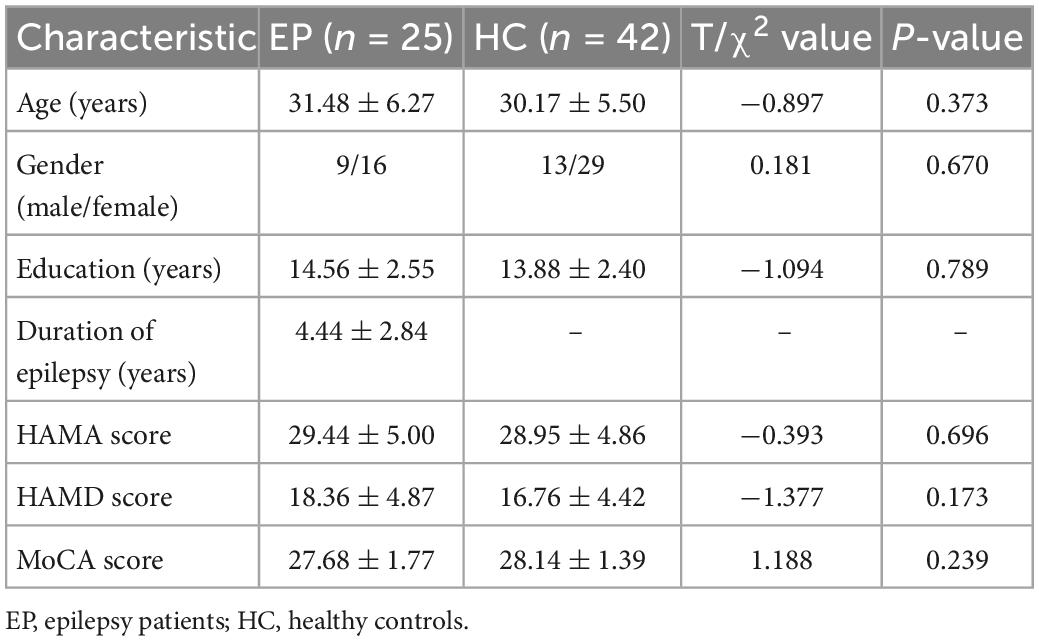
Table 2. Comparison of baseline data.
In our study, we found that the brain networks of both the epilepsy group and the healthy control group conformed to small-world properties. Within the threshold range, the AUC value of Eloc was significantly lower in the epilepsy group (P < 0.05); whereas the AUC values of global indicators such as Eglob, Cp, Lp, γ, λ, and σ were not statistically different between the two groups (P > 0.05) (Table 3).
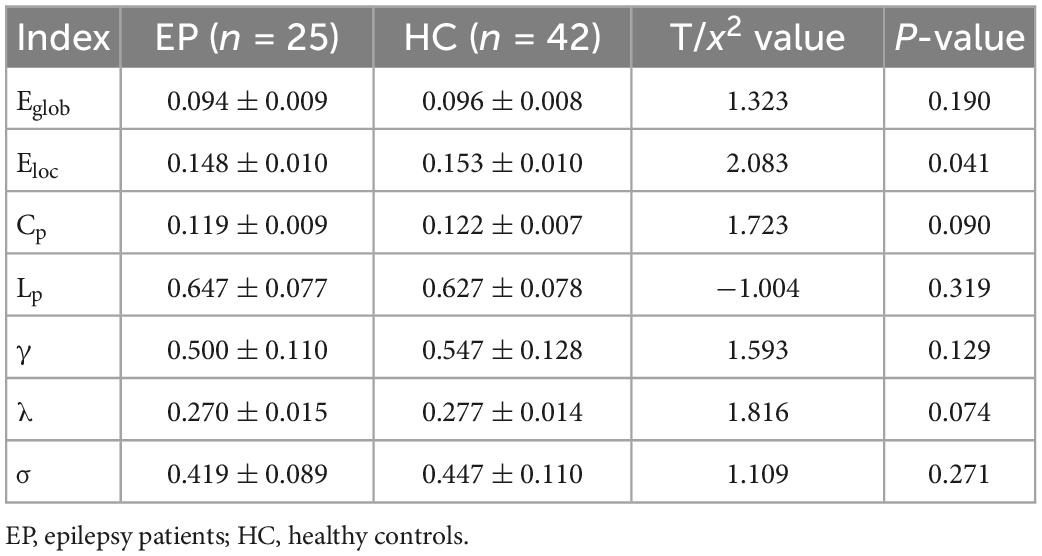
Table 3. Comparison of the area under the curve (AUC) values of the global indexes.
The epileptic group showed enhanced functional connectivity between the right orbital superior frontal gyrus and left medial superior frontal gyrus, left medial superior frontal gyrus and right angular gyrus, right superior parietal gyrus and paracentral lobule, and left lingual gyrus and thalamus in comparison with healthy controls (P < 0.05) (Table 4 and Figures 2, 3).
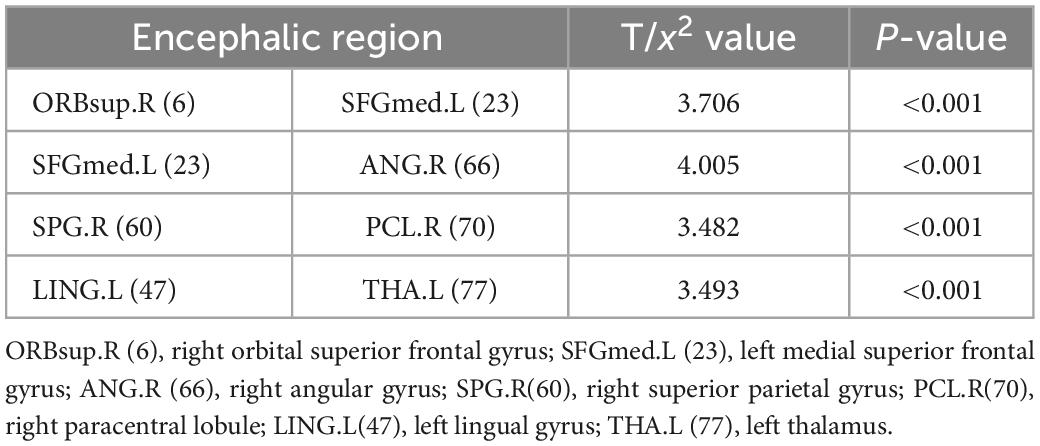
Table 4. Group differences in whole-brain functional connectivity.
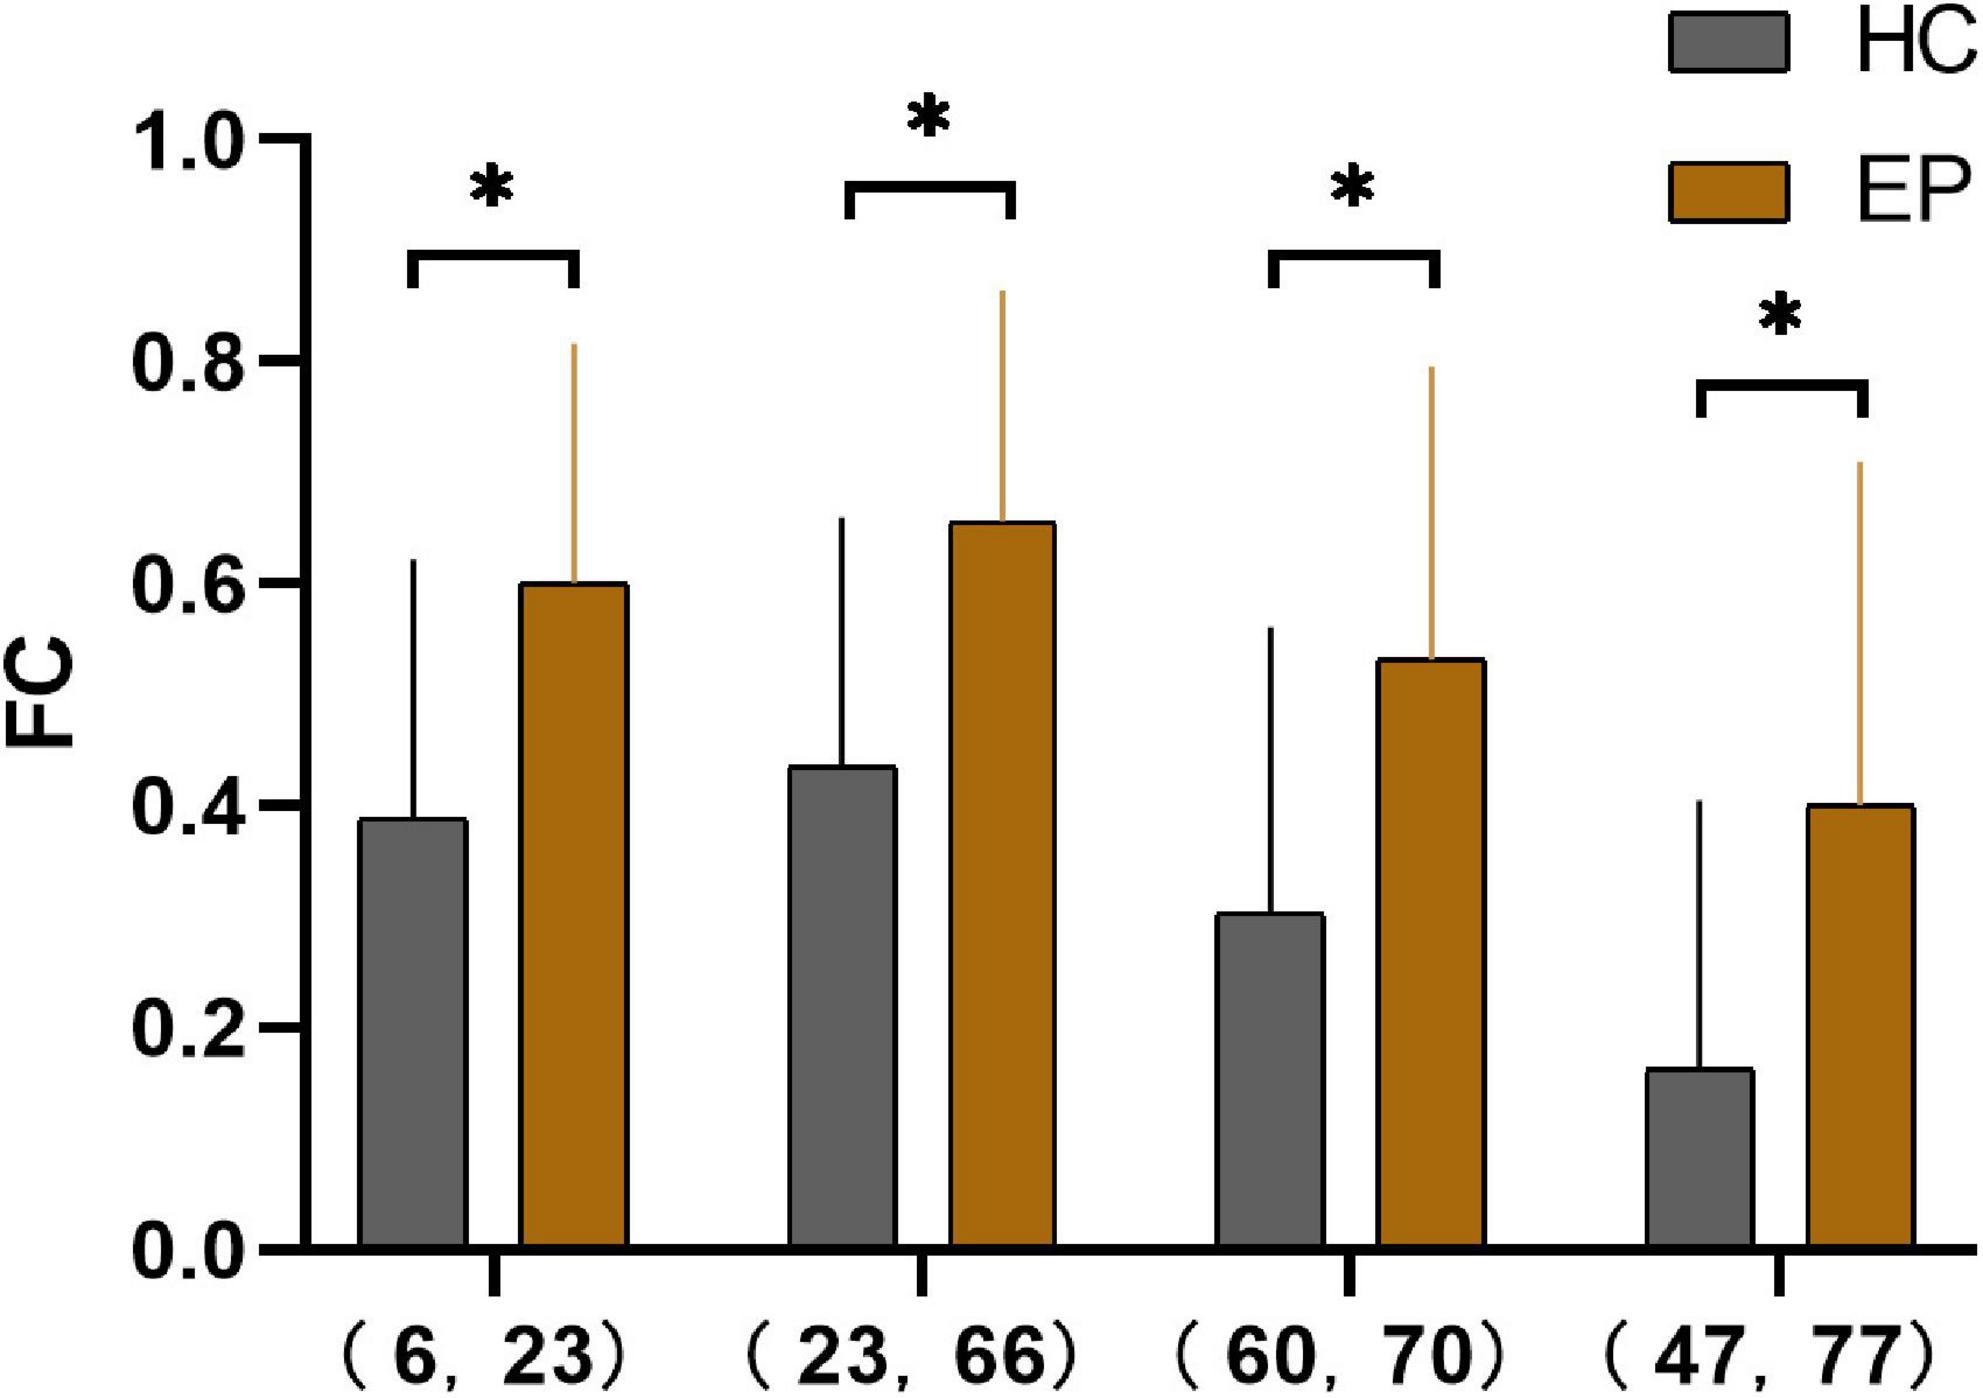
Figure 2. Pearson’s correlation coefficients for four pairs of differential brain regions in the epilepsy group and the healthy control group after Fisher’s Z-transformation *(P < 0.001). 6, right orbital superior frontal gyrus; 23, left medial superior frontal gyrus; 66, right angular gyrus; 60, right superior parietal gyrus; 70, right paracentral lobule; 47, left lingual gyrus; 77, left thalamus; HC, healthy controls; EP, epilepsy patients; FC, functional connectivity.
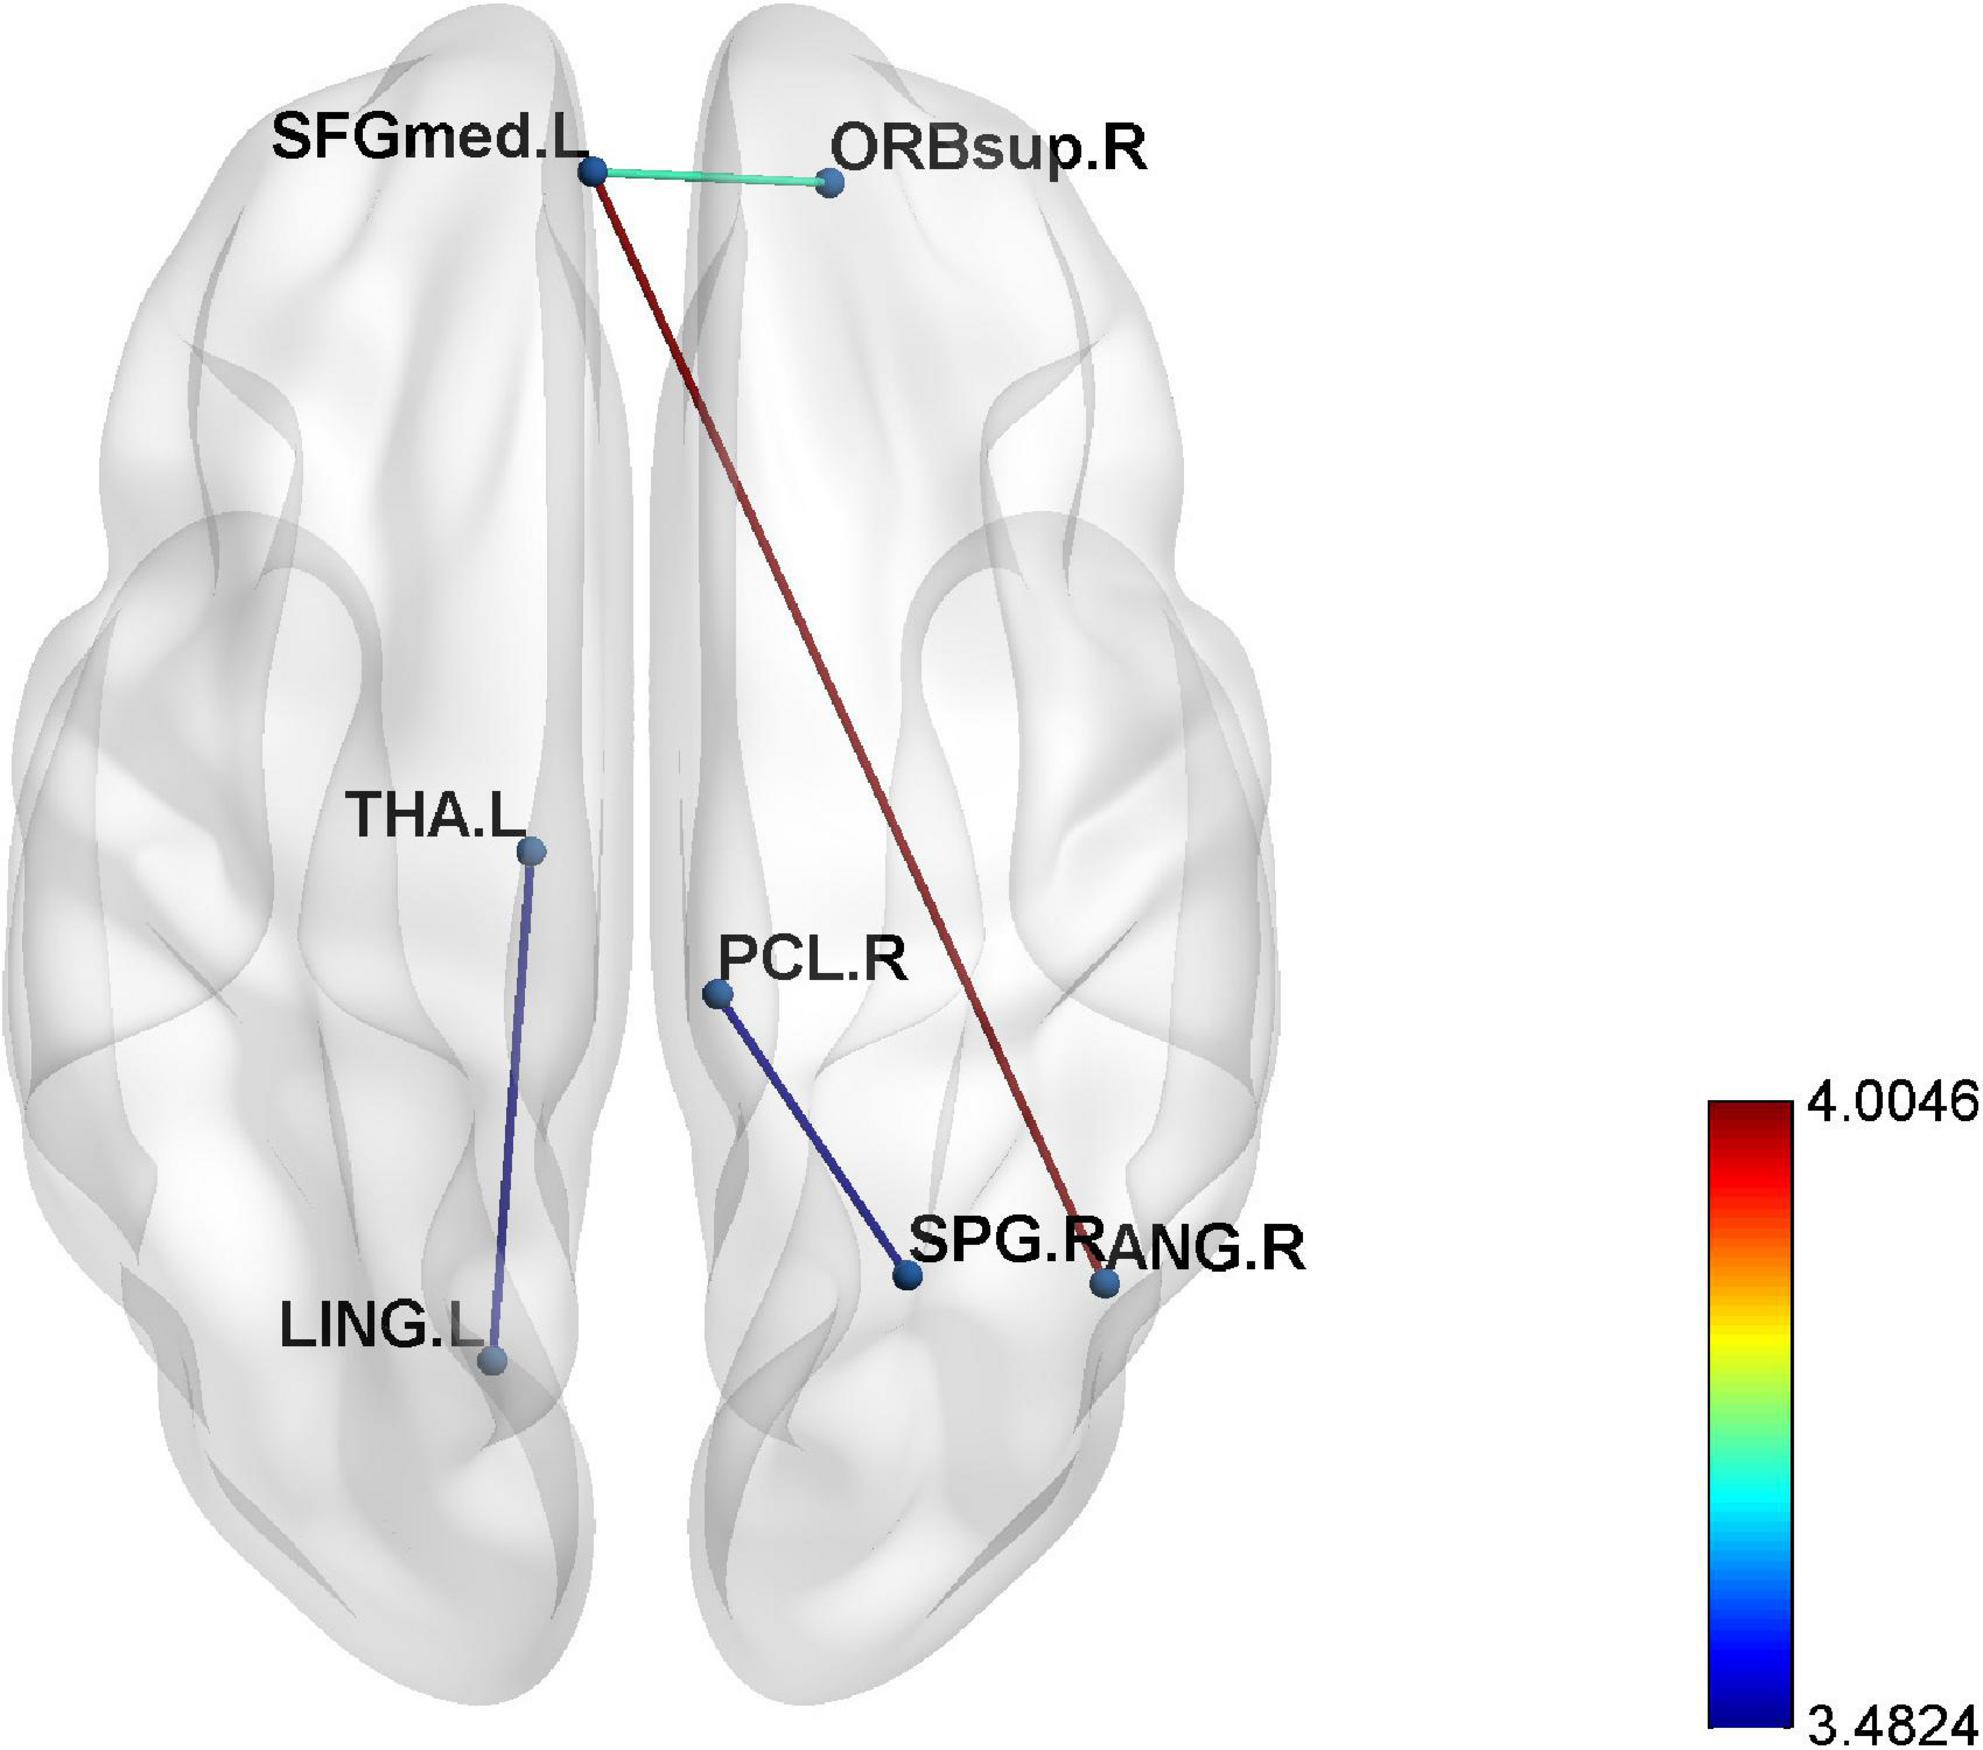
Figure 3. The enhanced four edges connecting seven different regions in epilepsy patients compared to healthy controls (p < 0.001).
In this study, FNC between the anterior default network and left frontoparietal network (aDMN-LFPN), anterior default network and right frontoparietal network (aDMN-RFPN), posterior default network and ventral attention network (pDMN-VAN), right frontoparietal network and projection network (RFPN-SN), dorsal attention network and sensorimotor network (DAN-SMN), and dorsal attention network and auditory network (DAN-AN) were significantly enhanced in NLE patients (P < 0.05) (Figures 4, 5).
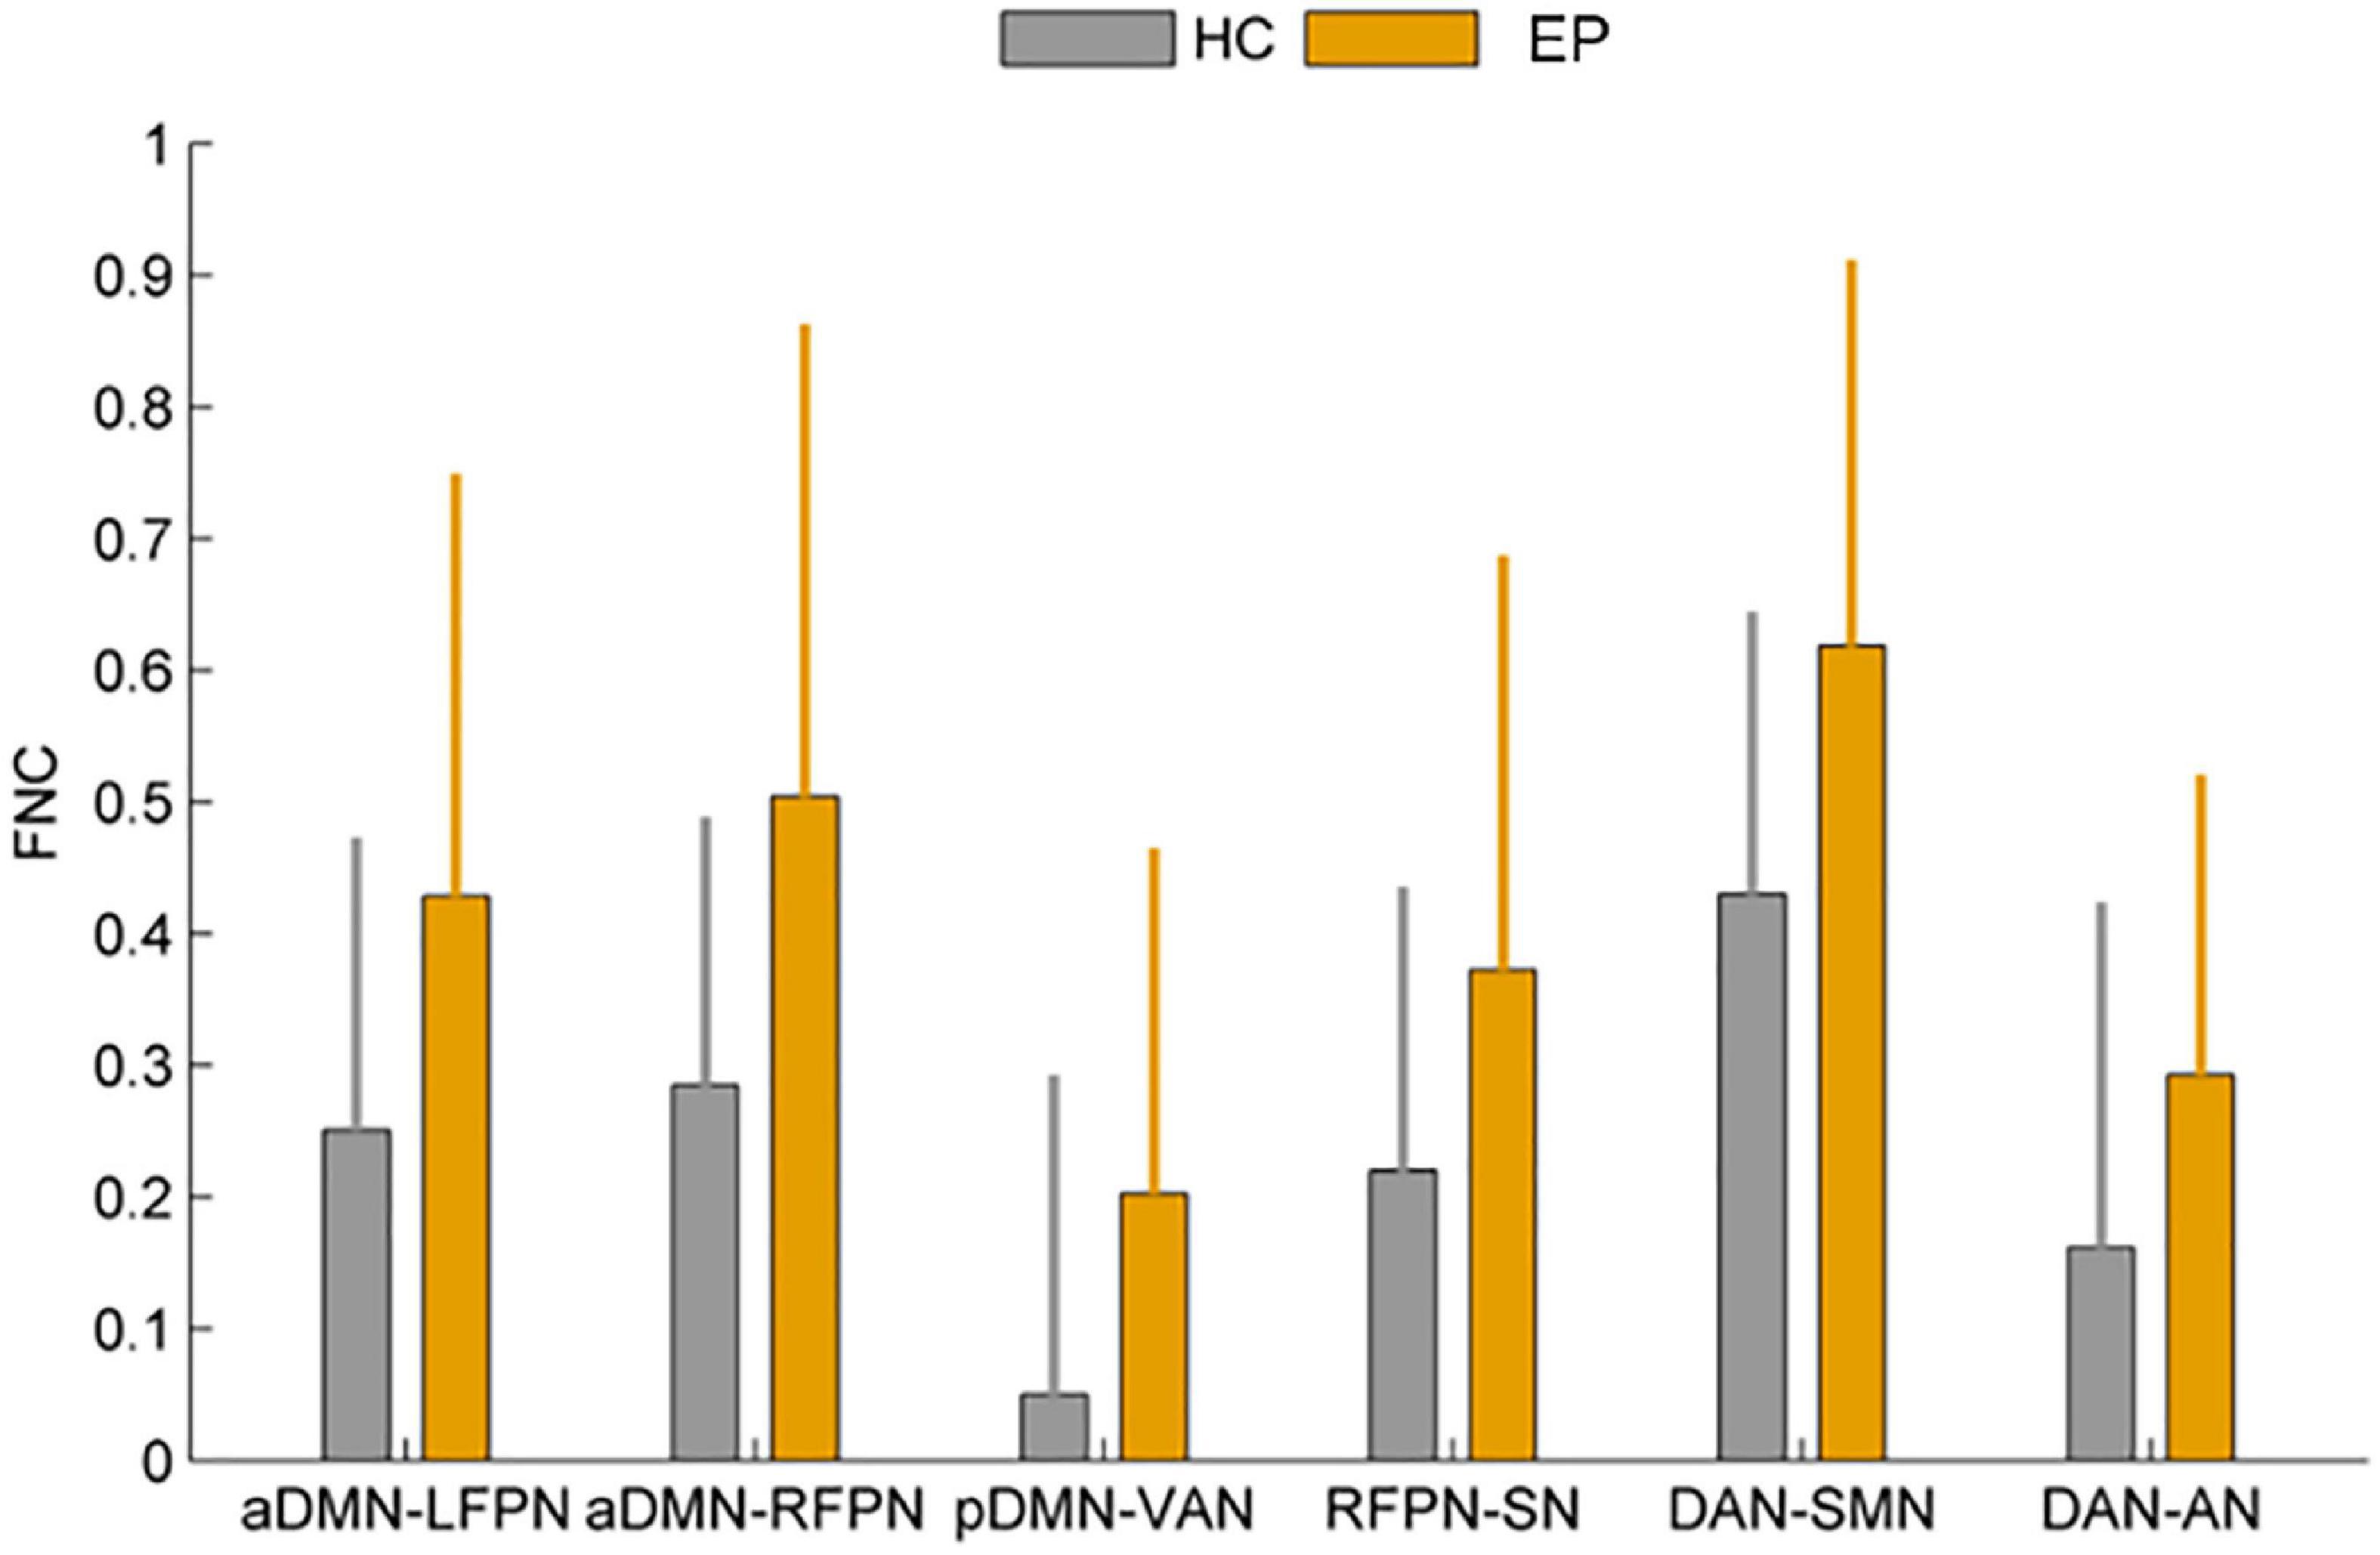
Figure 4. Comparison of functional network connectivity between the epilepsy group and healthy controls (P < 0.05). HC, healthy controls; EP, epilepsy patients.
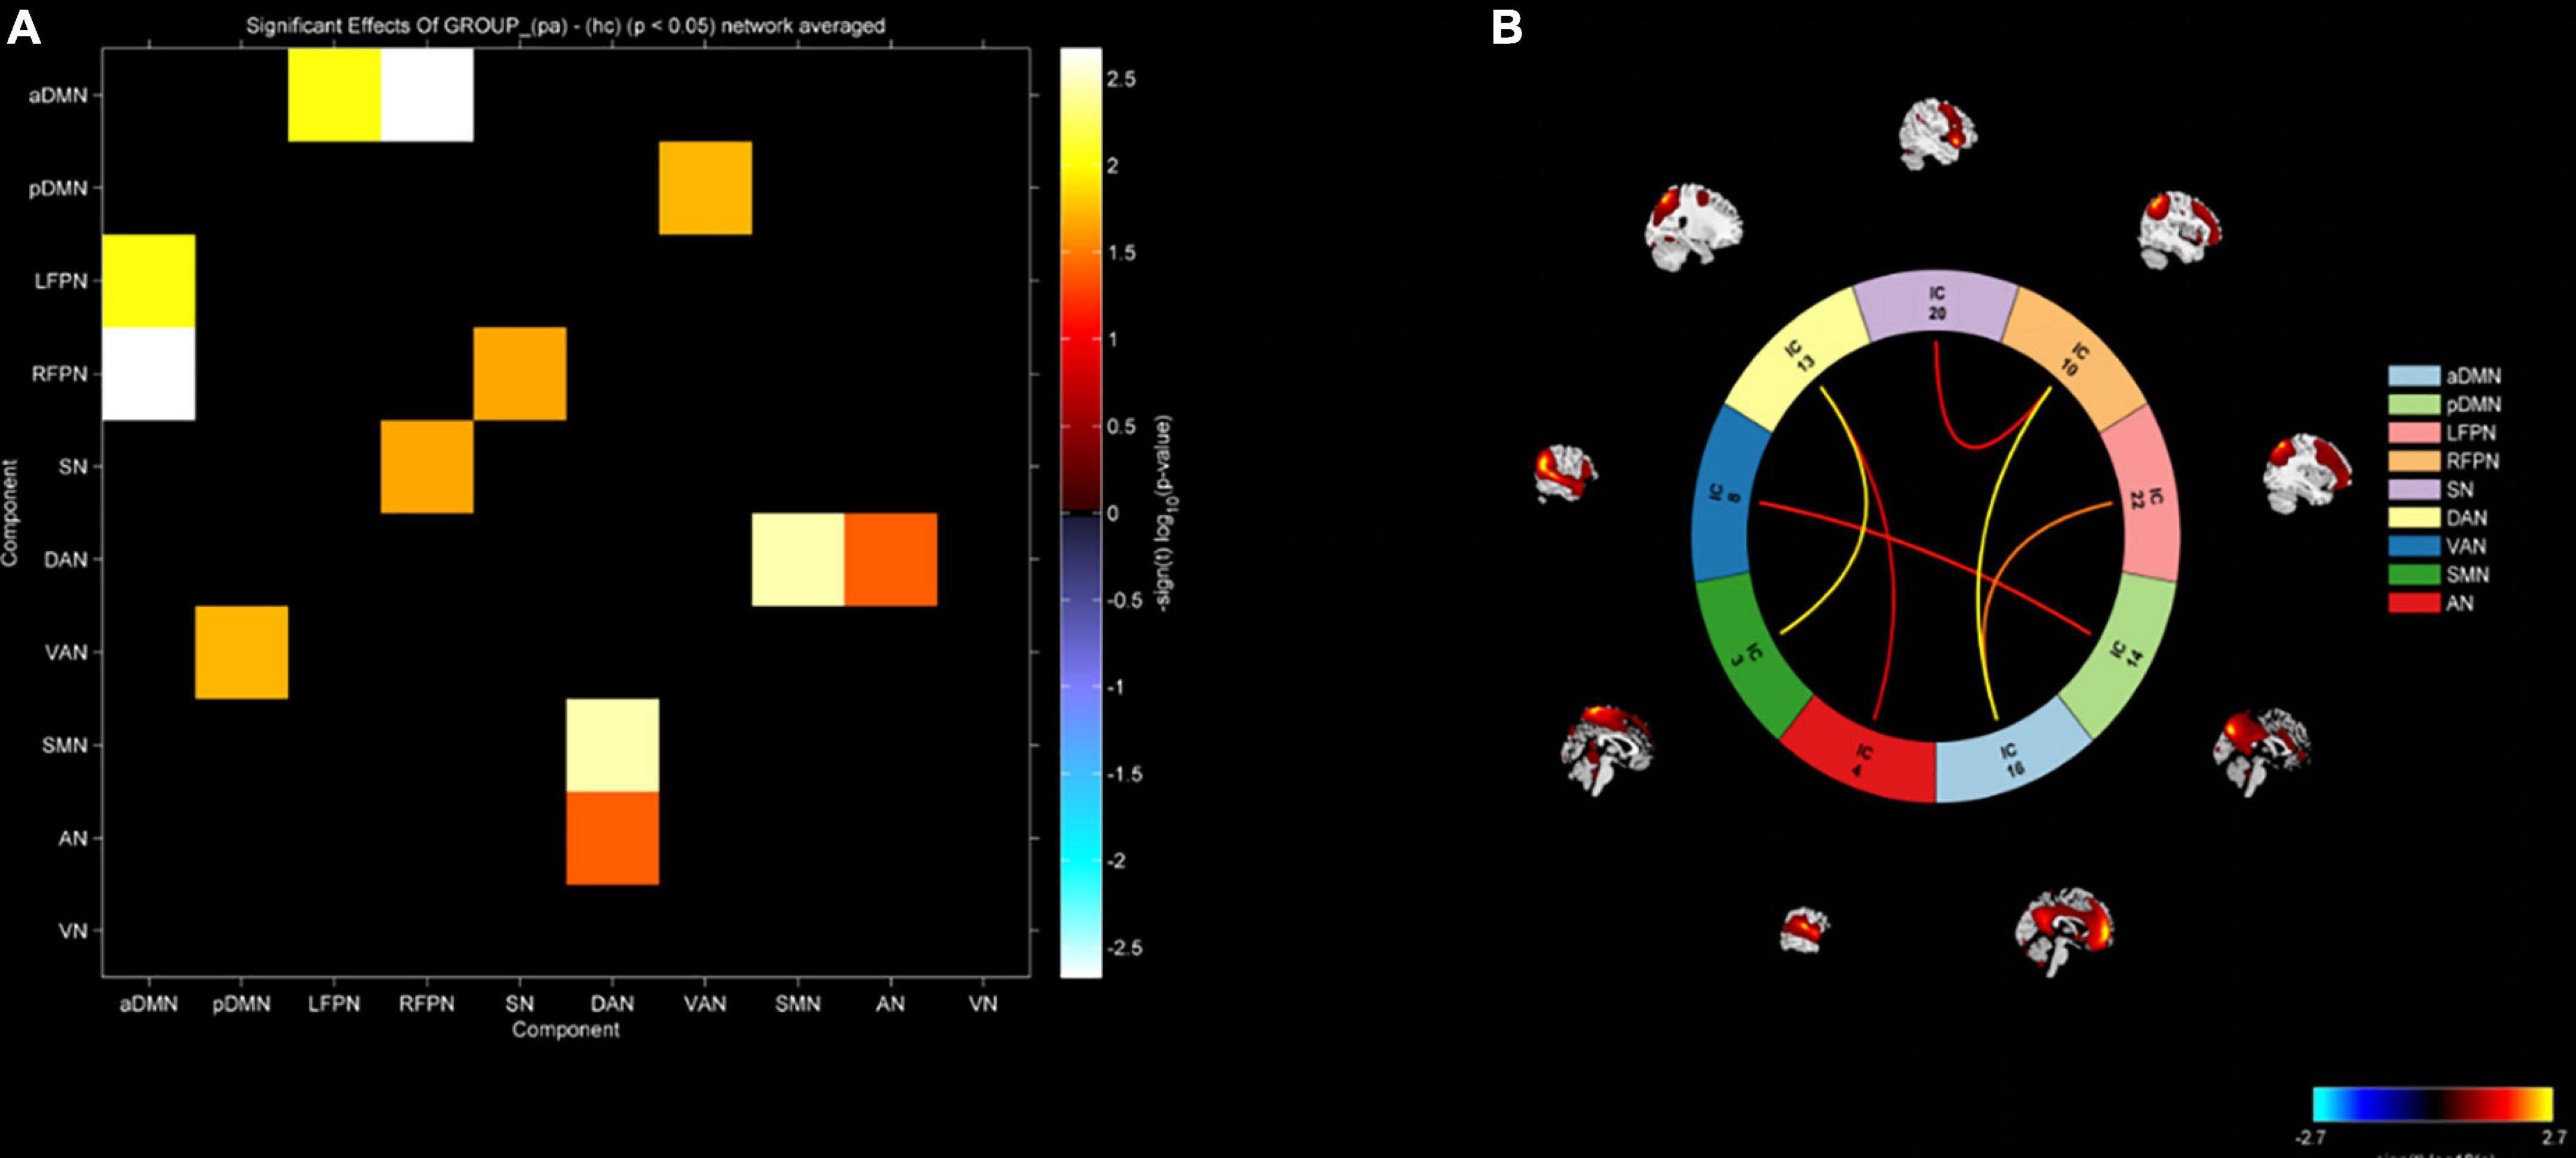
Figure 5. (A) Functional network connectivity matrix diagram. (B) Functional network connectivity circular graph. Increased functional connectivity between aDMN-LFPN, aDMN-RFPN, pDMN-VAN, RFPN-SN, DAN-SMN, and DAN-AN in the epilepsy group.
Due to the lack of clear lesions in routine imaging examinations, the origin of epileptic discharges in the brain of NLE patients cannot be accurately determined, causing certain difficulties for clinical diagnosis and treatment. This study investigated alternations in neural networks by detecting changes in blood oxygen levels in brain tissue in response to neuronal activity based on the principle of BOLD imaging. Through GTA and ICA, two common methods for studying brain networks (Xiao et al., 2019; Sendi et al., 2020; Liu et al., 2021), we explored alternations in topological properties and functional connectivity of brain networks in epilepsy patients.
Our study showed that the brain network of NLE patients still conforms to the “small world” properties, which is an economical and efficient mode of brain network operation, reflecting the brain’s ability to separate and integrate information. The larger the σ value of the indicator, the better the ability to separate and integrate information. In our study, the AUC values of the “small world” indices such as γ, λ, and σ were not statistically different between the NLE patients and HC group. Reasons for this result may be related to the sample size and the age of enrolled patients. Our study found that the Eloc in NLE patients was significantly lower than that of HC group, which was in line with the results of most previous studies (Song et al., 2015; Ji et al., 2017; Lee et al., 2020). Eloc reflects the ability of local brain regions to exchange information. Due to the long-term abnormal discharging activity of neurons in NLE patients, neurons in the corresponding area are prone to hypoxia, edema, and necrosis, which eventually lead to brain tissues damage and a corresponding reduction in functional connectivity with adjacent brain regions, resulting in a significant decrease in Eloc. The Eglob, Cp and Lp had no statistical difference between two groups. Eglob reflects the information exchange and integration capabilities of the whole brain, which represents the work efficiency of the entire brain tissue. Cp reflects how closely one node is connected to other nodes in the brain. Lp identifies the optimal and shortest information transfer distance from one node to another. All the global indicators represents the efficiency and ability of information transmission in brain tissue. Bernhardt et al. (2013) prompted that the Cp and Lp were remarkably increased compared with healthy controls in adult temporal lobe epilepsy. In a comparative study of 25 cases of familial hereditary epilepsy and non-familial hereditary epilepsy, Bharath et al. (2016) found that the Cp of familial hereditary epilepsy patients decreased, the Lp increased, and the σ decreased. The reasons for the differences in topological properties varying in epilepsy patients are not yet clear. The sample size, age, type of epilepsy, and duration of disease of the enrolled patients may all contribute to the different study results. A study on a rat epilepsy model found that the ability to separate and integrate brain networks is related to the frequency of epileptic seizures, providing indirect evidence that differences in seizure frequency also contributed to the differences in findings (Christiaen et al., 2019). The NLE patients included in our study were relatively young (mean age 31.48 ± 6.27 years), had a short duration of disease (mean duration 4.44 ± 2.84 years) and had better seizure control (seizure frequency less than 1 seizure/year). The brain tissue damage in epileptic patients may be relatively mild, so the impact on the whole brain level was relatively small, and the changes of topological features may not be significant.
Previous researches suggested that epilepsy is a broad brain network disease, and long-term and repeated seizures can lead to alternations in the topological properties of the whole or local brain regions (Park et al., 2019; Tavakol et al., 2019). The neurological activities of the brain are often coordinated completion by multiple brain regions. Damaging to one certain brain region may lead to abnormal functions of other brain regions. Connected edge analysis obtains functional connectivity between brain regions by analyzing the correlation of time series of different brain regions (Zheng et al., 2012). In this study, we found that the functional connections between the right orbital superior frontal gyrus and left medial superior frontal gyrus, left medial superior frontal gyrus and right angular gyrus, right superior parietal gyrus and paracentral lobule, and left lingual gyrus, and thalamus were statistically enhanced than those in HC group. The orbital superior frontal gyrus, medial superior frontal gyrus, and angular gyrus are all important components of DMN. DMN belongs to the resting network, which is activated in the resting state and inhibited when the human brain is active (Buckner and DiNicola, 2019). Wei et al. (2015) found that the right frontal pole also had enhanced connectivity in the DMN of patients with idiopathic generalized epilepsy. Some scholars showed that the change of DMN may be the factor leading to the changes of memory, cognition and other functions in epilepsy patients (Lopes et al., 2014; McCormick et al., 2014). According to a study on atonic epilepsy, DMN dysfunction was the abnormal integration of anatomical structures in the DMN (Luo et al., 2011). As we know, when one brain region is damaged, other brain regions with similar functions may show compensatory activation or enhanced connectivity. The presence of enhanced connectivity of brain regions associated with the DMN in our study also suggested that the DMN is damaged in epileptic patients and that the alteration of core nodes is one of the pathological mechanisms of epileptogenesis (Wang et al., 2017). In this study, the connection between the lingual gyrus and thalamus was also enhanced in NLE patients. A meta-analysis of thalamic function (Barron et al., 2012) showed that thalamic nuclei are involved in the whole process of epilepsy onset and development, which indirectly proves that the thalamus may be an important node in the discharging and transmission of epilepsy.
In addition, we not only explored the functional alterations of a specific network node or brain region in NLE patients, but also investigated the FNC level by ICA. In our study, the FNC between aDMN and LFPN, aDMN and RFPN, pDMN and VAN were significantly enhanced in NLE patients. As mentioned above, DMN is one of the most prominent brain network in the resting state, and its alteration leads to disruption of information exchange and integration functions in the resting brain. LFPN and RFPN are mainly related to attention, memory, language, and other functions. Therefore, the abnormal functional connection between DMN and FPN may be one of the reasons for the decline of memory and language functions in epilepsy patients. Wei et al. (2015) found that the functional connectivity between aDMN and LFPN, aDMN and RFPN, pDMN and RFPN were all enhanced in idiopathic generalized epilepsy patients. In addition, the findings in Bonilha’s research were basically consistent with our above results (Bonilha et al., 2013). However, Zhang et al. (2010a) discovered that the functional connectivity between DMN and other brain regions was significantly reduced in the medial temporal lobe epilepsy patients with hippocampal sclerosis. The authors believed that one of the reasons for the differences may be related to the epileptic seizure type. All epileptic patients in our study had no lesions and a short course of epilepsy, while the patients in Zhang et al.’s (2010a) study all had definite manifestations of hippocampal sclerosis and a long course of epilepsy. A study about generalized idiopathic epilepsy also showed that DMN connectivity strength was associated with onset age and seizure duration (Vaessen et al., 2012). Moreover, we also found that the FNC between DAN and SMN, DAN and AN in the NLE patients were also highly enhanced. As an advanced functional network of the human brain, DAN is mainly involved in the control and regulation of attention. Previous studies have shown that DAN is a goal-task-oriented network of brain (Jimenez et al., 2016). SMN and AN are the “sensors” of the human brain, transmitting information and supervising our response to external stimuli, which functionally forming a good cluster with DAN. Liang et al. (2021) found mesial temporal lobe epilepsy patients within 5 years of onset also had enhanced functional network connectivity between DAN and SMN, and between DAN and AN. This scholar showed that abnormal enhanced functional connectivity may suggest reduced efficiency between brain networks in patients with epilepsy. Therefore, combined with the fact that our enrolled epileptic patients have not yet shown significant neuropsychiatric and cognitive abnormalities, we believe that the enhanced functional connectivity between different brain networks not only reflects their close functional connection, but also is a compensatory response to the patient’s existing brain function.
Our study still had shortcomings. First of all, the sample size was insufficient and the age of the patients enrolled was young, so there may be some bias in the study results. In addition, the types of epilepsy were not classified in this study, so we still need to subdivide the types of epilepsy in the future work.
In conclusion, the topological characteristics and functional connectivity of brain networks are changed in epileptic patients. The abnormal functional connectivity may suggest reduced efficiency between brain networks in epileptic patients and also may be a compensatory response to brain function early in the disease.
The original contributions presented in this study are included in the article/supplementary material, further inquiries can be directed to the corresponding author.
The studies involving human participants were reviewed and approved by the Ethics Committee of Suzhou Hospital Affiliated to Nanjing Medical University. The patients/participants provided their written informed consent to participate in this study.
ZL and XH were responsible for data collection and analysis, consulting literature, and article writing. YL and JZ were responsible for post-processing of imaging data. HZ, MW, BX, QS, QG, GW, MS, WZ, QX, XD, and QC were responsible for sorting out clinical data and data collection. HF was responsible for project design, data analysis, and article writing. All authors contributed to the article and approved the submitted version.
We really appreciate the support from the Suzhou Science and Technology Prosperity Youth Science and Technology Project (Grant no. KJXW2019029), the CAAE Epilepsy Research fund-UCB (Grant no. 2020004B), and the Suzhou Science and Technology development Plan Project (Grant no. SKJYD2021223).
The authors declare that the research was conducted in the absence of any commercial or financial relationships that could be construed as a potential conflict of interest.
All claims expressed in this article are solely those of the authors and do not necessarily represent those of their affiliated organizations, or those of the publisher, the editors and the reviewers. Any product that may be evaluated in this article, or claim that may be made by its manufacturer, is not guaranteed or endorsed by the publisher.
Barron, D., Fox, P., Laird, A., Robinson, J., and Fox, P. (2012). Thalamic medial dorsal nucleus atrophy in medial temporal lobe epilepsy: A VBM meta-analysis. Neuroimage Clin. 2, 25–32. doi: 10.1016/j.nicl.2012.11.004
Bernhardt, B., Hong, S., Bernasconi, A., and Bernasconi, N. (2013). Imaging structural and functional brain networks in temporal lobe epilepsy. Front. Hum. Neurosci. 7:624. doi: 10.3389/fnhum.2013.00624
Bharath, R., Chaitanya, G., Panda, R., Raghavendra, K., Sinha, S., Sahoo, A., et al. (2016). Reduced small world brain connectivity in probands with a family history of epilepsy. Eur. J. Neurol. 23, 1729–1737. doi: 10.1111/ene.13104
Bonilha, L., Helpern, J., Sainju, R., Nesland, T., Edwards, J., Glazier, S., et al. (2013). Presurgical connectome and postsurgical seizure control in temporal lobe epilepsy. Neurology 81, 1704–1710. doi: 10.1212/01.wnl.0000435306.95271.5f
Buckner, R., and DiNicola, L. (2019). The brain’s default network: Updated anatomy, physiology and evolving insights. Nat. Rev. Neurosci. 20, 593–608. doi: 10.1038/s41583-019-0212-7
Christiaen, E., Goossens, M., Raedt, R., Descamps, B., Larsen, L., Craey, E., et al. (2019). Alterations in the functional brain network in a rat model of epileptogenesis: A longitudinal resting state fMRI study. Neuroimage 202:116144. doi: 10.1016/j.neuroimage.2019.116144
Detre, J. (2006). Clinical applicability of functional MRI. J. Magn. Reson. Imaging 23, 808–815. doi: 10.1002/jmri.20585
Falco-Walter, J. (2020). Epilepsy-definition, classification, pathophysiology, and epidemiology. Semin. Neurol. 40, 617–623. doi: 10.1055/s-0040-1718719
Fisher, R. (2017). The new classification of seizures by the international league against epilepsy 2017. Curr. Neurol. Neurosci. Rep. 17:48. doi: 10.1007/s11910-017-0758-6
Fisher, R., Cross, J., French, J., Higurashi, N., Hirsch, E., Jansen, F., et al. (2017). Operational classification of seizure types by the international league against epilepsy: Position paper of the ILAE commission for classification and terminology. Epilepsia 58, 522–530. doi: 10.1111/epi.13670
Ji, G., Yu, Y., Miao, H., Wang, Z., Tang, Y., and Liao, W. (2017). Decreased network efficiency in benign epilepsy with centrotemporal spikes. Radiology 283, 186–194. doi: 10.1148/radiol.2016160422
Jimenez, A., Lee, J., Wynn, J., Cohen, M., Engel, S., Glahn, D., et al. (2016). Abnormal ventral and dorsal attention network activity during single and dual target detection in schizophrenia. Front. Psychol. 7:323. doi: 10.3389/fpsyg.2016.00323
Lee, D., Kim, B., Lee, H., Kim, S., and Park, K. (2020). Network characteristics of genetic generalized epilepsy: Are the syndromes distinct? Seizure 82, 91–98. doi: 10.1016/j.seizure.2020.09.022
Liang, X., Pang, X., Zhao, J., Yu, L., Wu, P., Li, X., et al. (2021). Altered static and dynamic functional network connectivity in temporal lobe epilepsy with different disease duration and their relationships with attention. J. Neurosci. Res. 99, 2688–2705. doi: 10.1002/jnr.24915
Liu, W., Lin, M., Yue, Q., Gong, Q., Zhou, D., and Wu, X. (2021). Brain functional connectivity patterns in focal cortical dysplasia related epilepsy. Seizure 87, 1–6. doi: 10.1016/j.seizure.2021.02.009
Lopes, R., Moeller, F., Besson, P., Ogez, F., Szurhaj, W., Leclerc, X., et al. (2014). Study on the relationships between intrinsic functional connectivity of the default mode network and transient epileptic activity. Front. Neurol. 5:201. doi: 10.3389/fneur.2014.00201
Luo, C., Li, Q., Lai, Y., Xia, Y., Qin, Y., Liao, W., et al. (2011). Altered functional connectivity in default mode network in absence epilepsy: A resting-state fMRI study. Hum. Brain Mapp. 32, 438–449. doi: 10.1002/hbm.21034
Lv, Z., Huang, D., Ye, W., Chen, Z., Huang, W., and Zheng, J. (2014). Alteration of functional connectivity within visuospatial working memory-related brain network in patients with right temporal lobe epilepsy: A resting-state fMRI study. Epilepsy Behav. 35, 64–71. doi: 10.1016/j.yebeh.2014.04.001
McCormick, C., Protzner, A., Barnett, A., Cohn, M., Valiante, T., and McAndrews, M. (2014). Linking DMN connectivity to episodic memory capacity: What can we learn from patients with medial temporal lobe damage? Neuroimage Clin. 5, 188–196. doi: 10.1016/j.nicl.2014.05.008
Park, K., Lee, B., Shin, K., Ha, S., Park, J., Kim, S., et al. (2019). Pivotal role of subcortical structures as a network hub in focal epilepsy: Evidence from graph theoretical analysis based on diffusion-tensor imaging. J. Clin. Neurol. 15, 68–76. doi: 10.3988/jcn.2019.15.1.68
Sendi, M., Zendehrouh, E., Miller, R., Fu, Z., Du, Y., Liu, J., et al. (2020). Alzheimer’s disease projection from normal to mild dementia reflected in functional network connectivity: A longitudinal study. Front. Neural Circuits 14:593263. doi: 10.3389/fncir.2020.593263
Song, J., Nair, V., Gaggl, W., and Prabhakaran, V. (2015). Disrupted brain functional organization in epilepsy revealed by graph theory analysis. Brain Connect. 5, 276–283. doi: 10.1089/brain.2014.0308
Songjiang, L., Tijiang, Z., Heng, L., Wenjing, Z., Bo, T., Ganjun, S., et al. (2021). Impact of brain functional network properties on intelligence in children and adolescents with focal epilepsy: A resting-state MRI study. Acad. Radiol. 28, 225–232. doi: 10.1016/j.acra.2020.01.004
Tavakol, S., Royer, J., Lowe, A., Bonilha, L., Tracy, J., Jackson, G., et al. (2019). Neuroimaging and connectomics of drug-resistant epilepsy at multiple scales: From focal lesions to macroscale networks. Epilepsia 60, 593–604. doi: 10.1111/epi.14688
Vaessen, M., Jansen, J., Vlooswijk, M., Hofman, P., Majoie, H., Aldenkamp, A., et al. (2012). White matter network abnormalities are associated with cognitive decline in chronic epilepsy. Cereb. Cortex 22, 2139–2147. doi: 10.1093/cercor/bhr298
Wang, J., Wang, X., Xia, M., Liao, X., Evans, A., and He, Y. (2015). Gretna: A graph theoretical network analysis toolbox for imaging connectomics. Front. Hum. Neurosci. 9:386. doi: 10.3389/fnhum.2015.00386
Wang, X., Jiao, D., Zhang, X., and Lin, X. (2017). Altered degree centrality in childhood absence epilepsy: A resting-state fMRI study. J. Neurol. Sci. 373, 274–279. doi: 10.1016/j.jns.2016.12.054
Watts, D., and Strogatz, S. (1998). Collective dynamics of ‘small-world’ networks. Nature 393, 440–442. doi: 10.1038/30918
Wei, H., An, J., Zeng, L., Shen, H., Qiu, S., and Hu, D. (2015). Altered functional connectivity among default, attention, and control networks in idiopathic generalized epilepsy. Epilepsy Behav. 46, 118–125. doi: 10.1016/j.yebeh.2015.03.031
Xiao, F., Lu, C., Zhao, D., Zou, Q., Xu, L., Li, J., et al. (2019). Independent component analysis and graph theoretical analysis in patients with narcolepsy. Neurosci. Bull. 35, 743–755. doi: 10.1007/s12264-018-0307-6
Zhang, R., Wu, T., Wang, Y., Liu, H., Zou, Y., Liu, W., et al. (2011). Interictal magnetoencephalographic findings related with surgical outcomes in lesional and nonlesional neocortical epilepsy. Seizure 20, 692–700. doi: 10.1016/j.seizure.2011.06.021
Zhang, Z., Lu, G., Zhong, Y., Tan, Q., Liao, W., Wang, Z., et al. (2010b). Altered spontaneous neuronal activity of the default-mode network in mesial temporal lobe epilepsy. Brain Res. 1323, 152–160. doi: 10.1016/j.brainres.2010.01.042
Zhang, Z., Lu, G., Zhong, Y., Tan, Q., Chen, H., Liao, W., et al. (2010a). fMRI study of mesial temporal lobe epilepsy using amplitude of low-frequency fluctuation analysis. Hum. Brain Mapp. 31, 1851–1861. doi: 10.1002/hbm.20982
Keywords: epilepsy, BOLD-fMRI, graph theory analysis, independent component analysis, brain network
Citation: Li Z, Hou X, Lu Y, Zhao H, Wang M, Xu B, Shi Q, Gui Q, Wu G, Shen M, Zhu W, Xu Q, Dong X, Cheng Q, Zhang J and Feng H (2023) Study of brain network alternations in non-lesional epilepsy patients by BOLD-fMRI. Front. Neurosci. 16:1031163. doi: 10.3389/fnins.2022.1031163
Received: 29 August 2022; Accepted: 30 December 2022;
Published: 18 January 2023.
Edited by:
Rajesh Nandy, The University of North Texas Health Science Center, United StatesReviewed by:
Yanlu Wang, Karolinska Institutet (KI), SwedenCopyright © 2023 Li, Hou, Lu, Zhao, Wang, Xu, Shi, Gui, Wu, Shen, Zhu, Xu, Dong, Cheng, Zhang and Feng. This is an open-access article distributed under the terms of the Creative Commons Attribution License (CC BY). The use, distribution or reproduction in other forums is permitted, provided the original author(s) and the copyright owner(s) are credited and that the original publication in this journal is cited, in accordance with accepted academic practice. No use, distribution or reproduction is permitted which does not comply with these terms.
*Correspondence: Hongxuan Feng,  ZmVuZ2hvbmd4dWFuMTk4NkAxNjMuY29t
†These authors have contributed equally to this work and share first authorship
Disclaimer: All claims expressed in this article are solely those of the authors and do not necessarily represent those of their affiliated organizations, or those of the publisher, the editors and the reviewers. Any product that may be evaluated in this article or claim that may be made by its manufacturer is not guaranteed or endorsed by the publisher.
Research integrity at Frontiers
Learn more about the work of our research integrity team to safeguard the quality of each article we publish.