
94% of researchers rate our articles as excellent or good
Learn more about the work of our research integrity team to safeguard the quality of each article we publish.
Find out more
ORIGINAL RESEARCH article
Front. Neurosci. , 01 December 2021
Sec. Brain Imaging Methods
Volume 15 - 2021 | https://doi.org/10.3389/fnins.2021.782516
This article is part of the Research Topic Advanced Imaging and Mapping in Brain Tumors View all 49 articles
 Daniel Paech1*†
 Sebastian Regnery2,3†Tanja Platt4Nicolas G. R. Behl4,5
 Nina Weckesser1Paul Windisch2Katerina Deike-Hofmann1
 Wolfgang Wick6
 Martin Bendszus7
 Stefan Rieken2,3
 Laila König2,3Mark E. Ladd4,8Heinz-Peter Schlemmer1Jürgen Debus2,3
 Sebastian Adeberg2,3
The purpose of this work was to prospectively investigate sodium (23Na) MRI at 7 Tesla (T) as predictor of therapy response and survival in patients with glioblastoma (GBM). Thus, 20 GBM patients underwent 23Na MRI at 7T before, immediately after and 6 weeks after chemoradiotherapy (CRT). The median tissue sodium concentration (TSC) inside the whole tumor excluding necrosis was determined. Initial response to CRT was assessed employing the updated response assessment in neuro-oncology working group (RANO) criteria. Clinical parameters, baseline TSC and longitudinal TSC differences were compared between patients with initial progressive disease (PD) and patients with initial stable disease (SD) using Fisher’s exact tests and Mann-Whitney-U-tests. Univariate proportional hazard models for progression free survival (PFS) and overall survival (OS) were calculated using clinical parameters and TSC metrics as predictor variables. The analyses demonstrated that TSC developed heterogeneously over all patients following CRT. None of the TSC metrics differed significantly between cases of initial SD and initial PD. Furthermore, TSC metrics did not yield a significant association with PFS or OS. Conversely, the initial response according to the RANO criteria could significantly predict PFS [univariate HR (95%CI) = 0.02 (0.0001–0.21), p < 0.001] and OS [univariate HR = 0.17 (0.04–0.65), p = 0.005]. In conclusion, TSC showed treatment-related changes in GBM following CRT, but did not significantly correlate with the initial response according to the RANO criteria, PFS or OS. In contrast, the initial response according to the RANO criteria was a significant predictor of PFS and OS. Future investigations need to elucidate the reasons for treatment-related changes in TSC and their clinical value for response prediction in glioblastoma patients receiving CRT.
The overall prognosis of glioblastoma (GBM) remains poor despite gross tumor resection followed by chemoradiotherapy (CRT), but long-term survival can be achieved in a small subgroup of patients (Stupp et al., 2005, 2009). In this context, the early identification of tumor relapse remains a major challenge. Current assessment of response to therapy is based on the updated response assessment in neuro-oncology working group (RANO) criteria, which classify clinical follow-up MRI (Wen et al., 2010; Johnson et al., 2019). This approach suffers essential limitations due to the incidence of pseudo-progressions (PsPD) especially shortly after treatment (de Wit et al., 2004; Wen et al., 2010). Repeated imaging studies are necessary to rule out PsPD (Wen et al., 2010; Johnson et al., 2019), which impedes early identification of tumor relapse and delays potential 2nd-line therapies as part of personalized treatment approaches. Consequently, imaging techniques that enable an early or even real-time response assessment to guide therapy protocols are highly desirable.
Sodium (23Na) MRI has been used within animal experiments (Schepkin et al., 2005, 2006) and mostly case reports (Thulborn et al., 2009; Laymon et al., 2012; Haneder et al., 2015) to monitor treatment associated changes in GBM consecutive to CRT. Here, 23Na MRI demonstrated promising features as it seems to offer complementary information to routine imaging modalities (Laymon et al., 2012; Haneder et al., 2015; Regnery and Platt, 2021). Quite recently, an investigation of 23Na MRI at 3 Tesla (T) in GBM patients suggested that the development of tissue sodium concentration (TSC) during CRT might reflect tumor cell kill (Thulborn et al., 2019). Thus, 23Na MRI is a promising functional imaging technique in neuro-oncology (Regnery and Platt, 2021). However, 23Na MRI is limited by a comparatively low signal-to-noise ratio (SNR) because 23Na-ions are far less abundant than the protons used for conventional MRI techniques (Shah et al., 2016). Here, the advent of ultra-high field (UHF) MRI techniques opens new perspectives in 23Na imaging by providing increased SNR (Konstandin and Schad, 2014; Shah et al., 2016). This longitudinal prospective study employed a 7T MRI scanner to investigate the development of TSC in 20 GBM patients following CRT. Based on previous reports, we explored the capacity of TSC to reflect therapy response and therefore predict progression free survival (PFS) as well as overall survival (OS).
20 GBM patients prospectively underwent 23Na imaging on a 7 Tesla MRI system before (t0), immediately after (t1) and 6 weeks after (t2) (C)RT. Inclusion criteria were an age ≥ 18 years, histological proof of GBM, residual disease on clinical imaging after potential tumor resection, currently planned (C)RT and the absence of ferromagnetic or active implants unsuitable for 7 T. Ten patients (50%) received gross tumor resection before imaging and (C)RT. Eleven patients (55%) presented with newly diagnosed GBM and received CRT according to Stupp et al. (2005) or CRT modified to elderly age and decreased clinical performance according to Perry et al. (2017). Moreover, nine patients (45%) presented with recurrent GBM and received particle RT with or without systemic treatment. Detailed patient characteristics are shown in Table 1.
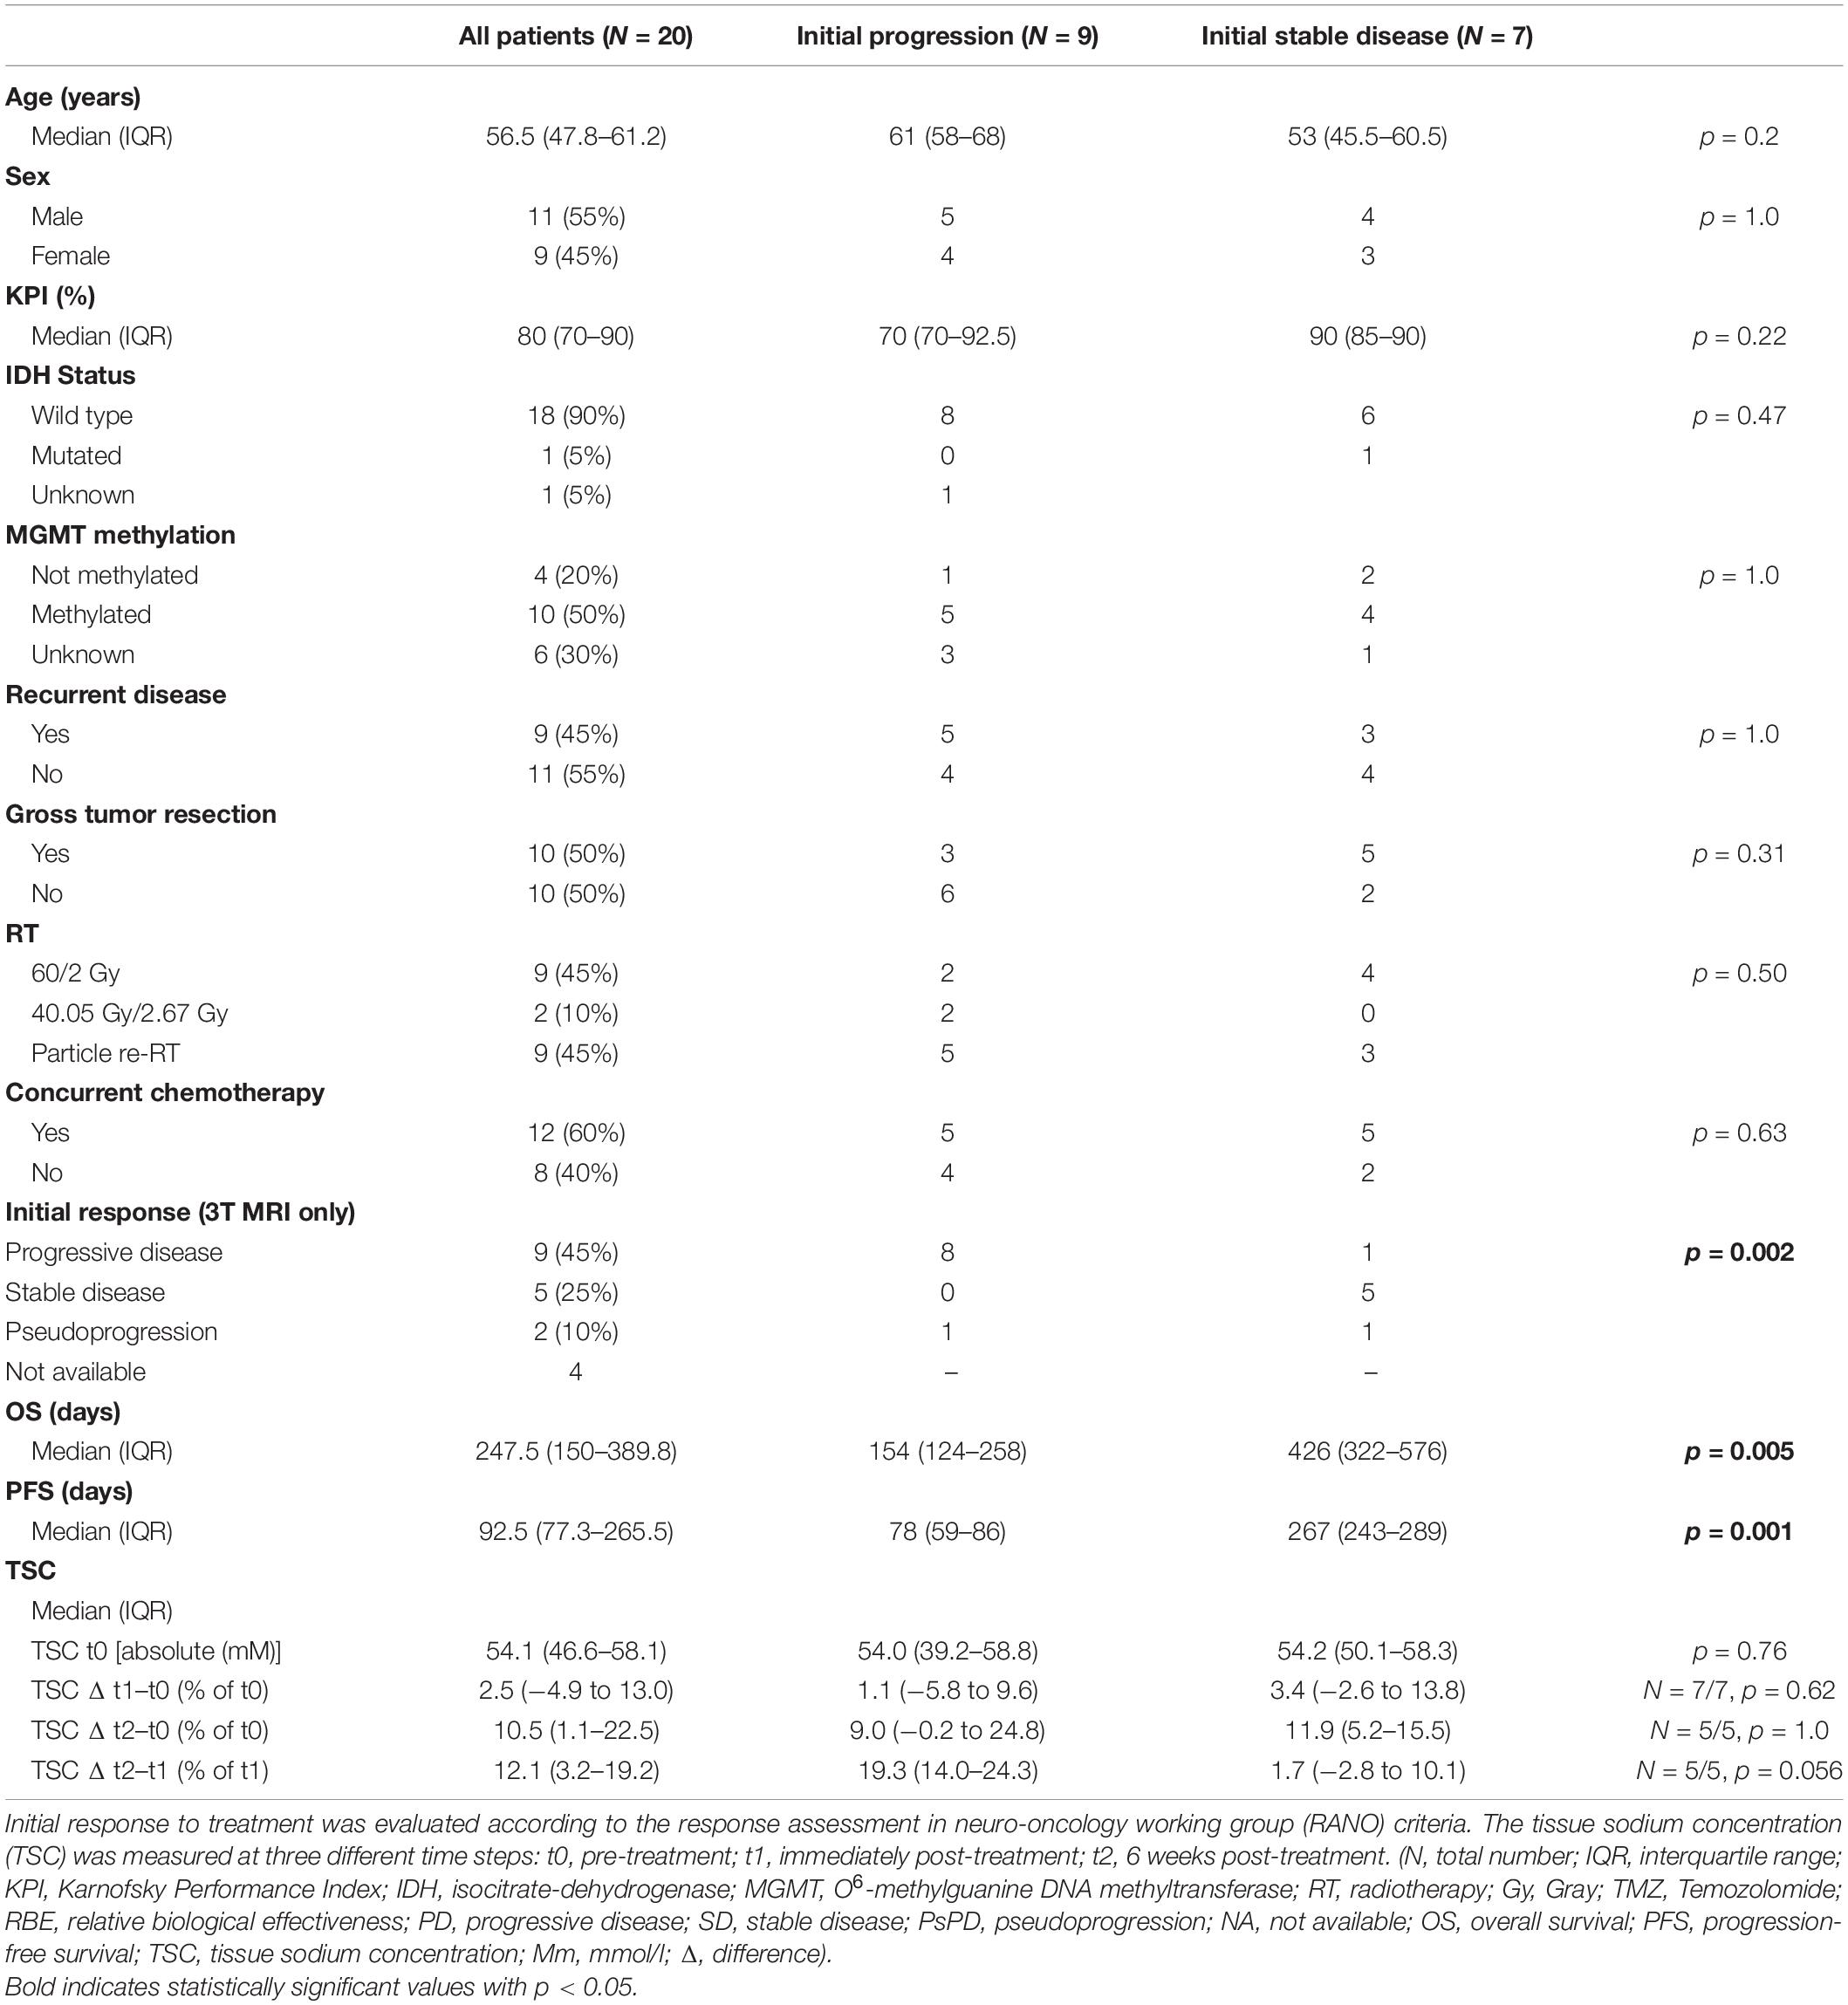
Table 1. Patient characteristics (N = 20).
All 23Na images were acquired on a 7T research scanner (Siemens Healthcare, Erlangen, Germany) with a double-resonant (1H/23Na) quadrature birdcage coil (RAPID Biomedical, Rimpar, Germany). The 23Na data was obtained with a density-adapted 3D radial pulse sequence (Nagel et al., 2009) which yielded a nominal resolution of (Δx)3 = (3 mm)3 (TR/TE = 160 ms/0.35 ms, readout time = 10 ms, number of projections = 4,000, acquisition time = 10:40 min). TE was measured from the center of the RF pulse (shape: rectangular, duration: 600μs) to the start of the readout. Image reconstruction employed an iterative 3D Dictionary Learning Compressed Sensing algorithm (3D-DLCS) (Behl et al., 2016) (block size B = 3 × 3 × 3; dictionary size D = 80; number of samples = 500,000; regularization weighting factor μ = 0.5).
The tissue sodium concentration (TSC) was calculated using two reference vials (0.3–0.6% NaCl). Both B1+ and B1– corrections were applied to reduce transmit and receive inhomogeneities using the double angle method for the field estimations (Insko and Bolinger, 1993).
All patients underwent clinical MRI at a field strength of 3T before initiation of (C)RT. Furthermore, clinical follow-up MRIs were performed approximately 4 and 12 weeks post-therapy. Routinely, clinical 3T MRI encompassed a pre- and post-contrast T1-weighted sequence (Gadolinium based contrast agent; TE = 4.04 ms, TR = 1,710 ms, FoV = 256 × 256 mm2, matrix = 512 × 512, slice thickness = 1 mm) and a fluid-attenuated inversion recovery (FLAIR) sequence (TE = 135 ms, TR = 8,500 ms, FoV = 230 × 172 mm2, matrix = 256 × 192, slice thickness = 5 mm) used for response assessment in accordance with the updated RANO criteria (Wen et al., 2010).
The clinical 3T MRI from the pre-therapy examination and the clinical 3T MRI from the 4-week post-therapy follow-up were co-registered to the radiotherapy planning CT scan by an automatic multi-modal rigid algorithm in MITK (Nolden et al., 2013). Subsequently, an experienced radiologist (DP, 8 years of experience) segmented the Gadolinium contrast enhancing (gdce) areas on T1-weighted 3T MRI together with hyperintense areas on FLAIR T2-weighted 3T MRI on pre- and post-therapy imaging. Necrosis was excluded carefully from the segmentation, resulting in the whole tumor area excluding necrosis. Finally, the segmentation derived from pre-therapy 3T MRI was co-registered to the initial (t0) 7T 23Na MRI, while the segmentation derived from the 4-week post-therapy 3T MRI was co-registered to 7T 23Na MRI at both t1 and t2 to extract TSC values from the tumor region. An example of the tumor contouring and image registration procedures can be found in Supplementary Figure 1.
Patients were routinely scheduled for clinical follow-up visits together with the 3T MRI examinations approximately 4 and 12 weeks post-therapy, as described above. These follow-up visits included thorough clinical examination as well as overall assessment of the radiological findings together with clinical information by a neurooncologist.
Study participants were classified as complete response (CR), partial response (PR), stable disease (SD), or progressive disease (PD) based on radiographic findings and clinical information by the department of neuroradiology and neuro-oncology in accordance with the updated RANO criteria (Wen et al., 2010). To account for possible cases of PsPD, we followed the recommendations of the updated RANO criteria: Each PD in the first follow-up needed to be confirmed in the second follow-up or via biopsy (Wen et al., 2010). Performance of a biopsy was indicated clinically. If the second follow-up or biopsy did not confirm a PD, PsPD was stated. For further analysis, we additionally conducted a radiographic response assessment on clinical 3T MRI only with regard to signal changes (T1 pre- and post-contrast, T2-FLAIR) without using information on clinical status or histopathology (biopsy). A missed follow-up examination due to death or massive deterioration was counted as PD in both assessments.
PFS was calculated from the date of the baseline 7T 23Na MRI (t0) to the date of first progression or death from any cause. OS was calculated from the date of the baseline 7T 23Na MRI (t0) until death from any cause. At the time of statistical analysis, all patients had reached both endpoints.
The median TSC inside the whole tumor area excluding necrosis was calculated at t0, t1, and t2. Subsequently, the differences in median TSC between all-time steps were calculated. Those differences were normalized to the TSC of the earlier time step, yielding the normalized TSC changes. Clinical parameters, baseline median TSC at t0 and the normalized TSC changes were compared between patients with initial SD and patients with initial PD using Fisher’s exact test for non-continuous variables and Mann-Whitney U-tests for continuous variables. Furthermore, univariate proportional hazard models of PFS and OS were developed for different clinical and imaging parameters with the following predictor variables: patient age, sex, Karnofsky Performance Index (KPI), tumor recurrence (binary: recurrent, newly diagnosed), O6-methylguanine DNA methyltransferase (MGMT) methylation (binary: yes, no), gross surgical resection (binary: yes, no), type of CRT (binary: standard of care, other), initial response according to RANO or radiographic findings only (binary: PD, SD), the baseline TSC at t0 and the normalized TSC changes between all-time steps. The according hazard ratios (HR) and standard errors (SE) were calculated as maximum-likelihood estimates (MLE) and p-values were derived from the likelihood ratio test. In the proportional hazard model for PFS with RANO response status as predictor variable, MLEs for HRs did not converge and thus failed to yield a result. Hence, the corresponding univariate proportional hazard models employed Firth’s penalized likelihood method and the computation of profile likelihood confidence intervals to yield valid estimates and p-values (Heinze and Ploner, 2002). All statistical evaluation employed R version 4.0.3.
According to the declaration of Helsinki, this study received approval by the local ethics board (IRB number: S343/2016) and 7T MRI examinations were only initiated after a written informed consent was obtained from the patient.
According to the RANO criteria, the course of nine patients was classified as initial PD, whereas seven patients presented with initial SD, two of which with PsPD. One patient received post-treatment biopsy, which confirmed a PsPD. Four patients could not be classified due to cancelation of treatment or missing clinical follow-up. Classification according to changes on clinical 3T MRI only yielded similar results with two disagreements, thus showing a statistically significant association with the original RANO assessment (p = 0.002, Table 1).
Patients with initial PD showed a tendency toward higher age, lower KPI and fewer gross tumor resections, but no statistically significant differences were found between the initial PD and initial SD group concerning clinical baseline parameters. However, there was a statistically significant difference in PFS [Median PFS (IQR) (days): PD = 78 (59–86), SD = 267 (243–289), p = 0.001] and OS [Median OS (IQR) (days): PD = 154 (124–258), SD = 426 (322–576), p = 0.005] between the two groups (Table 1).
Descriptive analysis of TSC inside the whole tumor region excluding necrosis following treatment revealed a heterogeneous development over all patients (Figure 1A). The pre-therapy (t0) median TSC did not differ significantly between cases of initial SD and initial PD according to RANO [Median TSC (IQR) (mM): PD = 54.04 (39.22–58.77), SD = 54.18 (50.14–58.34), p = 0.76]. Similarly, the normalized TSC changes did not show a statistically significant difference between cases of initial SD and initial PD according to RANO, but there was a tendency toward a stronger increase in TSC from t1 to t2 in early progressing tumors [Normalized ΔTSCt0–t1 (IQR): PD = 1.07% (−5.84 to 9.58%), SD = 3.42% (−2.62 to 13.8%), p = 0.62; normalized ΔTSCt0–t2 (IQR): PD = 8.99% (−0.24 to 24.84%), SD = 11.92% (5.15–15.49%), p = 1; normalized ΔTSCt1–t2 (IQR): PD = 19.27% (14.03–24.33%), SD = 1.68% (−2.83 to 10.11%), p = 0.056]. Similar results were obtained when analyzing uncorrected, absolute TSC values and differences (Supplementary Figure 2 and Supplementary Table 1). Table 1 and Figure 1B yield further details on the development of TSC following CRT for cases of initial SD and initial PD according to RANO. The discrepancy between findings on clinical 3T MRI and development of TSC is illustrated qualitatively for one patient case in Figure 2.
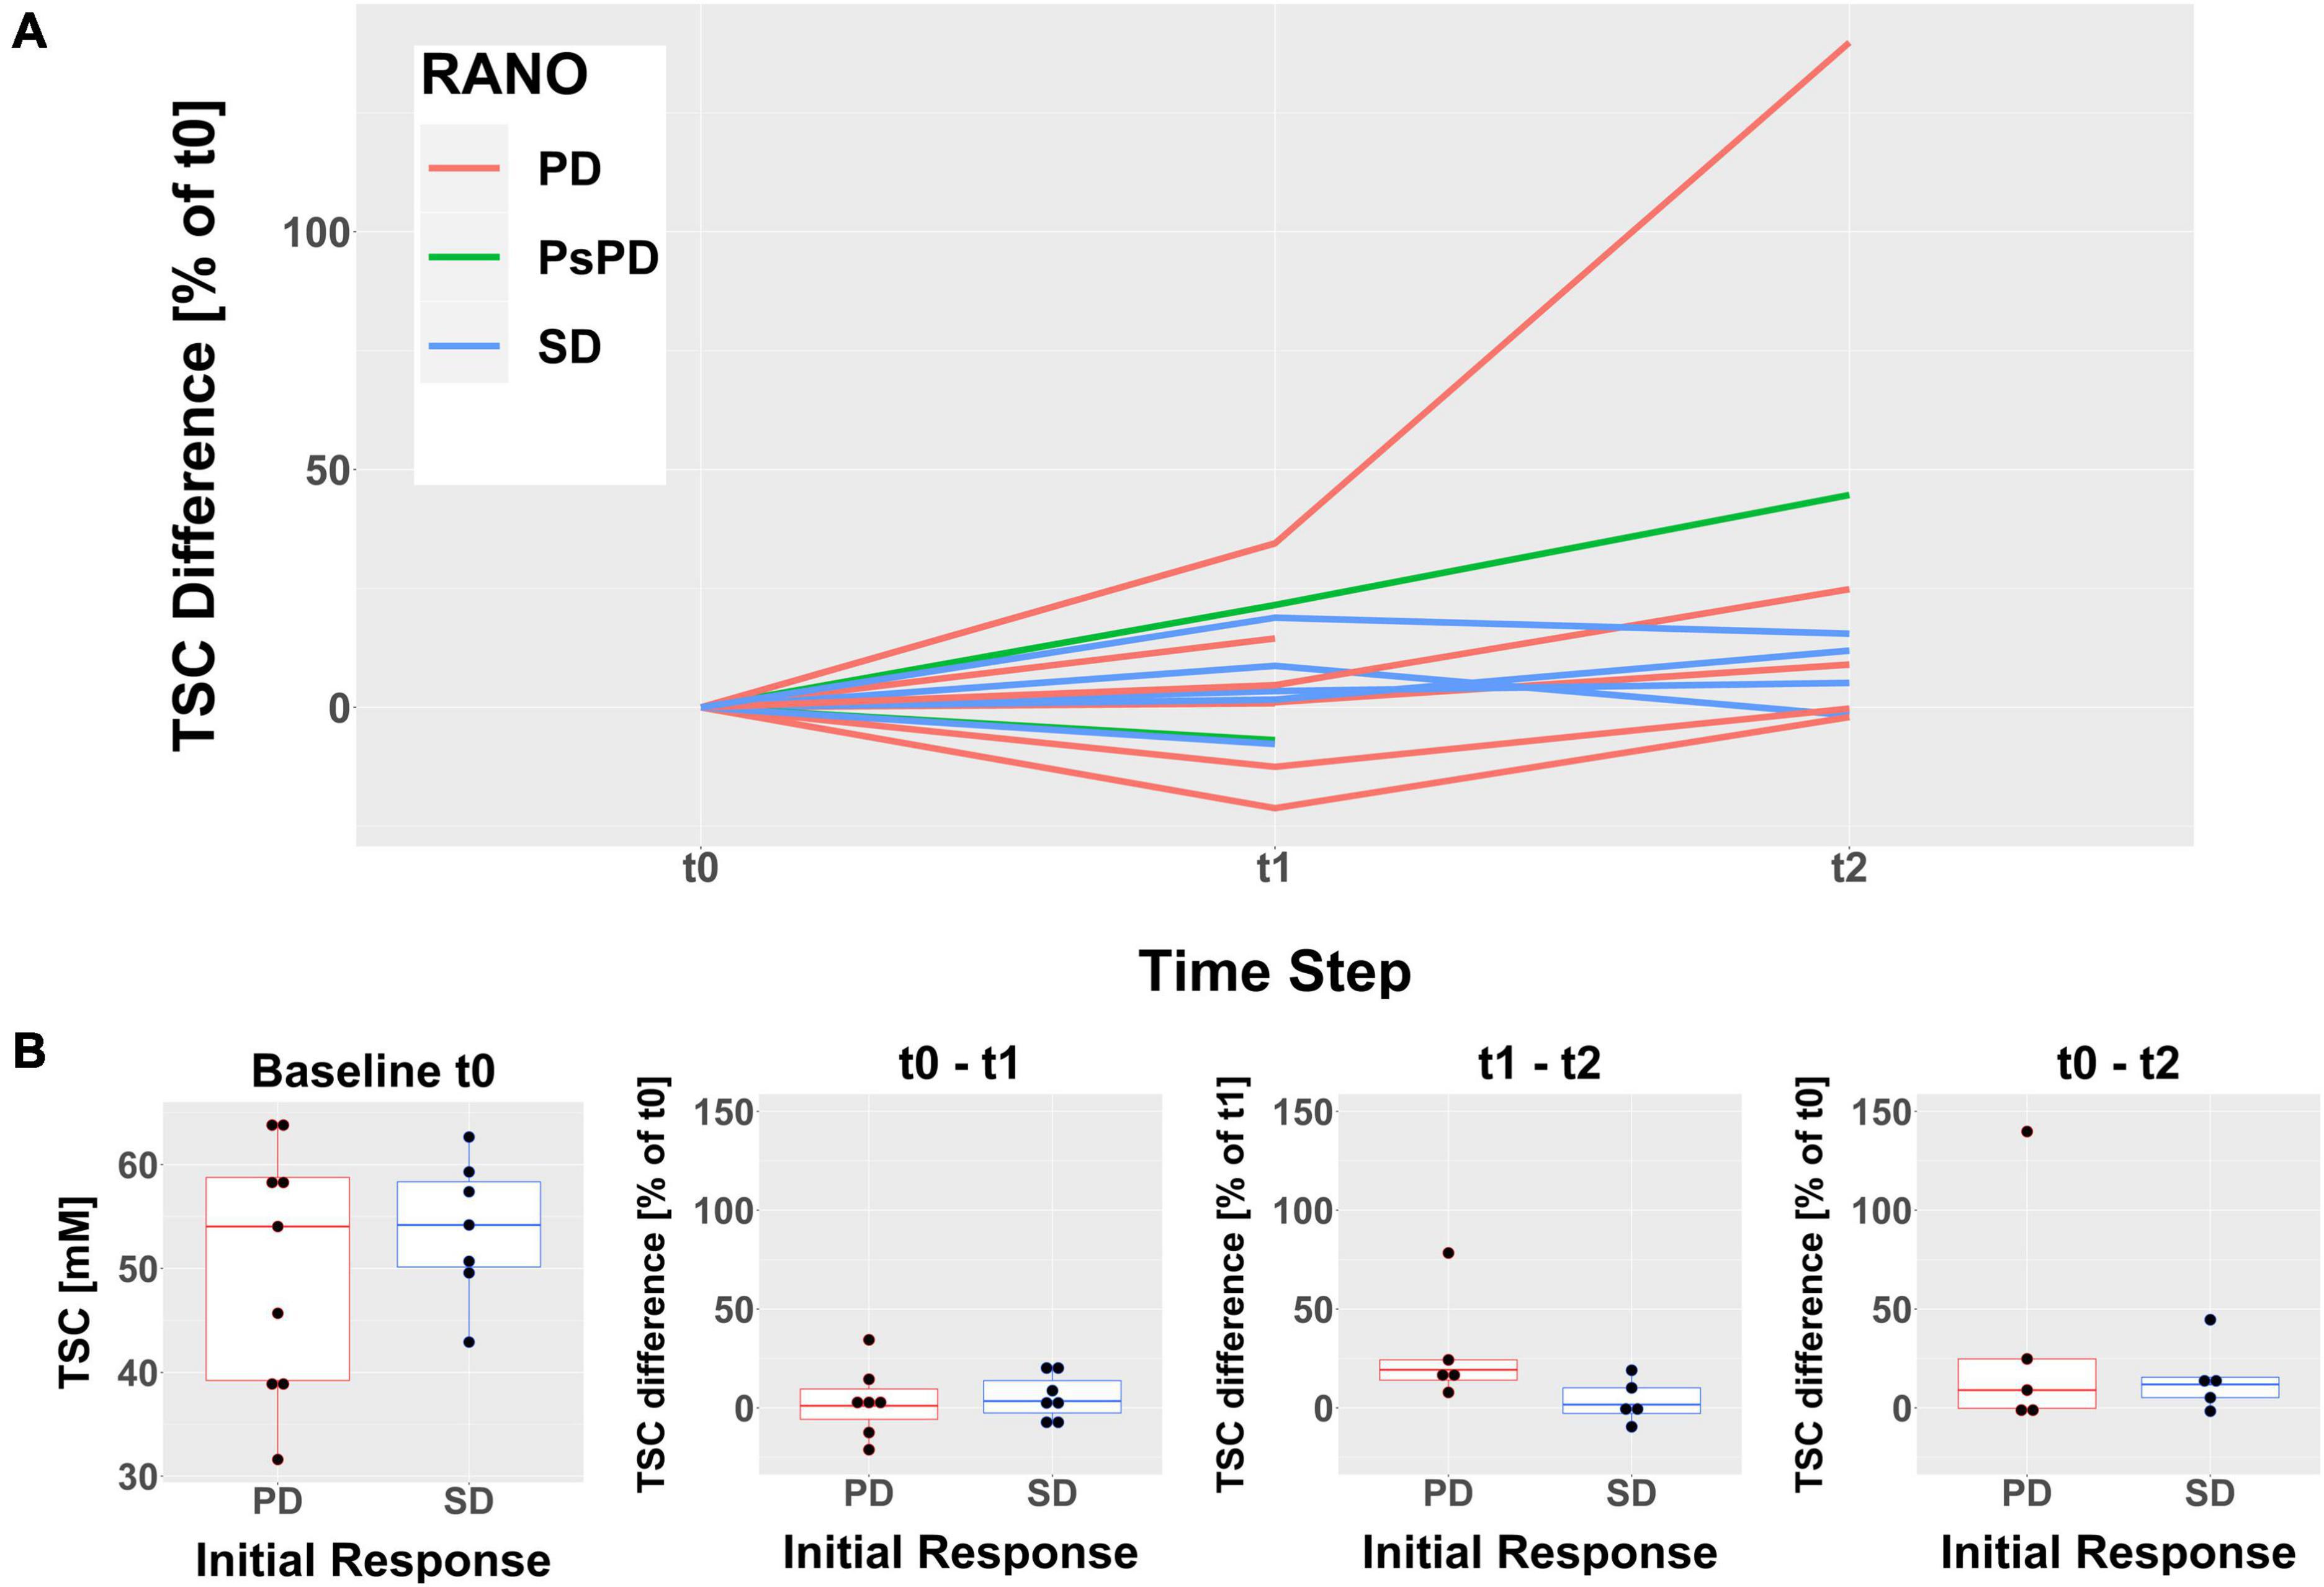
Figure 1. Evolution of the median tissue sodium concentration (TSC) inside the whole tumor areas excluding necrosis following treatment. The time steps refer to the pre-therapy imaging (t0), the follow-up immediately post-therapy (t1) and the follow-up 6 weeks post-therapy (t2). (A) The descriptive analysis shows a heterogeneous evolution of TSC for all patients that does not evidently reflect the RANO response evaluation. The differences between t0 and t1 (at time step t1) as well as between t0 and t2 (at time step t2) were normalized to the baseline TSC at t0. (B) Boxplots showing the median TSC at t0 (left) as well as the normalized TSC differences between all-time steps grouped by initial response according to RANO. None of the observed intergroup differences reached statistical significance.
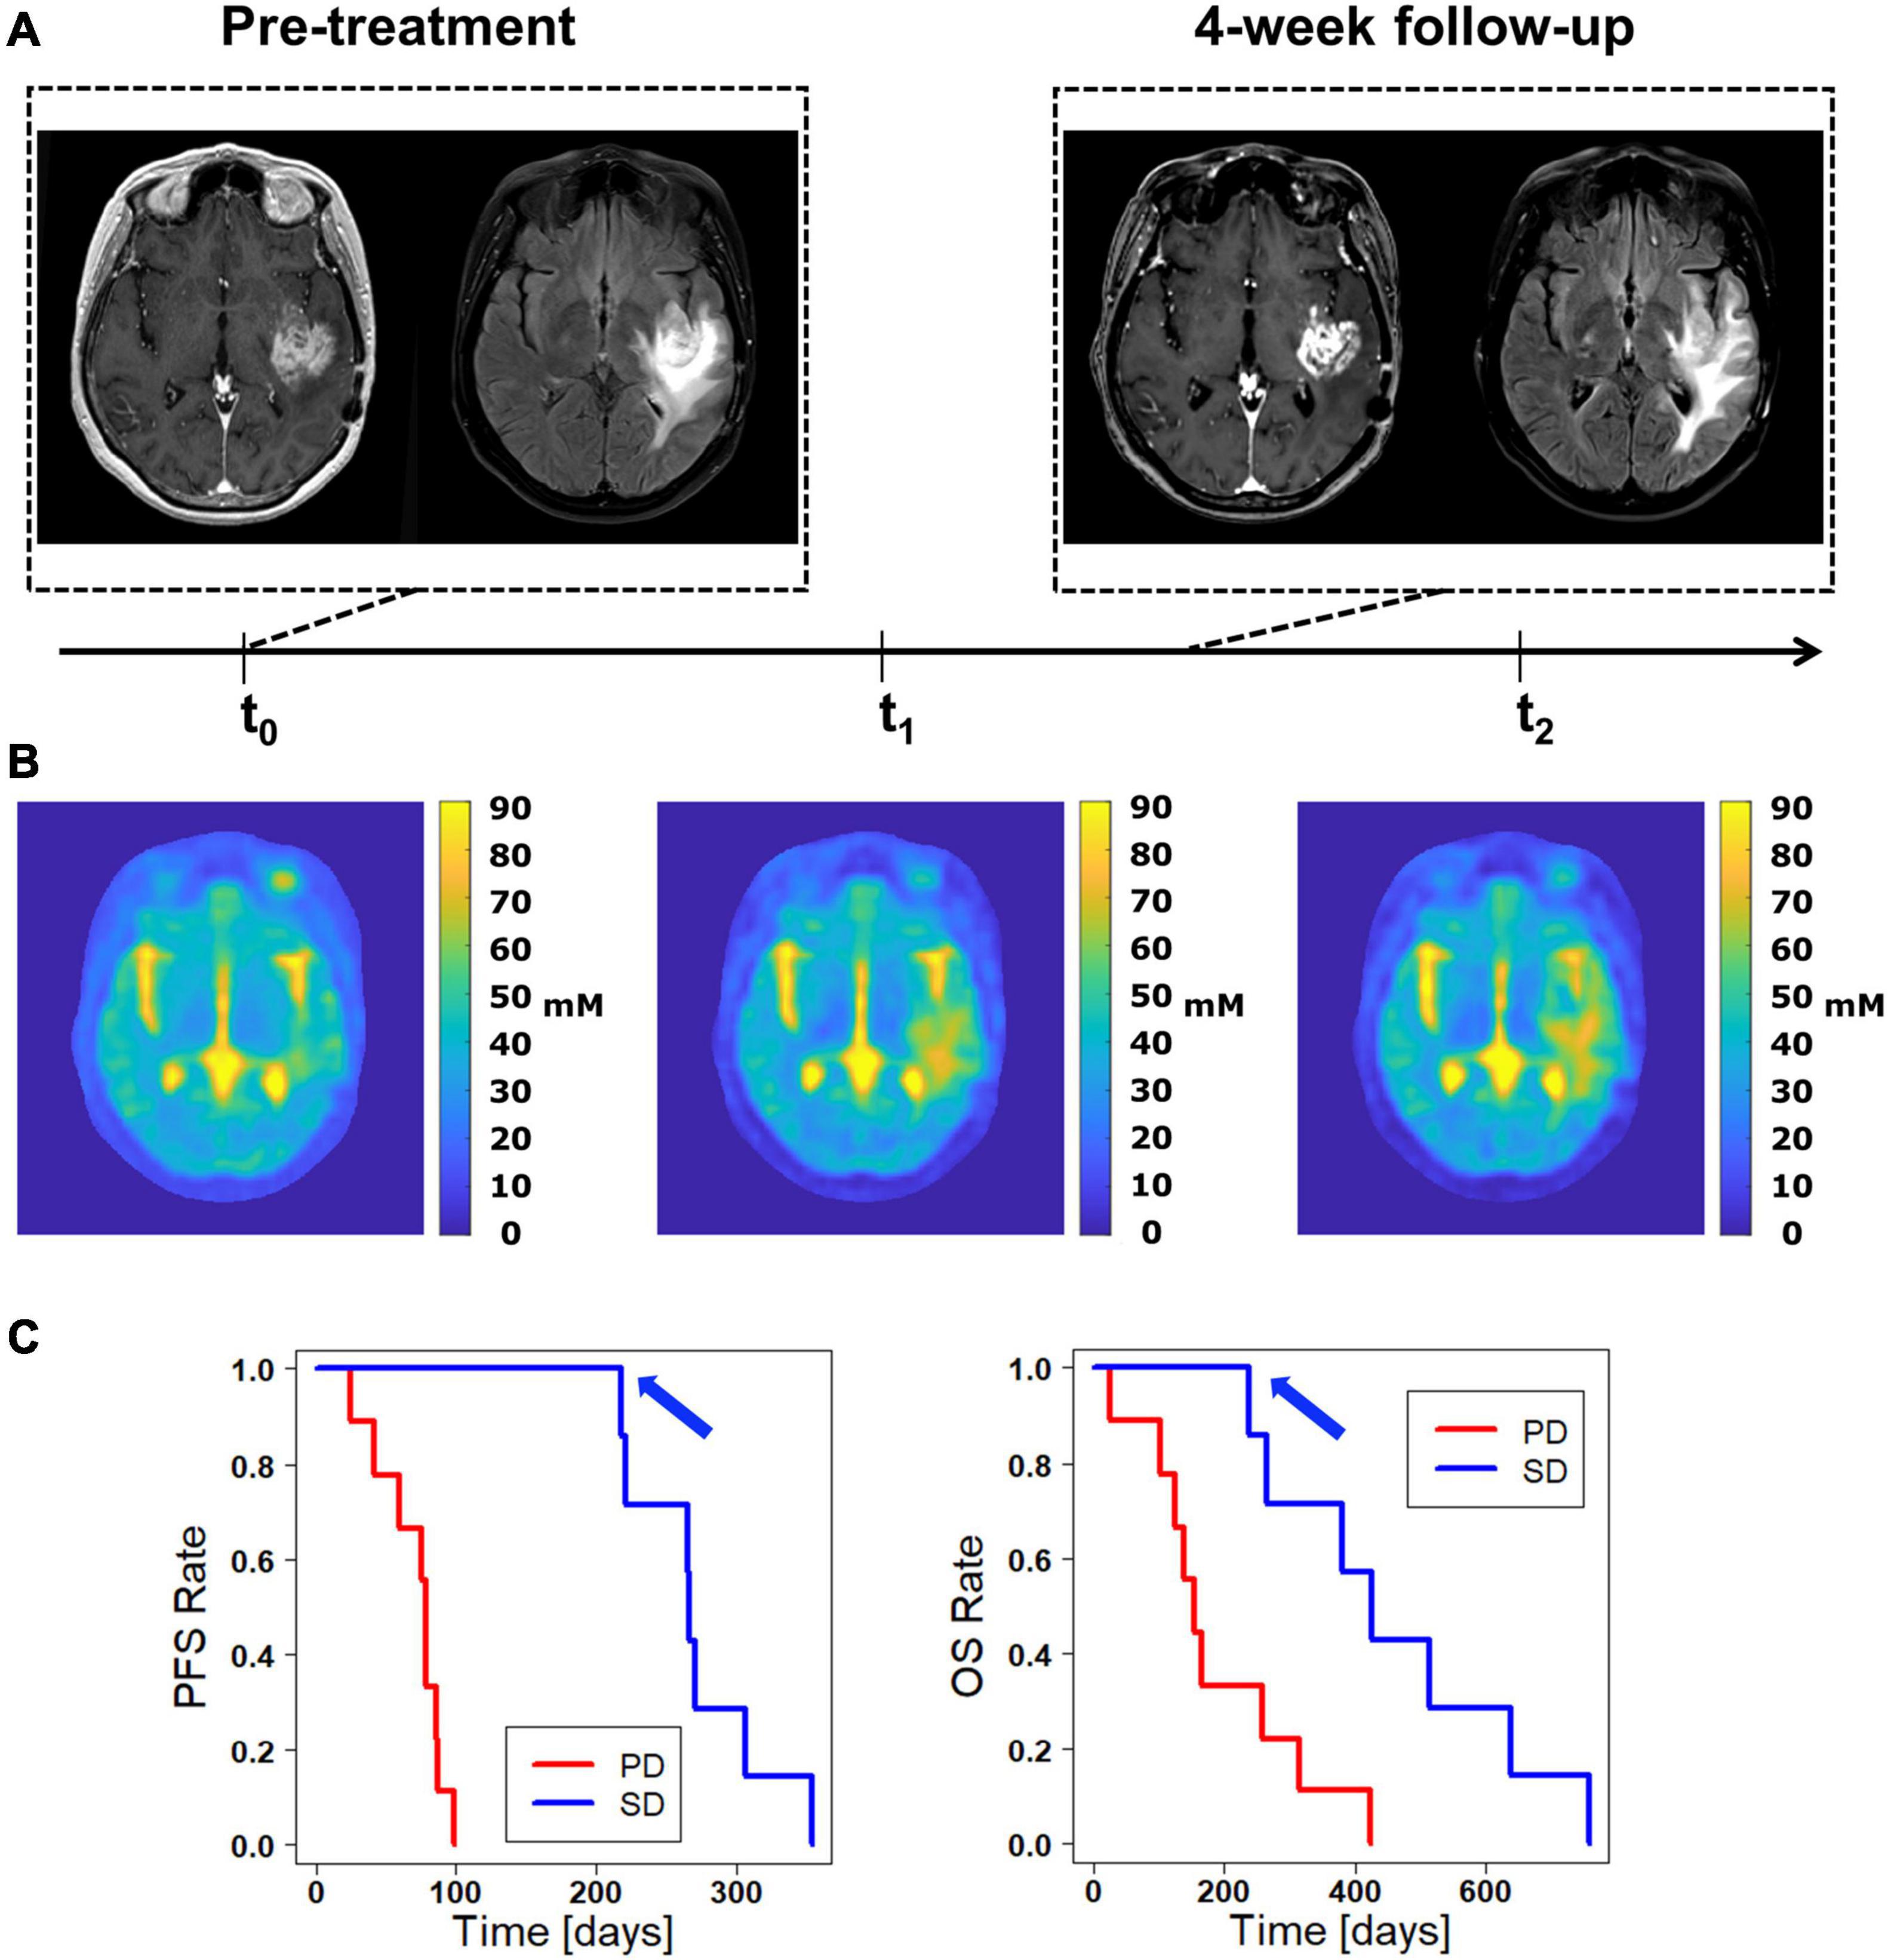
Figure 2. Discrepancy between clinical 3T MRI and 7T 23Na MRI. (A) The clinical 3T MRI of this patient presents only minor changes when comparing the pre-therapy baseline with the 4-week follow up, suggesting an initial stable disease (SD) according to the RANO criteria. (B) The tissue sodium concentration (TSC) shows a successive signal increase both inside the contrast enhancing region and within peritumoral edema. One could deduce a progressive disease (PD) with additional tumor infiltration and consecutively increased signal. On the other hand, a treatment response with successive tumor necrosis and reactive perifocal edema would also be a possible explanation. (C) The Kaplan-Meier curves for progression free survival (PFS, left) and overall survival (OS, right) show the significant prediction of PFS and OS by the RANO classification found in this study. Accordingly, the patient shown in A and B, which is rated as initial SD, lies on the favorable upper curve (blue arrow).
Univariate Cox proportional hazard models revealed that both the RANO criteria assessment of initial response as well as the 3T MRI only assessment of initial response yielded statistically significant predictors of PFS [RANO: HR (95% CI) = 0.02 (0.0001–0.21), p = 7⋅10–5; 3T MRI only: HR (95% CI) = 0.1 (0.02–0.49), p = 0.0009] and OS [RANO: HR (95% CI) = 0.17 (0.04–0.65), p = 0.005; 3T MRI only: HR (95% CI) = 0.26 (0.08–0.87), p = 0.02]. Furthermore, standard of care CRT was associated with significantly improved PFS [HR (95% CI) = 0.312 (0.1–1.0), p = 0.046]. Conversely, none of the TSC measures yielded a significant prediction of PFS or OS. Table 2 provides detailed statistical findings of the survival analysis.
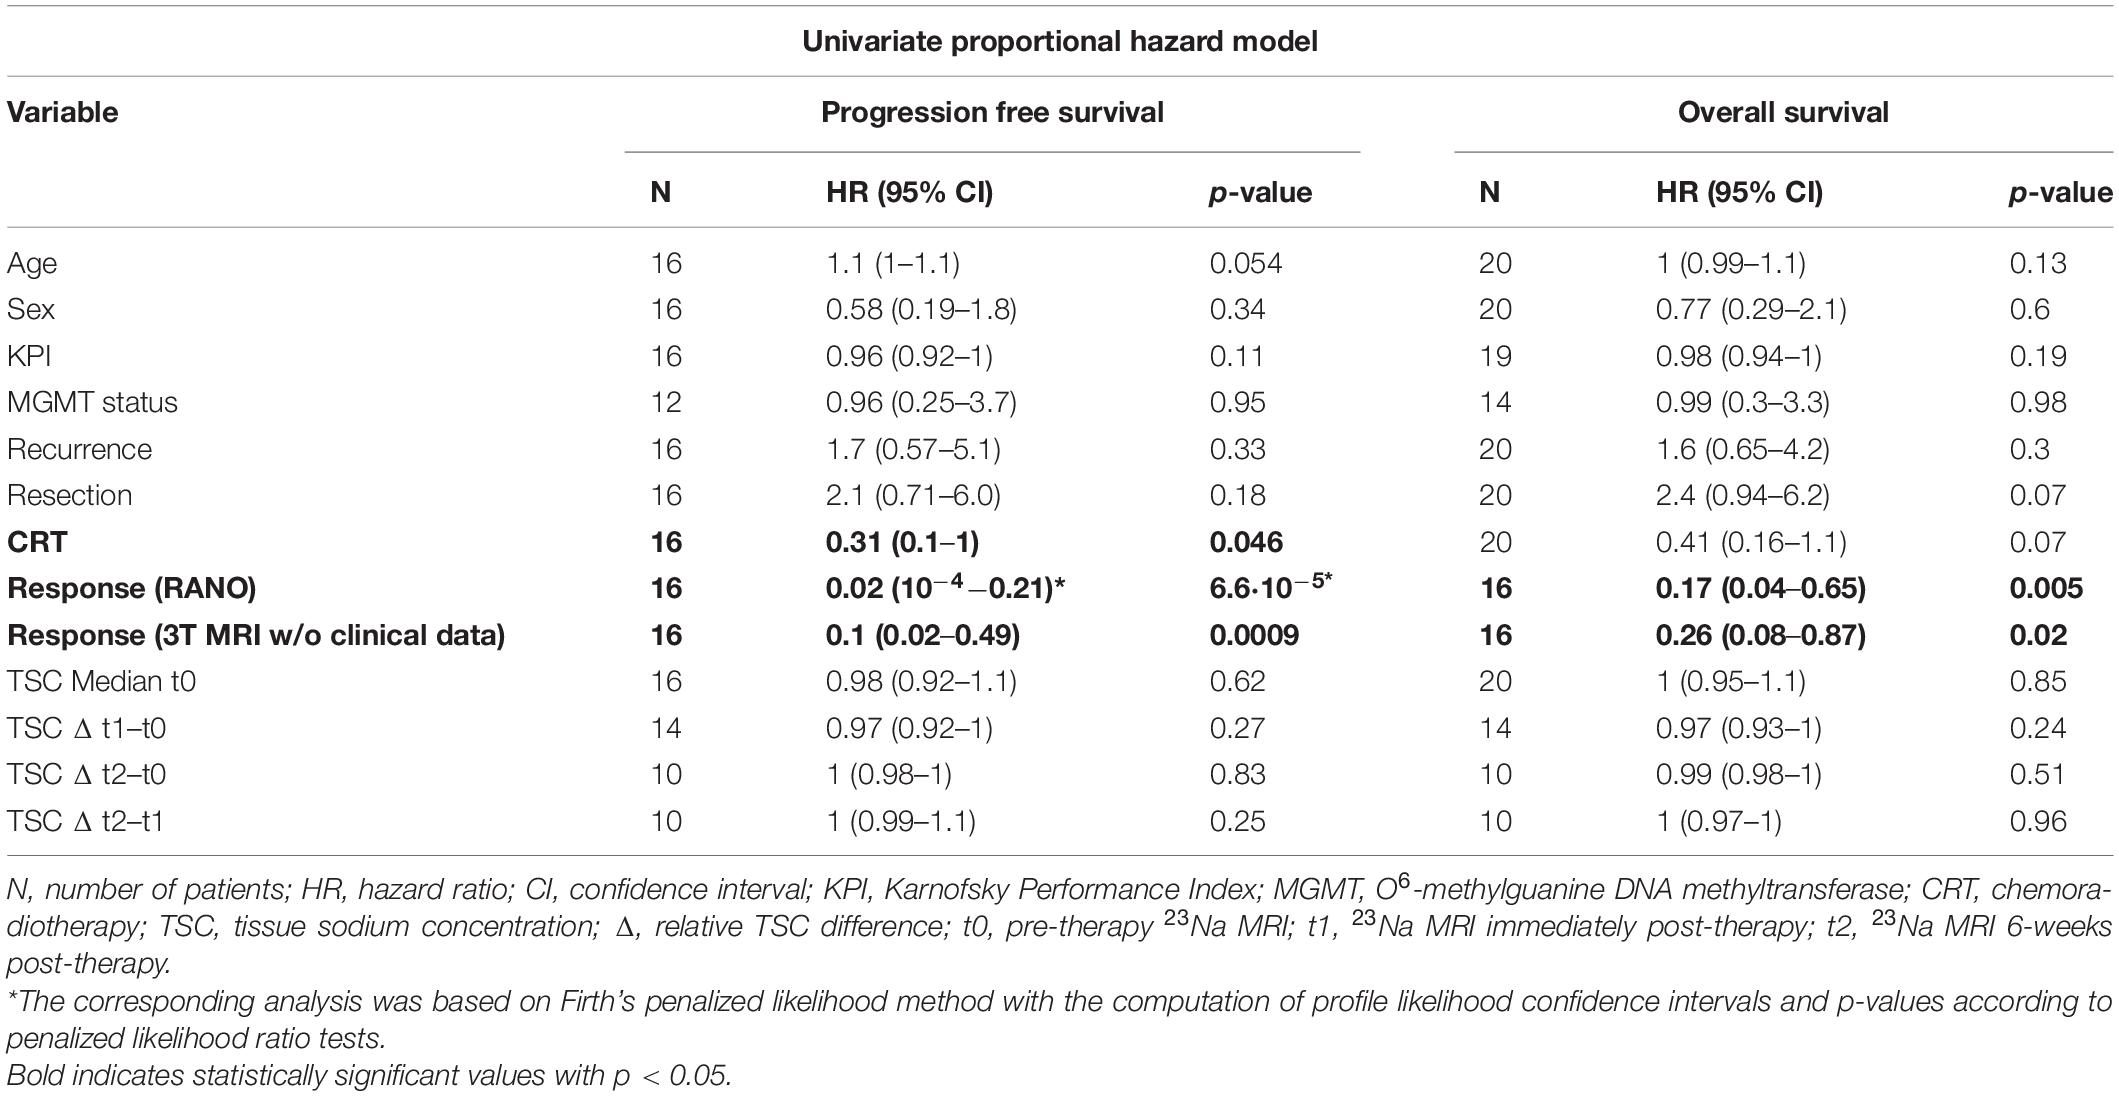
Table 2. Results of the statistical analysis: association with PFS and survival.
Since the evolution of TSC after treatment might have been influenced by prior treatments, we also conducted a descriptive analysis of TSC in newly diagnosed and recurrent tumors separately. This small subgroup analysis did not reveal clear differences between newly diagnosed and recurrent tumors (Supplementary Figure 3).
To our knowledge, this is the first prospective investigation of 23Na MRI at an ultra-high field strength of 7 T to evaluate treatment response in GBM patients. Our data demonstrates heterogeneous changes of TSC following CRT, which suggests that 23Na MRI is sensitive to treatment-related effects. The TSC changes did not correlate with standard of care response assessment or clinical 3T MRI findings in general, so that 23Na MRI might offer complementary biological information. However, the evaluation of TSC in the tumor did not enable a prediction of tumor progression or patient survival. Therefore, future investigations need to elucidate the reasons for treatment-related changes in TSC and their clinical value.
Compared to conventional proton MRI, 23Na MRI is limited by a reduced SNR due to the approx. 10.000-fold lower concentration of 23Na ions than protons in the human body (Shah et al., 2016; Regnery and Platt, 2021). SNR increases with increasing magnetic field strength, so that UHF-MRI scanners > 3T can significantly improve image quality in 23Na MRI (Konstandin and Schad, 2014; Shah et al., 2016). Therefore, we employed an ultra-high field strength of 7T to optimize the SNR. Currently, more and more centers worldwide are acquiring UHF MRI scanners, which are likely to become increasingly applied in neuro-oncology, particularly to support 23Na-imaging, in the near future (Platt et al., 2021).
TSC depends on intra- and extracellular volumes with the underlying 23Na ion distribution (Ouwerkerk et al., 2003; Thulborn et al., 2009). Therefore, the significant elevation of TSC inside of gliomas (Turski et al., 1987; Ouwerkerk et al., 2003; Regnery et al., 2020) might be explained due to both higher intracellular 23Na content of malignant cells (Cameron et al., 1980; Rotin et al., 1989) and enlarged extracellular space in gliomas (Bakay, 1970; Bruehlmeier et al., 2003; Zamecnik et al., 2004). The contribution of either compartment to the increased signal remains controversial (Ouwerkerk et al., 2003; Thulborn, 2016). Furthermore, it needs to be acknowledged that brain tumors can be accompanied by non-infiltrative peritumoral edema, blood brain barrier disruption and different tumor vascular structure, all of which might lead to an increased TSC as well (Turski et al., 1986, 1987; Driver et al., 2020).
Concerning treatment-related changes in TSC, previous findings from animal GBM models suggested that tumor TSC rises few days after an effective chemotherapy, which could reflect intracellular sodium overload or cellular shrinkage due to apoptosis and necrosis (Schepkin et al., 2005, 2006). Those preclinical studies investigated short time tumor response to few doses of chemotherapy without incorporating RT or a treatment protocol over several weeks. Nevertheless, similar tendencies were suggested by preliminary reports of clinical observations during radiotherapy (Thulborn et al., 2009). Moreover, several case reports revealed 23Na signal changes inside gliomas following CRT which were different from findings in clinical imaging, but the underlying biochemical reasons remained undiscovered (Thulborn et al., 2009; Laymon et al., 2012; Haneder et al., 2015). Lastly, a recent clinical study of 23Na MRI at 3T during concomitant CRT in GBM patients hypothesized that TSC may be used to measure tumor cell kill by longitudinal measurements of the brain volume with elevated TSC, representing the residual tumor volume, and its nominal TSC, which may be used to estimate the cell volume fraction (Thulborn et al., 2019).
This study found dichotomous changes of TSC-derived tumor volumes and suggested TSC as measure of tumor cell kill (Thulborn et al., 2019). However, a significant correlation between TSC and PFS was not found, which led the authors to conclude that tumor cell kill due to concomitant CRT alone might have a minor impact on survival when compared to the additional effect of adjuvant chemotherapy (Thulborn et al., 2019).
Our descriptive analysis revealed heterogeneous changes of TSC following (C)RT, which supports the idea that TSC quantifies different responses to treatment. Moreover, there was a trend toward a stronger TSC increase from t1 to t2 in early progressing tumors according to RANO criteria. Nevertheless, we did not find a significant correlation of the development of TSC with the clinical response assessments based on the RANO criteria. These findings agree with the previous reports which suggest that TSC generates information different from established clinical imaging (Laymon et al., 2012; Haneder et al., 2015; Thulborn et al., 2019). However, just as reported by the recent trial at 3T (Thulborn et al., 2019), TSC did not show a significant correlation with PFS or OS either. Our methods were complementary to this previous trial in many regards. TSC was measured at 7T, which provides a higher signal-to-noise-ratio (SNR). In addition, TSC was measured immediately after therapy (t1) as well as 6-weeks post-therapy (t2), therefore including later timepoints. Furthermore, our investigation encompassed the additional correlation of clinical classifications of response to therapy with PFS and OS, which yielded significant results.
Hence, TSC seems to reflect treatment effects which are not visible on clinical MRI, but a straightforward correlation with tumor cell kill has not been demonstrated yet. There was a trend toward a stronger TSC increase from t1 to t2 in early progressing GBM that could reach statistical significance in larger patient cohorts. However, TSC did not correlate with PFS and OS while clinical response correlated well with PFS and OS. Presumably, various factors besides mere tumor cell kill could have an overlapping influence on TSC, namely therapy-related non-infiltrative edema (Turski et al., 1986, 1987; Hashimoto et al., 1991; Ouwerkerk et al., 2003) and blood-brain-barrier disruption (Turski et al., 1986). Effective tumor cell kill may reduce blood brain barrier disruptions and brain edema, with a consecutive decrease of TSC in the corresponding regions (Thulborn et al., 2009). On the other hand, CRT itself can also cause blood brain barrier disruptions and brain edema, leading to the well-known pseudoprogressions with potential elevations of the TSC. Therefore, future approaches should aim to combine 23Na MRI with proton MRI (e.g., diffusion-weighted imaging, perfusion-weighted imaging) to better understand different treatment effects besides tumor cell kill. Since 23Na MRI offers information that is technically and biologically independent from established proton MRI applications, it might be highly useful in future multiparametric, machine-learning based approaches.
Several limitations of this study need to be acknowledged. Firstly, the patient cohort is relatively small and heterogeneous. Most patients had a comparatively poor prognosis due to a high number of relapsing tumors and only 50% gross tumor resections. This limits the power of our analysis. In addition, the use of different RT regimes could have led to different treatment reactions in normal tissues, e.g., different grades of blood brain barrier disruption. In particular, patients receiving (re-) radiotherapy of a relapsing GBM tend to experience pseudoprogressions and radionecrosis more often, and such treatment-related changes can confound the TSC. Nevertheless, all patients received RT as main treatment and the aim was to predict therapy response and survival, which should be possible if 23Na MRI yields a straightforward measure of tumor cell kill. Clinical response assessments yielded a significant correlation with PFS and OS, whereas the TSC quantification in our setup failed to do so. However, it cannot be excluded that at higher SNR or higher spatial resolutions (e.g., due to B0 > 7T, longer measurement times, use of array receiver coils) a correlation might become observable. Secondly, clinical 3T MRI and 7T 23Na MRI were not performed at completely parallel follow-ups, which could have impeded the coregistration of the segmentations. In the past, different approaches have been used to analyze 23Na MR images, mostly relying on segmentations defined on clinical MRI (Turski et al., 1986; Heinze and Ploner, 2002; Thulborn, 2016; Driver et al., 2020). A recent study investigating 23Na MRI at 3T for response assessment in GBM patients used a semi-automatic approach to delineate tumor volumes directly on 23Na images based on TSC cut-offs (which were created using clinical MRI) (Thulborn et al., 2019). This approach did not prove feasible in our data because of elevated TSC around CSF-spaces due to partial volume effects despite a high SNR at the 7T field strength. Lastly, the clinical assessment of treatment response might still be constrained by misclassifications due to pseudoprogression despite following the RANO recommendations as current golden standard.
The strengths of this study include the prospective design and the use of a 7T ultra-high field scanner which offers high SNR compared to clinical field strengths. As opposed to previous studies that analyzed TSC changes over a short period of time, this study encompassed longitudinal TSC measurement up to 6 weeks after treatment. Furthermore, correlation with several clinical and radiographic parameters was performed to compare the predictive capacity of 23Na MRI with clinical standard information.
The raw data supporting the conclusions of this article are available only upon scientific request because patient data are included. The corresponding author (DP) may be contacted to request the data.
The studies involving human participants were reviewed and approved by the University Heidelberg Institutional Review Board Alte Glockengießerei 11/1, 69115 Heidelberg, Germany. The patients/participants provided their written informed consent to participate in this study.
DP, SA, SRe, and NB: study conceptualization. NB and TP: technical methodology. DP, SRe, NB, and KD-H: examinations. SRe, NB, TP, NW, PW, and LK: data processing. SRe and DP: statistical analysis and writing first draft. SA, JD, H-PS, ML, SRi, WW, and MB: scientific supervision. All authors reviewing and editing first draft.
SRe was funded by the Physician-Scientist Program of Heidelberg University, Faculty of Medicine. DP receives funding from the German Research Foundation (DFG, project number 445704496).
NB was employed by the company Siemens Healthcare GmbH.
The remaining authors declare that the research was conducted in the absence of any commercial or financial relationships that could be construed as a potential conflict of interest.
All claims expressed in this article are solely those of the authors and do not necessarily represent those of their affiliated organizations, or those of the publisher, the editors and the reviewers. Any product that may be evaluated in this article, or claim that may be made by its manufacturer, is not guaranteed or endorsed by the publisher.
We thank Jessica Engelhart and Vanessa Peregovich for outstanding study assistance.
The Supplementary Material for this article can be found online at: https://www.frontiersin.org/articles/10.3389/fnins.2021.782516/full#supplementary-material
Bakay, L. (1970). The extracellular space in brain tumours. I. Morphological considerations. Brain 93, 693–698. doi: 10.1093/brain/93.4.693
Behl, N. G., Gnahm, C., Bachert, P., Ladd, M. E., and Nagel, A. M. (2016). Three-dimensional dictionary-learning reconstruction of (23)Na MRI data. Magn. Reson. Med. 75, 1605–1616. doi: 10.1002/mrm.25759
Bruehlmeier, M., Roelcke, U., Blauenstein, P., Missimer, J., Schubiger, P. A., Locher, J. T., et al. (2003). Measurement of the extracellular space in brain tumors using 76Br-bromide and PET. J. Nucl. Med. 44, 1210–1218.
Cameron, I. L., Smith, N. K., Pool, T. B., and Sparks, R. L. (1980). Intracellular concentration of sodium and other elements as related to mitogenesis and oncogenesis in vivo. Cancer Res. 40, 1493–1500.
de Wit, M. C., de Bruin, H. G., Eijkenboom, W., Sillevis Smitt, P. A., and van den Bent, M. J. (2004). Immediate post-radiotherapy changes in malignant glioma can mimic tumor progression. Neurology 63, 535–537. doi: 10.1212/01.wnl.0000133398.11870.9a
Driver, I. D., Stobbe, R. W., Wise, R. G., and Beaulieu, C. (2020). Venous contribution to sodium MRI in the human brain. Magn. Reson. Med. 83, 1331–1338. doi: 10.1002/mrm.27996
Haneder, S., Giordano, F. A., Konstandin, S., Brehmer, S., Buesing, K. A., Schmiedek, P., et al. (2015). (2)(3)Na-MRI of recurrent glioblastoma multiforme after intraoperative radiotherapy: technical note. Neuroradiology 57, 321–326. doi: 10.1007/s00234-014-1468-2
Hashimoto, T., Ikehira, H., Fukuda, H., Yamaura, A., Watanabe, O., Tateno, Y., et al. (1991). In vivo sodium-23 MRI in brain tumors: evaluation of preliminary clinical experience. Am. J. Physiol. Imaging 6, 74–80.
Heinze, G., and Ploner, M. (2002). SAS and SPLUS programs to perform Cox regression without convergence problems. Comput. Methods Programs Biomed. 67, 217–223. doi: 10.1016/s0169-2607(01)00149-3
Insko, E. K., and Bolinger, L. (1993). Mapping of the Radiofrequency Field. J. Magn. Reson. A. 103, 82–85. doi: 10.1006/jmra.1993.1133
Johnson, D. R., Guerin, J. B., Ruff, M. W., Fang, S., Hunt, C. H., Morris, J. M., et al. (2019). Glioma response assessment: classic pitfalls, novel confounders, and emerging imaging tools. Br. J. Radiol. 92:20180730. doi: 10.1259/bjr.20180730
Konstandin, S., and Schad, L. R. (2014). 30 Years of sodium/X-nuclei magnetic resonance imaging. MAGMA 27, 1–4. doi: 10.1007/s10334-013-0426-z
Laymon, C. M., Oborski, M. J., Lee, V. K., Davis, D. K., Wiener, E. C., Lieberman, F. S., et al. (2012). Combined imaging biomarkers for therapy evaluation in glioblastoma multiforme: correlating sodium MRI and F-18 FLT PET on a voxel-wise basis. Magn. Reson. Imaging 30, 1268–1278. doi: 10.1016/j.mri.2012.05.011
Nagel, A. M., Laun, F. B., Weber, M. A., Matthies, C., Semmler, W., and Schad, L. R. (2009). Sodium MRI using a density-adapted 3D radial acquisition technique. Magn. Reson. Med. 62, 1565–1573. doi: 10.1002/mrm.22157
Nolden, M., Zelzer, S., Seitel, A., Wald, D., Muller, M., Franz, A. M., et al. (2013). The medical imaging interaction toolkit: challenges and advances : 10 years of open-source development. Int. J. Comput. Assist. Radiol. Surg. 8, 607–620. doi: 10.1007/s11548-013-0840-8
Ouwerkerk, R., Bleich, K. B., Gillen, J. S., Pomper, M. G., and Bottomley, P. A. (2003). Tissue sodium concentration in human brain tumors as measured with 23Na MR imaging. Radiology 227, 529–537. doi: 10.1148/radiol.2272020483
Perry, J. R., Laperriere, N., O’Callaghan, C. J., Brandes, A. A., Menten, J., Phillips, C., et al. (2017). Short-course radiation plus Temozolomide in elderly patients with glioblastoma. N. Engl. J. Med. 376, 1027–1037. doi: 10.1056/NEJMoa1611977
Platt, T., Ladd, M. E., and Paech, D. (2021). 7 Tesla and beyond: advanced methods and clinical applications in magnetic resonance imaging. Invest. radiol. 56, 705–725. doi: 10.1097/rli.0000000000000820
Regnery, S., Behl, N. G. R., Platt, T., Weinfurtner, N., Windisch, P., Deike-Hofmann, K., et al. (2020). Ultra-high-field sodium MRI as biomarker for tumor extent, grade and IDH mutation status in glioma patients. Neuroimage Clin. 28:102427. doi: 10.1016/j.nicl.2020.102427
Regnery, S., and Platt, T. (2021). [Perspectives of X-nuclei magnetic resonance imaging in neuro-oncology]. Radiologe 61, 36–42. doi: 10.1007/s00117-020-00753-8
Rotin, D., Steele-Norwood, D., Grinstein, S., and Tannock, I. (1989). Requirement of the Na+/H+ exchanger for tumor growth. Cancer Res. 49, 205–211.
Schepkin, V. D., Lee, K. C., Kuszpit, K., Muthuswami, M., Johnson, T. D., Chenevert, T. L., et al. (2006). Proton and sodium MRI assessment of emerging tumor chemotherapeutic resistance. NMR Biomed. 19, 1035–1042. doi: 10.1002/nbm.1074
Schepkin, V. D., Ross, B. D., Chenevert, T. L., Rehemtulla, A., Sharma, S., Kumar, M., et al. (2005). Sodium magnetic resonance imaging of chemotherapeutic response in a rat glioma. Magn. Reson. Med. 53, 85–92. doi: 10.1002/mrm.20332
Shah, N. J., Worthoff, W. A., and Langen, K. J. (2016). Imaging of sodium in the brain: a brief review. NMR Biomed. 29, 162–174. doi: 10.1002/nbm.3389
Stupp, R., Hegi, M. E., Mason, W. P., van den Bent, M. J., Taphoorn, M. J., Janzer, R. C., et al. (2009). Effects of radiotherapy with concomitant and adjuvant temozolomide versus radiotherapy alone on survival in glioblastoma in a randomised phase III study: 5-year analysis of the EORTC-NCIC trial. Lancet Oncol. 10, 459–466. doi: 10.1016/s1470-2045(09)70025-7
Stupp, R., Mason, W. P., van den Bent, M. J., Weller, M., Fisher, B., Taphoorn, M. J., et al. (2005). Radiotherapy plus concomitant and adjuvant temozolomide for glioblastoma. N. Engl. J. Med. 352, 987–996. doi: 10.1056/NEJMoa043330
Thulborn, K. R. (2016). Quantitative sodium MR imaging: a review of its evolving role in medicine. Neuroimage 168, 250-268. doi: 10.1016/j.neuroimage.2016.11.056
Thulborn, K. R., Lu, A., Atkinson, I. C., Damen, F., and Villano, J. L. (2009). Quantitative sodium MR imaging and sodium bioscales for the management of brain tumors. Neuroimaging Clin. N. Am. 19, 615–624. doi: 10.1016/j.nic.2009.09.001
Thulborn, K. R., Lu, A., Atkinson, I. C., Pauliah, M., Beal, K., Chan, T. A., et al. (2019). Residual tumor volume, cell volume fraction, and tumor cell kill during fractionated chemoradiation therapy of human glioblastoma using quantitative sodium MR imaging. Clin. Cancer Res. 25, 1226–1232. doi: 10.1158/1078-0432.ccr-18-2079
Turski, P. A., Houston, L. W., Perman, W. H., Hald, J. K., Turski, D., Strother, C. M., et al. (1987). Experimental and human brain neoplasms: detection with in vivo sodium MR imaging. Radiology 163, 245–249. doi: 10.1148/radiology.163.1.3029803
Turski, P. A., Perman, W. H., Hald, J. K., Houston, L. W., Strother, C. M., and Sackett, J. F. (1986). Clinical and experimental vasogenic edema: in vivo sodium MR imaging. Work in progress. Radiology 160, 821–825. doi: 10.1148/radiology.160.3.3090615
Wen, P. Y., Macdonald, D. R., Reardon, D. A., Cloughesy, T. F., Sorensen, A. G., Galanis, E., et al. (2010). Updated response assessment criteria for high-grade gliomas: response assessment in neuro-oncology working group. J. Clin. Oncol. 28, 1963–1972. doi: 10.1200/jco.2009.26.3541
Keywords: brain neoplasm/secondary cases, glioblastoma, response assessment, magnetic resonance imaging, ultra-high field (7 tesla), sodium MRI
Citation: Paech D, Regnery S, Platt T, Behl NGR, Weckesser N, Windisch P, Deike-Hofmann K, Wick W, Bendszus M, Rieken S, König L, Ladd ME, Schlemmer H-P, Debus J and Adeberg S (2021) Assessment of Sodium MRI at 7 Tesla as Predictor of Therapy Response and Survival in Glioblastoma Patients. Front. Neurosci. 15:782516. doi: 10.3389/fnins.2021.782516
Received: 24 September 2021; Accepted: 09 November 2021;
Published: 01 December 2021.
Edited by:
Nico Sollmann, University of California, San Francisco, United StatesReviewed by:
Inge Compter, Maastro Clinic, NetherlandsCopyright © 2021 Paech, Regnery, Platt, Behl, Weckesser, Windisch, Deike-Hofmann, Wick, Bendszus, Rieken, König, Ladd, Schlemmer, Debus and Adeberg. This is an open-access article distributed under the terms of the Creative Commons Attribution License (CC BY). The use, distribution or reproduction in other forums is permitted, provided the original author(s) and the copyright owner(s) are credited and that the original publication in this journal is cited, in accordance with accepted academic practice. No use, distribution or reproduction is permitted which does not comply with these terms.
*Correspondence: Daniel Paech, ZC5wYWVjaEBka2Z6LmRl
†These authors have contributed equally to this work and share first authorship
Disclaimer: All claims expressed in this article are solely those of the authors and do not necessarily represent those of their affiliated organizations, or those of the publisher, the editors and the reviewers. Any product that may be evaluated in this article or claim that may be made by its manufacturer is not guaranteed or endorsed by the publisher.
Research integrity at Frontiers
Learn more about the work of our research integrity team to safeguard the quality of each article we publish.