 Dongyun Li1
 Chunxue Liu1Ziyi Huang2,3Huiping Li1Qiong Xu1Bingrui Zhou1Chunchun Hu1Ying Zhang1Yi Wang1
 Jingxin Nie3
 Zhongwei Qiao4*Dazhi Yin2*
 Xiu Xu1*
- 1Department of Child Health Care, Children’s Hospital of Fudan University, Shanghai, China
- 2Shanghai Key Laboratory of Brain Functional Genomics (Ministry of Education), School of Psychology and Cognitive Science, Affiliated Mental Health Center, East China Normal University, Shanghai, China
- 3School of Psychology, South China Normal University, Guangzhou, China
- 4Department of Radiology, Children’s Hospital of Fudan University, Shanghai, China
SH3 and Multiple Ankyrin Repeat Domains 3 (SHANK3)-caused autism spectrum disorder (ASD) may present a unique opportunity to clarify the heterogeneous neuropathological mechanisms of ASD. However, the specificity and commonality of disrupted large-scale brain organization in SHANK3-deficient children remain largely unknown. The present study combined genetic tests, neurobehavioral evaluations, and magnetic resonance imaging, aiming to explore the disruptions of both local and networked cortical structural organization in ASD children with and without SHANK3 deficiency. Multiple surface morphological parameters such as cortical thickness (CT) and sulcus depth were estimated, and the graph theory was adopted to characterize the topological properties of structural covariance networks (SCNs). Finally, a correlation analysis between the alterations in brain morphological features and the neurobehavioral evaluations was performed. Compared with typically developed children, increased CT and reduced nodal degree were found in both ASD children with and without SHANK3 defects mainly in the lateral temporal cortex, prefrontal cortex (PFC), temporo-parietal junction (TPJ), superior temporal gyrus (STG), and limbic/paralimbic regions. Besides commonality, our findings showed some distinct abnormalities in ASD children with SHANK3 defects compared to those without. Locally, more changes in the STG and orbitofrontal cortex were exhibited in ASD children with SHANK3 defects, while more changes in the TPJ and inferior parietal lobe (IPL) in those without SHANK3 defects were observed. For the SCNs, a trend toward regular network topology was observed in ASD children with SHANK3 defects, but not in those without. In addition, ASD children with SHANK3 defects showed more alterations of nodal degrees in the anterior and posterior cingulate cortices and right insular, while there were more disruptions in the sensorimotor areas and the left insular and dorsomedial PFC in ASD without SHANK3 defects. Our findings indicate dissociable disruptions of local and networked brain morphological features in ASD children with and without SHANK3 deficiency. Moreover, this monogenic study may provide a valuable path for parsing the heterogeneity of brain disturbances in ASD.
Introduction
SH3 and Multiple Ankyrin Repeat Domains 3 (SHANK3) is a master postsynaptic density scaffolding protein that is crucial for synaptogenesis, dendritic spine maturation, and synapse formation (Jiang and Ehlers, 2013; Monteiro and Feng, 2017). Mutations in genes coding for synaptic proteins consist of the most well-characterized genetic deficits reported in autism spectrum disorder (ASD; de la Torre-Ubieta et al., 2016). Haploinsufficiency of the SHANK3 gene is a key contributor of autistic features in the 22q13.3 deletion syndrome (i.e., Phelan–McDermid syndrome; Phelan, 2008; Bonaglia et al., 2011; Phelan and McDermid, 2012). Supported by the fact of an approximately 2% prevalence in ASD patients with cognitive deficits, the SHANK3 gene is considered as one of the most common genetic causes for ASDs (Betancur and Buxbaum, 2013; Leblond et al., 2014).
Magnetic resonance imaging (MRI), as a noninvasive examination tool, has been extensively applied to human ASD to delineate the brain morphometry and connectivity (Hazlett et al., 2005; Muller and Fishman, 2018; van Rooij et al., 2018). Numerous neuroimaging data in literature indicated alterations in brain morphology [e.g., cortical surface area, cortical thickness (CT), and gray matter volume] mainly in the frontal cortex, temporal cortex, and limbic/paralimbic regions (Hazlett et al., 2005; Ecker et al., 2015; Li et al., 2017). However, the majority of previous findings are inconsistent. The main reason could be the etiological and clinical heterogeneity of ASD. To address these caveats, one of the promising strategies is to conduct the study in a homogenous subgroup of ASD with confirmed genetic etiology. SHANK3-caused ASD thus presents a unique opportunity to understand the underlying neuropathological mechanisms.
Previous MRI studies in SHANK3-deficit patients are mostly single cases or case series with unsystematic approaches by visual MRI inspection resulting in a variety of gray and white matter structures found to be abnormal (Philippe et al., 2008; Soorya et al., 2013; Srivastava et al., 2019). A latest research from our team applying automated and unbiased whole-brain analyses to a relatively large sample revealed changes of striatum-centered gray matter volume in SHANK3-deficient children, suggesting possible alterations in large-scale brain networks (Liu et al., 2021). Although the volumetric morphometry is widely used to assess the brain structural alterations, it may still present some limitations that can be surpassed with surface-based morphometry (SBM). The cerebral cortex is arranged in a highly folded sheet with the majority of the cortical surface area buried in folds (Fischl et al., 1999). Surface-based algorithms can account for a better dissociation of information content and new forms of analyses regarding measuring cortical complexity in 3D space (Ghosh et al., 2010; Oosterhof et al., 2011). The surface measures such as gyrification index (GI) and sulcus depth (SD) allow the characterization of the cortical complexity, implicating the association with neurodevelopmental disorders, schizophrenia, and other cognitive disorders including ASD (Van Essen et al., 2006; Yang et al., 2016; Tang et al., 2021). However, little is known so far about the features of cortical surface morphology in patients with SHANK3 deficit.
Beyond local morphological analysis, graph theoretical approaches to structural covariance networks (SCNs) offer a useful way to characterize the topological organization of the brain structure. The basic assumption underlying SCNs is that morphological correlations are related to axonal connectivity between brain regions with shared trophic, genetic, and neurodevelopmental influences (Alexander-Bloch et al., 2013b; Seidlitz et al., 2018). Researchers recently began to study the associations between the SCNs and the intrinsic functional networks for salience, executive function, and default mode in both neurotypical children and adults (Zielinski et al., 2010; Bruno et al., 2017). In individuals with ASD, previous investigations of SCNs have reported a decrease in various regional or nodal topological properties mainly in the regions of insula, hippocampus, caudate, prefrontal cortex (PFC), and the regions related to social and sensorimotor processing as well as speech and language (Vissers et al., 2012; Sharda et al., 2016). To date, however, no study has uncovered how the topological architecture of SCNs disrupted in SHANK3-deficient ASD. This approach could help to further elucidate the role of dysconnectivity in both of the ASD with and without SHANK3 deficiency.
In the present study, we employed SBM as well as SCN approaches to explore the disruptions of cortical surface morphology (i.e., both local features and anatomical networks) in ASD children with and without SHANK3 deficiency. We hypothesized that there might be common as well as distinct disruptions of both local and networked cortical structural organization in ASD children with and without SHANK3 deficiency, which may help to parse the heterogeneity of brain disturbances in ASD.
Materials and Methods
Participants
All participants were recruited at the Children’s Hospital of Fudan University [details about recruitment can be found in Liu et al. (2021)]. In total, 69 children in three groups [SHANK3 group, idiopathic ASD control, and typically developing (TD) control] were scanned and eight subjects were excluded for the analysis due to the poor quality of images. Children with recognizable lesions or abnormalities on scans, cerebral palsy, or other neurologic or degenerative diseases were excluded. SHANK3 group: 12 participants were enrolled with SHANK3 deletion and/or mutation but without any other pathogenic or likely pathogenic variations [genetic testing details can be found in Liu et al. (2021)]. Idiopathic ASD control group: 24 ASD children without SHANK3 deficiency or known genetic etiology were recruited. TD control group: 25 children underwent MRI scan because of the first episode of febrile convulsion and paroxysmal dizziness or headache, but otherwise normal developing children were used as normal controls.
Autism spectrum disorder diagnosis was based on the DSM-5 (Grzadzinski et al., 2013), ADOS-2 (Gotham et al., 2007), and Autism Diagnostic Interview-Revised (Lord et al., 1994) administrated by certified clinicians. Developmental and cognitive levels were evaluated by Griffiths Mental Development Scales (Griffiths; Benatti et al., 1986) conducted by licensed and certified clinicians.
Image Acquisition and Preprocessing
T1-weighted images were acquired employing a high-resolution 3D T1-weighted BRAVO (BRA in Volume imaging) sequence with the GE 3.0 Tesla Discovery MR750 system (GE Medical Systems, Milwaukee, WI, United States) with a 32-channel head coil at the Radiology Department after parental consent. Sequence parameters were the following: repetition time (TR) = 8.2 ms; echo time (TE) = 3.2 ms; flip angle = 12°; voxel size = 1 mm × 1 mm × 1 mm; gap = 0; FOV = 256 mm × 256 mm; and matrix = 256 × 256. Participants were routinely sedated in the “Sedation Center” under the supervision of a licensed clinician or anesthesiologist. Children are given chloral hydrate at a dose of 50 mg/kg orally approximately 1 h prior to the MRI scan. Vital signs were monitored and recorded during the scan.
The images were imported in the CAT121 toolboxes implemented in the Statistical Parametric Mapping software package (SPM12)2 on the platform of Matlab (Version R2014b, MathWorks Inc., Natick, MA, United States). All the T1-weighted images were then segmented into gray matter, white matter, and cerebrospinal fluid and spatially normalized using the DARTEL algorithm (Ashburner, 2007). Gray matter-segmented images were submitted to the Check Sample Homogeneity by using the function embedded in CAT-12. Then, the segmented images were smoothed with a 6-mm full-width at half-maximum (FWHM) Gaussian kernel. At the end of this preprocessing, modulated, smoothed, normalized images were obtained for statistical analysis. Besides, the image quality rating (IQR) generated by CAT12 served as the parameter for imaging quality control.
This study was approved by the ethics committee of Children’s Hospital of Fudan University, and all of the procedures were in accordance with the Declaration of Helsinki.
Surface-Based Morphometry Analysis
To characterize cortical morphological features, an SBM analysis was conducted using the CAT12 toolbox to estimate CT and the central surface of hemispheres based on the projection-based thickness (PBT) approach (Dahnke et al., 2013). The left and right CT maps and the additional surface parameters, including fractal dimension (FD), GI, and SD, were resampled to the HCP 32k surface mesh and smoothed with a 15-mm FWHM Gaussian kernel for the CT estimates and 20-mm FWHM for the rest parameters as suggested by CAT 12. CT is obtained by projecting the local maxima of white matter distance after tissue segmentation onto other gray matter voxels, which measures the distance between the inner and outer surfaces (Dahnke et al., 2013). FD is defined as the slope of a logarithmic plot of surface area versus a measure of the bandwidth of frequencies in the reconstructed surface shape based on a spherical harmonic reconstruction approach, measuring the surface complexity (Yotter et al., 2011). Local GI is defined as the estimations of “smoothed absolute mean curvature” within a spherical surface mesh, revealing the degree of cortical convolution (Luders et al., 2006). SD is defined as the square root-transformed Euclidean distance between the central surface (half way between the inner and outer surfaces) and its convex hull.
Structural Covariance Networks Approach
Considering the popularity in previous studies, here we merely selected the CT for structural covariance estimation (He et al., 2007; Alexander-Bloch et al., 2013a). The effects of age, gender, and overall mean CT were regressed from the mean thickness of each brain region, and the residuals were used for the subsequent steps of the analysis. Structural covariance analysis was conducted in the regions of interest (ROIs) defined by the HCP-MMP1.0 atlas (Glasser et al., 2016) which contains 180 regions for each hemisphere. Pearson correlations were applied between the CT of each possible pair of ROIs to generate a 360 × 360 cortical covariance matrix for each group (Figure 1). Considering that the network organization of the human brain is economic and small-world, the covariance matrix was then binarized and sparsified (i.e., 15%) according to previous studies (Bassett et al., 2008; Yin et al., 2019). The graph theory was finally used to characterize the topological properties of the SCNs. Here, we employed a network efficiency measure to quantify the small-world property of the SCNs following our previous work (Yin et al., 2014). This efficiency metric can deal with disconnected graphs and provides a clear physical meaning for the topological characterization of the networks (Latora and Marchiori, 2001). The global efficiency (GE) of graph G can be calculated as
where N is the number of nodes; Lij is the shortest path length between nodes i and j in graph G (i.e., the minimal number of edges that has to be traveled to go from nodes i to j).
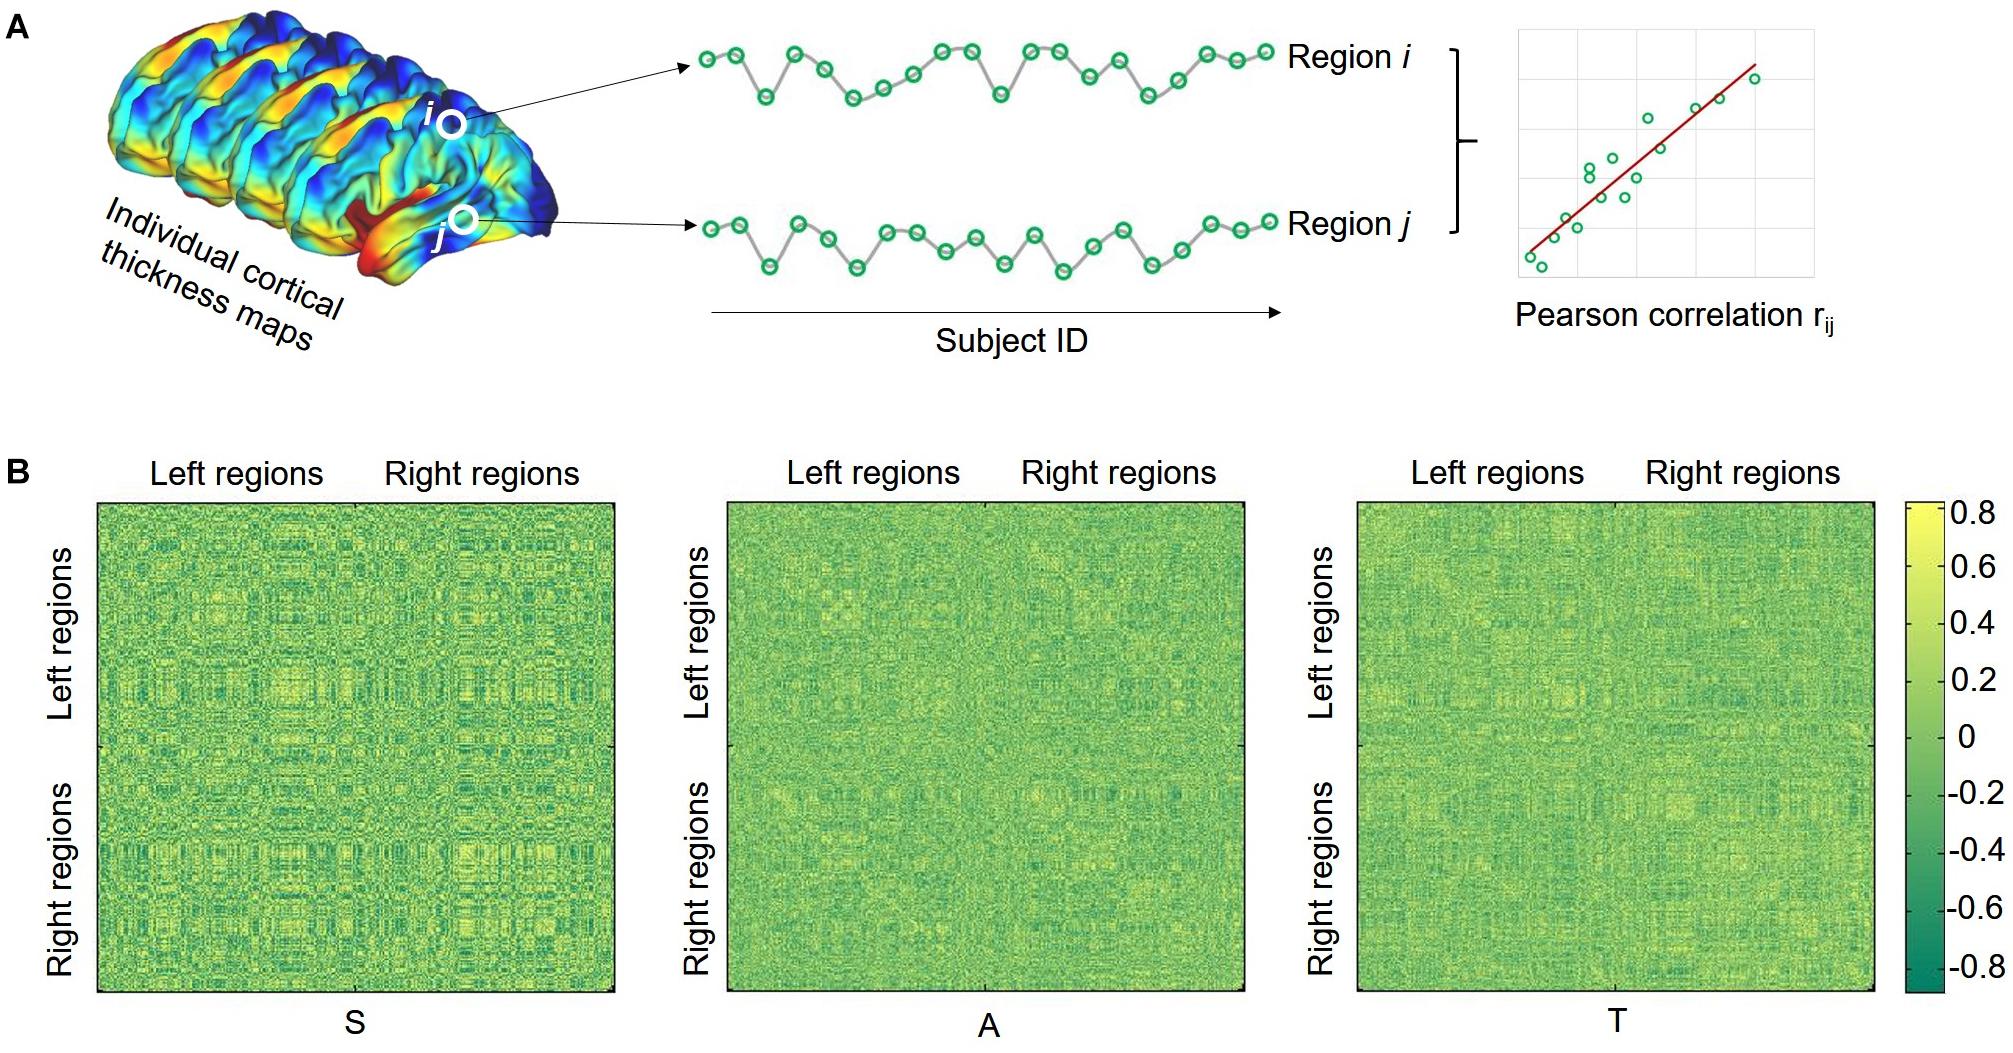
Figure 1. Illustration of calculating structural covariance connectivity between two regions (A) and structural covariance matrix for each group (B). S, SHANK3 group; A, ASD group; and T, typical developing group.
The local efficiency (LE) of graph G is measured as
where Gi denotes the subgraph composed of the nearest neighbors of node i.
Practically, a network can be categorized as a small-world network if GE is slightly less than and LE is much greater than the matched random networks with the same number of nodes, edges, and degree distribution. For comparison purposes, we generated random networks using the random rewiring procedure that preserves degree distribution as the real network (Maslov and Sneppen, 2002). Thus, a small-world network should meet the following criteria: LE (real)/LE (random) > 1 and GE (real)/GE (random) ≈ 1 (Wang et al., 2009). To explore small-world efficiency, we also calculated the normalized GE = GE (real)/GE (random) and normalized LE = LE (real)/LE (random).
In addition, we calculated the nodal degree, which is commonly used to identify network hubs. Degree is defined as the number of immediate neighbors of a given node.
Statistical Analysis
Demographic and clinical data were analyzed using the statistical package SPSS 20.0. The threshold for all statistical significance was set at p < 0.05. Age, sex, developmental quotient, and total cranial volume were included as nuisance covariates.
For SBM, analysis of covariance (ANCOVA) was applied to the global mean values of each morphological parameter for the three groups followed by post-hoc t-tests. Age, sex, and total cranial volume were included as covariates. At the vertex-wise level, one-way ANOVA was conducted among the three groups and significant clusters with false discovery rate (FDR) corrected were further picked up in CAT12. For each metric, post-hoc t-tests between each two groups were performed taking the significant result of ANOVA as the explicit mask. Age, sex, and total intracranial volume were included as nuisance covariates. Significance was set at p < 0.05 (FDR corrected).
For SCNs, a nonparametric permutation test was carried out to identify statistical significance of the between-group differences in network metrics. Briefly, we first calculated the difference of each network metric between groups. A null distribution of the difference for each metric was then obtained by randomly reallocating each subject’s set of regional CT estimates to one or the other of the two groups and recomputing the difference of each metric between two randomized groups. Note that we calculated the network metrics for each randomized group using the same sparsity threshold as in the real brain networks. This randomization procedure was repeated 1,000 times, and the 95 percentile points of each distribution were used as the critical values for a one-tailed test of the null hypothesis with a probability of type I error of 0.05 (He et al., 2008). For the between-group comparisons of nodal degree, the FDR correction method was applied to correct multiple comparisons for N = 360 regions.
Spearman rank correlation analysis was conducted between the altered brain morphological features in SHANK3 and ASD groups and the clinical characteristics. Significance correction for multiple comparisons was applied using FDR correction (p < 0.05).
Results
Participant Characteristics
No significant differences in age (for the SHANK3 group, mean ± SD: 4.9 ± 3.2 years; for the ASD group, mean ± SD: 4.0 ± 1.9 years; and for the typically developed group, mean ± SD: 4.9 ± 2.4 years) and sex (for the SHANK3 group, 6 males and 6 females; for the ASD group, 20 males and 4 females; and for the typically developed group, 19 males and 6 females) between groups (all p values > 0.05). Compared to idiopathic ASD children, the SHANK3 group achieved similar scores in each domain and severity of ADOS-2 but exhibited a significantly worse performance in all of the developmental domains of Griffith (gross motor: p < 0.0001; social: p = 0.002; language: p < 0.0001; fine motor: p = 0.0004; adaptability: p = 0.006). Detailed demographic information and clinical characteristics by group are presented in Table 1.
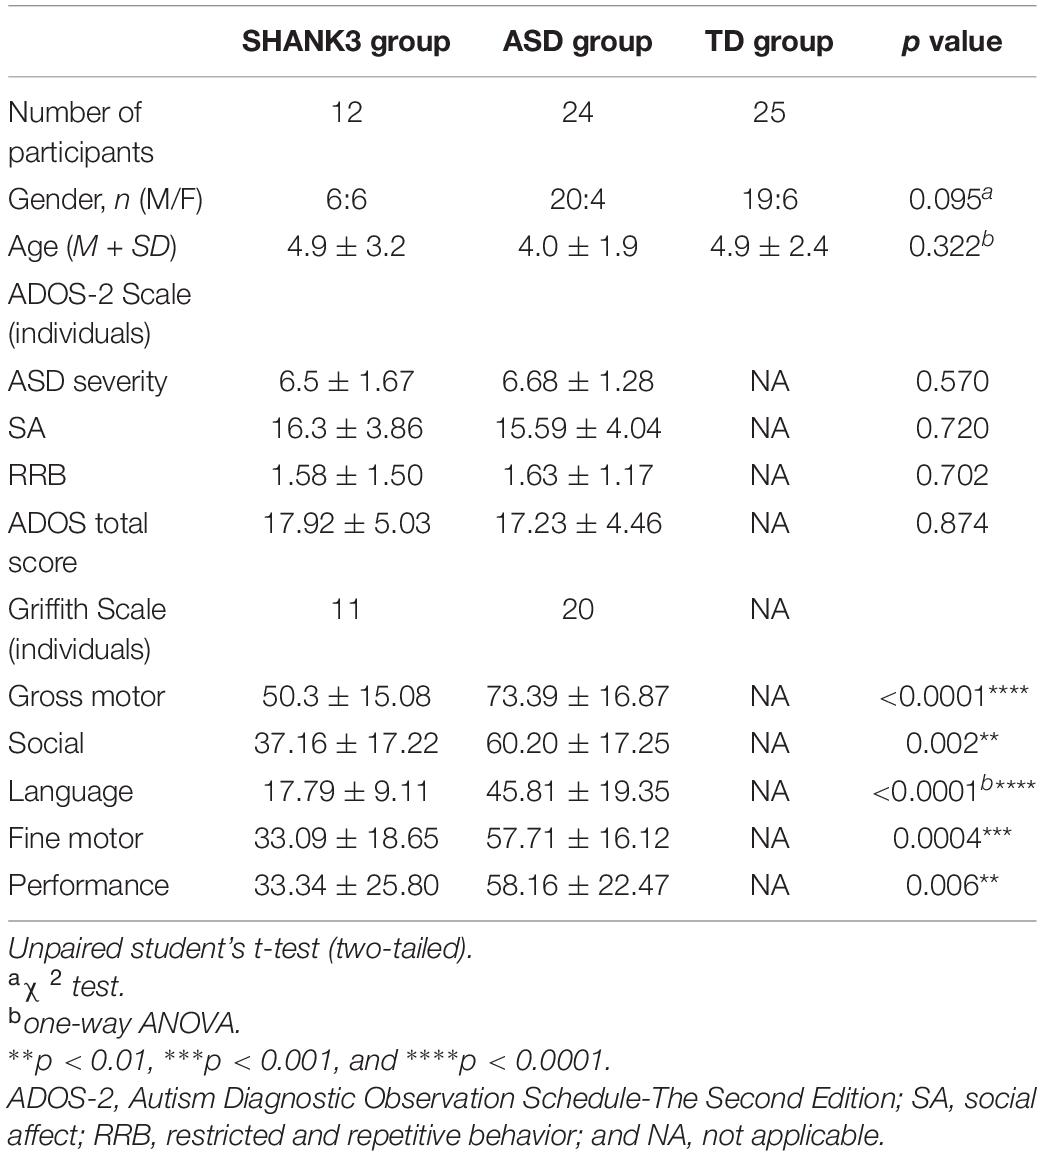
Table 1. Summary of clinical characteristics of studying subjects.
Inter-Group Differences in Surface-Based Morphometric Features
No group differences were found in all of the imaging quality control parameters, including the six absolute head motion parameters and IQR (for the SHANK3 group, mean ± SD: 0.907 ± 0.006; for the ASD group, mean ± SD: 0.906 ± 0.005; and for the typically developed group, mean ± SD: 0.908 ± 0.006; p > 0.05).
At the global level, we found that the averaged CT is 2.96 ± 0.57 mm for the SHANK3 group, 2.58 ± 0.55 mm for the ASD group, and 2.81 ± 0.5 mm for the TD group; the averaged FD in the SHANK3 group was 2.64 ± 0.34, in the ASD group 2.66 ± 0.35, and in the TD group 2.65 ± 0.35; the average SD in the SHANK3 group was 2.86 ± 0.77 mm, in the ASD group 2.89 ± 0.85 mm, and in the TD group 2.90 ± 0.85 mm; the average GI in the SHANK3 group was 27.29 ± 0.5°, in the ASD group 27.19 ± 0.45°, and in the TD group 27.28 ± 0.46°. For the individual raw values, please see Supplementary Table 1. ANCOVA analysis revealed a significant difference of CT among the three groups (F = 8.64, p = 0.001). In the post-hoc analysis, the ASD group showed significantly decreased CT than the TD group (t = 3.86, p < 0.0001) and the SHANK3 group showed increased CT than the TD group (t = 2.18, p = 0.036; Figure 2). No significant difference was found between the SHANK3 group and the ASD group for CT. In addition, no significant differences were found for the FD and SD among the three groups with ANCOVA analysis (Figure 2).
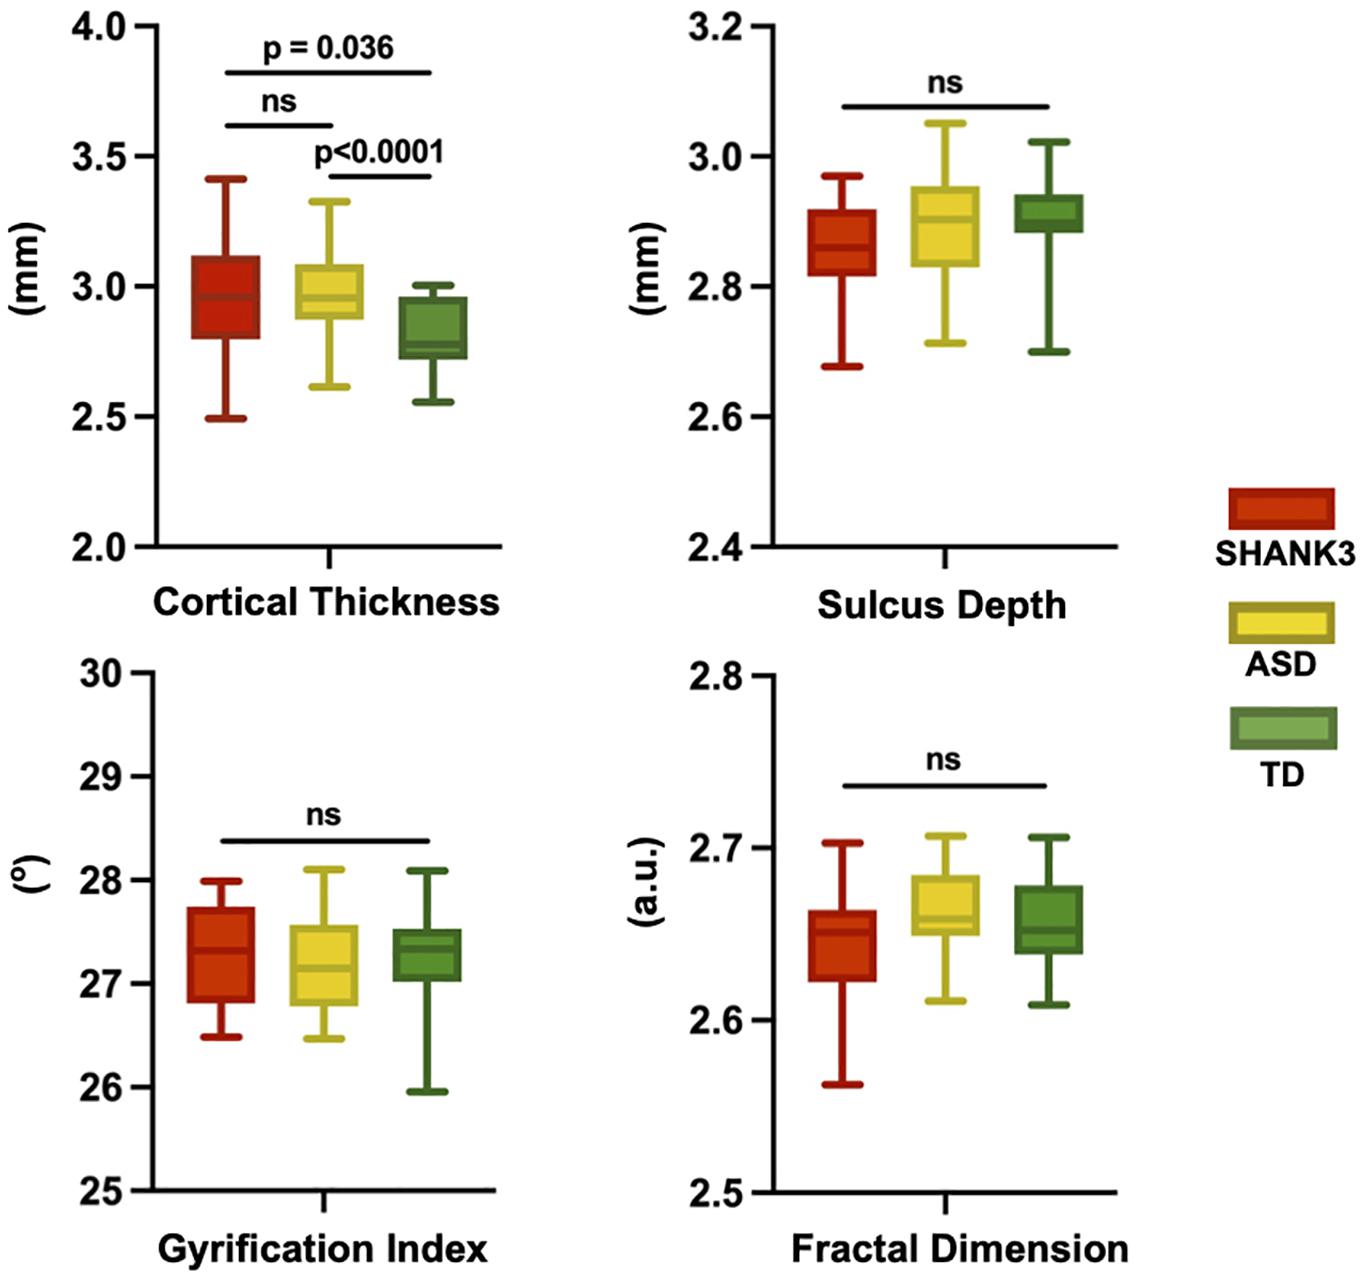
Figure 2. Global leveled ANCOVA analysis showed significant difference of cortical thickness among the three groups. Post-hoc t-tests revealed significantly decreased cortical thickness in the ASD group but increased cortical thickness in the SHANK3 group compared to the TD group. No significant differences were found for the fractal dimension and sulcus depth among the three groups for ANCOVA analysis. ns, not significant; a.u., arbitrary unit.
At the vertex level, through the vertex-wise ANOVA analysis of CT, we found significant differences among the three groups mainly in the regions of the dorsolateral prefrontal cortex, inferior frontal cortex (IFC), auditory areas, lateral temporal cortex (LT), inferior parietal gyrus, dorsal visual streams, temporo-parieto-occipital junction (TPJ), parahippocampus (paraHIP), orbitofrontal cortex (OFC), anterior cingulate cortex (ACC), medial visual areas, and parieto-occipital sulcus (p < 0.05, FDR corrected; Figure 3A). In the post-hoc analysis, the SHANK3 and ASD groups showed significantly increased CT mainly in the lateral temporal, prefrontal, primary auditory (part of superior temporal gyrus, STG), and temporo-parietal junction (TPJ) as well as limbic/paralimbic regions including the ACC, OFC, temporal pole, and paraHIP, compared with TD controls (p < 0.05, FDR corrected; Figure 3D). Notably, the SHANK3 group showed more disruptions in STG than the ASD group, while the latter showed more disruptions in the TPJ and inferior parietal lobule (IPL; Figure 3D). No significant difference was found between the SHANK3 group and the ASD group for CT. For the FD, ANOVA analysis revealed significant differences among the three groups mainly in the regions of the IPL, ACC, and OFC (Figure 3B). In the post-hoc analysis, the ASD group showed increased FD in a small region of the left IPL when compared with the SHANK3 and TD groups, while the SHANK3 group showed decreased FD in the left OFC in comparison with ASD and TD groups (Figure 3E). For the SD, the SHANK3 group showed decreased SD in the left primary auditory region (part of STG; Figures 3C,F) when compared with the ASD and TD groups. No group differences were found in local GI.
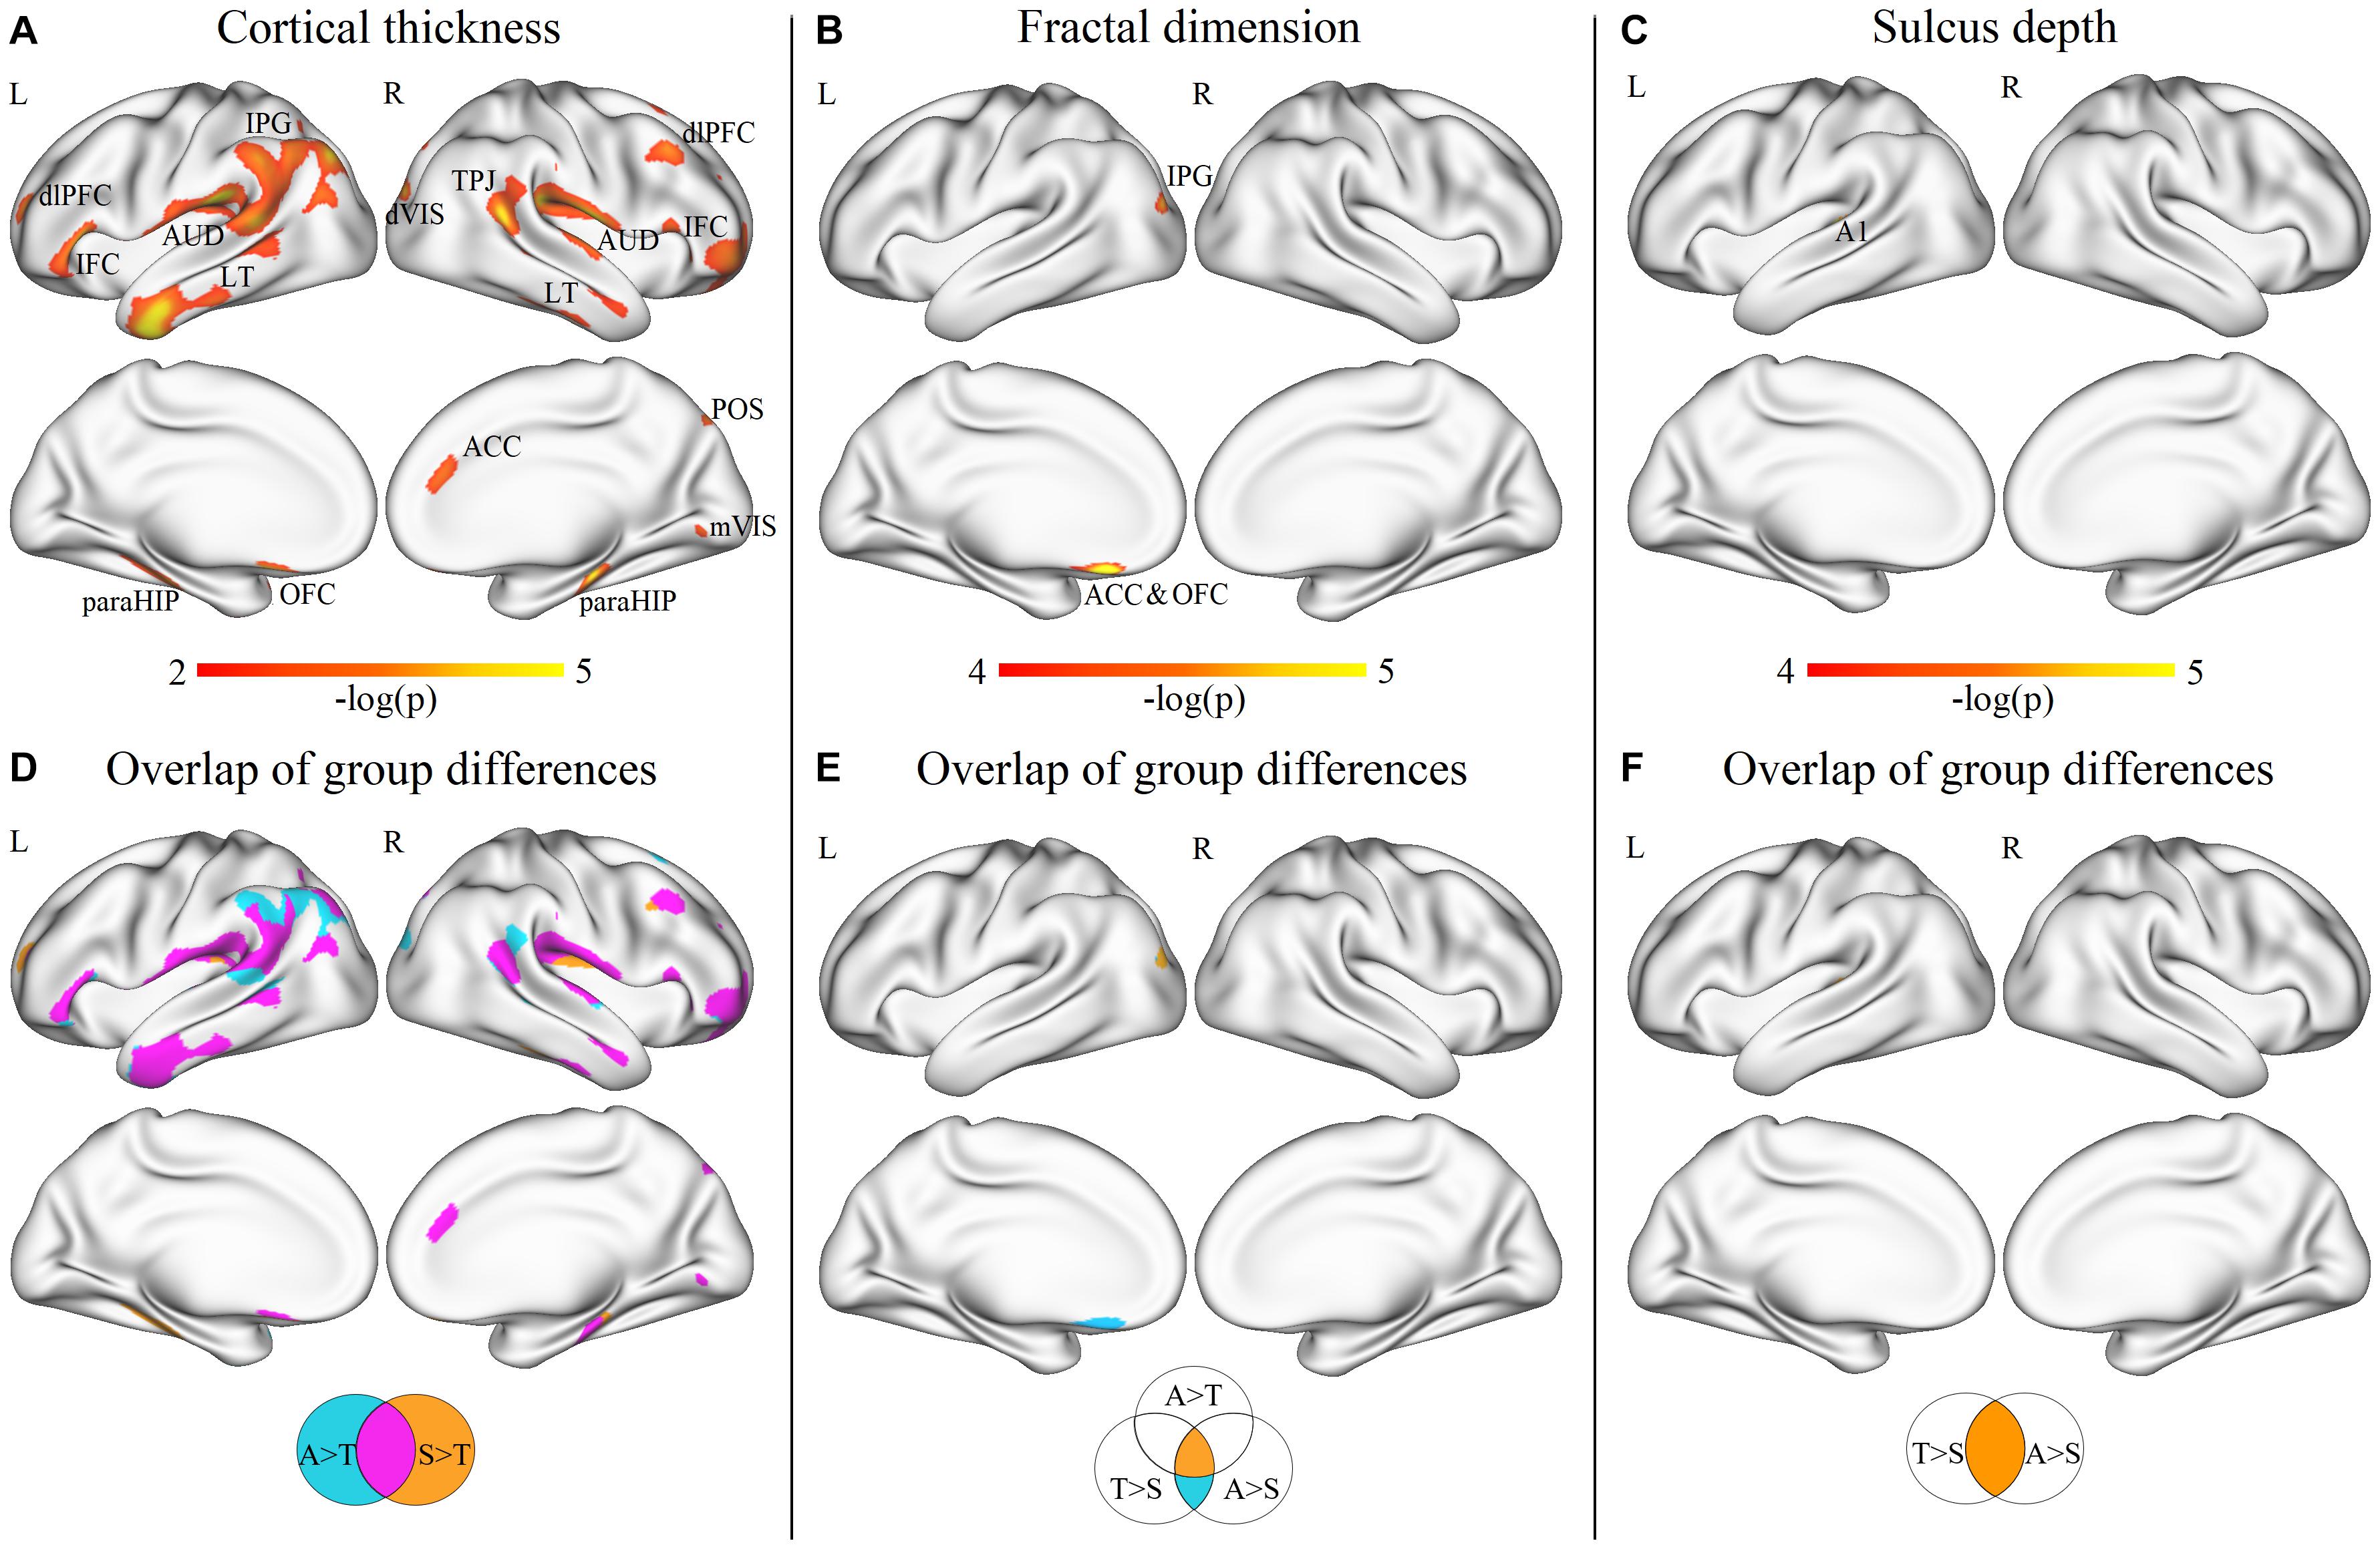
Figure 3. Vertex-wise ANOVA results and the overlap areas of intergroup differences. Significant differences of cortical thickness (A), fractal dimension (B), and sulcus depth (C) among ASD, SHANK3, and TD groups; the overlap areas of intergroup differences in cortical thickness (D), fractal dimension (E), and sulcus depth (F). dlPFC, dorsolateral prefrontal cortex; IFC, inferior frontal cortex; AUD, auditory areas; LT, lateral temporal cortex; IPG, inferior parietal gyrus; dVIS, dorsal visual streams; TPJ, temporo-parieto-occipital junction; paraHIP, parahippocampus; OFC, orbitofrontal cortex; ACC, anterior cingulate cortex; mVIS, medial visual areas; POS, parieto-occipital sulcus; and A1, primary auditory cortex. A, ASD; T, TD; and S, SHANK3.
Inter-Group Differences in Topological Properties of Structural Covariance Networks
At the global level, we found that the SHANK3-deficient children exhibited a decrease in GE (p = 0.001) and an increase in LE (p = 0.021) compared to TD controls, while ASD children showed no significant differences in either global or LE compared with TD (p > 0.05). Compared with ASD children, SHANK3-deficient children exhibited a decrease in GE (p = 0.001) and an increase in LE (p = 0.015). In contrast, we found a significant increase in normalized LE in SHANK3-deficient compared with ASD groups, as well as in ASD compared with TD groups, while no significant differences were observed in normalized GE among the three groups (Figure 4).
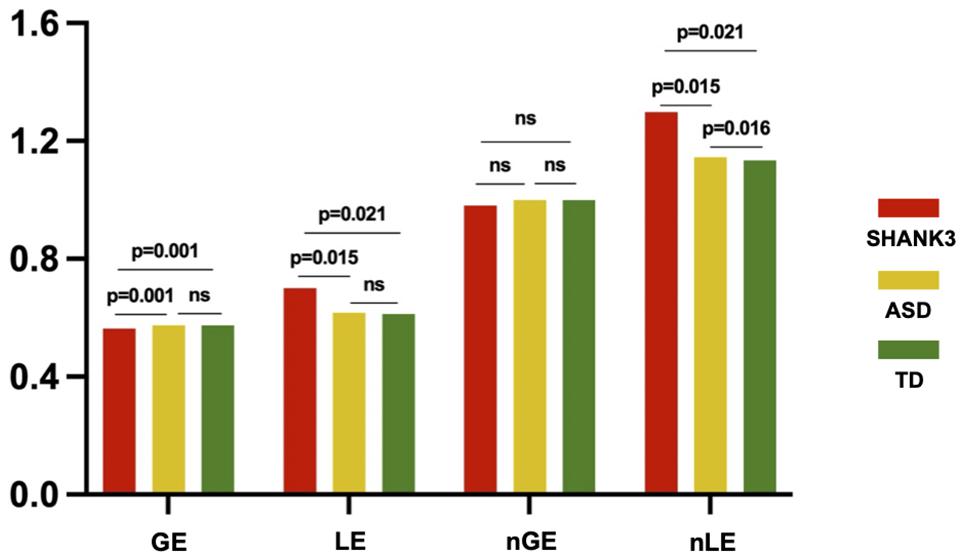
Figure 4. Intergroup differences in global efficiency and local efficiency between the SHANK3, ASD, and TD groups. The orange color indicates the SHANK3 group, the yellow color indicates the ASD group, and the green color indicates the TD group; network sparsity = 15%. ns, not significant; GE, global efficiency; LE, local efficiency; nGE, normalized global efficiency; and nLE, normalized local efficiency.
For regional network analysis, group differences in nodal degree between every two groups were detected (all p < 0.05, FDR corrected). In contrast with TD controls, ASD without SHANK3 deficiency showed significantly decreased nodal degrees mainly in sensorimotor areas, the left insular, and the right ACC and dorsomedial PFC (Figure 5A), while ASD with SHANK3 deficiency showed decreased nodal degrees mainly in the left ACC, and the right insular cortex, posterior cingulate cortex (PCC), and medial visual cortex (Figure 5B). To overlap the between-group results, we observed a common reduction of the nodal degree in the prefrontal, IPL, and insular areas in both ASD with and without SHANK3 deficiency compared with TD controls (Figure 5D). To compare with the ASD group, the SHANK3 group showed an increment of nodal degree in the ACC, premotor cortex, primary auditory cortex (part of STG), and visual areas in contrast with the ASD group (Figure 5C). Notably, the regions of disruptions of nodal degree in these two groups were geometrically close but distinct in the paracentral lobule, IFC, LT, and superior and IPL (Figure 5D).
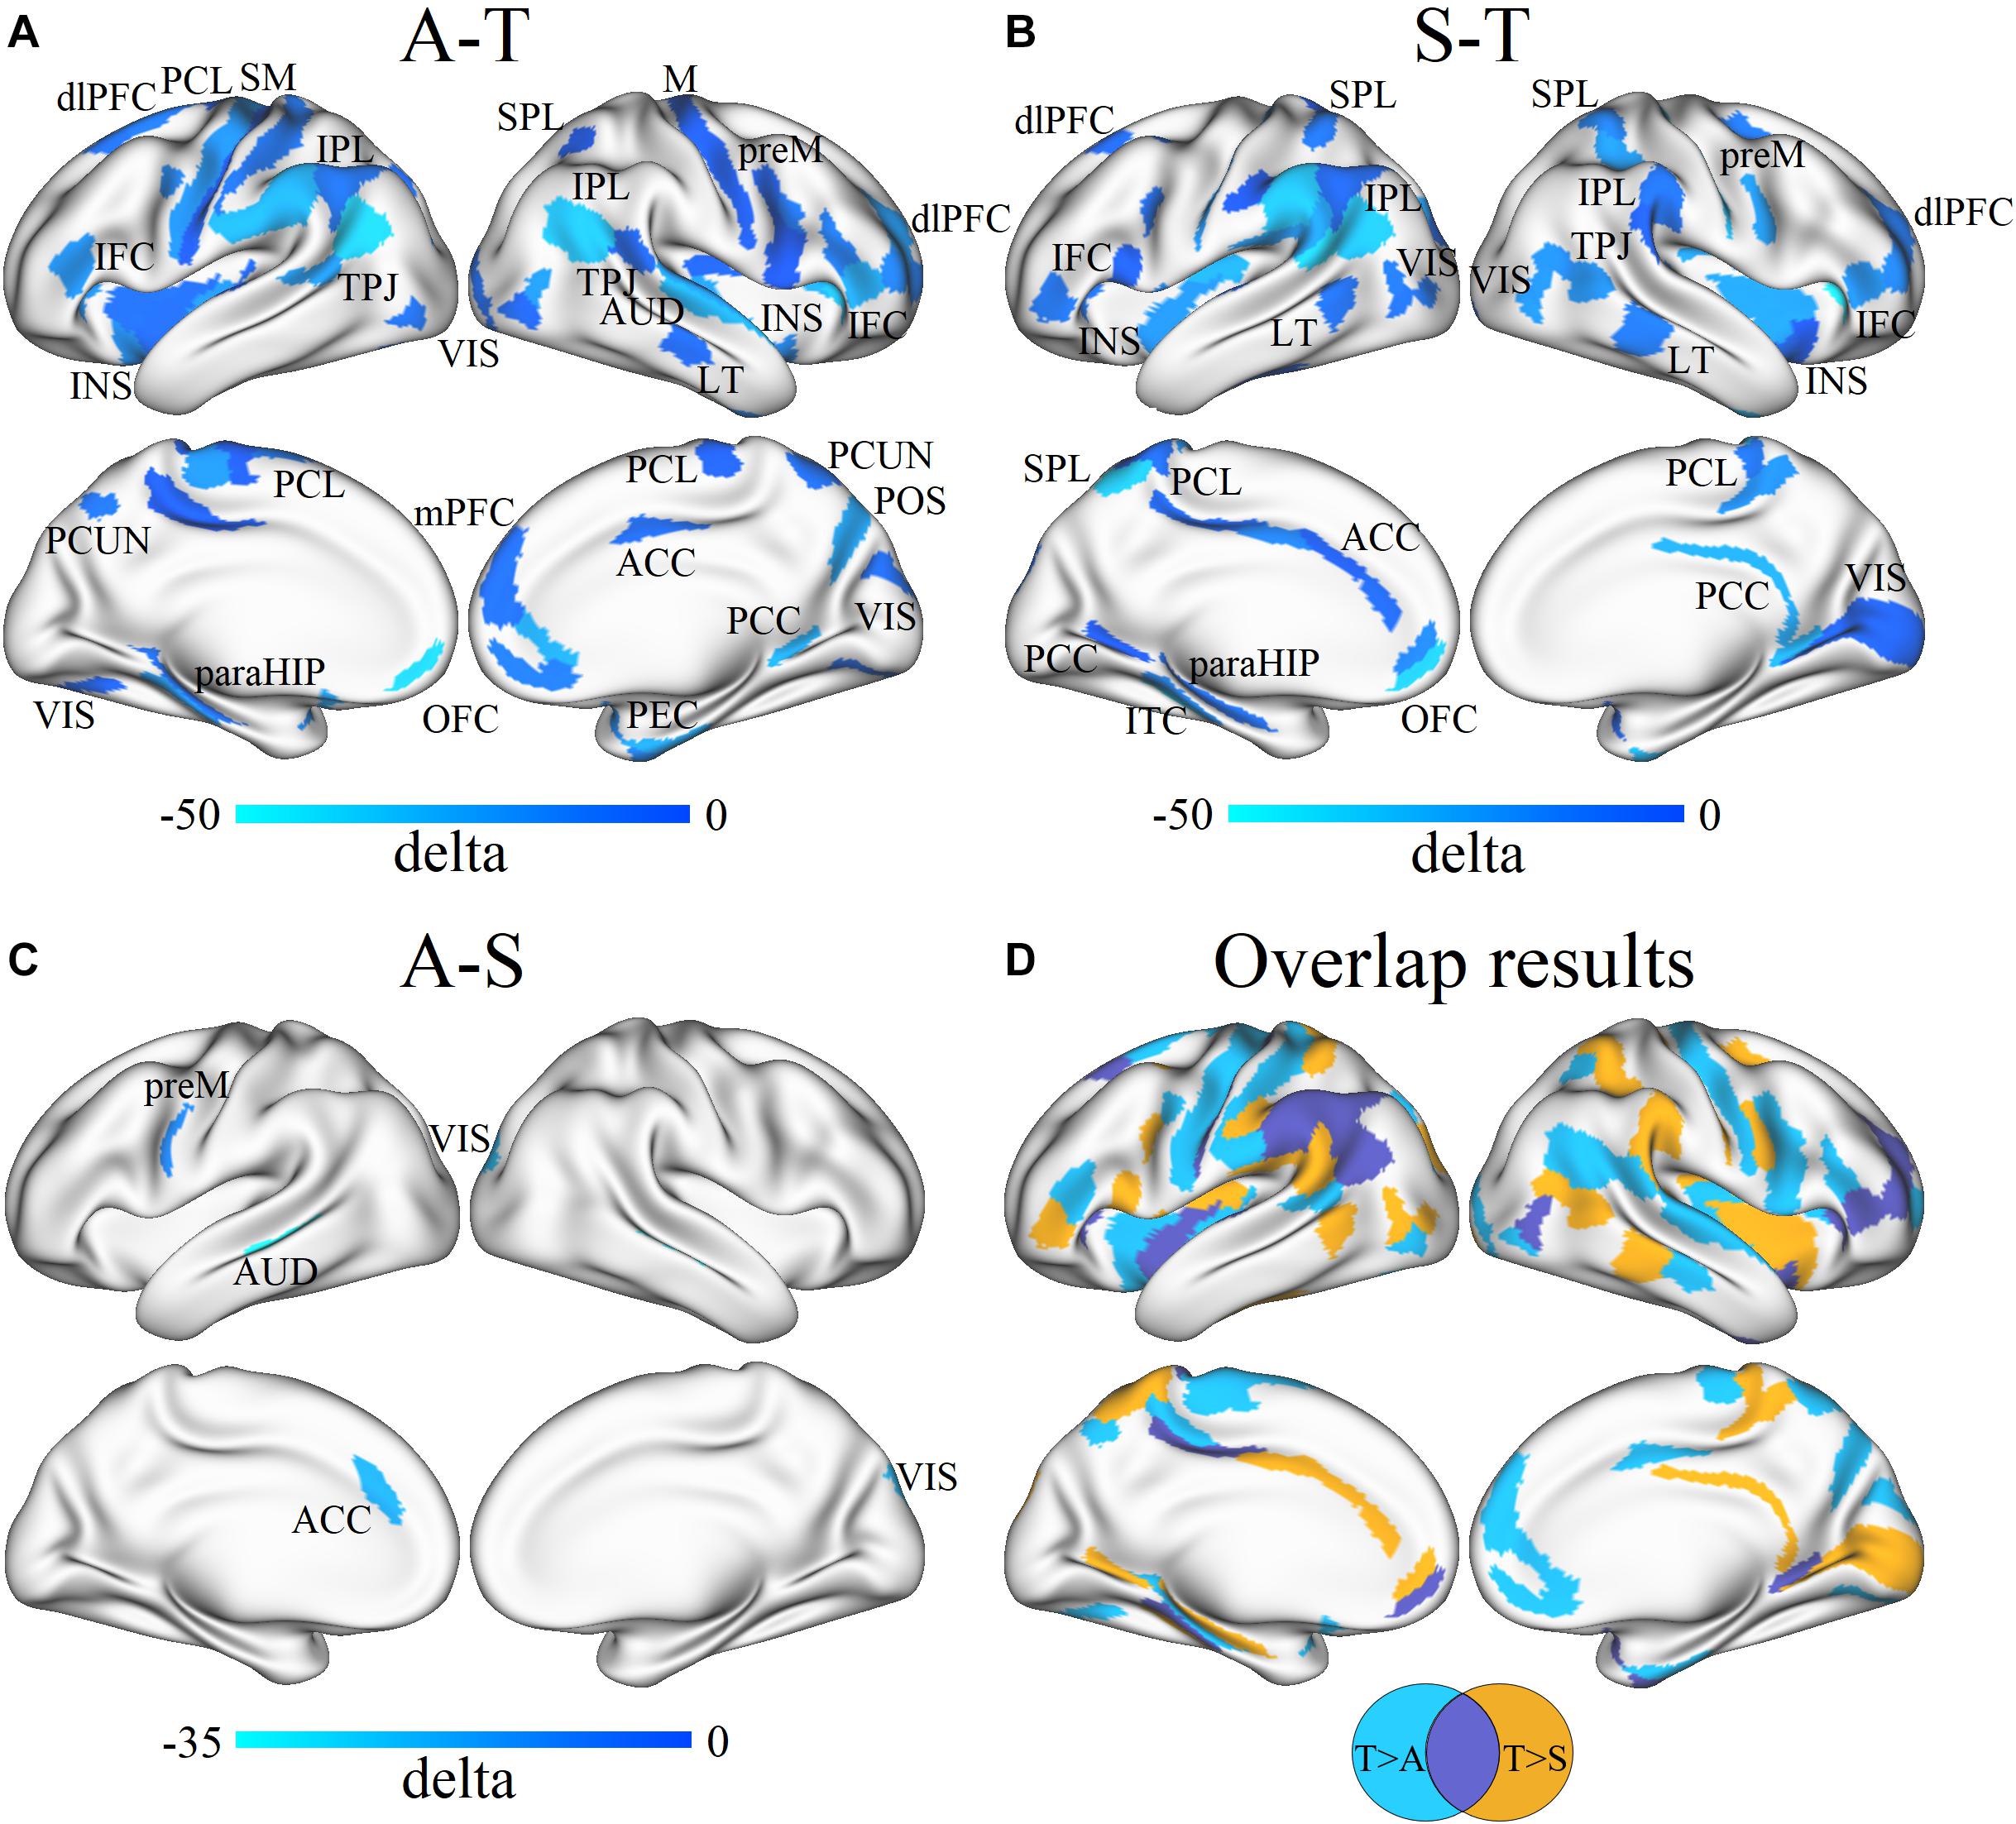
Figure 5. Differences in the group mean of nodal degree between ASD, SHANK3, and TD groups and the overlap results. Group differences in nodal degree between ASD and TD (A), SHANK3 and TD (B), and ASD and SHANK3 (C), and overlap results between the group differences (D). Blue and light blue colors indicate ASD < TD in (A), SHANK3 < TD in (B), and ASD < SHANK3 in (C), respectively. dlPFC, dorsolateral prefrontal cortex; PCL, paracentral lobule; SM, somatosensory and motor cortex; IFC, inferior frontal cortex; INS, insular; IPL, inferior parietal lobule; TPJ, temporo-parieto-occipital junction; VIS, visual areas; SPL, superior parietal lobule; M, motor cortex; preM, premotor cortex; AUD, auditory areas; LT, lateral temporal cortex; ACC, anterior cingulate cortex; PCC, posterior cingulate cortex; PCUN, precuneus; POS, parieto-occipital sulcus; paraHIP, parahippocampus; OFC, orbitofrontal cortex; and PEC, perirhinal and ectorhinal_cortex. A, ASD; T, TD; and S, SHANK3.
Correlations Between Clinical Characteristics and Cortical Morphology
Spearman rank correlation analysis was conducted to explore the relationship between the disruptions of cortical morphological features and clinical assessments in ASD and SHANK3 groups, and then FDR correction was performed (corrected p < 0.05). The disruptions of FD in a region of the left IPL in both ASD children with and without SHANK3 deficiencies were related to general DQ (r = 0.597, p < 0.001), gross motor (r = 0.466, p = 0.011), social (r = 0.507, p = 0.005), language (r = 0.535, p = 0.003), fine motor (r = 0.517, p = 0.004), and performance (r = 0.545, p = 0.002; Figure 6). Correlations between other cortical morphological features (incl. CT, SD, and GI) and the clinical assessments were not significant.
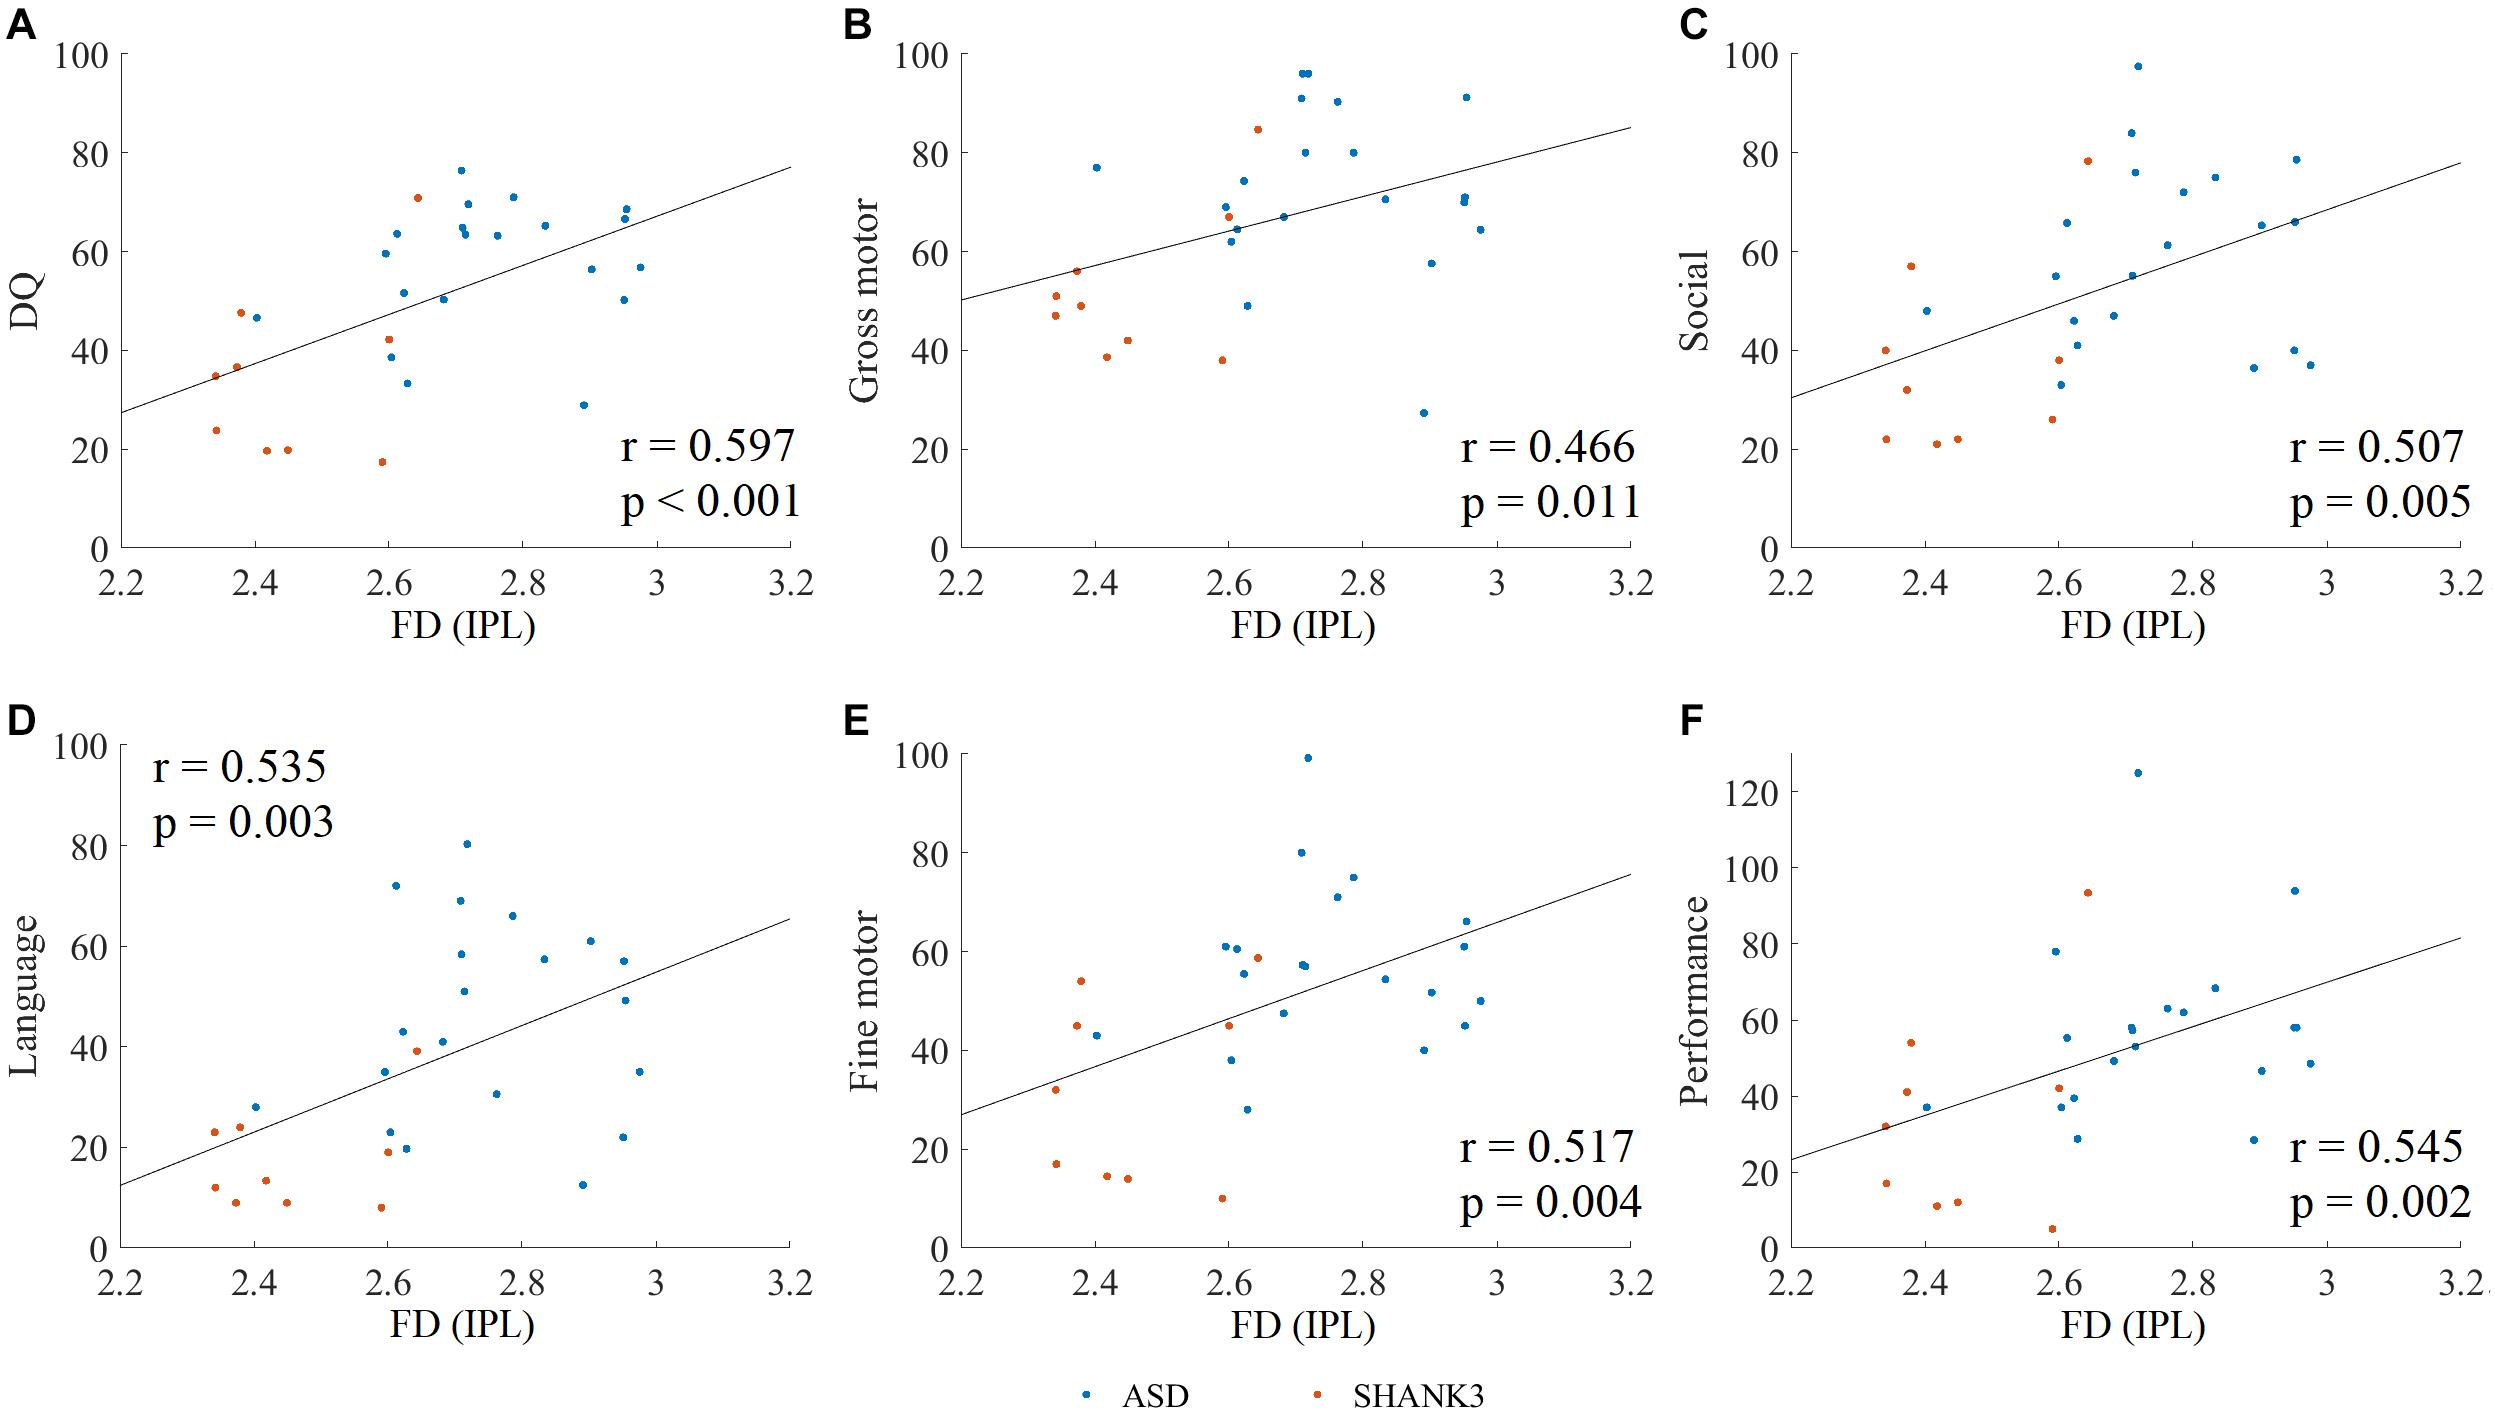
Figure 6. Spearman rank correlation between clinical assessments and altered fractal dimension (FD) in ASD and SHANK3 groups. The Spearman rank correlation between the altered FD and DQ scores (A), gross motor (B), social (C), language (D), fine motor (E), and performance (F). IPL, inferior parietal lobule. A, ASD; S, SHANK3; and T, TD.
Discussion
Our study demonstrated some common and distinct disruptions of both local and networked cortical structural organization in ASD children with and without SHANK3 defects. Locally, increased CT was found in both ASD children with and without SHANK3 defects mainly in the LT, PFC, TPJ, STG, and limbic/paralimbic regions. As to the networked cortical organizations, the majority of the above regions were observed with reduction of the nodal degree. Fitting with the idea that SHANK3 deficiency shares some common patterns of cortical structural alterations with ASD, SHANK3 deficiency thus provides a unique opportunity to understand the underlying neuropathological mechanisms as a homogenous subgroup of ASD.
The social deficits and repetitive and stereotyped behaviors are the core symptoms of ASD (Grzadzinski et al., 2013). It is well known that language expression is the vital part of social interaction. The clinical manifestations of SHANK3 deficiency include ASD, global developmental delay, delayed or absent speech, intellectual disability, and motor abnormalities (Soorya et al., 2013; Leblond et al., 2014). The penetrance of the ASD phenotype in patients with SHANK3 deficiency has been reported from 84.4 to 92.8% (Soorya et al., 2013; Liu et al., 2021). In consistency with these previous reports, our current clinical assessment data demonstrated that both ASD children with and without SHANK3 defects showed social interaction impairments and repetitive behaviors (ADOS-2) as well as language developmental delay (Griffith language domain). Along with the clinical data, increased CT as well as networked alterations were revealed in the PFC, TPJ, STG, and limbic/paralimbic regions. The PFC, TPJ, and STG are the most consistently reported neural correlates of social-cognitive functions (Wolf et al., 2018).
Superior temporal gyrus, responsible for language comprehension, face processing, and social cognition, has been proved to be associated with ASD (Bigler et al., 2007; Jou et al., 2010; Ameis and Catani, 2015). As the area where the temporal and parietal lobes meet, the TPJ incorporated information from the thalamus, the limbic system, and somatosensory systems and plays an important role in social perception as well as theory of mind (ToM; Poletti et al., 2012; Bitsch et al., 2018). Neuropsychological studies suggested that individuals with ASD showed ToM deficits which result in the disabilities to initiate and sustain reciprocal social interactions (DiLalla et al., 2017; Tordjman et al., 2019). The PFC, even in cross-species ASD models, has been proved to be the critical hub for emotional and social behavior, as well as executive functions (Chini and Hanganu-Opatz, 2021; Yan and Rein, 2021). Additionally, the limbic/paralimbic structural alterations in ASD suggested that the paralimbic–limbic system is closely related to repetitive and stereotyped behaviors (Catani et al., 2013; Li et al., 2018).
From the perspective of the brain network, we found that the SHANK3 group showed a significant increase in LE compared with ASD and TD groups. Instead, the GE in the SHANK3 group is slightly lower than that in ASD and TD groups. No significant differences in either local or GE were observed between ASD and TD groups. This result suggests that the configuration of the SCN in SHANK3 children shifts toward a topology of regular network, which is a nonoptimal network configuration. Actually, the trend toward a regular network topology has often been observed in other neuropsychiatric disorders (De Vico Fallani et al., 2007; Yin et al., 2014). In contrast, the ASD children without SHANK3 defects appear to reserve a relatively intact global topology in SCN.
At the nodal level, our results revealed a common reduction of the nodal degree as the networked parameter alterations in the PFC, IPL, and insular cortex in both ASD children with and without SHANK3 defects. These findings were consistent with our previous assumptions that there might be possible alterations in large-scale brain networks in ASD children with and without SHANK3 defects (Liu et al., 2021). IPL and dorsolateral PFC are the core components of the frontoparietal network (FPN) or also known as central executive network (CEN) which is crucial for attention sustenance, decision-making, working memory, and cognitive control (Seeley et al., 2007; van Oort et al., 2017). FPN/CEN is one of the three networks in the “triple-network model,” along with the salience network (SN) and the default mode network (DMN; van Oort et al., 2017; Wei et al., 2019). Disruption of FPN may account for the impairment in cognitive flexibility in ASD (Holiga et al., 2019), and reshaping of FPN connectivity might improve the cognitive–behavioral problems in ASD (De Luca et al., 2021). TPJ and PFC are part of DMN which is implicated in self-monitoring, ToM, and social cognition (Buckner et al., 2008; Sarasua et al., 2014). Functional connectivity studies have provided evidence for abnormal connectivity pattern of DMN and its subnetworks in individuals with ASD (von dem Hagen et al., 2013; Abbott et al., 2016). SN, which is composed of insula and ACC, orients attention toward salient information and facilitates switching between the FPN and DMN (Hermans et al., 2014; van Oort et al., 2020). Children with ASD exhibited both functional “over-” and “under-” connectivities in between the SN, DMN, and CEN (Lawrence et al., 2020; van Oort et al., 2020). Our morphological and network-based structural disruptions are consistent with these prior studies which may reflect a structural basis for the functional imbalance between these large-scale brain networks.
Interestingly, besides the common alterations, our study revealed some distinct abnormalities in ASD children with SHANK3 defects compared to those without. Locally, more changes in STG and OFC were exhibited in ASD children with SHANK3 defects, while those without SHANK3 defects showed more changes in TPJ and IPL. On the networked level, ASD children with SHANK3 defects showed more alterations of nodal degrees in ACC and PCC and right insula, while ASD without SHANK3 defects exhibited more disruptions in the sensorimotor areas, the left insula, and dorsomedial PFC. SHANK3 protein is expressed highest in the cortico-striatal glutamatergic synapses (Shepherd, 2013; Monteiro and Feng, 2017). The medial orbitofrontal cortico-striatal loop originates in the OFC then projects to the caudate, putamen, and pallidum and then closes with projections returning to the OFC which shares reciprocal connections with ACC, PCC, STG, hippocampus, and parahippocampal cortex (Elliott et al., 2000; Jarbo and Verstynen, 2015). The current results supported the assumption of our previous study which suggested dysfunction of cortico-striatal connectivity in children with SHANK3 defects (Liu et al., 2021).
Although large-scale studies sequenced numerous patient samples, there was only a maximum of 30% of ASD cases identified with genetic causes with no single gene contributing to greater than 2% of cases (Boyle et al., 2017; Dias and Walsh, 2020). One of the major reasons for the explanation is generally acknowledged as the etiological and clinical heterogeneity of ASD. Our monogenetic subgroup of ASD children with SHANK3 defects exhibited both common and distinct disruptions in local and networked structural organization compared to those idiopathic ASD, suggesting both common and distinct neuropathological mechanisms underlying ASD with and without SHANK3 deficiency. Differentiating the heterogeneity in ASD is critical to both clinicians and researchers to understand the phenotype and pathophysiology of the syndrome (Agelink van Rentergem et al., 2021; Ziats et al., 2021). Our study of monogenic ASD patients may thus offer new insights into the diverse findings of previous neuroimaging studies of idiopathic ASD.
There were several limitations of the current study. Although the sample size of the SHANK3 group used in the current study is relatively large compared with previous studies (Monteiro and Feng, 2017), it is still small due to the rare condition of SHANK3 mutations. In particular, even though the PBT method is better than other approaches on the basis of root mean square error, it still represents a thickness measurement error of 0.39 ± 0.02 mm (Dahnke et al., 2013). This may potentially confound the observed between-group differences in CT. Future studies with expanded sample size need to verify the current results. Besides, the current MRI scans were mainly structural so that future studies of functional connectivity may allow for more in-depth understanding of our conclusions. Despite these limitations, our results provide some new guidance to further understand the symptoms presented by ASD children both with and without SHANK3 defects.
Conclusion
Besides commonality, our findings have revealed dissociable patterns of alterations in both local and networked features of brain morphology between ASD children with and without SHANK3 defects, which suggests new insight into the understanding of neuropathological mechanisms underlying ASD. Moreover, this monogenic study may provide a valuable path for parsing the heterogeneity of brain disturbances in ASD.
Data Availability Statement
The datasets presented in this study can be found in online repositories. The names of the repository/repositories and accession number(s) can be found in the article/Supplementary Material.
Ethics Statement
The studies involving human participants were reviewed and approved by Ethics Committee of Children’s Hospital of Fudan University. Written informed consent to participate in this study was provided by the participants’ legal guardian/next of kin.
Author Contributions
DL analyzed and interpreted the data and wrote and reviewed the manuscript. XX designed the research, interpreted the data, and reviewed the manuscript. DY analyzed and interpreted the data and reviewed the manuscript. ZQ interpreted the data and reviewed the manuscript. CL collected and analyzed the clinical data. ZH analyzed and interpreted the imaging data. HL, QX, BZ, CH, YZ, and YW prepared the data and reviewed the manuscript. JN reviewed the manuscript. All authors contributed to the article and approved the submitted version.
Funding
This study was supported in part by the National Natural Science Foundation of China (NSFC, Nos. 81701129, 82171540, and 31600869); Original Research Fund of Fudan University (No. IDF156012/004); and HaiJu Joint Laboratory Project of Children’s Hospital of Fudan University (EK1125180106). We also would like to acknowledge the support of The Open Research Fund of Shanghai Key Laboratory of Brain Functional Genomics of East China Normal University.
Conflict of Interest
The authors declare that the research was conducted in the absence of any commercial or financial relationships that could be construed as a potential conflict of interest.
Publisher’s Note
All claims expressed in this article are solely those of the authors and do not necessarily represent those of their affiliated organizations, or those of the publisher, the editors and the reviewers. Any product that may be evaluated in this article, or claim that may be made by its manufacturer, is not guaranteed or endorsed by the publisher.
Supplementary Material
The Supplementary Material for this article can be found online at: https://www.frontiersin.org/articles/10.3389/fnins.2021.751364/full#supplementary-material
Footnotes
References
Abbott, A. E., Nair, A., Keown, C. L., Datko, M., Jahedi, A., Fishman, I., et al. (2016). Patterns of atypical functional connectivity and behavioral links in autism differ between default, salience, and executive networks. Cereb. Cortex 26, 4034–4045. doi: 10.1093/cercor/bhv191
Agelink van Rentergem, J. A., Deserno, M. K., and Geurts, H. M. (2021). Validation strategies for subtypes in psychiatry: a systematic review of research on autism spectrum disorder. Clin. Psychol. Rev. 87:102033. doi: 10.1016/j.cpr.2021.102033
Alexander-Bloch, A., Giedd, J. N., and Bullmore, E. (2013a). Imaging structural co-variance between human brain regions. Nat. Rev. Neurosci. 14, 322–336. doi: 10.1038/nrn3465
Alexander-Bloch, A., Raznahan, A., Bullmore, E., and Giedd, J. (2013b). The convergence of maturational change and structural covariance in human cortical networks. J. Neurosci. 33, 2889–2899. doi: 10.1523/JNEUROSCI.3554-12.2013
Ameis, S. H., and Catani, M. (2015). Altered white matter connectivity as a neural substrate for social impairment in autism spectrum disorder. Cortex 62, 158–181. doi: 10.1016/j.cortex.2014.10.014
Ashburner, J. (2007). A fast diffeomorphic image registration algorithm. Neuroimage 38, 95–113. doi: 10.1016/j.neuroimage.2007.07.007
Bassett, D. S., Bullmore, E., Verchinski, B. A., Mattay, V. S., Weinberger, D. R., and Meyer-Lindenberg, A. (2008). Hierarchical organization of human cortical networks in health and schizophrenia. J. Neurosci. 28, 9239–9248. doi: 10.1523/JNEUROSCI.1929-08.2008
Benatti, A., Ferrari, F., Giustardi, A., Filippi, A., Pinelli, M., Bosi, R., et al. (1986). Griffith test in the evaluation of psychomotor development in the 1st year of life. a longitudinal study. Pediatr. Med. Chir. 8, 757–761.
Betancur, C., and Buxbaum, J. D. (2013). SHANK3 haploinsufficiency: a “common” but underdiagnosed highly penetrant monogenic cause of autism spectrum disorders. Mol. Autism 4:17. doi: 10.1186/2040-2392-4-17
Bigler, E. D., Mortensen, S., Neeley, E. S., Ozonoff, S., Krasny, L., Johnson, M., et al. (2007). Superior temporal gyrus, language function, and autism. Dev. Neuropsychol. 31, 217–238. doi: 10.1080/87565640701190841
Bitsch, F., Berger, P., Nagels, A., Falkenberg, I., and Straube, B. (2018). The role of the right temporo-parietal junction in social decision-making. Hum. Brain Mapp. 39, 3072–3085. doi: 10.1002/hbm.24061
Bonaglia, M. C., Giorda, R., Beri, S., De Agostini, C., Novara, F., Fichera, M., et al. (2011). Molecular mechanisms generating and stabilizing terminal 22q13 deletions in 44 subjects with Phelan/McDermid syndrome. PLoS Genet. 7:e1002173. doi: 10.1371/journal.pgen.1002173
Boyle, E. A., Li, Y. I., and Pritchard, J. K. (2017). An expanded view of complex traits: from polygenic to omnigenic. Cell 169, 1177–1186. doi: 10.1016/j.cell.2017.05.038
Bruno, J. L., Hosseini, S. M. H., Saggar, M., Quintin, E. M., Raman, M. M., and Reiss, A. L. (2017). Altered brain network segregation in fragile X syndrome revealed by structural connectomics. Cereb. Cortex 27, 2249–2259. doi: 10.1093/cercor/bhw055
Buckner, R. L., Andrews-Hanna, J. R., and Schacter, D. L. (2008). The brain’s default network: anatomy, function, and relevance to disease. Ann. N. Y. Acad. Sci. 1124, 1–38. doi: 10.1196/annals.1440.011
Catani, M., Dell’acqua, F., and Thiebaut de Schotten, M. (2013). A revised limbic system model for memory, emotion and behaviour. Neurosci. Biobehav. Rev. 37, 1724–1737. doi: 10.1016/j.neubiorev.2013.07.001
Chini, M., and Hanganu-Opatz, I. L. (2021). Prefrontal cortex development in health and disease: lessons from rodents and humans. Trends Neurosci. 44, 227–240. doi: 10.1016/j.tins.2020.10.017
Dahnke, R., Yotter, R. A., and Gaser, C. (2013). Cortical thickness and central surface estimation. Neuroimage 65, 336–348. doi: 10.1016/j.neuroimage.2012.09.050
de la Torre-Ubieta, L., Won, H., Stein, J. L., and Geschwind, D. H. (2016). Advancing the understanding of autism disease mechanisms through genetics. Nat. Med. 22, 345–361. doi: 10.1038/nm.4071
De Luca, R., Naro, A., Colucci, P. V., Pranio, F., Tardiolo, G., Billeri, L., et al. (2021). Improvement of brain functional connectivity in autism spectrum disorder: an exploratory study on the potential use of virtual reality. J. Neural Transm. 128, 371–380. doi: 10.1007/s00702-021-02321-3
De Vico Fallani, F., Astolfi, L., Cincotti, F., Mattia, D., Marciani, M. G., Salinari, S., et al. (2007). Cortical functional connectivity networks in normal and spinal cord injured patients: evaluation by graph analysis. Hum. Brain Mapp. 28, 1334–1346. doi: 10.1002/hbm.20353
Dias, C. M., and Walsh, C. A. (2020). Recent advances in understanding the genetic architecture of autism. Annu. Rev. Genom. Hum Genet. 21, 289–304. doi: 10.1146/annurev-genom-121219-082309
DiLalla, L. F., McCrary, M., and Diaz, E. (2017). A review of endophenotypes in schizophrenia and autism: the next phase for understanding genetic etiologies. Am. J. Med. Genet. C Semin. Med. Genet. 175, 354–361. doi: 10.1002/ajmg.c.31566
Ecker, C., Bookheimer, S. Y., and Murphy, D. G. (2015). Neuroimaging in autism spectrum disorder: brain structure and function across the lifespan. Lancet Neurol. 14, 1121–1134. doi: 10.1016/S1474-4422(15)00050-2
Elliott, R., Dolan, R. J., and Frith, C. D. (2000). Dissociable functions in the medial and lateral orbitofrontal cortex: evidence from human neuroimaging studies. Cereb. Cortex 10, 308–317. doi: 10.1093/cercor/10.3.308
Fischl, B., Sereno, M. I., Tootell, R. B., and Dale, A. M. (1999). High-resolution intersubject averaging and a coordinate system for the cortical surface. Hum. Brain Mapp. 8, 272–284. doi: 10.1002/(sici)1097-019319998:4<272::aid-hbm10<3.0.co;2-4
Ghosh, S. S., Kakunoori, S., Augustinack, J., Nieto-Castanon, A., Kovelman, I., Gaab, N., et al. (2010). Evaluating the validity of volume-based and surface-based brain image registration for developmental cognitive neuroscience studies in children 4 to 11 years of age. Neuroimage 53, 85–93. doi: 10.1016/j.neuroimage.2010.05.075
Glasser, M. F., Coalson, T. S., Robinson, E. C., Hacker, C. D., Harwell, J., Yacoub, E., et al. (2016). A multi-modal parcellation of human cerebral cortex. Nature 536, 171–178. doi: 10.1038/nature18933
Gotham, K., Risi, S., Pickles, A., and Lord, C. (2007). The autism diagnostic observation schedule: revised algorithms for improved diagnostic validity. J. Autism Dev. Disord. 37, 613–627. doi: 10.1007/s10803-006-0280-1
Grzadzinski, R., Huerta, M., and Lord, C. (2013). DSM-5 and autism spectrum disorders (ASDs): an opportunity for identifying ASD subtypes. Mol. Autism 4:12. doi: 10.1186/2040-2392-4-12
Hazlett, H. C., Poe, M., Gerig, G., Smith, R. G., Provenzale, J., Ross, A., et al. (2005). Magnetic resonance imaging and head circumference study of brain size in autism: birth through age 2 years. Arch. Gen. Psychiatry 62, 1366–1376. doi: 10.1001/archpsyc.62.12.1366
He, Y., Chen, Z., and Evans, A. (2008). Structural insights into aberrant topological patterns of large-scale cortical networks in Alzheimer’s disease. J. Neurosci. 28, 4756–4766. doi: 10.1523/JNEUROSCI.0141-08.2008
He, Y., Chen, Z. J., and Evans, A. C. (2007). Small-world anatomical networks in the human brain revealed by cortical thickness from MRI. Cereb. Cortex 17, 2407–2419. doi: 10.1093/cercor/bhl149
Hermans, E. J., Henckens, M. J., Joels, M., and Fernandez, G. (2014). Dynamic adaptation of large-scale brain networks in response to acute stressors. Trends Neurosci. 37, 304–314. doi: 10.1016/j.tins.2014.03.006
Holiga, S., Hipp, J. F., Chatham, C. H., Garces, P., Spooren, W., D’Ardhuy, X. L., et al. (2019). Patients with autism spectrum disorders display reproducible functional connectivity alterations. Sci. Transl. Med. 11:eaat9223. doi: 10.1126/scitranslmed.aat9223
Jarbo, K., and Verstynen, T. D. (2015). Converging structural and functional connectivity of orbitofrontal, dorsolateral prefrontal, and posterior parietal cortex in the human striatum. J. Neurosci. 35, 3865–3878. doi: 10.1523/JNEUROSCI.2636-14.2015
Jiang, Y. H., and Ehlers, M. D. (2013). Modeling autism by SHANK gene mutations in mice. Neuron 78, 8–27. doi: 10.1016/j.neuron.2013.03.016
Jou, R. J., Minshew, N. J., Keshavan, M. S., Vitale, M. P., and Hardan, A. Y. (2010). Enlarged right superior temporal gyrus in children and adolescents with autism. Brain Res. 1360, 205–212. doi: 10.1016/j.brainres.2010.09.005
Latora, V., and Marchiori, M. (2001). Efficient behavior of small-world networks. Phys. Rev. Lett. 87:198701. doi: 10.1103/PhysRevLett.87.198701
Lawrence, K. E., Hernandez, L. M., Bowman, H. C., Padgaonkar, N. T., Fuster, E., Jack, A., et al. (2020). Sex differences in functional connectivity of the salience, default mode, and central executive networks in youth with ASD. Cereb. Cortex 30, 5107–5120. doi: 10.1093/cercor/bhaa105
Leblond, C. S., Nava, C., Polge, A., Gauthier, J., Huguet, G., Lumbroso, S., et al. (2014). Meta-analysis of SHANK mutations in autism spectrum disorders: a gradient of severity in cognitive impairments. PLoS Genet. 10:e1004580. doi: 10.1371/journal.pgen.1004580
Li, D., Karnath, H. O., and Xu, X. (2017). Candidate biomarkers in children with autism spectrum disorder: a review of MRI studies. Neurosci. Bull. 33, 219–237. doi: 10.1007/s12264-017-0118-1
Li, S. J., Wang, Y., Qian, L., Liu, G., Liu, S. F., Zou, L. P., et al. (2018). Alterations of white matter connectivity in preschool children with autism spectrum disorder. Radiology 288, 209–217. doi: 10.1148/radiol.2018170059
Liu, C., Li, D., Yang, H., Li, H., Xu, Q., Zhou, B., et al. (2021). Altered striatum centered brain structures in SHANK3 deficient Chinese children with genotype and phenotype profiling. Prog. Neurobiol. 200:101985. doi: 10.1016/j.pneurobio.2020.101985
Lord, C., Rutter, M., and Le Couteur, A. (1994). Autism diagnostic interview-revised: a revised version of a diagnostic interview for caregivers of individuals with possible pervasive developmental disorders. J. Autism Dev. Disord. 24, 659–685. doi: 10.1007/BF02172145
Luders, E., Thompson, P. M., Narr, K. L., Toga, A. W., Jancke, L., and Gaser, C. (2006). A curvature-based approach to estimate local gyrification on the cortical surface. Neuroimage 29, 1224–1230. doi: 10.1016/j.neuroimage.2005.08.049
Maslov, S., and Sneppen, K. (2002). Specificity and stability in topology of protein networks. Science 296, 910–913. doi: 10.1126/science.1065103
Monteiro, P., and Feng, G. (2017). SHANK proteins: roles at the synapse and in autism spectrum disorder. Nat. Rev. Neurosci. 18, 147–157. doi: 10.1038/nrn.2016.183
Muller, R. A., and Fishman, I. (2018). Brain connectivity and neuroimaging of social networks in autism. Trends Cogn. Sci. 22, 1103–1116. doi: 10.1016/j.tics.2018.09.008
Oosterhof, N. N., Wiestler, T., Downing, P. E., and Diedrichsen, J. (2011). A comparison of volume-based and surface-based multi-voxel pattern analysis. Neuroimage 56, 593–600. doi: 10.1016/j.neuroimage.2010.04.270
Phelan, K., and McDermid, H. E. (2012). The 22q13.3 deletion syndrome (phelan-mcdermid syndrome). Mol. Syndromol. 2, 186–201. doi: 10.1159/000334260
Phelan, M. C. (2008). Deletion 22q13.3 syndrome. Orphanet. J. Rare Dis. 3:14. doi: 10.1186/1750-1172-3-14
Philippe, A., Boddaert, N., Vaivre-Douret, L., Robel, L., Danon-Boileau, L., Malan, V., et al. (2008). Neurobehavioral profile and brain imaging study of the 22q13.3 deletion syndrome in childhood. Pediatrics 122:e376–e382. doi: 10.1542/peds.2007-2584
Poletti, M., Enrici, I., and Adenzato, M. (2012). Cognitive and affective theory of mind in neurodegenerative diseases: neuropsychological, neuroanatomical and neurochemical levels. Neurosci. Biobehav. Rev. 36, 2147–2164. doi: 10.1016/j.neubiorev.2012.07.004
Sarasua, S. M., Dwivedi, A., Boccuto, L., Chen, C. F., Sharp, J. L., Rollins, J. D., et al. (2014). 22q13.2q13.32 genomic regions associated with severity of speech delay, developmental delay, and physical features in phelan-mcdermid syndrome. Genet. Med. 16, 318–328. doi: 10.1038/gim.2013.144
Seeley, W. W., Menon, V., Schatzberg, A. F., Keller, J., Glover, G. H., Kenna, H., et al. (2007). Dissociable intrinsic connectivity networks for salience processing and executive control. J. Neurosci. 27, 2349–2356. doi: 10.1523/JNEUROSCI.5587-06.2007
Seidlitz, J., Vasa, F., Shinn, M., Romero-Garcia, R., Whitaker, K. J., Vertes, P. E., et al. (2018). Morphometric similarity networks detect microscale cortical organization and predict inter-individual cognitive variation. Neuron 97, 231–247. doi: 10.1016/j.neuron.2017.11.039
Sharda, M., Khundrakpam, B. S., Evans, A. C., and Singh, N. C. (2016). Disruption of structural covariance networks for language in autism is modulated by verbal ability. Brain Struct. Funct. 221, 1017–1032. doi: 10.1007/s00429-014-0953-z
Shepherd, G. M. (2013). Corticostriatal connectivity and its role in disease. Nat. Rev. Neurosci. 14, 278–291. doi: 10.1038/nrn3469
Soorya, L., Kolevzon, A., Zweifach, J., Lim, T., Dobry, Y., Schwartz, L., et al. (2013). Prospective investigation of autism and genotype-phenotype correlations in 22q13 deletion syndrome and SHANK3 deficiency. Mol. Autism 4:18. doi: 10.1186/2040-2392-4-18
Srivastava, S., Scherrer, B., Prohl, A. K., Filip-Dhima, R., Kapur, K., Kolevzon, A., et al. (2019). Volumetric analysis of the basal ganglia and cerebellar structures in patients with phelan-mcdermid syndrome. Pediatr. Neurol. 90, 37–43. doi: 10.1016/j.pediatrneurol.2018.09.008
Tang, X., Zhang, Y., Liu, D., Hu, Y., Jiang, L., and Zhang, J. (2021). Association of gyrification pattern, white matter changes, and phenotypic profile in patients with Parkinson disease. Neurology 96:e2387–e2394. doi: 10.1212/WNL.0000000000011894
Tordjman, S., Celume, M. P., Denis, L., Motillon, T., and Keromnes, G. (2019). Reframing schizophrenia and autism as bodily self-consciousness disorders leading to a deficit of theory of mind and empathy with social communication impairments. Neurosci. Biobehav. Rev. 103, 401–413. doi: 10.1016/j.neubiorev.2019.04.007
Van Essen, D. C., Dierker, D., Snyder, A. Z., Raichle, M. E., Reiss, A. L., and Korenberg, J. (2006). Symmetry of cortical folding abnormalities in Williams syndrome revealed by surface-based analyses. J. Neurosci. 26, 5470–5483. doi: 10.1523/JNEUROSCI.4154-05.2006
van Oort, J., Kohn, N., Vrijsen, J. N., Collard, R., Duyser, F. A., Brolsma, S. C. A., et al. (2020). Absence of default mode downregulation in response to a mild psychological stressor marks stress-vulnerability across diverse psychiatric disorders. Neuroimage Clin. 25:102176. doi: 10.1016/j.nicl.2020.102176
van Oort, J., Tendolkar, I., Hermans, E. J., Mulders, P. C., Beckmann, C. F., Schene, A. H., et al. (2017). How the brain connects in response to acute stress: a review at the human brain systems level. Neurosci. Biobehav. Rev. 83, 281–297. doi: 10.1016/j.neubiorev.2017.10.015
van Rooij, D., Anagnostou, E., Arango, C., Auzias, G., Behrmann, M., Busatto, G. F., et al. (2018). Cortical and subcortical brain morphometry differences between patients with autism spectrum disorder and healthy individuals across the lifespan: results from the ENIGMA ASD working group. Am. J. Psychiatry 175, 359–369. doi: 10.1176/appi.ajp.2017.17010100
Vissers, M. E., Cohen, M. X., and Geurts, H. M. (2012). Brain connectivity and high functioning autism: a promising path of research that needs refined models, methodological convergence, and stronger behavioral links. Neurosci. Biobehav. Rev. 36, 604–625. doi: 10.1016/j.neubiorev.2011.09.003
von dem Hagen, E. A., Stoyanova, R. S., Baron-Cohen, S., and Calder, A. J. (2013). Reduced functional connectivity within and between ‘social’ resting state networks in autism spectrum conditions. Soc. Cogn. Affect. Neurosci. 8, 694–701. doi: 10.1093/scan/nss053
Wang, J., Wang, L., Zang, Y., Yang, H., Tang, H., Gong, Q., et al. (2009). Parcellation-dependent small-world brain functional networks: a resting-state fMRI study. Hum. Brain Mapp. 30, 1511–1523. doi: 10.1002/hbm.20623
Wei, Y., de Lange, S. C., Scholtens, L. H., Watanabe, K., Ardesch, D. J., Jansen, P. R., et al. (2019). Genetic mapping and evolutionary analysis of human-expanded cognitive networks. Nat. Commun. 10:4839. doi: 10.1038/s41467-019-12764-8
Wolf, D., Mittelberg, I., Rekittke, L. M., Bhavsar, S., Zvyagintsev, M., Haeck, A., et al. (2018). Interpretation of social interactions: functional imaging of cognitive-semiotic categories during naturalistic viewing. Front. Hum. Neurosci. 12:296. doi: 10.3389/fnhum.2018.00296
Yan, Z., and Rein, B. (2021). Mechanisms of synaptic transmission dysregulation in the prefrontal cortex: pathophysiological implications. Mol. Psychiatry (in press). doi: 10.1038/s41380-021-01092-3
Yang, D. Y., Beam, D., Pelphrey, K. A., Abdullahi, S., and Jou, R. J. (2016). Cortical morphological markers in children with autism: a structural magnetic resonance imaging study of thickness, area, volume, and gyrification. Mol. Autism 7:11. doi: 10.1186/s13229-016-0076-x
Yin, D., Chen, X., Zeljic, K., Zhan, Y., Shen, X., Yan, G., et al. (2019). A graph representation of functional diversity of brain regions. Brain Behav. 9:e01358. doi: 10.1002/brb3.1358
Yin, D., Song, F., Xu, D., Sun, L., Men, W., Zang, L., et al. (2014). Altered topological properties of the cortical motor-related network in patients with subcortical stroke revealed by graph theoretical analysis. Hum. Brain Mapp. 35, 3343–3359. doi: 10.1002/hbm.22406
Yotter, R. A., Nenadic, I., Ziegler, G., Thompson, P. M., and Gaser, C. (2011). Local cortical surface complexity maps from spherical harmonic reconstructions. Neuroimage 56, 961–973. doi: 10.1016/j.neuroimage.2011.02.007
Ziats, C. A., Patterson, W. G., and Friez, M. (2021). Syndromic autism revisited: review of the literature and lessons learned. Pediatr. Neurol. 114, 21–25. doi: 10.1016/j.pediatrneurol.2020.06.011
Keywords: surface-based morphometry, structural covariance networks, autism spectrum disorder, SHANK3, children
Citation: Li D, Liu C, Huang Z, Li H, Xu Q, Zhou B, Hu C, Zhang Y, Wang Y, Nie J, Qiao Z, Yin D and Xu X (2021) Common and Distinct Disruptions of Cortical Surface Morphology Between Autism Spectrum Disorder Children With and Without SHANK3 Deficiency. Front. Neurosci. 15:751364. doi: 10.3389/fnins.2021.751364
Received: 01 August 2021; Accepted: 29 September 2021;
Published: 28 October 2021.
Edited by:
Li Yang, Peking University Sixth Hospital, ChinaReviewed by:
Hsiao-Tuan Chao, Baylor College of Medicine, United StatesAshwin S. Shetty, Harvard University, United States
Vanesa Lerma, Baylor College of Medicine, United States, in collaboration with reviewer H-TC
Copyright © 2021 Li, Liu, Huang, Li, Xu, Zhou, Hu, Zhang, Wang, Nie, Qiao, Yin and Xu. This is an open-access article distributed under the terms of the Creative Commons Attribution License (CC BY). The use, distribution or reproduction in other forums is permitted, provided the original author(s) and the copyright owner(s) are credited and that the original publication in this journal is cited, in accordance with accepted academic practice. No use, distribution or reproduction is permitted which does not comply with these terms.
*Correspondence: Zhongwei Qiao, cWlhb3pod2VpQDE2My5jb20=; Dazhi Yin, ZHp5aW5AcHN5LmVjbnUuZWR1LmNu; Xiu Xu, eHV4aXVAc2htdS5lZHUuY24=