
94% of researchers rate our articles as excellent or good
Learn more about the work of our research integrity team to safeguard the quality of each article we publish.
Find out more
ORIGINAL RESEARCH article
Front. Neurosci., 18 November 2021
Sec. Neuroendocrine Science
Volume 15 - 2021 | https://doi.org/10.3389/fnins.2021.703898
This article is part of the Research TopicBrain and DiabetesView all 11 articles
 Xiaomin Zeng1,2†
 Yijun Hu3,4†
 Yuanhan Chen5†
 Zhanjie Lin1,6
 Yingying Liang1,2Baoyi Liu1,2Pingting Zhong1,6
 Yu Xiao1,2
 Cong Li1,7
 Guanrong Wu1,7
 Huiqian Kong1,2
 Zijing Du1,2Yun Ren1,6
 Ying Fang1Zhiming Ye5*
 Xiaohong Yang1,2*
 Honghua Yu1,2*
Background: Widespread neural and microvascular injuries are common in chronic kidney disease (CKD), increasing risks of neurovascular complications and mortality. Early detection of such changes helps assess the risks of neurovascular complications for CKD patients. As an extension of central nervous system, the retina provides a characteristic window to observe neurovascular alterations in CKD. This study aimed to determine the presence of retinal neurovascular impairment in different stages of CKD.
Methods: One hundred fifteen non-diabetic and non-dialytic CKD patients of all stages and a control group of 35 healthy subjects were included. Retinal neural and microvascular parameters were obtained by optical coherence tomography angiography (OCTA) examination.
Results: CKD 1–2 group (versus control group) had greater odds of having decreased retinal ganglion cell-inner plexiform layer thickness (GC-IPLt) (odds ratio [OR]: 0.92; 95% confidence interval [CI]: 0.86–0.98), increased ganglion cell complex-focal loss volume (GCC-FLV) (OR: 3.51; 95% CI: 1.27–9.67), and GCC-global loss volume (GCC-GLV) (OR: 2.48; 95% CI: 1.27–4.82). The presence of advanced stages of CKD (CKD 3–5 group versus CKD 1–2 group) had greater odds of having decreased retinal vessel density in superficial vascular plexus (SVP)-WholeImage (OR: 0.77, 95% CI: 0.63–0.92), SVP-ParaFovea (OR: 0.83, 95% CI: 0.71–0.97), SVP-ParaFovea (OR: 0.76, 95% CI: 0.63–0.91), deep vascular plexus (DVP)-WholeImage (OR: 0.89, 95% CI: 0.81–0.98), DVP-ParaFovea (OR: 0.88, 95% CI: 0.78–0.99), and DVP-PeriFovea (OR: 0.90, 95% CI: 0.83–0.98). Besides, stepwise multivariate linear regression among CKD patients showed that β2-microglobulin was negatively associated with GC-IPLt (β: –0.294; 95% CI: –0.469 ∼ –0.118), and parathyroid hormone was positively associated with increased GCC-FLV (β: 0.004; 95% CI: 0.002∼0.006) and GCC-GLV (β: 0.007; 95% CI: 0.004∼0.01). Urine protein to creatinine ratio was positively associated with increased GCC-FLV (β: 0.003; 95% CI: 0.001∼0.004) and GCC-GLV (β: 0.003; 95% CI: 0.001∼0.006).
Conclusion: Retinal neuronal impairment is present in early stages of CKD (stages 1–2), and it is associated with accumulation of uremic toxins and higher UACR, while retinal microvascular hypoperfusion, which is associated with worse eGFR, was only observed in relatively advanced stages of CKD (stages 3–5). The results highlight the importance of monitoring retinal neurovascular impairment in different stages of CKD.
As an emerging public health issue, chronic kidney disease (CKD) is predicted to be the fifth most common cause of death worldwide by 2040 (Foreman et al., 2018). Uremia exposure, endocrine failure, and impaired vascular homeostasis result in widespread neural and microvascular injury (Futrakul et al., 2008). In general, neurovascular complications, especially those of the central nervous system (CNS), such as cognitive deterioration (Kurella et al., 2005), cerebrovascular stroke (Smogorzewski, 2001), and encephalopathy (Raskin and Fishman, 1976), are commonly and largely contribute to morbidity and mortality in CKD patients (Wanner et al., 2016). Therefore, there has been an urgent need for early identifying neurovascular impairment in CKD patients (Houben et al., 2017).
As an extension of the brain and sharing the same embryological origin with the CNS. Chua et al. (2020), Kashani et al. (2021), the retina is widely regarded as an accessible source for studying neurodegenerative and vascular injury processes occurring in the CNS (Hart et al., 2016; Mutlu et al., 2018). Consistently, there has also been intense interest in using retinal imaging technology to understand, diagnose, and monitor neurological diseases (Kashani et al., 2021). Recent advancements in optical coherence tomography angiography (OCTA) technologies have allowed for non-invasive and quantitative assessment of the neurovascular structure on different retinal layers (Pujari et al., 2020; Hormel et al., 2021). In some studies, OCTA has been used to monitor retinal neural and microvascular alterations in degenerative neural diseases such as Alzheimer’s disease (O’bryhim et al., 2018; Den Haan et al., 2019) and Parkinson’s disease (Kashani et al., 2021; Robbins et al., 2021).
Previous investigations have shown that both retinal neural impairment and microvascular hypoperfusion can be detected in CKD patients (stages 3–5) using OCTA (Vadala et al., 2019; Yeung et al., 2019; Zhuang et al., 2020). However, those studies failed to included CKD patients at the early stages (stages 1–2), so it still reminds unknown whether retinal neurovascular impairment occurs in earlier stages of CKD and what are the related factors for such damage. Furthermore, the inclusion of diabetes mellitus (DM) patients and dialysis population in prior studies challenge the direct comparison between CKD patients and normal subjects (Yeung et al., 2019; Wu et al., 2020), as both DM (Zeng et al., 2019; Zhuang et al., 2020) and dialysis (Wu et al., 2020) can deteriorate neurovascular system independent of declining renal function.
Therefore, we conducted this cross-sectional study in CKD patients of all stages without a history of DM or dialysis, aiming to investigate the changes of retinal neurovascular parameters detected by OCTA in patients of different CKD stages and further analyze the association between neurovascular alterations and CKD-related risk factors.
This cross-sectional study included a total of 150 eyes from 115 CKD patients and 35 healthy subjects. The study was conducted in the Department of Ophthalmology and the Department of Nephrology, Guangdong Provincial People’s Hospital from August 2019 to December 2020. The procedures followed the ethical standards of the Research Ethics Committee of Guangdong Provincial People’s Hospital [registration number: GDREC2020069(R1)] and the Helsinki Declaration. This study followed the Strengthening the Reporting of Observational Studies in Epidemiology (STROBE) reporting guideline. Informed consent was obtained from all participants.
The inclusion criteria were patients with CKD and aged ≥ 18 years. The definition of CKD was based on the presence of kidney damage (i.e., albuminuria or urinary albumin to creatinine ratio) or decreased kidney function [i.e., estimated glomerular filtration rate (eGFR) < 60 ml/min/1.73 m2 for 3 months or more] (Levey and Coresh, 2012). The eGFR value was calculated from serum creatinine (Scr) using the CKD-EPI creatinine equation (Levey et al., 2009). Severity of CKD was categorized based on the eGFR values: more than 90 ml/min/1.73 m2 (stage 1), 60∼89 ml/min/1.73 m2 (stage 2), 30∼59 ml/min/1.73 m2 (stage 3), 15∼29 ml/min/1.73 m2 (stage 4), and less than 15 ml/min/1.73 m2 (stage 5) (Levey and Coresh, 2012). The CKD 1–2 group were CKD patients in stages 1–2, and the CKD 3–5 group were CKD patients in stages 3–5. The control group was healthy subjects without major systemic diseases or ocular diseases.
The exclusion criteria were patients with (1) any type of DM; (2) HblAc>6.5%; (3) history of dialysis (hemodialysis or peritoneal dialysis); (4) any ocular issue that may impair ocular circulation (e.g., glaucoma, eye trauma, retinal vascular occlusion, choroidal neovascularization, endophthalmitis, or refractive error > ± 6 diopters); (5) inadequate quality of OCTA image (quality score < 6 or the presence of significant artifact); (6) any severe systemic diseases (e.g., cerebral infarction, myocardial infarction, heart failure, or connective tissue disorder); (7) women who were pregnant.
All participants underwent comprehensive ophthalmic examinations including best-corrected visual acuity (BCVA) (measured on a decimal chart and presented as logMAR), autorefraction, intraocular pressure, slit-lamp examination, and color fundus photography. Retinal microvasculature and neural parameters were measured with Optical Coherence Tomography Angiography (OCTA).
Optical Coherence Tomography Angiography with RTVue-XR Avanti (Optovue, Fremont, CA, United States, version 2018) is a device combining structural and functional imaging by analyzing the changing variance in light speckle created by erythrocyte flow over multiple scans (Spaide et al., 2018). The OCTA machine generates a contract-free angiogram down to the capillary level and surrogate indices of perfusion. The OCTA platform has been integrated with split-spectrum amplitude-decorrelation angiography (SSADA) algorithm that automatically segments OCT images alongside angiographic data to report global and regional vessel density (VD) of each retinal layer (Hormel et al., 2021).
The detailed procedures of the OCTA examination were shown in Supplementary Figure S1. The OCTA examination was performed in a darkroom. Before examination, participants’ pupils were dilated with Tropicamide Phenylephrine Eye Drops. An internal fixation light was used as the center the scanning area. The OCT signal position and quality were optimized using the Auto All function, aiming to find the best position, focus, and polarization match for obtaining the retina OCT image (Toto et al., 2016). Besides, considering that media opacity made an effect of on the measurement of retinal neurovascular parameters (Zhang et al., 2020, 2021), the OCTA system generated a signal strength index (SSI) to help determine whether the scan quality is acceptable. The signal strength intensity (SSI; ranged from 0 to 100) is based on the intensity or brightness of the reflected light during scanning. The higher the intensity, the higher the SSI.
Retinal vascular retinal layers were visualized as follows: a set of high definition (HD) Angio Retina Scan (6*6mm) was captured to evaluate the VD of the macular, which contained superficial retinal plexus and deep retinal plexus. The boundaries of each layer were segmented as follows: a slab extending from 3 to 15 μm from the internal limiting membrane (ILM) was generated to detect the superficial vascular plexus (SVP), and a slab extending from 15 to 70 μm below ILM to detect the deep vascular plexus (DVP) (Zhuang et al., 2020). Besides, HD Angio Disk Scan (4.5*4.5 mm) was imaged to visualize the radial peripapillary capillary, which was defined as the vessel on the layer between the outer limit of the retinal nerve fiber layer (RNFL) and ILM in the peripapillary region. The segmentations of these three retinal vascular plexuses were shown in Supplementary Figure S2 (Wu et al., 2020).
As for the retinal neural parameters, a ganglion cell complex (GCC) scan was used to measure retinal ganglion cell-inner plexiform layer thickness (GC-IPLt), which was defined as the layer between the retinal nerve fiber layer (RNFL) and IPL within a 6-mm circle. An optic nerve head (ONH) scan was obtained for the measurement of RNFL thickness (RNFLt). The average RNFLt was measured over a 3.45-mm-diameter circle centered on the ONH.
All the retinal VD and layer thickness retinal VD and layer thickness were calculated automatically and quantitatively using the AngioVue SSADA software (Peng et al., 2020; Wu et al., 2020). Both eyes of the participants were examined by OCTA, but only the data of the right eye was included for analysis. If the scan of the right eye was uninterpretable, data of the left eye were utilized. Only images with quality index ≥ 6 and SSI ≥ 60 were retained.
Medical history and laboratory data in the last 3 months were collected. Demographic and blood test data were extracted from the electronic medical record system by a trained researcher (YF) and double-checked by an ophthalmologist (XZ). The basic information included age, sex, body mass index (BMI), systolic blood pressure (SBP), diastolic blood pressure (DBP), duration of CKD, and the history of smoking, hypertension, and cardiovascular disease (CVD). Laboratory tests included glycated hemoglobin (HbA1C), Scr, blood urea nitrogen (BUN), hemoglobin (HGB), cholesterol (CHOL), low-density lipoprotein (LDL), urine albumin to creatinine ratio (UACR), urine protein to creatinine ratio (UPCR), parathyroid hormone (PTH), albumin (ALB), and β2-microglobulin (β2-M).
SPSS version 25.0 (SPSS. Inc., Chicago, IL, United States) was used to perform statistical analyses. A two-sided p-value of less than 0.05 was considered significant. Mean and standard deviation (SD) were used for presenting quantitative variables for normal distribution, medians and interquartile range (IQR) for abnormal distribution, and numbers (percentages) were used for categorical variables. In the comparison of basic characteristics among three groups, one-way ANOVA was used for normally distributed continuous data and the Kruskal–Wallis H test was used for non-normally distributed continuous data, and Bonferroni’s correction was used for post hoc analysis. χ2 tests were utilized to compare categorical variables. Mann–Whitney test was applied to compare the duration of CKD between the CKD 1–2 group and the CKD 3–5 group. Crude logistic regression models were used to compare the OCTA parameters (dependent variables) between different groups (independent variables, 1a: CKD 1–2 versus control, 2a: CKD 1–2 versus CKD 3–5) without adjusting confounders. We also used adjusted logistic regression models (1b: CKD 1–2 versus control, 2b: CKD 3–5 versus CKD 1–2) to adjust the confounders, including age, sex, BMI, SBP, DBP, history of smoking, history of CVD, Hb1Ac, CHOL, and LDL. Partial correlation analysis was used to determine risk factors associated with the OCTA parameters in the CKD patients after controlling for age, sex, BMI, history of smoking, history of CVD, RE, and IOP. Besides, stepwise multivariate regression was performed to figure out the independent risk factors for the retinal neurovascular alterations in the CKD patients. Age, sex, BMI, history of hypertension, history of smoking, history of CVD, eGFR, BUN, PTH, UACR, HGB, CKD duration, Hb1Ac, β2-M, and LDL were independent variables entered into the model. Finally, Spearman correlation analysis was used to determine the relationship between BCVA and OCTA parameters in all subjects.
The basic characteristics of the participants were summarized in Table 1. The etiology of the CKD patients was shown in Supplementary Table S1. There were significantly higher results of DBP, BUN, and HGB in the CKD 1–2 group compared to the control group (all p < 0.05). The CKD 3–5 group showed significantly higher results of SBP, DBP, Hb1Ac, Scr, BUN, BCVA (logMAR), as well as decreased eGFR and HGB compared to the CKD 1–2 group and the control group (all p < 0.05). Besides, the CKD 3–5 group also showed significantly higher results of age, BMI, PTH, β2-M, history of hypertension, and CVD compared to the CKD 1–2 group (all p < 0.05). No significant difference was found in sex, history of smoking, CHOL, SER, and IOP among the three groups. Duration of CKD, UACR, UPCR, and ALB and the etiology of CKD were comparable between the CKD 1–2 group and the CKD 3–5 group. Besides, the signal strength index of the macular, disk, GGG, and ONH areas and the overall quality index of the macular and disk areas are comparable among the three groups (Supplementary Table S2).
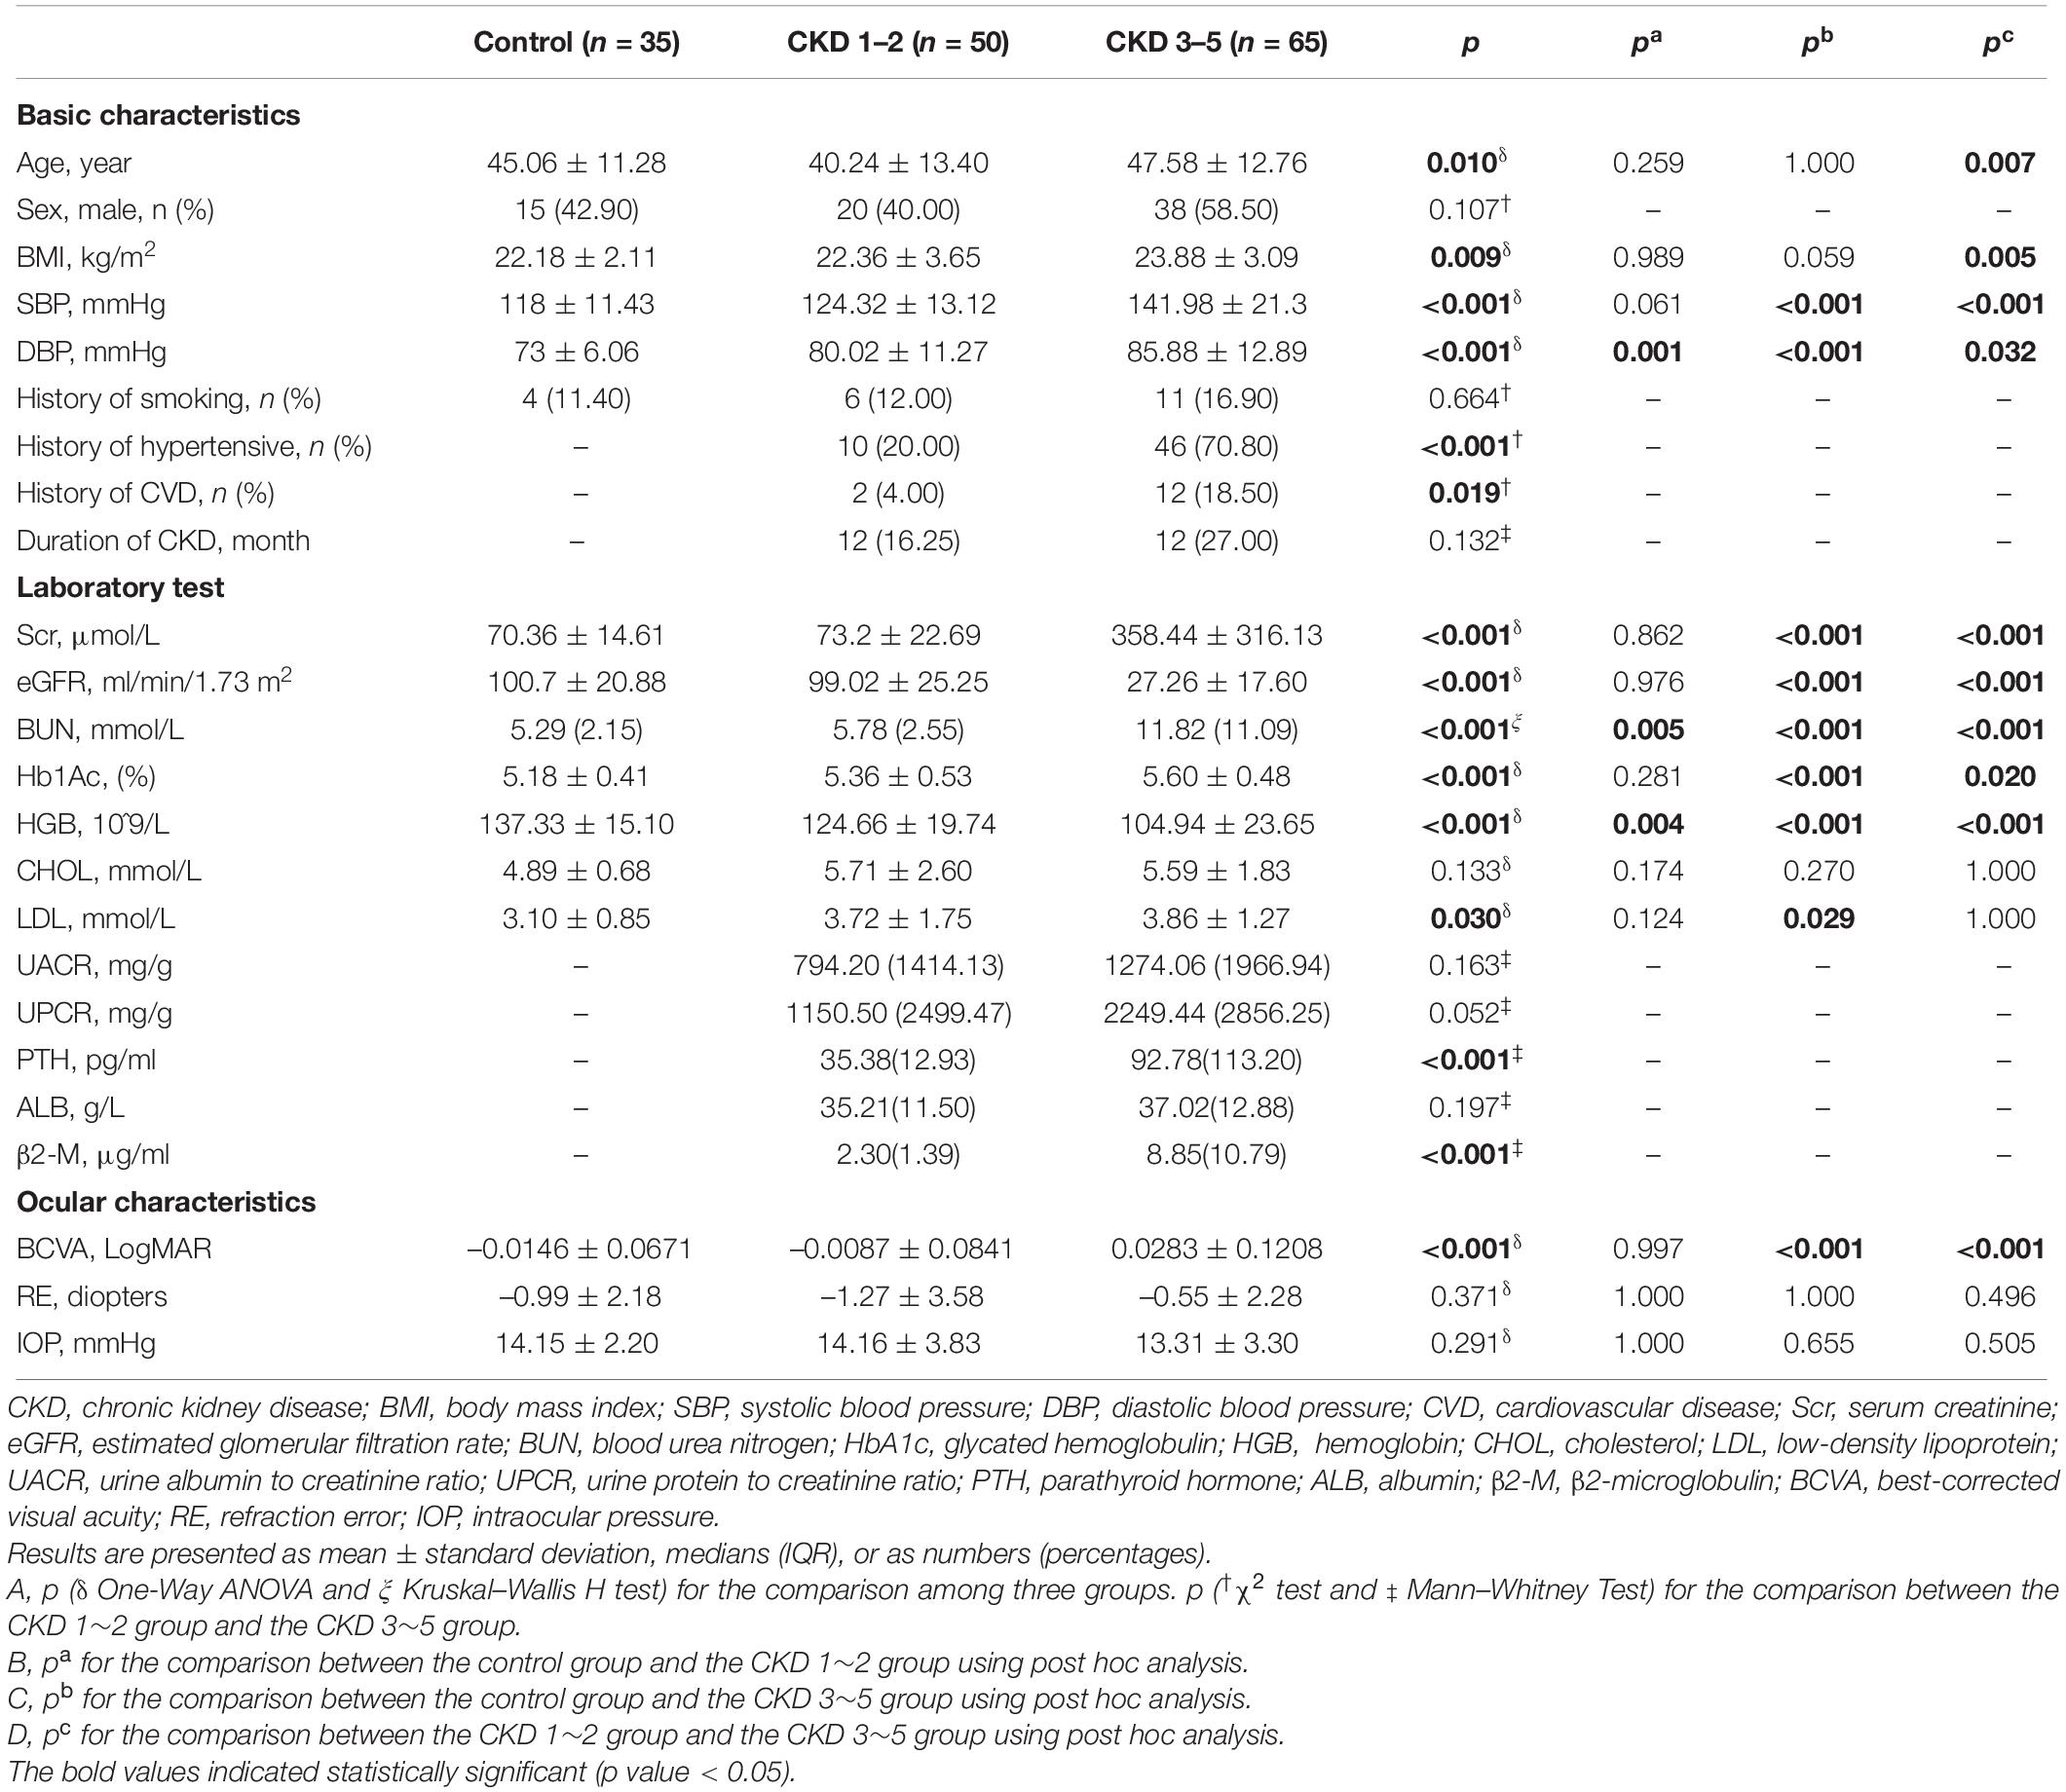
Table 1. Comparison of basic characteristics among the three groups.
Comparisons of OCTA parameters among the three groups were shown in Table 2 and Figure 1. Significantly reduced GC-IPLt and increased GCC-FLV and GCC-GLV were detected in the CKD 1–2 group and the CKD 3–5 group compared to the control group (all p < 0.05). Also, significantly reduced GCCt and increased GCC-GLV were found in the CKD 3–5 group compared to the CKD 1–2 group. A representative picture showing the changes in GC-IPLt, GCC-FLV, and GCC-GLV in CKD groups and control group was shown in Supplementary Figure S3. No significant difference was found in RNFL parameters among the three groups. For retinal microvascular parameters, significantly reduced VD in all SVP regions and DVP regions were found in the CKD 3–5 group compared to the CKD 1–2 group and control group (all p < 0.001). No significant difference was found in all microvascular parameters between the CKD 1–2 group and the control group. No significant difference was found in VD in all RPC regions among the three groups.
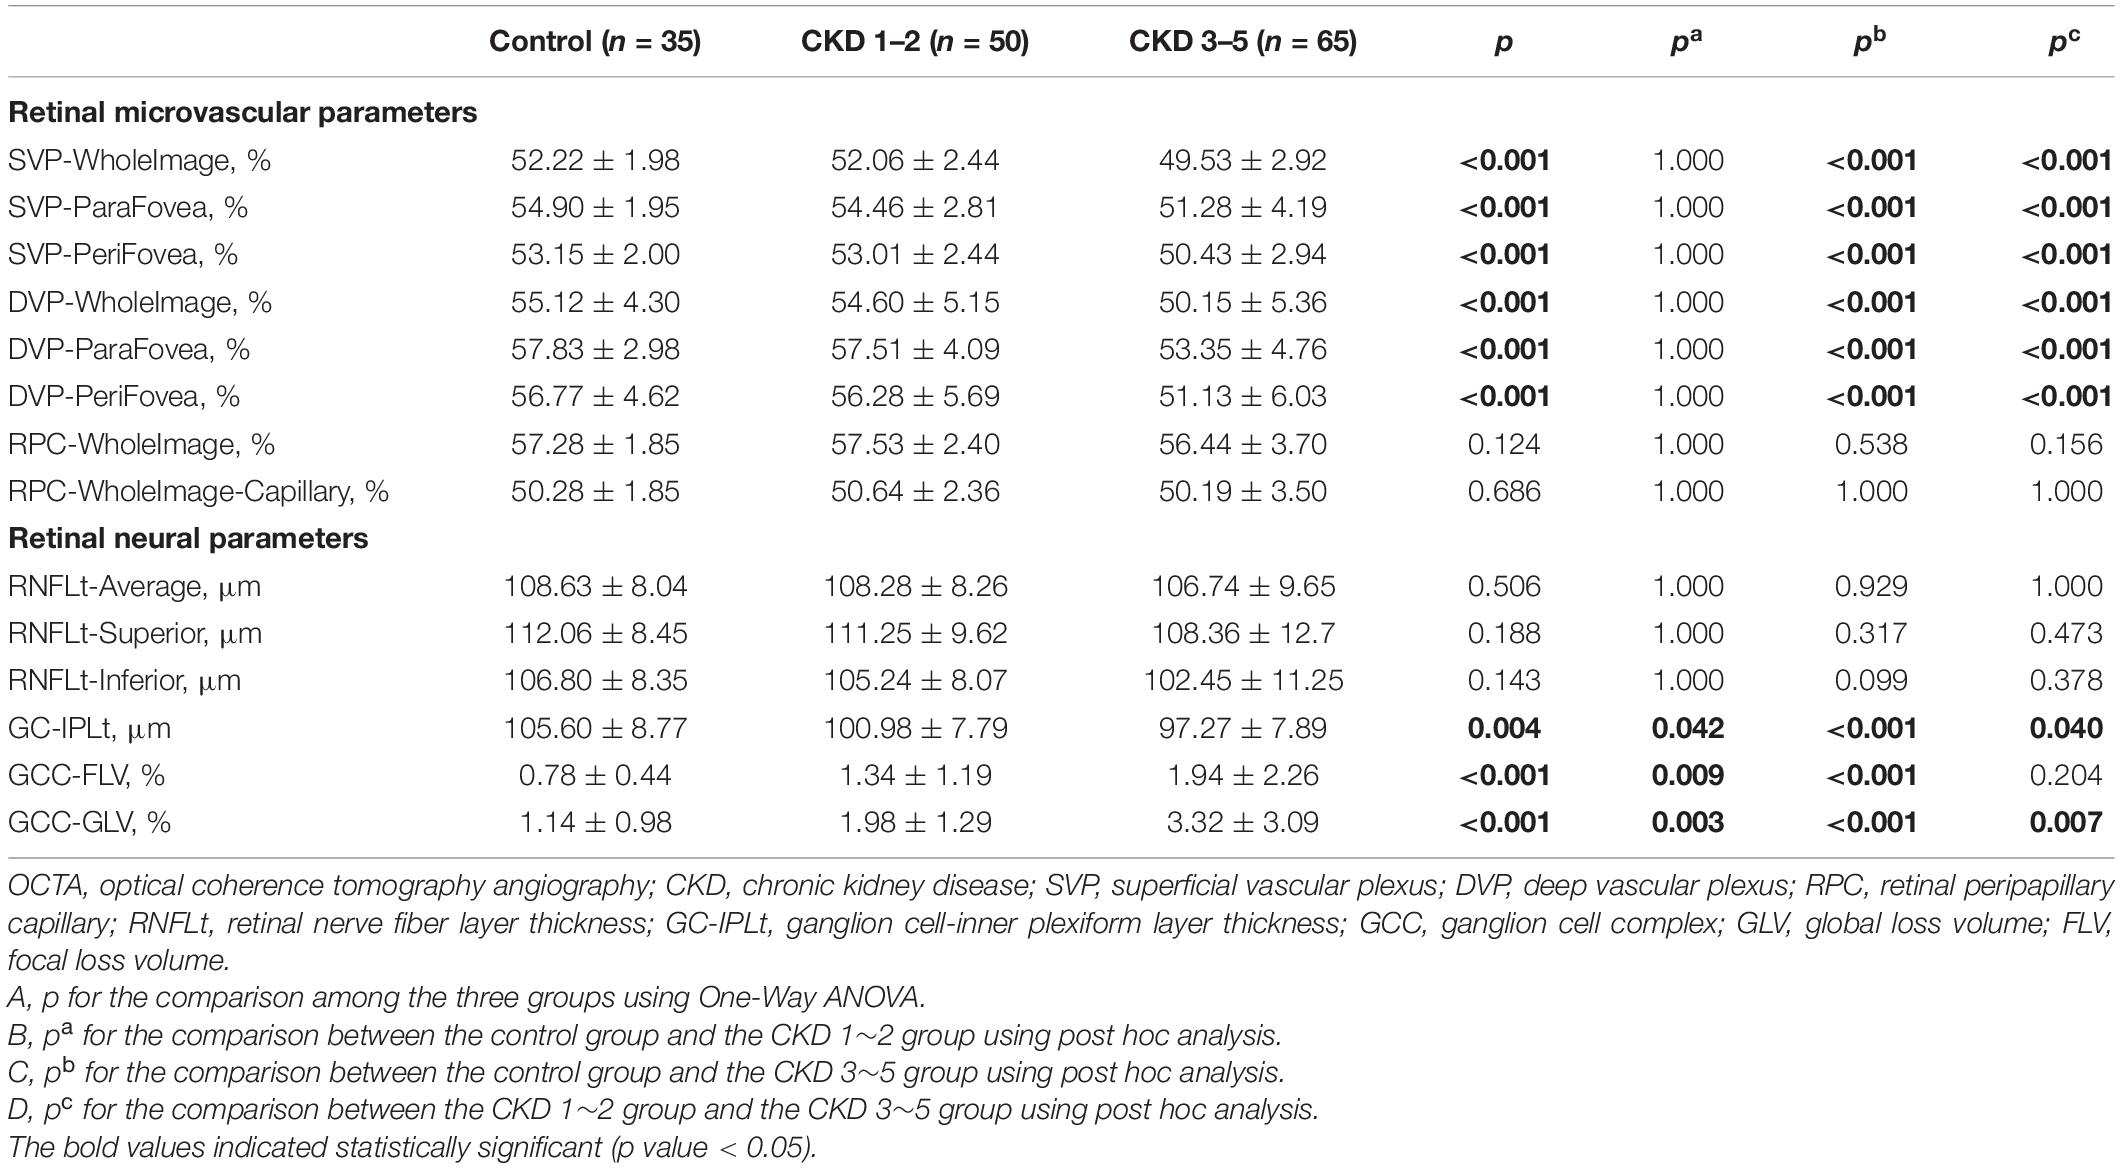
Table 2. Comparison of OCTA parameters among the three groups.
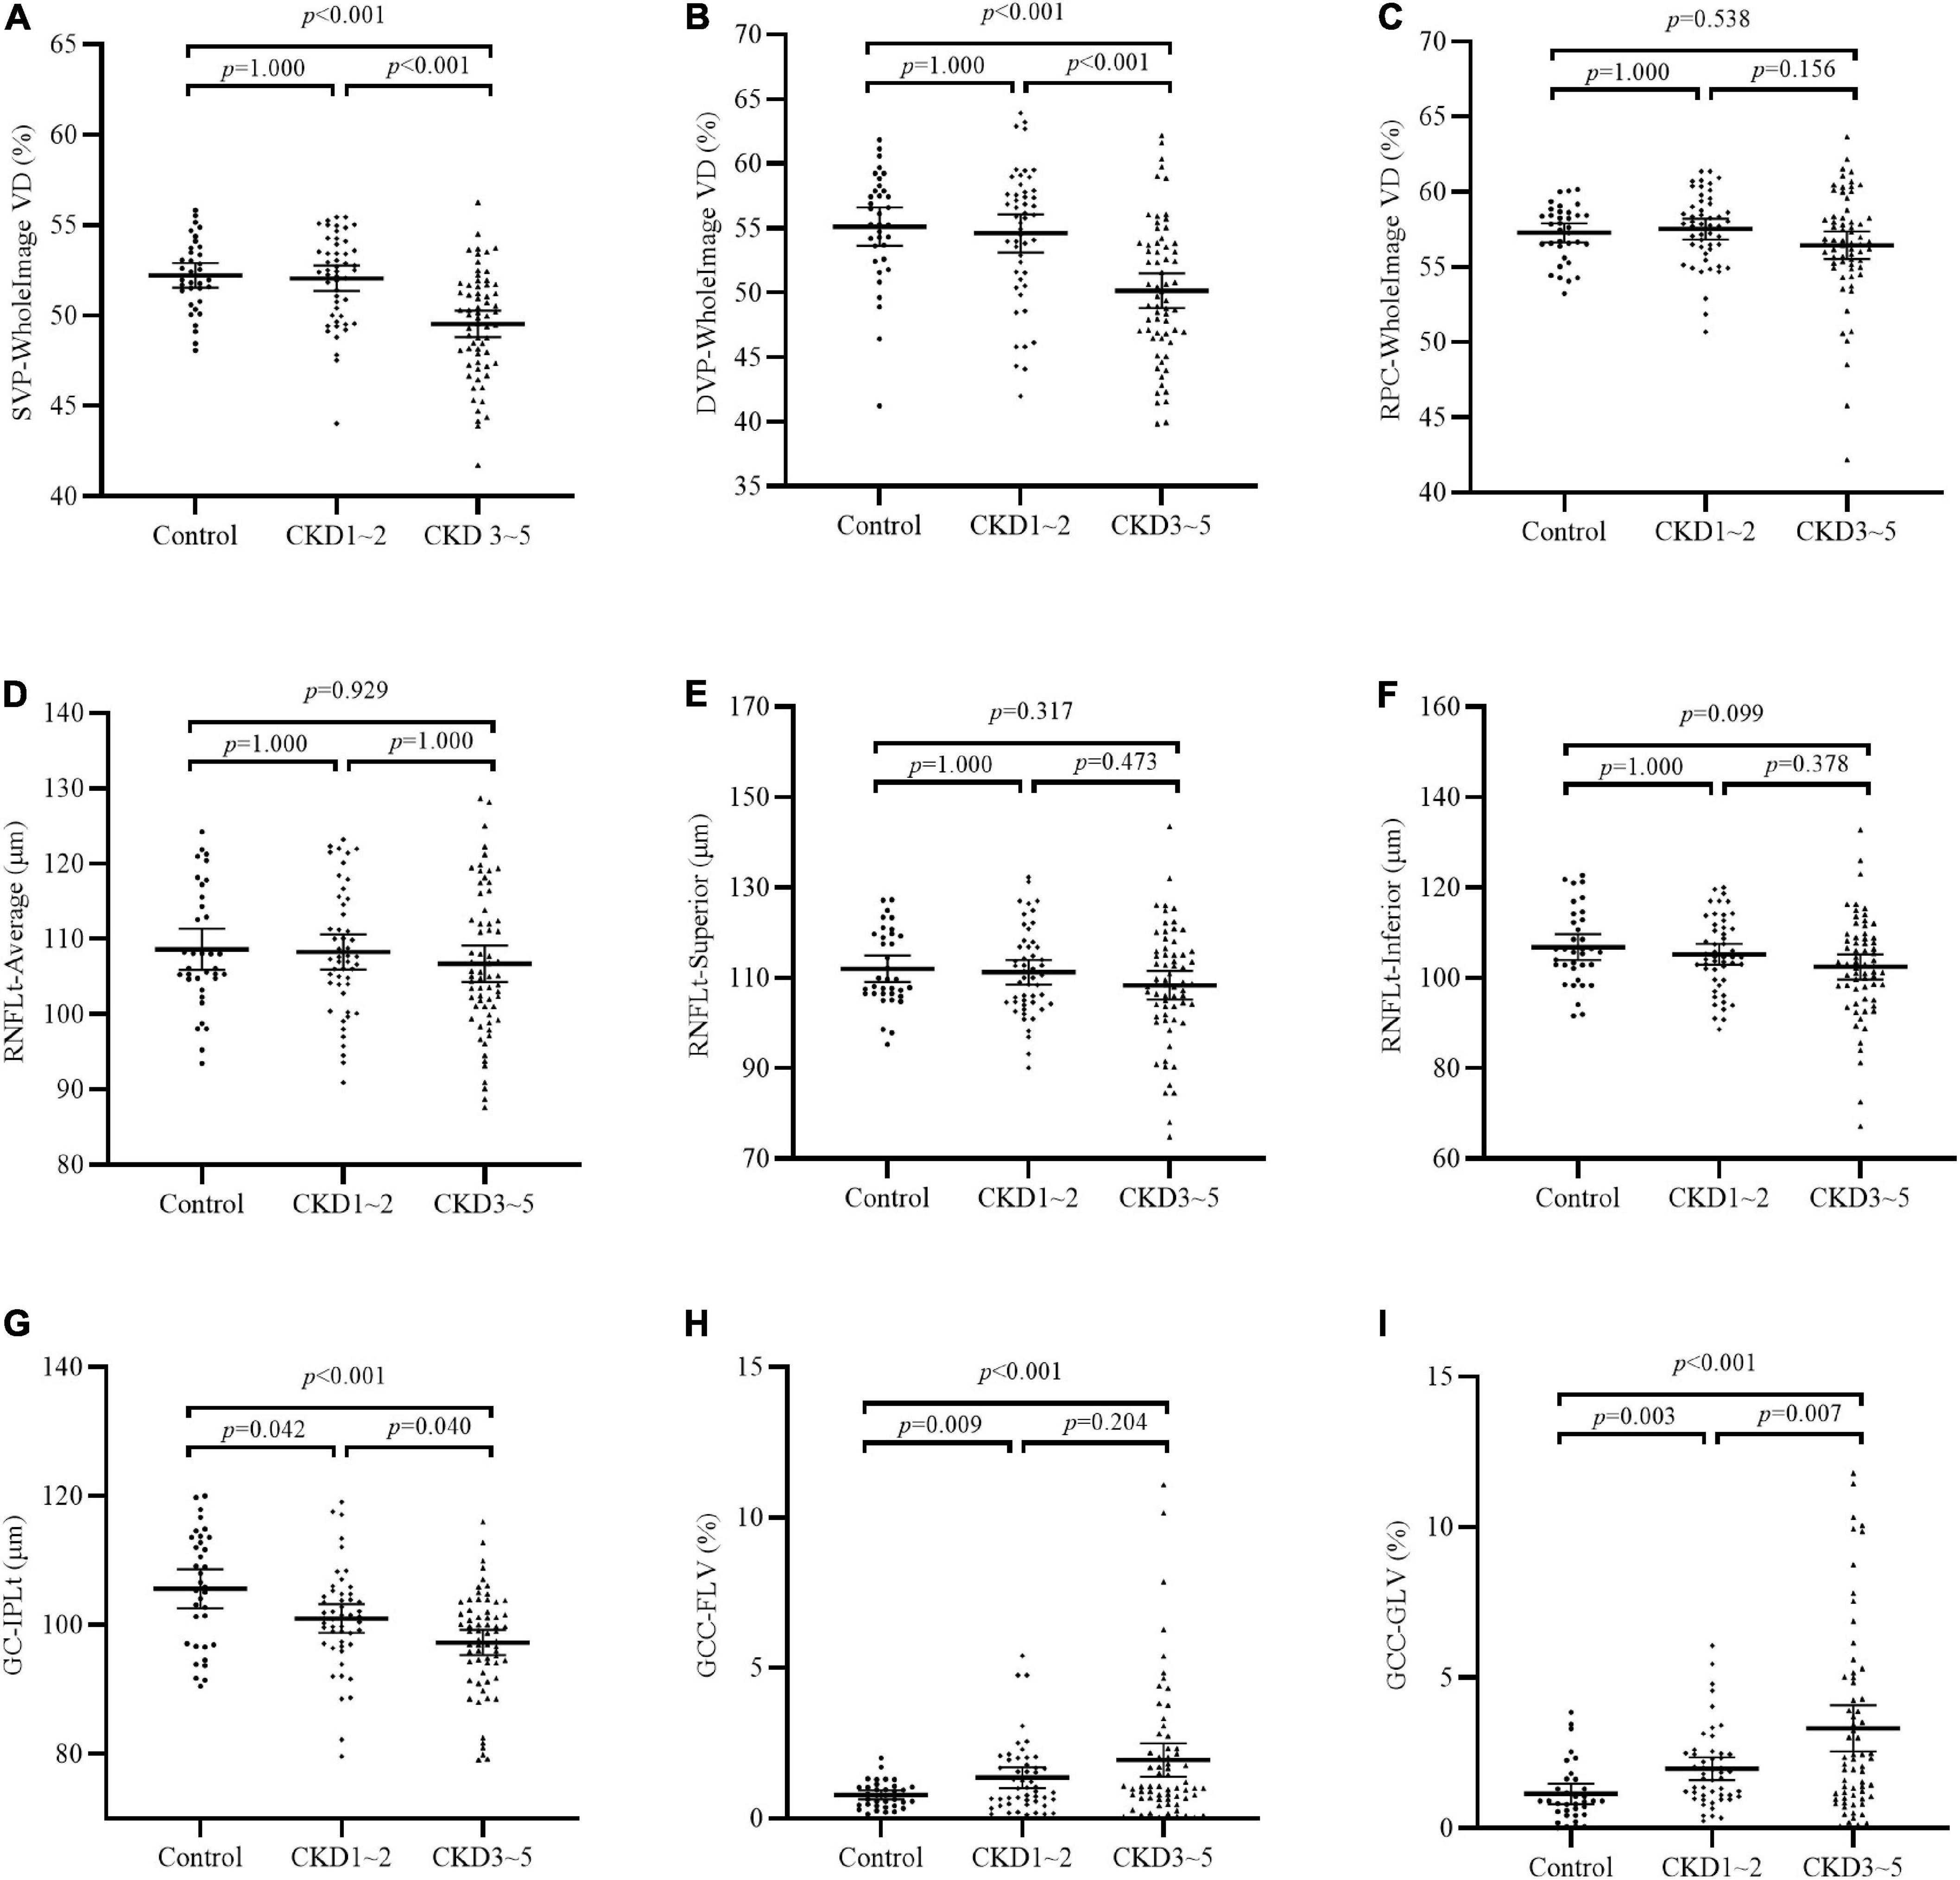
Figure 1. Comparison of OCTA parameters among the three groups. (A–C) VD of SVP-WholeImage, DVP-WholeImage, and RPC-WholeImage among three groups; (D–F) Thickness of RNFL-Average, RNFL-superior, and RNFL-inferior among three groups; (G) Thickness of GC-IPL among three groups; (H) Focal loss volume of GCC among three groups; (I) Global loss volume of GCC among three groups. CKD, chronic kidney disease; VD, vessel density; SVP, superficial vascular plexus; DVP, deep vascular plexus; RPC, retinal peripapillary capillary; RNFLt, retinal nerve fiber layer thickness; GC-IPLt, ganglion cell-inner plexiform layer thickness; GCC, ganglion cell complex; GLV, global loss volume; FLV, focal loss volume.
Table 3 shows the results of logistic regression models investigating associations of OCTA parameters and the incidence and progression of CKD. After adjusting for confounders including age, sex, BMI, SBP, DBP, history of smoking, history of CVD, Hb1Ac, CHOL, and LDL, the model 1b showed that the presence of early stages of CKD (CKD1–2 group versus control group) was significantly associated with decreased GC-IPLt (odds ratio [OR]: 0.92; 95% confidence interval [CI]: 0.86–0.98), meaning one-micrometer increase of GC-IPLt is associated with 0.92-fold risk of CKD after adjusting for the confounding factors. Meanwhile, the presence of early stages of CKD (CKD1–2 group versus control group) was significantly associated with increased GCC-FLV (OR: 3.51; 95% CI: 1.27–9.67) and GCC-GLV (OR: 2.48; 95% CI: 1.27–4.82). Further investigation in the crude model 2b showed that the presence of advanced stages of CKD (CKD 3–5 group versus CKD 1–2 group) had greater odds of having decreased VD in SVP-WholeImage (OR: 0.77; 95% CI: 0.63–0.92), SVP-ParaFovea (OR: 0.83; 95% CI: 0.71–0.97), SVP-PeriFovea (OR: 0.76; 95% CI: 0.63–0.91), DVP-WholeImage (OR: 0.89; 95% CI: 0.81–0.98), DVP-ParaFovea (OR: 0.88; 95% CI: 0.78–0.99), DVP-PeriFovea (OR: 0.90; 95% CI: 0.83–0.98), and increased GCC-GLV (OR: 1.35; 95% CI: 1.05–1.73).
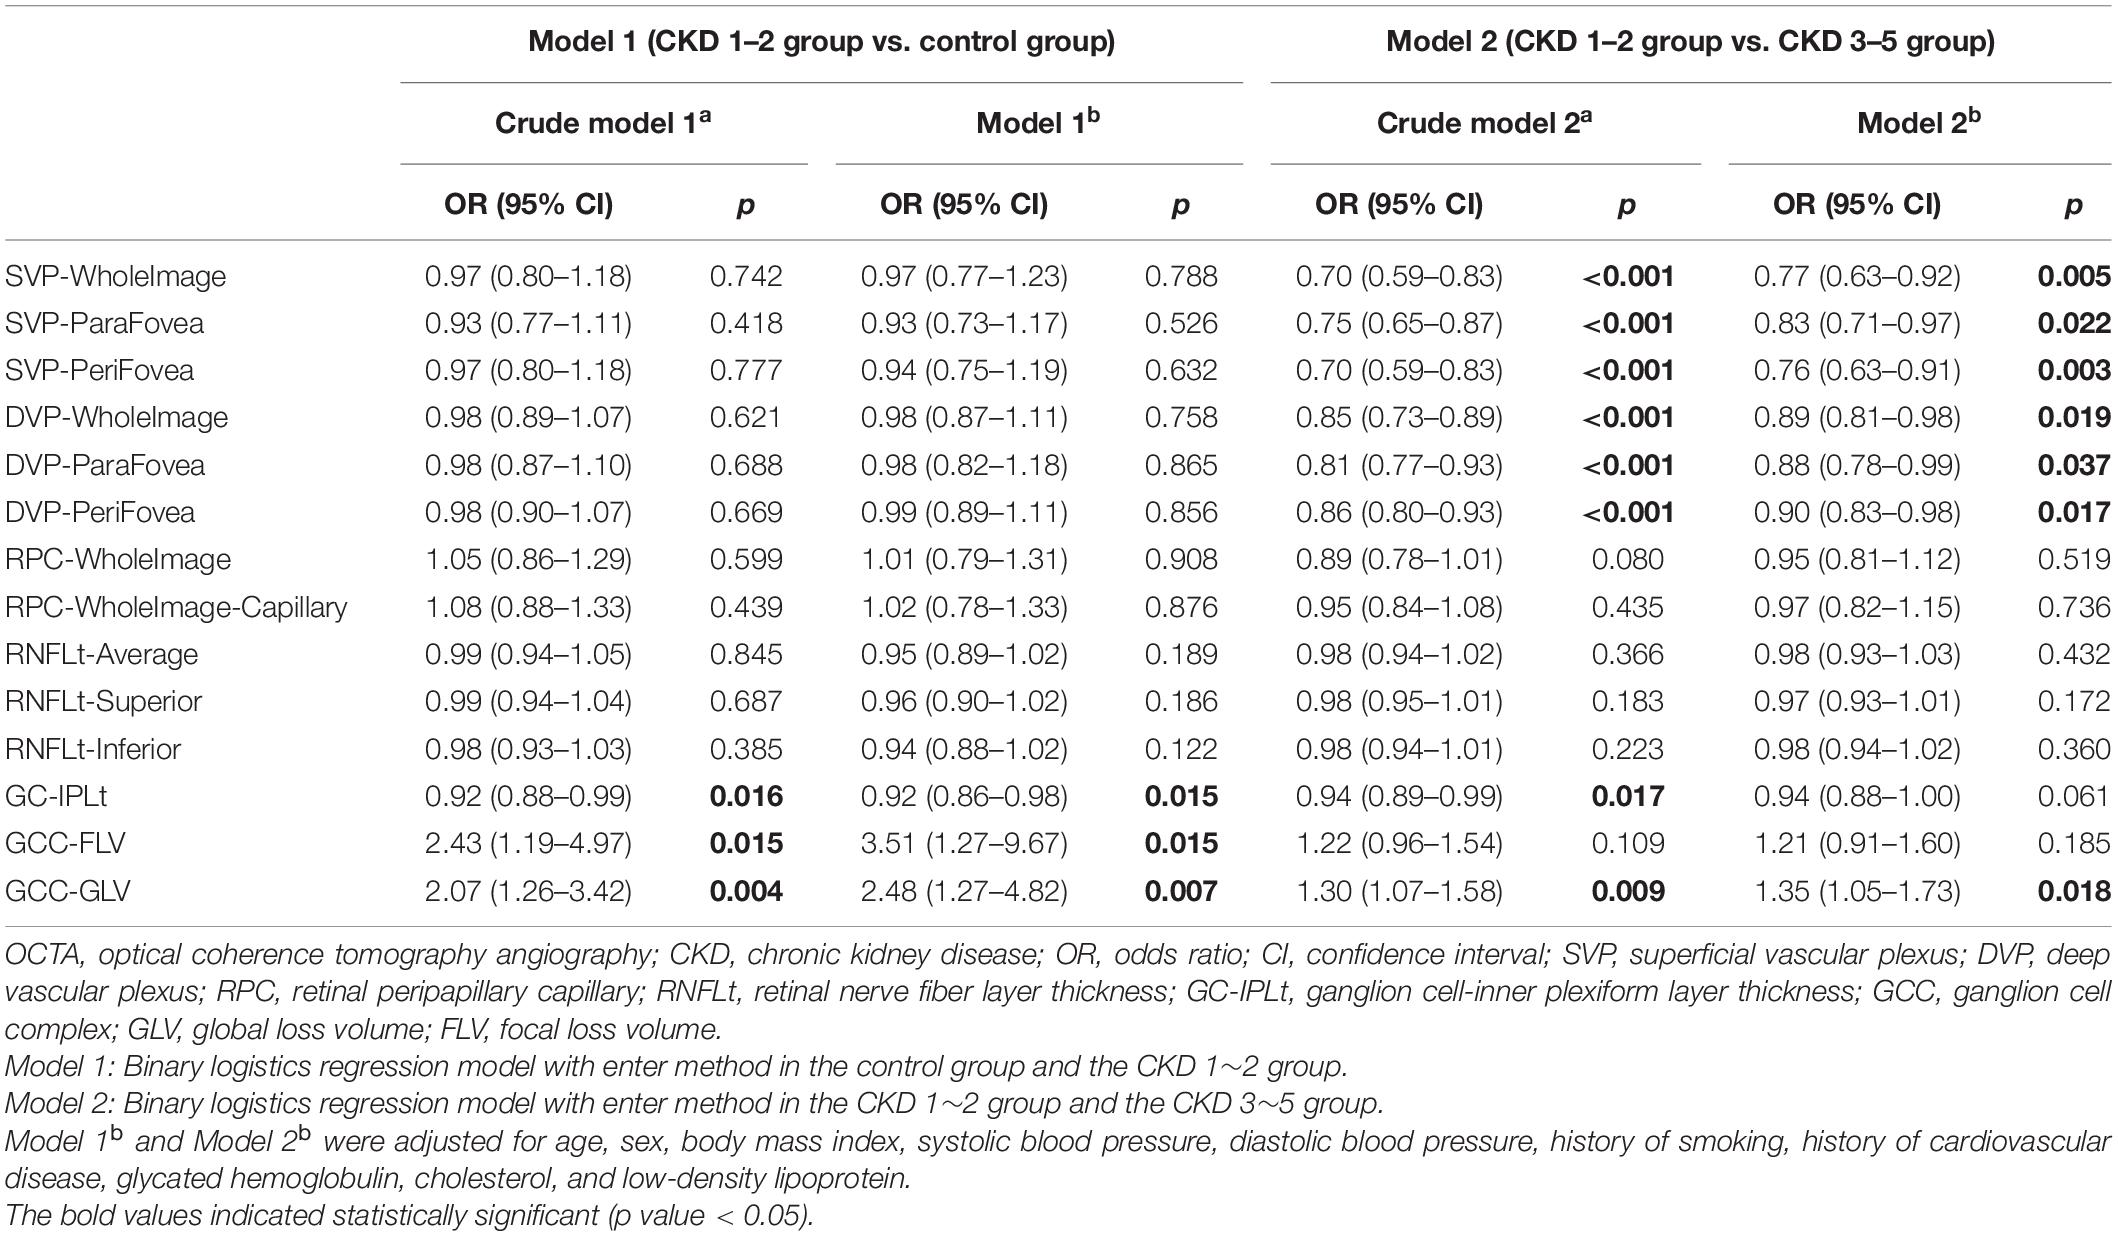
Table 3. Association between OCTA parameters and severity of CKD.
The results of partial correlation analyses of OCTA parameters and CKD-related parameters among all 115 CKD patients were shown in Table 4. The results showed that all retinal microvascular parameters as well as GC-IPLt were positively correlated with eGFR and HGB (r = 0.199∼0.355, all p < 0.05) and negatively with β2-M, BUN, and PTH (r = –0.185 ∼ –0.354, all p < 0.05). Furthermore, GCC-FLV and GCC-GLV were positively correlated with β2-M, BUN, UPCR, UACR, and PTH (r = 0.193∼0.344, all p < 0.05) and negatively with eGFR (r = −0.200∼−0.276, all p < 0.05). Partial correlation of GCC variables and eGFR were shown in Supplementary Figure S4.
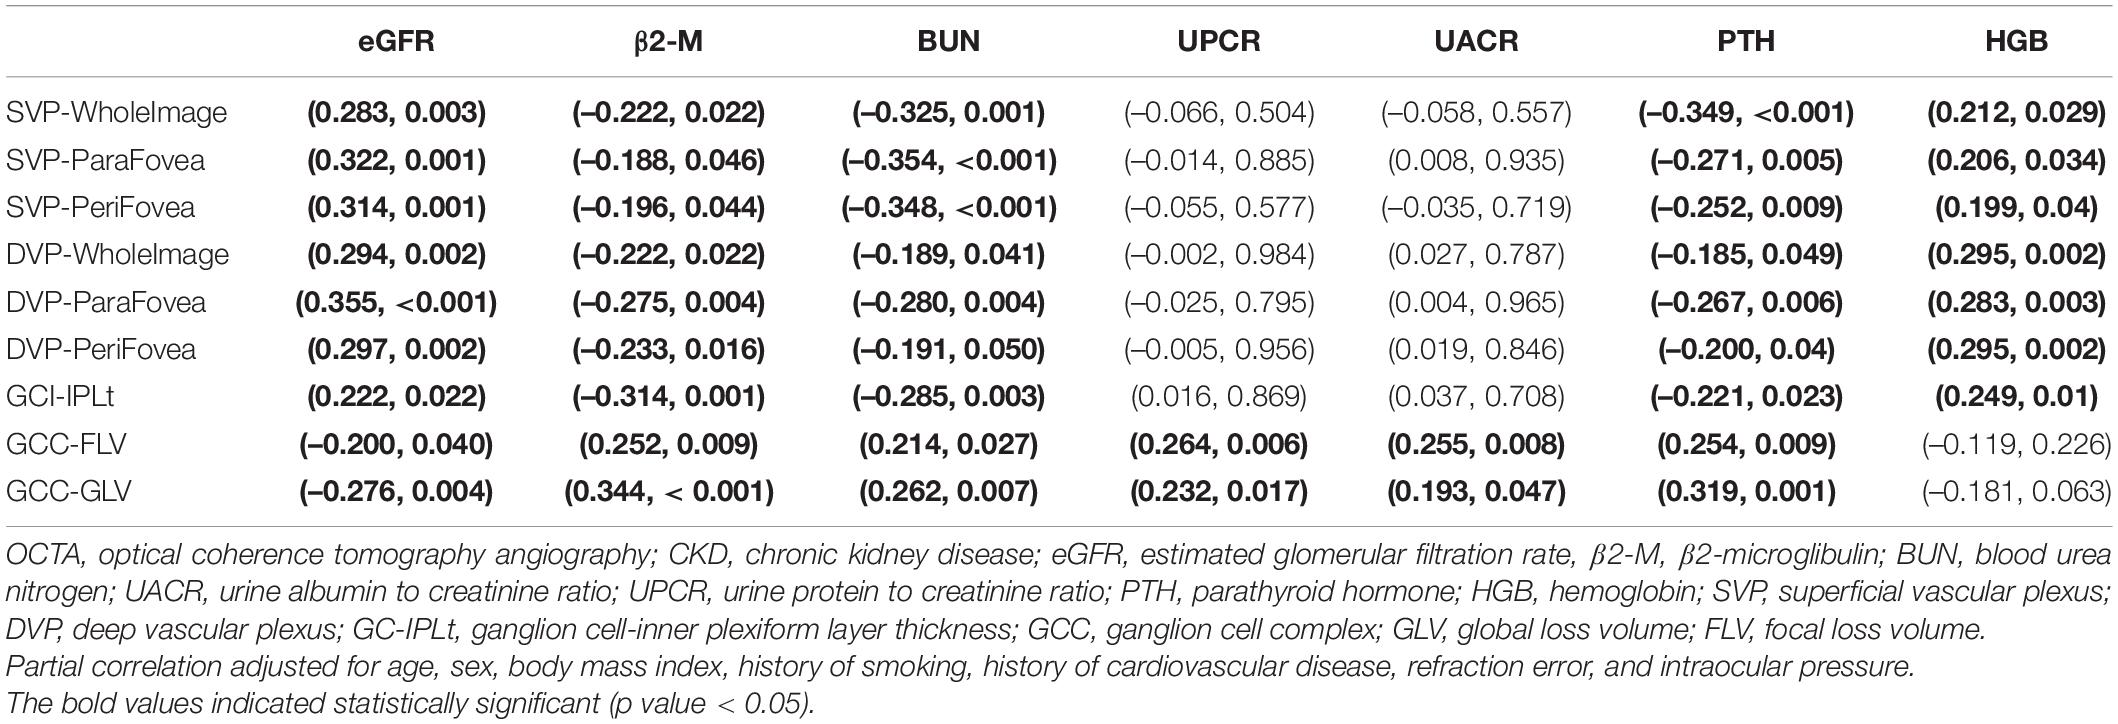
Table 4. Partial correlation between OCTA parameters and CKD-related data (115 CKD patients).
The result of stepwise multivariate linear regression between OCTA parameters and clinical data among all 115 CKD patients was presented in Table 5. β2-M was associated with thinner GC-IPLt (β: –0.294; 95% CI: –0.469∼–0.118), where PTH was associated with higher GCC-FLV (β: 0.004; 95% CI: 0.002∼0.006) and GCC-GLV (β: 0.007; 95% CI: 0.004∼0.01) among CKD patients. UACR was also found associated with higher GCC-FLV (β: 0.003; 95% CI: 0.001∼0.004) and GCC-GLV (β: 0.003; 95% CI: 0.001∼0.006). Besides, the results showed that the eGFR was positively associated with VD in SVP-WholeImage (β: 0.029; 95% CI: 0.017∼0.041), SVP-ParaFovea (β: 0.021; 95% CI: 0.002∼0.040), SVP-PeriFovea (β: 0.029; 95% CI: 0.016∼0.041), DVP-WholeImage (β: 0.033; 95% CI: 0.007∼0.058), DVP-ParaFovea (β: 0.044; 95% CI: 0.024∼0.065), and DVP-PeriFovea (β: 0.037; 95% CI: 0.008∼0.066).
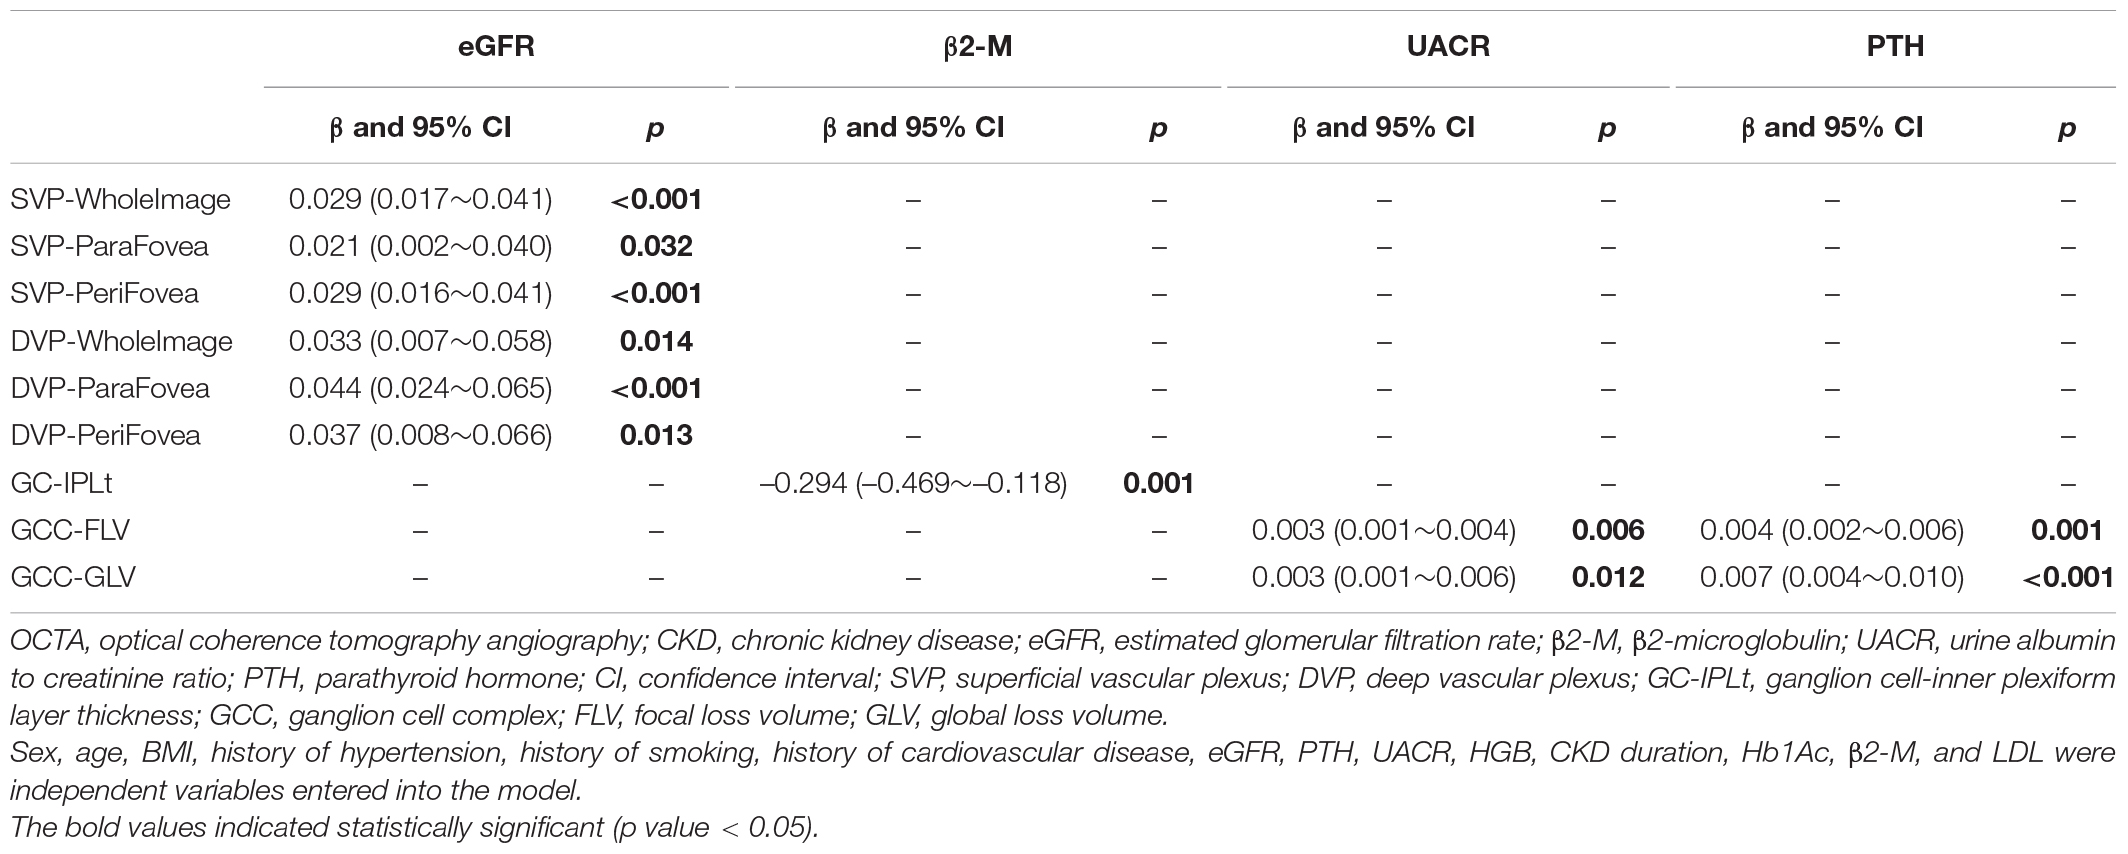
Table 5. Stepwise multivariate linear regression between OCTA parameters and CKD-related parameters (115 CKD patients).
The results of correlation analyses of BCVA and OCTA parameters among all subjects were shown in Table 6. BCVA (LogMAR) was negatively correlated with VD in SVP and DVP (r = –0.399 ∼ –0.514, all p < 0.05), while positively with GCC-GLV (r = 0.201, p = 0.014).
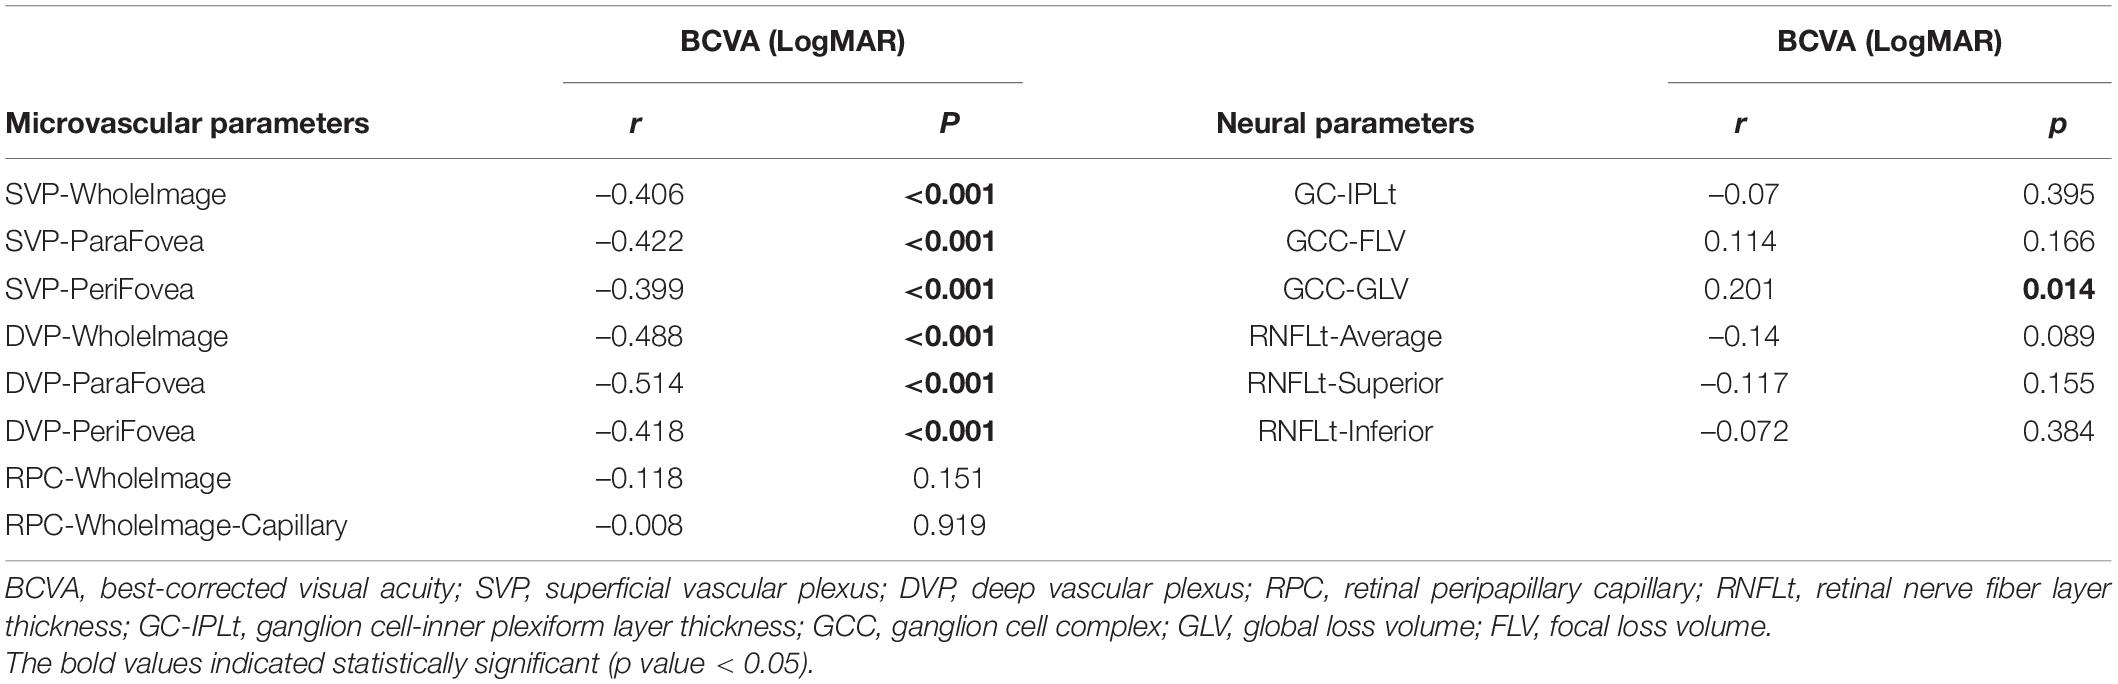
Table 6. Correlations of retinal neurovascular parameters and BCVA (LogMAR).
Two crucial findings were observed in this cross-sectional study. Firstly, our study revealed that retinal ganglion cell complex impairment occurs in the early stages (CKD stages 1–2) without detectable retinal microvascular rarefaction and RNFL damage in non-diabetic and non-dialytic CKD patients. Secondly, among CKD patients, the accumulation of uremic toxins of β2-M and PTH, and higher UACR was independently associated with retinal ganglion cell complex impairment, while reduced eGFR was associated with deceased retinal microvascular perfusion.
The major finding of this study is that increased GCC-FLV and GCC-GLV, and thinner GC-IPL could be detected in earlier CKD stages (stages 1–2), while no significant difference was found in all retinal microvascular parameters and RNFLt in the CKD 1–2 group compared to the control group, suggesting that retinal neuronal impairment has already existed in early CKD stages even in the absence of histologically assessed microvascular rarefaction and retinal axon damage. In fact, neurological complications, such as cognitive deterioration, cerebrovascular stroke, and cranial neuropathy, are common in CKD patients (Hamed, 2019). Recent population-based studies have documented an association between early stages of CKD and impaired cognition (Elias et al., 2009; Tsai et al., 2010). Given that the GC-IPL layer is where the retinal ganglion cell bodies are located, we postulated that it could serve as a window to observe CKD-related neuronal cell body loss in the CNS, particularly in the early stages of CKD. A recent population-based study consisting of 4464 non-glaucoma, multi-ethnic Asian participants showed that the presence of CKD is significantly associated with thinner GC-IPL (Tham et al., 2020). Furthermore, a prior study (Wu et al., 2020) also confirmed that macular thinning (GC-IPL and RNFLt) is a characteristic of retinal neural impairment in patients with CKD and such impairment is strongly associated with decreased eGFR. However, the definition of CKD applied in the aforementioned studies was based on an eGFR of <60 ml/min/1.73 m2 (CKD stages 3–5) and failed to include earlier stages CKD patients with an eGFR of > 60 ml/min/1.73 m2 (namely, CKD stages 1–2) using parameters such as proteinuria or UACR to detect early renal damage and declining renal function. Our study evaluated retinal neural parameters in non-diabetic CKD patients of stages 1–2 (versus health subjects) and revealed that retinal neuronal impairment, which might even precede microvascular rarefaction and retinal axon damage, could be detected in earlier CKD stages than those reported in prior studies (Jung et al., 2020; Wu et al., 2020).
On the other hand, significantly decreased RNFLt was observed in CKD patients according to previous studies (Demir et al., 2009; Jung et al., 2020; Wu et al., 2020). However, our study failed to detect significantly decreased RNFLt in either the CKD 1–2 group or the CKD 3–5 group compared to the control group. Two possible reasons may suffice to explain this conflicting result: firstly, significant reduced RNFLt were detected in end-stage renal disease patients which have been treated with dialysis in previous studies (Demir et al., 2009; Jung et al., 2020). But in our study, patients undergoing dialysis were excluded because dialysis itself might exert a significant impact on the neurovascular system. Thus, our results suggested that RNFL thickness is not reduced in non-dialysis CKD patients. Second, exclusion of DM patients may also play an important role. A previous study (Wu et al., 2020) reported significantly reduced RNFLt in CKD patients in stages 3–5. However, diabetic patients accounted for 42% of the CKD group in their study. It is reported that RNFLt could be significantly reduced even in preclinical DR stages (Zeng et al., 2019), suggesting that RNFL is highly susceptible to hyperglycemic injury. Diabetic patients were excluded from our study to avoid its strong impact on retinal neurovascular structures. Taken together, it could be speculated that RNFL damage might not be present in non-diabetic and non-dialytic CKD patients. With the progression of CKD, the RNFLt might reduce independently or secondary to GCC loss and retinal capillary rarefaction.
Stepwise multivariate linear regression was used to figure out independent risk factors associated with neurovascular alterations in the CKD patients of our study. It was shown that higher β2-M was associated with thinner GG-IPLt, and excessive PTH was associated with increased GCC-FLV and GCC-GLV, indicating the underlying pathophysiology of retinal neurodegeneration in CKD patients was related to the neurotoxic effects exerted by uremic toxins. In fact, as CKD progresses, there is the accumulation of organic toxic products which is considered highly associated with the incidence and progression of neurological complications (Hamed, 2019). Our results showed that GC-IPLt was independently associated with β2-M, after adjusting other confounding factors. The plasmatic level of β2-M increases as the kidney function gets impaired. The present study found that neuronal cell impairment in the retina was associated with the β2-M, which is supported by a previous study confirming the cytotoxic activity of β2-M on neuronal cell lines (Giorgetti et al., 2009). Excessive PTH can increase the influx of calcium into the brain which interferes with neurotransmission in the CNS and induces neurotoxicity (Cogan et al., 1978); therefore, it is considered to be neurotoxic and associated with cognitive dysfunction in CKD patients (Craver et al., 2007). Therefore, it is possible that GCC loss could be used as a biomarker to indicate or even predict CNS neuronal loss in CKD patients.
Another interesting finding is that higher UACR was independently associated with increased GCC-FLV and GCC-GLV. Previous studies have documented that albuminuria was independently associated with POAG (Kim et al., 2016), an ocular disease characterized by loss of the retinal ganglion cells in the retina (Shin et al., 2018), suggesting that albuminuria might be associated with retinal ganglion cell loss. In this regard, albuminuria (as indicated by higher UACR) might be a potential biomarker suggestive of neuronal damage in the retina. However, no association was found between UACR and decreased VD in SVP and DVP regions in CKD patients. In fact, the associations between albuminuria and retinal VD are controversial. A prior study reported that higher UACR was inversely related to SCP VD in non-diabetic hypertensive CKD patients (Vadala et al., 2019), while another research (Zhuang et al., 2020) showed that increased UACR was not associated with the VD in both SVP and DVP regions. Future studies are required to confirm the association between albuminuria and retinal VD alterations.
In addition, we also found that retinal VD decrease was detected in more advanced CKD stages (stages 3–5) and was associated with declined eGFR. This is consistent with the fact that microangiopathy and cardiovascular complications of CKD are also more prevalent in these patients (Houben et al., 2017). Thus, the retinal VD could serve as a biomarker to monitor the condition of systemic microvasculature in CKD patients and alert the risks of cardiovascular complications (Farrah et al., 2020). In fact, as the eGFR declining, the combination of uremia exposure (Zoccali et al., 2017), renal anemia (Chen et al., 2019), and impaired endothelial dysfunction compromise the structure and function of the systemic microcirculation (Ooi et al., 2011), which is considered a crucial pathway in the development and progression of cardiovascular complications of CKD (Houben et al., 2017). Our study also suggests that non-invasive imaging of the retinal vessels may reflect these systemic microvascular alterations, providing valuable information for identifying patients at risk of developing CKD-related cardiovascular complications.
There are two major implications of our findings. Firstly, strict control of uremia and close monitoring of neuronal impairment should be started in CKD patients at early stages (eGFR of > 60 ml/min/1.73m2), and parameters of the retinal ganglion cell complex layer can be used as indicators of early neuronal damage in these patients. Secondly, once retinal neuronal damage (such as GCC loss) is detected, the eGFR should be closely monitored to reduce CKD-related microangiopathy and other adverse cardiovascular complications.
There are two main strengths of our study. Firstly, by including patients with stages 1–2 CKD without diabetes and dialysis history, we were able to detect retinal neuronal impairment in early stages of CKD. Secondly, we also determine systemic risk factors associated with retinal neuronal damage and retinal capillary rarefaction in CKD patients. However, there are limitations in our study. Firstly, the cross-sectional design of our study prevented determining temporality and causal association between retinal neuronal impairment and microvascular hypoperfusion in CKD patients at different stages. The temporal sequence of the reported associations is needed to be validated in prospective cohort studies. Also, in patients with advanced stages of CKD, retinal microvasculature disease may be present even after kidney transplant (Ooi et al., 2015); it is important to explore more details about retinal neurovascular changes after renal replacement therapy. Secondly, the present study was also limited by its relatively limited sample size and further studies with larger sample sizes are required to confirm the findings in our future researches. Thirdly, some of the baseline variations, such as age and BMI, were not comparable among the three groups. Therefore, we adjusted them using binary logistic regression analysis to minimize the bias and made the results more reliable during the statistical analysis. Fourthly, we did not test the retinal function of CKD patients except visual acuity. In further investigations, we are going to evaluate retinal functions using multifocal electroretinogram (mfERG) in CKD patients to clarify the relationships between retinal neurovascular damages and retinal functions.
Retinal neuronal impairment is present in early stages of CKD (stages 1–2) and it is associated with accumulation of uremic toxins and higher UACR, while retinal microvascular hypoperfusion, which is associated with worse eGFR, was only observed in relatively advanced stages of CKD (stages 3–5). The results highlight the importance of monitoring retinal neurovascular impairment in different stages of CKD.
The raw data supporting the conclusions of this article will be made available by the authors, upon request to HY, eXVob25naHVhQGdhZHBoLm9yZy5jbg==.
The studies involving human participants were reviewed and approved by the Research Ethics Committee of Guangdong Provincial People’s Hospital [registration number: GDREC2020069(R1)]. The patients/participants provided their written informed consent to participate in this study.
HY, XY, ZY, XZ, YH, and YC: conception and design. XZ, YL, BL, PZ, YX, CL, GW, HK, ZL, ZD, YR, and YF: analysis and interpretation of data. XZ, YH, YC, and ZL: drafting the manuscript and revising it. HY, XY, ZY, XZ, YH, and YC: providing intellectual content of critical importance to the work described. All authors approved the final version to be published.
This study was supported by the National Natural Science Foundation of China (Grant 81870663 of HY), the Science and Technology Program of Guangzhou (Grant 202002030074 of HY and Grant 202002020049 of XY), the Outstanding Young Talent Trainee Program of Guangdong Provincial People’s Hospital (Grant KJ012019087 of HY), the GDPH Scientific Research Funds for Leading Medical Talents and Distinguished Young Scholars in Guangdong Province (Grant KJ012019457 of HY), the talent introduction fund of Guangdong Provincial People’s Hospital (Grant Y012018145 of HY), the Technology Innovation Guidance Program of Hunan Province (Grant 2018SK50106 of YH), and the Science Research Foundation of Aier Eye Hospital Group (Grant AR1909D2, AM1909D2 of YH). The funders had no role in the conduct of the surgery; collection, analysis, and interpretation of the data; preparation, review, or approval of the manuscript; and decision to submit the manuscript for publication.
The authors declare that the research was conducted in the absence of any commercial or financial relationships that could be construed as a potential conflict of interest.
All claims expressed in this article are solely those of the authors and do not necessarily represent those of their affiliated organizations, or those of the publisher, the editors and the reviewers. Any product that may be evaluated in this article, or claim that may be made by its manufacturer, is not guaranteed or endorsed by the publisher.
We would like to thank the staff of the Nephrology Department of Guangdong Provincial People’s Hospital for their assistance with the recruitment of the participants.
The Supplementary Material for this article can be found online at: https://www.frontiersin.org/articles/10.3389/fnins.2021.703898/full#supplementary-material
Chen, Z., Mo, Y., Ouyang, P., Shen, H., Li, D., and Zhao, R. (2019). Retinal vessel optical coherence tomography images for anemia screening. Med. Biol. Eng. Comput. 57, 953–966. doi: 10.1007/s11517-018-1927-8
Chua, S. Y. L., Lascaratos, G., Atan, D., Zhang, B., Reisman, C., Khaw, P. T., et al. (2020). Relationships between retinal layer thickness and brain volumes in the UK Biobank cohort. Eur. J. Neurol. 28, 1490–1498. doi: 10.1111/ene.14706
Cogan, M. G., Covey, C. M., Arieff, A. I., Wisniewski, A., Clark, O. H., Lazarowitz, V., et al. (1978). Central nervous system manifestations of hyperparathyroidism. Am. J. Med. 65, 963–970.
Craver, L., Marco, M. P., Martinez, I., Rue, M., Borras, M., Martin, M. L., et al. (2007). Mineral metabolism parameters throughout chronic kidney disease stages 1-5–achievement of K/DOQI target ranges. Nephrol. Dial. Transplant. 22, 1171–1176. doi: 10.1093/ndt/gfl718
Demir, M. N., Eksioglu, U., Altay, M., Tok, O., Yilmaz, F. G., Acar, M. A., et al. (2009). Retinal nerve fiber layer thickness in chronic renal failure without diabetes mellitus. Eur. J. Ophthalmol. 19, 1034–1038. doi: 10.1177/112067210901900621
Den Haan, J., Csinscik, L., Parker, T., Paterson, R. W., Slattery, C. F., Foulkes, A., et al. (2019). Retinal thickness as potential biomarker in posterior cortical atrophy and typical Alzheimer’s disease. Alzheimers Res. Ther. 11:62. doi: 10.1186/s13195-019-0516-x
Elias, M. F., Elias, P. K., Seliger, S. L., Narsipur, S. S., Dore, G. A., and Robbins, M. A. (2009). Chronic kidney disease, creatinine and cognitive functioning. Nephrol. Dial. Transplant. 24, 2446–2452.
Farrah, T., Dhillon, B., Keane, P., Webb, D., and Dhaun, N. (2020). The eye, the kidney, and cardiovascular disease: old concepts, better tools, and new horizons. Kidney Int. 98, 323–342. doi: 10.1016/j.kint.2020.01.039
Foreman, K., Marquez, N., Dolgert, A., Fukutaki, K., Fullman, N., Mcgaughey, M., et al. (2018). Forecasting life expectancy, years of life lost, and all-cause and cause-specific mortality for 250 causes of death: reference and alternative scenarios for 2016-40 for 195 countries and territories. Lancet 392, 2052–2090. doi: 10.1016/S0140-6736(18)31694-5
Futrakul, N., Butthep, P., and Futrakul, P. (2008). Altered vascular homeostasis in chronic kidney disease. Clin. Hemorheol. Microcirc. 38, 201–207.
Giorgetti, S., Raimondi, S., Cassinelli, S., Bucciantini, M., Stefani, M., Gregorini, G., et al. (2009). beta2-Microglobulin is potentially neurotoxic, but the blood brain barrier is likely to protect the brain from its toxicity. Nephrol. Dial. Transplant. 24, 1176–1181. doi: 10.1093/ndt/gfn623
Hamed, S. A. (2019). Neurologic conditions and disorders of uremic syndrome of chronic kidney disease: presentations, causes, and treatment strategies. Expert Rev. Clin. Pharmacol. 12, 61–90. doi: 10.1080/17512433.2019.1555468
Hart, N. J., Koronyo, Y., Black, K. L., and Koronyo-Hamaoui, M. (2016). Ocular indicators of Alzheimer’s: exploring disease in the retina. Acta Neuropathol. 132, 767–787. doi: 10.1007/s00401-016-1613-6
Hormel, T. T., Jia, Y., Jian, Y., Hwang, T. S., Bailey, S. T., Pennesi, M. E., et al. (2021). Plexus-specific retinal vascular anatomy and pathologies as seen by projection-resolved optical coherence tomographic angiography. Prog. Retin. Eye Res. 80:100878. doi: 10.1016/j.preteyeres.2020.100878
Houben, A., Martens, R. J. H., and Stehouwer, C. D. A. (2017). Assessing microvascular function in humans from a chronic disease perspective. J. Am. Soc. Nephrol. 28, 3461–3472. doi: 10.1681/asn.2017020157
Jung, S., Bosch, A., Ott, C., Kannenkeril, D., Dienemann, T., Harazny, J. M., et al. (2020). Retinal neurodegeneration in patients with end-stage renal disease assessed by spectral-domain optical coherence tomography. Sci. Rep. 10:5255. doi: 10.1038/s41598-020-61308-4
Kashani, A. H., Asanad, S., Chan, J. W., Singer, M. B., Zhang, J., Sharifi, M., et al. (2021). Past, present and future role of retinal imaging in neurodegenerative disease. Prog. Retin. Eye Res. 83:100938. doi: 10.1016/j.preteyeres.2020.100938
Kim, G. A., Park, S. H., Ko, J., Lee, S. H., Bae, H. W., Seong, G. J., et al. (2016). Albuminuria is associated with open-angle glaucoma in nondiabetic korean subjects: a cross-sectional study. PLoS One 11:e0168682. doi: 10.1371/journal.pone.0168682
Kurella, M., Yaffe, K., Shlipak, M. G., Wenger, N. K., and Chertow, G. M. (2005). Chronic kidney disease and cognitive impairment in menopausal women. Am. J. Kidney Dis. 45, 66–76.
Levey, A., Stevens, L., Schmid, C., Zhang, Y., Castro, A., Feldman, H., et al. (2009). A new equation to estimate glomerular filtration rate. Ann. Intern. Med. 150, 604–612.
Mutlu, U., Colijn, J. M., Ikram, M. A., Bonnemaijer, P. W. M., Licher, S., Wolters, F. J., et al. (2018). Association of retinal neurodegeneration on optical coherence tomography with dementia: a population-based study. JAMA Neurol. 75, 1256–1263. doi: 10.1001/jamaneurol.2018.1563
O’bryhim, B. E., Apte, R. S., Kung, N., Coble, D., and Van Stavern, G. P. (2018). Association of preclinical alzheimer disease with optical coherence tomographic angiography findings. JAMA Ophthalmol. 136, 1242–1248.
Ooi, Q. L., Tow, F. K., Deva, R., Alias, M. A., Kawasaki, R., Wong, T. Y., et al. (2011). The microvasculature in chronic kidney disease. Clin. J. Am. Soc. Nephrol. 6, 1872–1878.
Ooi, Q. L., Tow, F. K., Deva, R., Kawasaki, R., Wong, T. Y., Colville, D., et al. (2015). Microvascular disease after renal transplantation. Kidney Blood Press. Res. 40, 575–583.
Peng, Q., Hu, Y., Huang, M., Wu, Y., Zhong, P., Dong, X., et al. (2020). Retinal neurovascular impairment in patients with essential hypertension: an optical coherence tomography angiography study. Invest. Ophthalmol. Vis. Sci. 61:42. doi: 10.1167/iovs.61.8.42
Pujari, A., Bhaskaran, K., Sharma, P., Singh, P., Phuljhele, S., Saxena, R., et al. (2020). Optical coherence tomography angiography in neuro-ophthalmology: current clinical role and future perspectives. Surv. Ophthalmol. 66, 471–481. doi: 10.1016/j.survophthal.2020.10.009
Raskin, N. H., and Fishman, R. A. (1976). Neurologic disorders in renal failure (second of two parts). N. Engl. J. Med. 294, 204–210.
Robbins, C. B., Thompson, A. C., Bhullar, P. K., Koo, H. Y., Agrawal, R., Soundararajan, S., et al. (2021). Characterization of retinal microvascular and choroidal structural changes in parkinson disease. JAMA Ophthalmol. 139, 182–188. doi: 10.1001/jamaophthalmol.2020.5730
Shin, J. W., Sung, K. R., and Park, S. W. (2018). Patterns of progressive ganglion cell-inner plexiform layer thinning in glaucoma detected by OCT. Ophthalmology 125, 1515–1525. doi: 10.1016/j.ophtha.2018.03.052
Smogorzewski, M. J. (2001). Central nervous dysfunction in uremia. Am. J. Kidney Dis. 38, S122–S128.
Spaide, R., Fujimoto, J., Waheed, N., Sadda, S., and Staurenghi, G. (2018). Optical coherence tomography angiography. Prog. Retin. Eye Res. 64, 1–55.
Tham, Y. C., Chee, M. L., Dai, W., Lim, Z. W., Majithia, S., Siantar, R., et al. (2020). Profiles of Ganglion Cell-Inner Plexiform layer thickness in a multi-ethnic asian population: the singapore epidemiology of eye diseases study. Ophthalmology 127, 1064–1076. doi: 10.1016/j.ophtha.2020.01.055
Toto, L., Borrelli, E., Mastropasqua, R., Senatore, A., Di Antonio, L., Di Nicola, M., et al. (2016). Macular features in retinitis pigmentosa: correlations among ganglion cell complex thickness, capillary density, and macular function. Invest. Ophthalmol. Vis. Sci. 57, 6360–6366. doi: 10.1167/iovs.16-20544
Tsai, C. F., Wang, S. J., and Fuh, J. L. (2010). Moderate chronic kidney disease is associated with reduced cognitive performance in midlife women. Kidney Int. 78, 605–610. doi: 10.1038/ki.2010.185
Vadala, M., Castellucci, M., Guarrasi, G., Terrasi, M., La Blasca, T., and Mule, G. (2019). Retinal and choroidal vasculature changes associated with chronic kidney disease. Graefes Arch. Clin. Exp. Ophthalmol. 257, 1687–1698. doi: 10.1007/s00417-019-04358-3
Wanner, C., Amann, K., and Shoji, T. (2016). The heart and vascular system in dialysis. Lancet 388, 276–284. doi: 10.1016/s0140-6736(16)30508-6
Wu, I. W., Sun, C. C., Lee, C. C., Liu, C. F., Wong, T. Y., Chen, S. Y., et al. (2020). Retinal neurovascular changes in chronic kidney disease. Acta Ophthalmol. 98, e848–e855.
Yeung, L., Wu, I. W., Sun, C. C., Liu, C. F., Chen, S. Y., Tseng, C. H., et al. (2019). Early retinal microvascular abnormalities in patients with chronic kidney disease. Microcirculation 26:e12555.
Zeng, Y., Cao, D., Yu, H., Yang, D., Zhuang, X., Hu, Y., et al. (2019). Early retinal neurovascular impairment in patients with diabetes without clinically detectable retinopathy. Br. J. Ophthalmol. 103, 1747–1752.
Zhang, J., Tang, F. Y., Cheung, C., Chen, X., and Chen, H. (2021). Different effect of media opacity on automated and manual measurement of foveal avascular zone of optical coherence tomography angiographies. Br. J. Ophthalmol. 105, 812–818. doi: 10.1136/bjophthalmol-2019-315780
Zhang, J., Tang, F. Y., Cheung, C. Y., and Chen, H. (2020). Different effect of media opacity on vessel density measured by different optical coherence tomography angiography algorithms. Trans. Vis. Sci. Technol. 9:19. doi: 10.1167/tvst.9.8.19
Zhuang, X., Cao, D., Zeng, Y., Yang, D., Yao, J., Kuang, J., et al. (2020). Associations between retinal microvasculature/microstructure and renal function in type 2 diabetes patients with early chronic kidney disease. Diabetes Res. Clin. Pract. 168:108373. doi: 10.1016/j.diabres.2020.108373
Keywords: retinal imaging, neuronal impairment, microvascular hypoperfusion, optical coherence tomography angiography (OCTA), chronic kidney disease
Citation: Zeng X, Hu Y, Chen Y, Lin Z, Liang Y, Liu B, Zhong P, Xiao Y, Li C, Wu G, Kong H, Du Z, Ren Y, Fang Y, Ye Z, Yang X and Yu H (2021) Retinal Neurovascular Impairment in Non-diabetic and Non-dialytic Chronic Kidney Disease Patients. Front. Neurosci. 15:703898. doi: 10.3389/fnins.2021.703898
Received: 21 June 2021; Accepted: 11 October 2021;
Published: 18 November 2021.
Edited by:
Hubert Preissl, Institute for Diabetes Research and Metabolic Diseases (IDM), GermanyReviewed by:
Davide Viggiano, University of Campania Luigi Vanvitelli, ItalyCopyright © 2021 Zeng, Hu, Chen, Lin, Liang, Liu, Zhong, Xiao, Li, Wu, Kong, Du, Ren, Fang, Ye, Yang and Yu. This is an open-access article distributed under the terms of the Creative Commons Attribution License (CC BY). The use, distribution or reproduction in other forums is permitted, provided the original author(s) and the copyright owner(s) are credited and that the original publication in this journal is cited, in accordance with accepted academic practice. No use, distribution or reproduction is permitted which does not comply with these terms.
*Correspondence: Zhiming Ye, eWV6aGltaW5nQGdkcGgub3JnLmNu; Xiaohong Yang, c3l5YW5neGhAc2N1dC5lZHUuY24=; Honghua Yu, eXVob25naHVhQGdkcGgub3JnLmNu
†These authors have contributed equally to this work and share first authorship
Disclaimer: All claims expressed in this article are solely those of the authors and do not necessarily represent those of their affiliated organizations, or those of the publisher, the editors and the reviewers. Any product that may be evaluated in this article or claim that may be made by its manufacturer is not guaranteed or endorsed by the publisher.
Research integrity at Frontiers
Learn more about the work of our research integrity team to safeguard the quality of each article we publish.