 Meijie Liu
 Baojuan Li
 Dewen Hu
- 1Engineering Training Center, Xi’an University of Science and Technology, Xi’an, China
- 2College of Missile Engineering, Rocket Force University of Engineering, Xi’an, China
- 3School of Biomedical Engineering, Air Force Medical University, Xi’an, China
- 4College of Intelligence Science and Technology, National University of Defense Technology, Changsha, China
Machine learning methods have been frequently applied in the field of cognitive neuroscience in the last decade. A great deal of attention has been attracted to introduce machine learning methods to study the autism spectrum disorder (ASD) in order to find out its neurophysiological underpinnings. In this paper, we presented a comprehensive review about the previous studies since 2011, which applied machine learning methods to analyze the functional magnetic resonance imaging (fMRI) data of autistic individuals and the typical controls (TCs). The all-round process was covered, including feature construction from raw fMRI data, feature selection methods, machine learning methods, factors for high classification accuracy, and critical conclusions. Applying different machine learning methods and fMRI data acquired from different sites, classification accuracies were obtained ranging from 48.3% up to 97%, and informative brain regions and networks were located. Through thorough analysis, high classification accuracies were found to usually occur in the studies which involved task-based fMRI data, single dataset for some selection principle, effective feature selection methods, or advanced machine learning methods. Advanced deep learning together with the multi-site Autism Brain Imaging Data Exchange (ABIDE) dataset became research trends especially in the recent 4 years. In the future, advanced feature selection and machine learning methods combined with multi-site dataset or easily operated task-based fMRI data may appear to have the potentiality to serve as a promising diagnostic tool for ASD.
Introduction
As a pervasive neurodevelopmental disorder, autism spectrum disorder (ASD) is characterized by deficits in social communication and interaction and restricted and repetitive behaviors (Hull et al., 2017), which was known to be an urgent public health concern that could benefit from enhanced strategies to help identify ASD earlier (Jon et al., 2018). Diagnosed autism prevalence has risen dramatically over the last several decades (Nevison, 2014), and the causes have remained elusive, which have increasingly attracted numerous researchers to focus on it. Thus far, different advanced neuroimaging tools have been applied for ASD research, including structural and functional magnetic resonance imaging (MRI), positron emission tomography (PET), electroencephalography (EEG), magnetoencephalography (MEG), and novel protocols (Alessandro et al., 2017; Du et al., 2018). Among them, functional MRI (fMRI) studies involving task-based and resting-state fMRI (rs-fMRI) data occupy a large proportion. Especially with the appearance and development of freely available rs-fMRI databases, such as the Autism Brain Imaging Data Exchange (Martino et al., 2014)1, which provides functional and structural brain imaging datasets collected from more than 24 different independent sites, researchers from different countries have expanded a series of studies based on it. In this paper, the review about ASD classification is restricted to fMRI data for more specific analysis. The aforementioned fMRI data consist of rs-fMRI data and task-based fMRI data, which are collected from scanning the brain using fMRI technology while the subject is resting and performing a special task, respectively.
For the last decade, there have been a variety of methods proposed to investigate the potential difference between ASD patients and typical controls (TCs) from different levels using fMRI data. It is well known that machine learning methods have been widely applied to brain disorder research such as schizophrenia, depression, Alzheimer disease, ASD, and so on (Davatzikos et al., 2006; Fan et al., 2008; Cuingnet et al., 2011; Du et al., 2012; Arbabshirani et al., 2013; Zeng et al., 2014; Patel et al., 2015), especially with their rapid development. Recent progress in machine learning has been driven both by the development of new learning algorithms and theory and by the ongoing explosion in the availability of online data and low-cost computation (Jordan and Mitchell, 2015). Notwithstanding the fact that there have existed great quantity of research on classifications for ASD and the TCs, a specialized systematic review about them is lacking. While different approaches have different assumptions and advantages, a detailed review is important to help us understand the ways in which these approaches have been used. Wolfers et al. published a review about pattern recognition for neuroimage-based psychiatric diagnostics in which ASD was mentioned as a little part (Wolfers et al., 2015). Du et al. (2018) have reviewed relative literatures on classification and prediction of brain disorders using functional connectivity (FC) but not limited to ASD. Hyde et al. provide a comprehensive review of 45 papers utilizing supervised machine learning in ASD but not limited to fMRI data (Hyde et al., 2019).
In this paper, we exhibit a review by summarizing 47 literatures involving classifications using fMRI data between ASD patients and TCs. The general process of autism spectrum disorder studies using fMRI data and machine learning was illustrated in Figure 1. The purpose of this review is to (1) summarize relatively representative papers from the following aspects to find out their commonality and differentiation: classification features involved, machine learning methods, classification performance, and factors on classification results; (2) reveal critical consistent or novel conclusions about discriminant brain regions, networks, and explanations for behavioral characteristics of ASD in the literatures; and (3) give feasible work directions for future progress in the field.
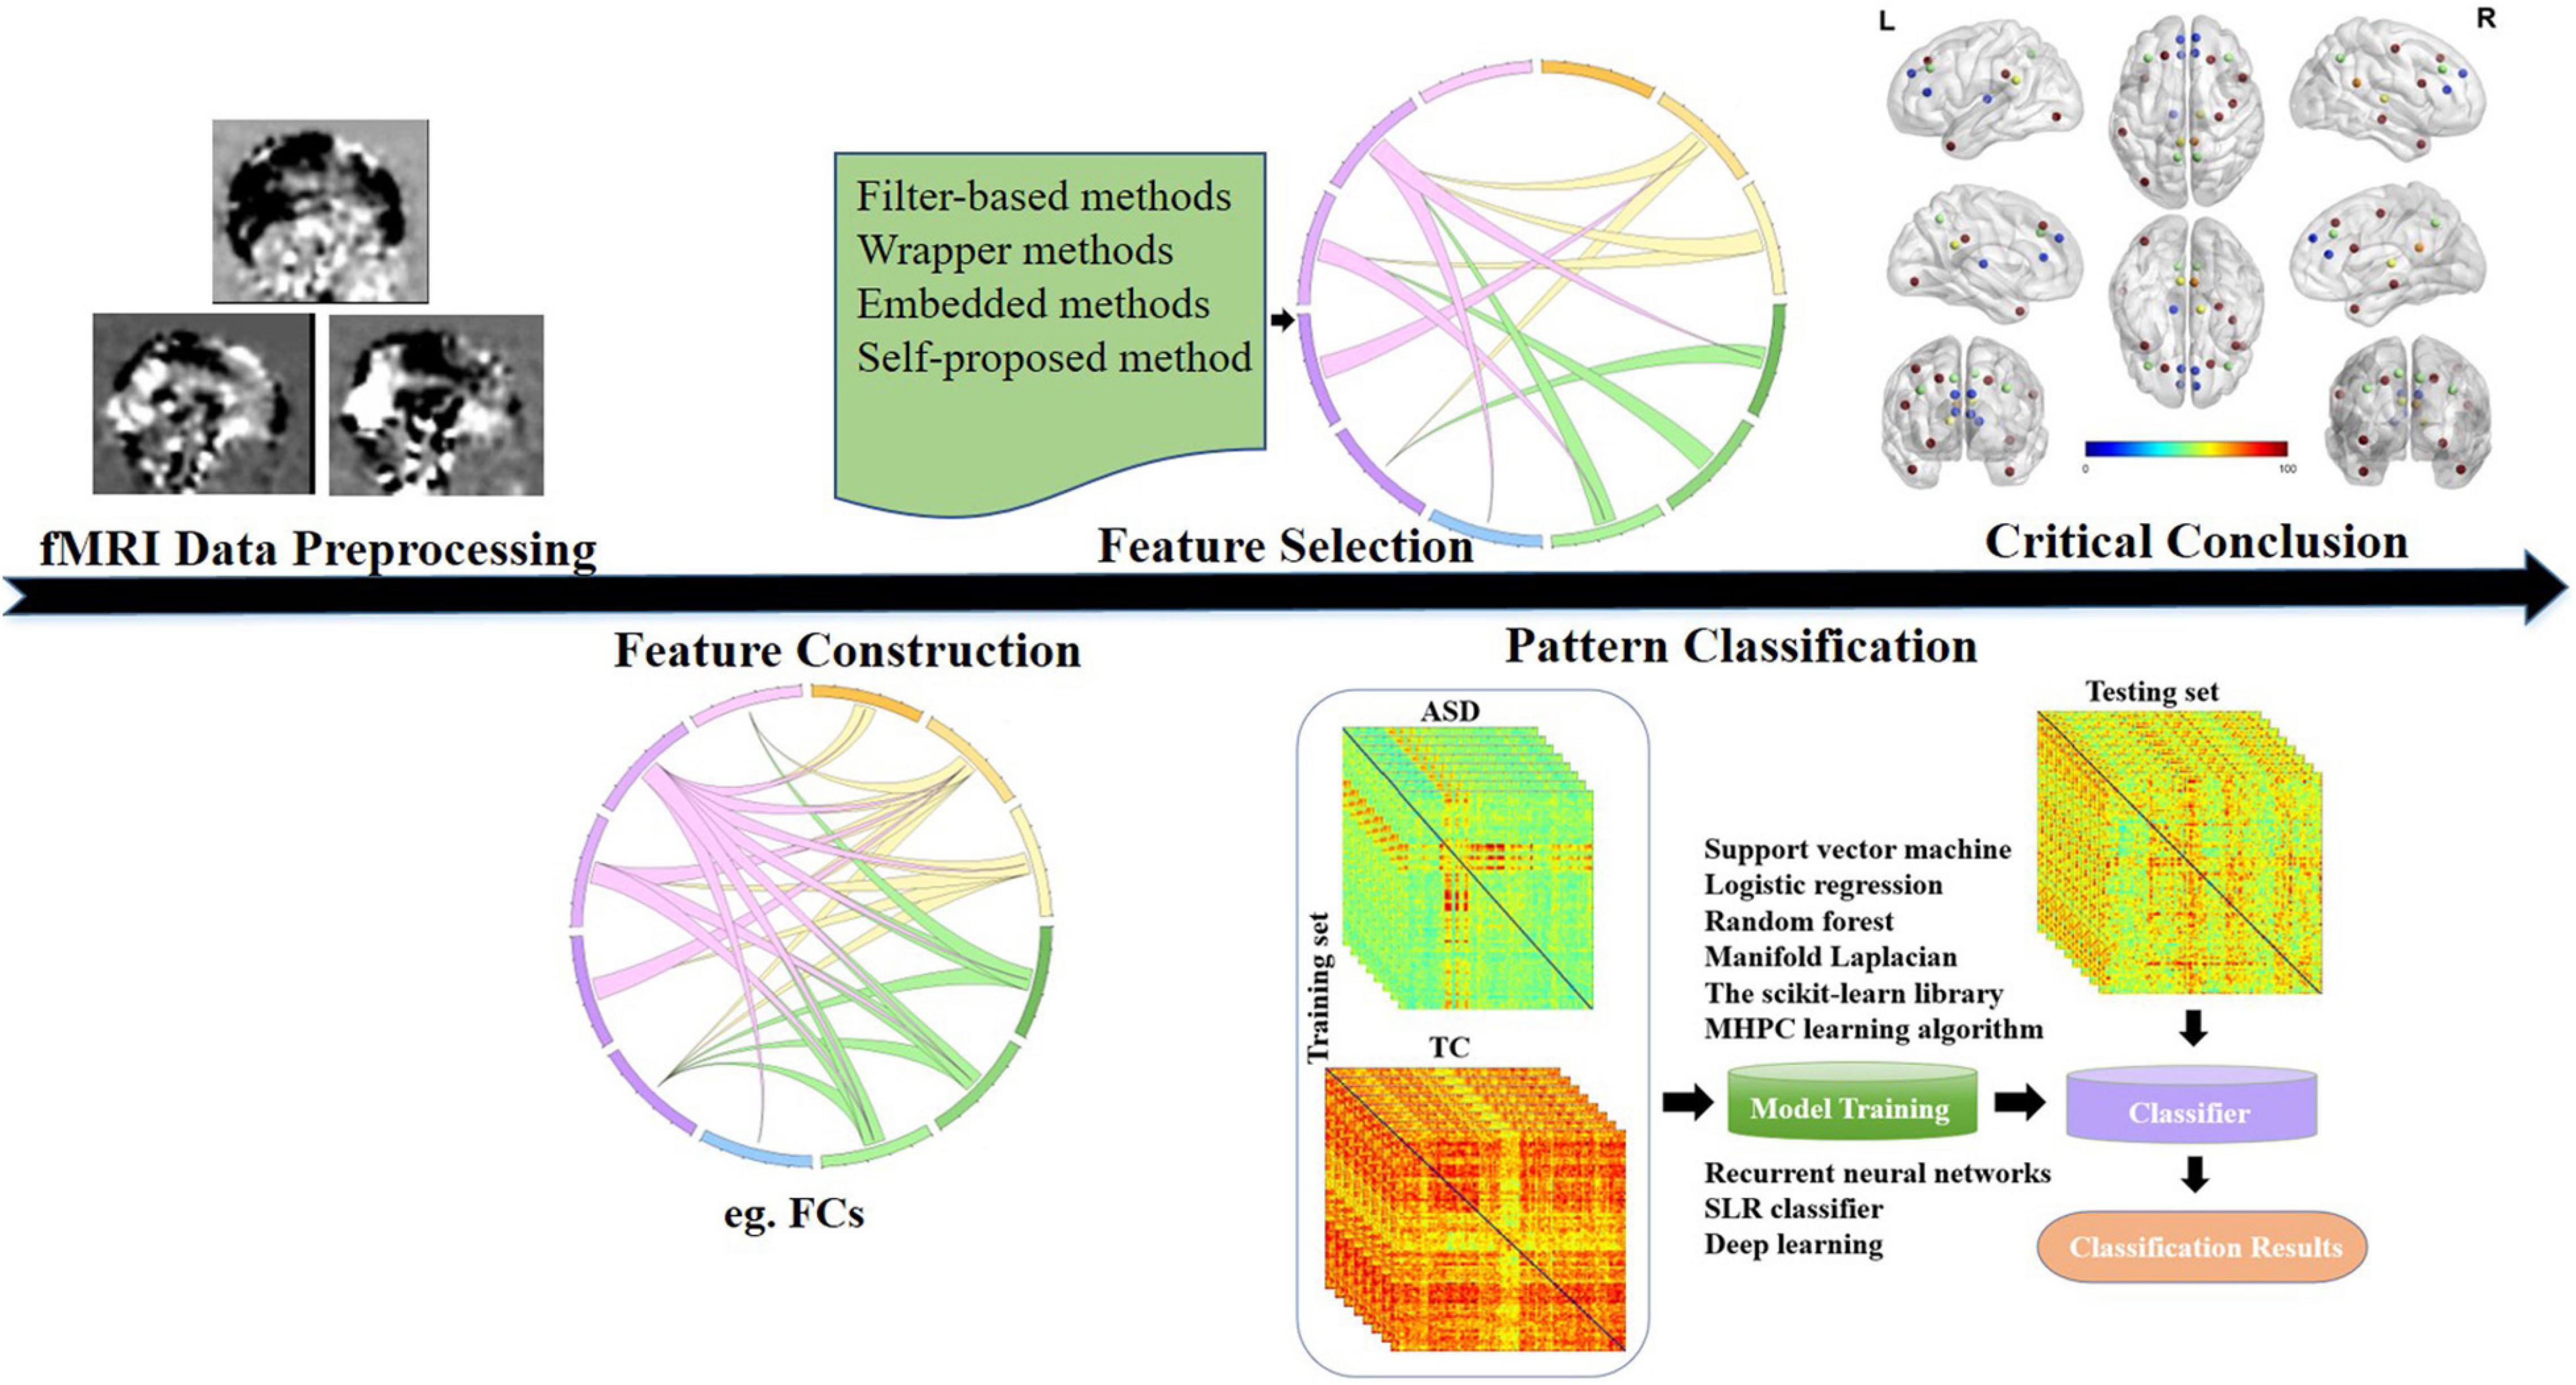
Figure 1. General process of ASD studies using fMRI data and machine learning (taking FC features for example). ASD, autism spectrum disorder; fMRI, functional magnetic resonance imaging; FC, functional connectivity.
fMRI Data Sources
It is well known that spontaneous fluctuations in the blood oxygenation level-dependent (BOLD) signal, as measured by fMRI, present a valuable data resource for delineating the human neural functional architecture (Cole et al., 2010). fMRI, including rs-fMRI and task-based fMRI, has become one of the primary tools of cognitive neuroscience. From analysis of the papers detailed in Table 1, it was obviously found that there are mainly three types of fMRI data sources, which are self-acquisition data, the cooperation agency data, and freely available database. The self-acquisition data and the cooperation agency data are usually acquired from the same site with same acquisition parameters. Notably, all the task-based fMRI data involved belonged to the former two data sources. The well-known large freely available database is the ABIDE database. The data of the ABIDE database are collected from different sites in North America and Europe, which inevitably introduces heterogeneity into the dataset in terms of differences among fMRI scanners, data collection protocols, and participant populations (Ghiassian et al., 2016). The aggregation of data across multiple neuroimaging sites has become popular in recent years. Given that the sharing and combination of task-based fMRI data are significantly more challenging than rs-fMRI data (Poldrack and Gorgolewski, 2015), the large freely available database is mainly rs-fMRI data. Despite this, some efforts have been made to build an open repository for task-based fMRI data, such as the Open fMRI database (Poldrack et al., 2013; Poldrack and Gorgolewski, 2015). The advantage of the large database is that it contains more available data than the former two data sources and can satisfy more researchers’ purchase for large database analysis. Working toward the ultimate goal of deriving an automated diagnosis tool from the fMRI data classification, a large database is indispensable for further generalization. Unfortunately, the classification of the large database from different sites appears to be more challenging than that of the small database from the same site. In spite of the above challenge, the freely available database is getting increasing attention in the study of ASD. Notably, 33 of 47 literatures in Table 1 adopted the freely available database, which accounted for 70% of the total.
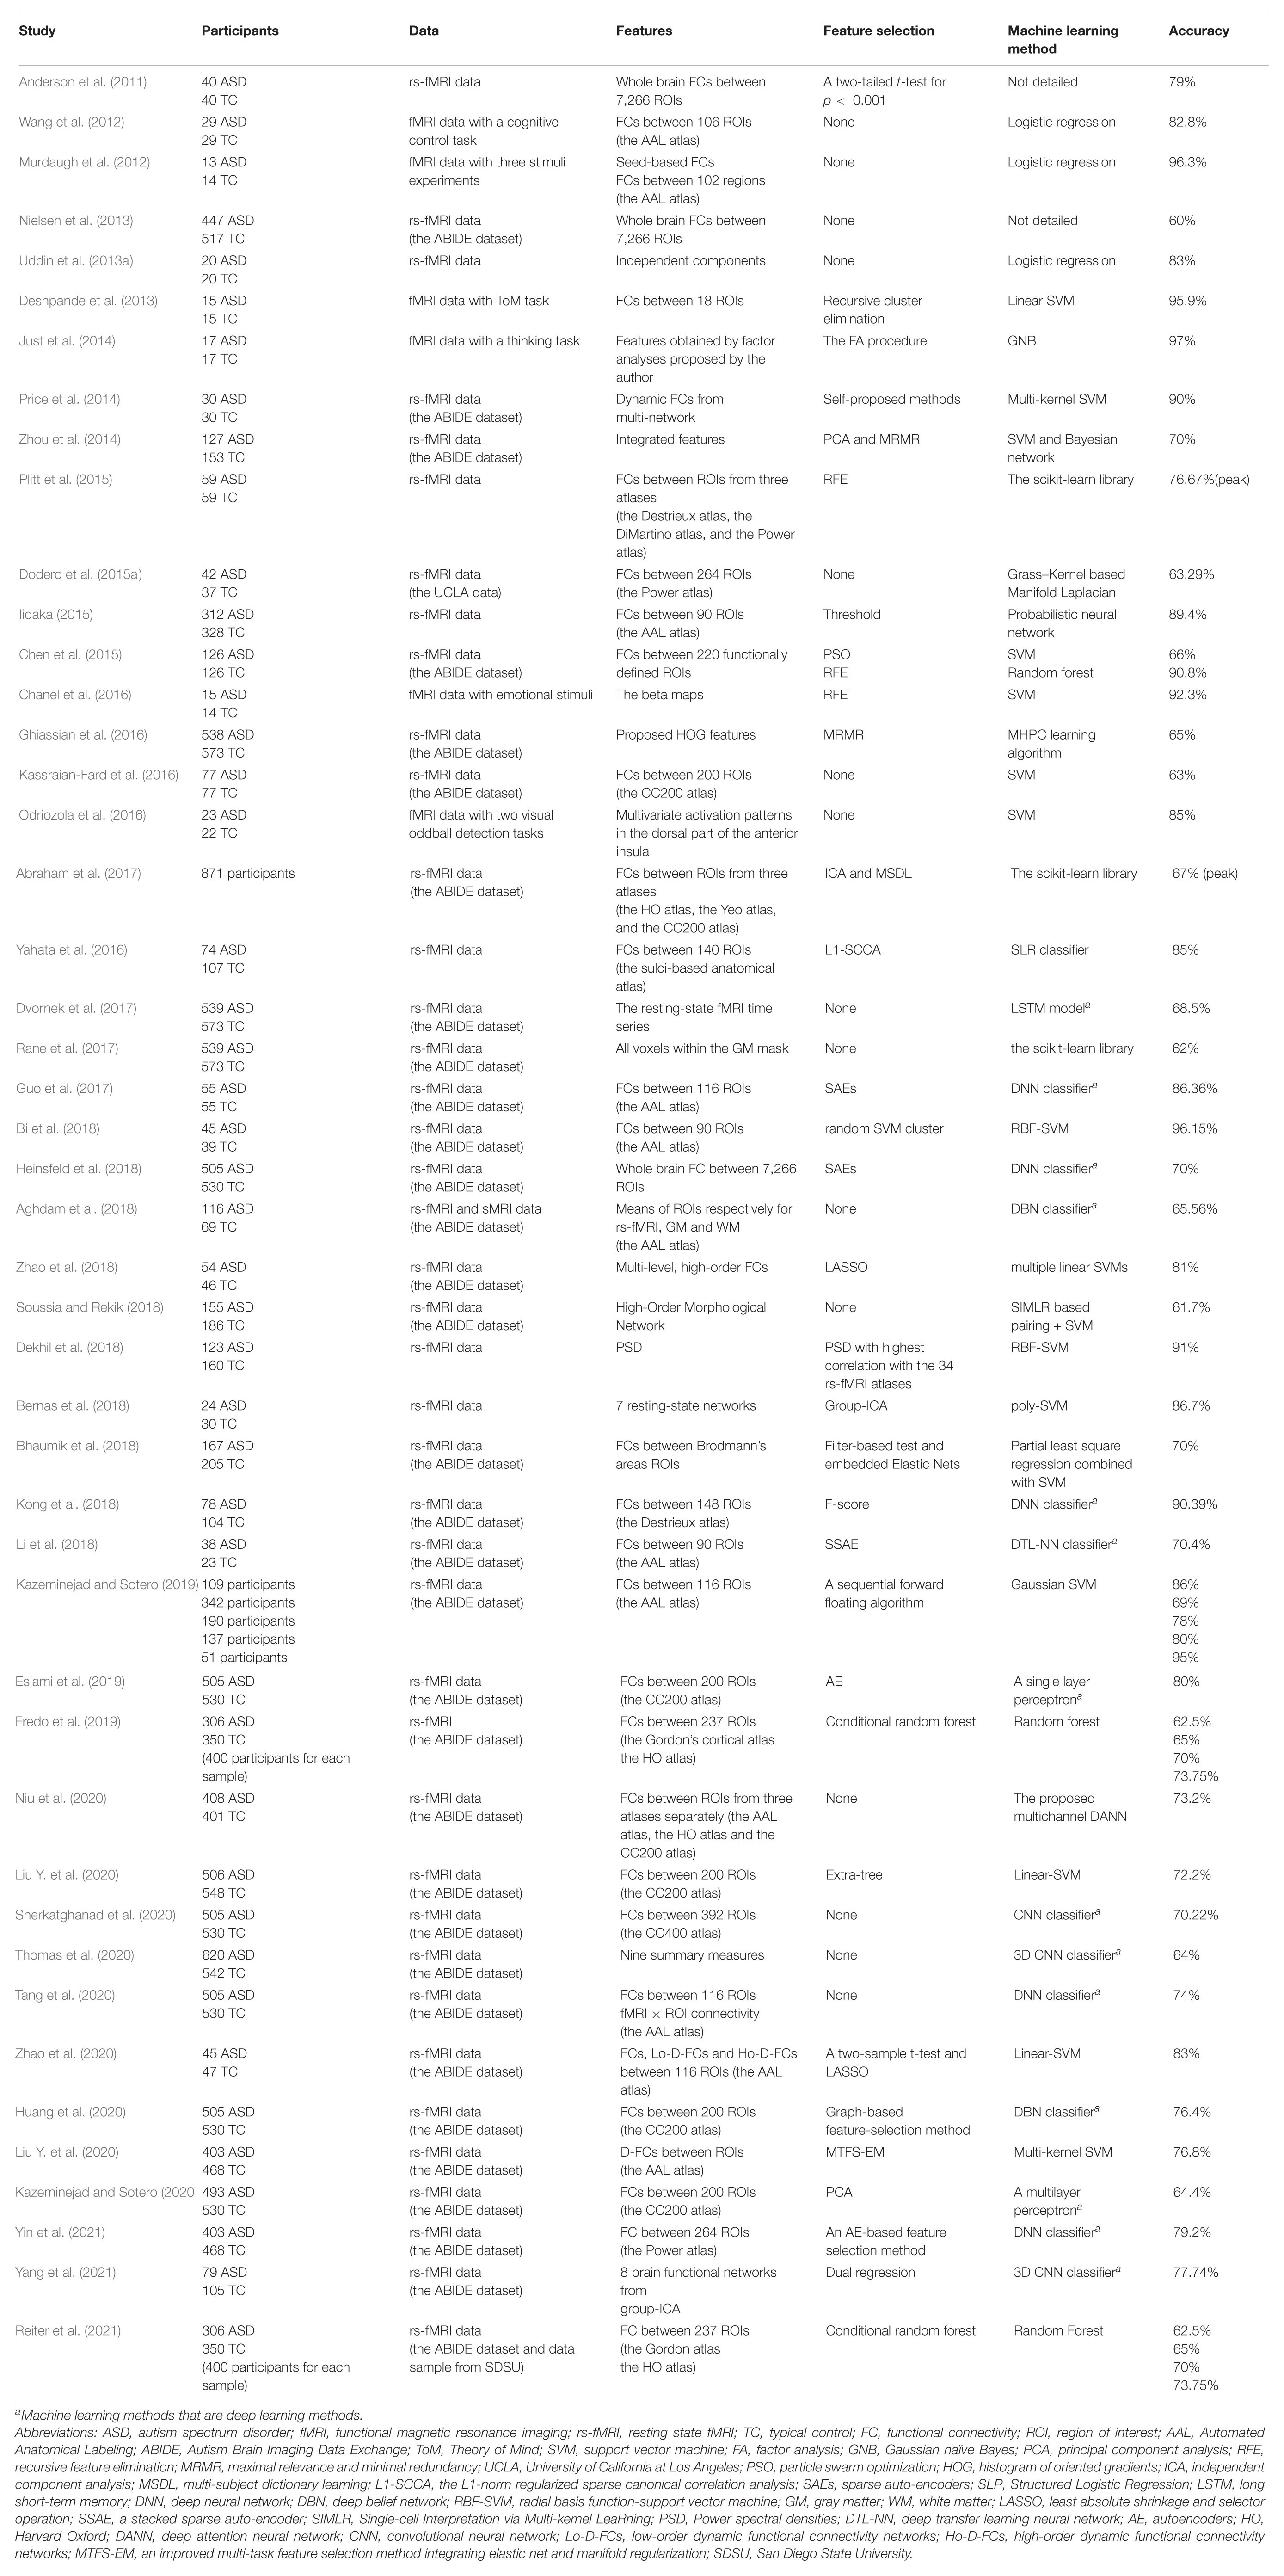
Table 1. Summary of ASD classification studies based on fMRI data.
Feature Construction from Raw fMRI Data
Sundry features constructed from raw fMRI data reflect special meanings of brain information. They are important inputs of machine learning and can influence the performance of classification together with the explanation of contributed brain areas to some extent. Therefore, proper feature construction from raw fMRI data of ASD patients and the TCs becomes a crucial step of classification. FC features are most popularly adopted features given that they can reflect particular significance of ASD. Besides, some other meaningful features are also introduced.
Non-task Static Functional Connectivity Features
Resting-state FC has been proven to be a critical tool in understanding different disease mechanisms and has great potential to provide biomarkers for disease diagnosis (Price et al., 2014). The typically static FCs are constructed by calculating FC between two regions of interest (ROIs) of the brain. It has been reported that altered patterns of brain FCs were suggested as a key neurobiological correlate of the behavioral characteristics of ASD (Neufeld et al., 2017). Increasingly, it has been accepted that ASD is associated with atypical development of multiple interconnected brain systems rather than isolated brain regions (Minshew and Williams, 2007; Uddin et al., 2013a). Furthermore, Hull et al. reviewed the rs-fMRI literatures over how intrinsic connectivity is altered in the autistic brain, with reports of general over-connectivity, under-connectivity, and/or a combination of both (Hull et al., 2017). The whole brain fMRI is usually parcellated into ROIs defined by different atlases, which are either anatomically defined or functionally defined. The commonly used atlas is the anatomical Automated Anatomical Labeling (AAL) atlas (Murdaugh et al., 2012; Wang et al., 2012; Iidaka, 2015; Guo et al., 2017; Aghdam et al., 2018; Bi et al., 2018; Kazeminejad and Sotero, 2019; Liu J. et al., 2020; Tang et al., 2020; Zhao et al., 2020; Reiter et al., 2021). Aside from the AAL, some other atlases were introduced to construct FCs for ASD classification, such as the Power atlas (Power et al., 2014; Chen et al., 2015; Dodero et al., 2015a; Yin et al., 2021), the Craddock 200 (CC200) atlas (Craddock et al., 2012; Kassraian-Fard et al., 2016; Huang et al., 2020; Kazeminejad and Sotero, 2020; Liu J. et al., 2020), the CC400 atlas (Sherkatghanad et al., 2020), the Harvard Oxford (HO) atlas (Desikan et al., 2006; Fredo et al., 2019), the Desikan–Killiany (DK) atlas (Kong et al., 2018; Soussia and Rekik, 2018), and the sulci-based anatomical atlas (Yahata et al., 2016). In particular, the whole brain FCs between 7,266 ROIs were used as classification features (Anderson et al., 2011; Nielsen et al., 2013; Heinsfeld et al., 2018). In addition, FCs derived from specific brain networks were also attractive. For example, Murdaugh et al. adopted FCs between default mode network (DMN) ROIs as classification features (Murdaugh et al., 2012). Different from the above research, Dodero et al. (2015b) obtained FCs by introducing the University of California at Los Angeles (UCLA) Multimodal Connectivity Database, which is an openly available website for brain network analysis and data sharing (Brown et al., 2012).
Task-Based Static Functional Connectivity Features
Though static FC features are the most adopted features for ASD classification, they are usually but not absolutely restricted to rs-fMRI data. The underconnectivity theory is based largely on analysis of task-related changes in interregional connectivity during tasks (Masona et al., 2008) that involve language, working memory, mental imagery, executive functions, cognitive control, and social cognition. Given that differentiation between ASD patients and TCs is absolutely confirmed, targeted tasks can expand their fMRI differences relative to rs-fMRI. Therefore, FCs generated from task-based fMRI data also attracted the researchers (Murdaugh et al., 2012; Wang et al., 2012; Deshpande et al., 2013). The Theory of Mind (ToM) hypothesis, proposed by Baron Cohen, has emerged as a highly regarded explanation of autistic behavior (Baron-Cohen, 1988a, b, c; Baron-Cohen et al., 1994; Baron-Cohen, 2004). According to this prior knowledge, Deshpande et al. (2013) acquired fMRI data during a ToM task and obtained FCs between 18 ROIs.
Dynamic or High-Order Functional Connectivity Features
The aforementioned FCs referred to the conventional static brain FCs, which revealed the intrinsic similarities between a pair of ROIs or specific networks. It was recently accepted that dynamic FCs contained more additional knowledge than static FCs. Dynamic FCs can reveal spatiotemporal network properties not observable in static FCs and may reveal more nuanced transient patterns of atypical FC in ASD (Mash et al., 2019). Even so, there are but not many relative ASD classification studies using dynamic FCs compared to static FCs. Price et al. obtained dynamic FCs based on independent components generated from group-independent component analysis (ICA). In their research, it was demonstrated that using FC features over a wide range of time scales was able to substantially increase ASD classification compared with static FC features (Price et al., 2014), indicating that dynamic FCs are the important supplement of static FC features. A high-order morphological brain network based on Pearson correlation was further proposed by Soussia and Rekik to detect more complex interaction patterns between multiple brain regions (Soussia and Rekik, 2018). Moreover, it was noticed that the identified regions at a high-order level are different from those at a lower order, and this may appear to provide complementary discriminative information for more accurate diagnosis (Soussia and Rekik, 2018). Similarly, multi-level, high-order FC networks were put forward by Zhao et al. to serve as ASD classification features (Zhao et al., 2018), and better classification performance was obtained. Two years later, they fused the features extracted from conventional FCs, low-order dynamic FCs, and high-order dynamic FCs for the ASD classification and achieved the best classification performance than any other type of feature fusion (Zhao et al., 2020). It was indicated that the fusion of different-level FCs can supply complementary relevant information for ASD diagnosis, which was consistent with their previous study.
Other Applied Classification Features
Through analysis of the relative papers, it was obviously found that the commonly adopted classification features are mainly from statics or dynamic functional networks. Besides, some researchers expanded the range of classification features of ASD through different perspectives. Because reduced attention to social stimuli is one of the defining features of ASD, Odriozola et al. (2016) used two visual oddball tasks to investigate brain systems engaged during attention to social (face) and non-social (scene) stimuli. In their work, multivariate activation patterns in the dorsal part of the anterior insula were chosen as classification features. Chanel et al. (2016) acquired fMRI data from two performed experiments and used the beta maps of each condition estimated at the individual step level as features for the classification. The beta map of each individual is high-dimensional containing 186,217 features. Even the rs-fMRI time series and all voxels within the gray matter (GM) mask were directly chosen as classification features (Dvornek et al., 2017; Rane et al., 2017) with the hypothesis that they will carry more useful information than single, static FC measures. In addition, some researchers applied integrated classification features. For example, volumetry analysis, FC MRI analysis, and graph theory via small-world network analysis were introduced to produce the integrated classification features which contained a total of 22 quantitative local and global imaging features (Zhou et al., 2014). Integrated FCs originated from the AAL atlas, the HO atlas, and the Craddock atlas were implemented in the work of Niu et al. (2020). Moreover, for better classification, some researchers applied their proposed methods to obtain classification features, such as histogram of oriented gradients (HOG) features (Ghiassian et al., 2016) and features by factor analysis (Just et al., 2014). As another example of classification feature fusion, Aghdam et al. (2018) computed means of ROIs respectively for rs-fMRI, GM, and white matter (WM) based on the AAL atlas, and the highest classification accuracy was obtained using the fusion of the three features. Based on FCs of the AAL atlas, Tang et al. (2020) introduced fMRI × ROI connectivity for feature supplements.
Machine Learning Methods and Classification Results
Summary About Machine Learning Methods and Classification Accuracy Results
High classification accuracy and confirming the most discriminant features are two main purposes for ASD classification. The most discriminant features resulting from ASD classifications can make a good distinction between the two groups and have the potentiality to serve as disease biomarkers. The higher the classification accuracy, the more creditable the confirmed discriminant features. As a traditional classifier, support vector machine (SVM) has been widely used in the classification of brain disorders including ASD in the last decade. The SVM classifier can be linear and non-linear, which was decided by different kernels, such as linear kernel, polynomial kernel, sigmoid kernel, and Gaussian radial basis function (RBF) kernel. Different kernels were chosen according to different features. Eighteen papers in Table 1 applied SVM classifiers benefiting from their classification power. Bi et al. classified the ASD patients and TCs by 96.15% using SVM with RBF kernel (Bi et al., 2018). Dekhil et al. (2018) obtained 91% classification accuracy using the same classification method. Deshpande et al. (2013), Chen et al. (2015), Chanel et al. (2016), Odriozola et al. (2016), Bernas et al. (2018), and Zhao et al. (2018, 2020) all made use of SVM classifiers to discriminate ASD patients and TCs with higher accuracies, which are 92.3% (peak), 85%, 81%, 90.8%, 95.9%, and 86.7%, respectively. However, the choice of SVM classifiers is not the only determining factor for high accuracies, which will be discussed in the next section. Kassraian-Fard et al. (2016) and Liu J. et al. (2020) also applied the SVM classifier but resulted in a lower accuracy probably due to the large multi-site fMRI dataset.
Besides the SVM classifier, some other traditional classifiers are also used in the discrimination of ASD patients and TCs, such as logistic regression (Murdaugh et al., 2012; Wang et al., 2012; Uddin et al., 2013a), random forest (RF) (Chen et al., 2015; Fredo et al., 2019; Reiter et al., 2021), manifold Laplacian (Dodero et al., 2015a), Gaussian naïve Bayes (GNB) (Just et al., 2014), and so on. In order to contrast the effect of different machine learning methods, the scikit-learn library, which contains multiple machine learning methods, was also applied by some researchers for ASD classification (Plitt et al., 2015; Abraham et al., 2017; Rane et al., 2017). In addition, many researchers tried their best to develop novel classification approaches for better performance. Ghiassian et al. proposed (f)MRI HOG-feature-based patient classification (MHPC) learning algorithm to distinguish ASD individuals and TCs by 65% (Ghiassian et al., 2016). Yahataet al. developed a novel machine learning algorithm called Structured Logistic Regression (SLR) classifier and separated the two groups with the accuracy of 85% (Yahata et al., 2016). In addition, Niu et al. employed a proposed multichannel domain-adversarial neural network (DANN) model and further compared it with the existing machine learning methods such as random RF, SVM models, and multichannel deep neural network (DNN), resulting in the best performance of the self-proposed method with an accuracy of 73.2% (Niu et al., 2020).
Moreover, as an advanced and popular machine learning method, deep learning was widely applied in the classification of ASD especially since 2017. There are several commonly used models of deep learning, such as, autoencoders (AE), long short-term memory (LSTM), recurrent neural network (RNN), DNN, deep belief network (DBN), and convolutional neural network (CNN) (Du et al., 2018). Fourteen of 47 involved papers applied deep learning methods for the classification as detailed in Table 1. Purely from the perspective of classification accuracy, the performance of advanced deep learning methods is comparable with that of traditional ones. In fact, classification accuracy was affected by not only machine learning methods but the dataset, constructed features, and feature selection methods, which will be discussed in detail in section “Factors on Classification Accuracy.” Therefore, the scientific and meaningful comparison on performance of deep learning and traditional machine learning should be carried out under the same condition. Classification accuracies were compared between deep learning and traditional machine learning in Figure 2D using papers with more than 800 participants from the ABIDE dataset. Generally speaking, deep learning outperformed traditional machine learning. In the work of Thomas et al. (2020) CNN was reported to achieve comparable results with SVM as shown in Table 2. Apart from this, eight other papers with deep learning reported their better performance than traditional machine learning methods under the same condition detailed in Table 2 (Heinsfeld et al., 2018; Kong et al., 2018; Li et al., 2018; Huang et al., 2020; Kazeminejad and Sotero, 2020; Sherkatghanad et al., 2020; Thomas et al., 2020; Yang et al., 2021; Yin et al., 2021). It is reasonable to believe that deep learning holds better classification power than the traditional ones.
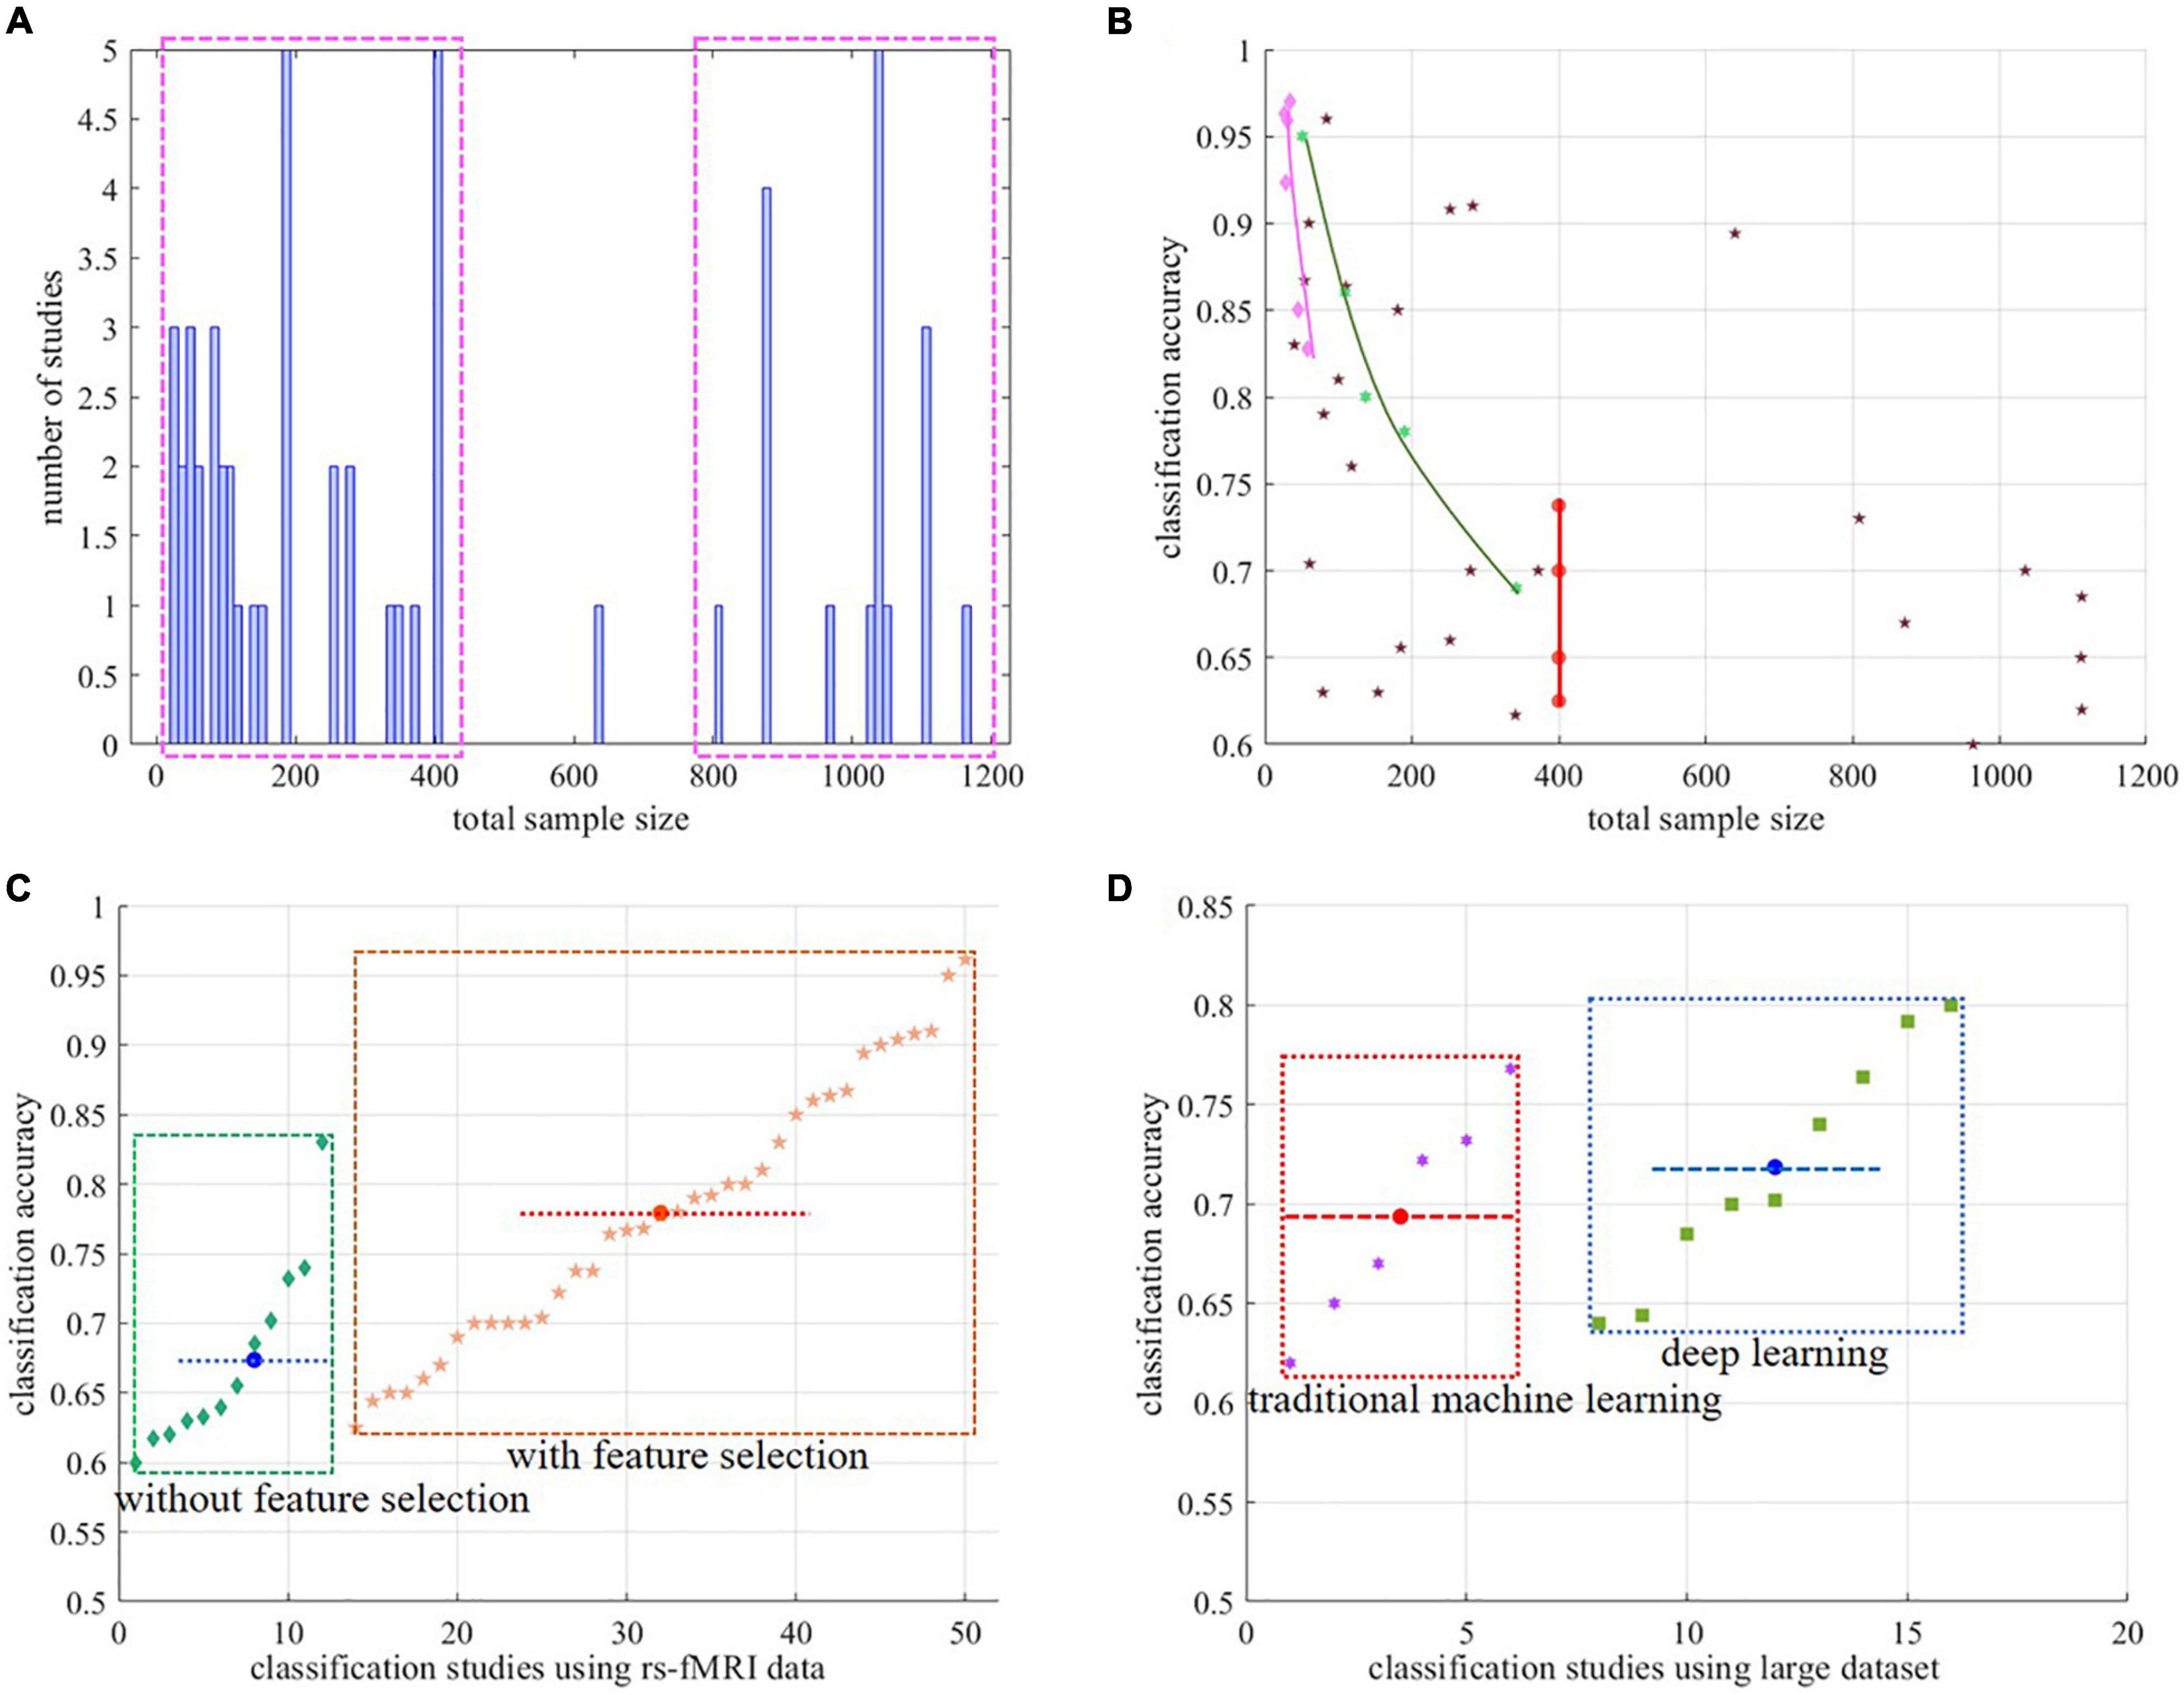
Figure 2. Summary of the involved literatures (A) relationship between number of studies and total sample size. (B) relationship between classification accuracy and total sample size. The pink diamonds and the others represent the task-based fMRI literatures and the rs-fMRI literatures, respectively. The red dots denote the same classification results by Reiter et al. (2021) and Fredo et al. (2019). The green hexagons denote the classification results of Kazeminejad and Sotero (2020). (C) Classification accuracy comparison of studies with feature selection and not, regarding the rs-fMRI dataset. (D) Classification accuracy comparison of studies with deep learning and not, regarding the rs-fMRI dataset with more than 800 participants. fMRI, functional magnetic resonance imaging; rs-fMRI, resting state fMRI.
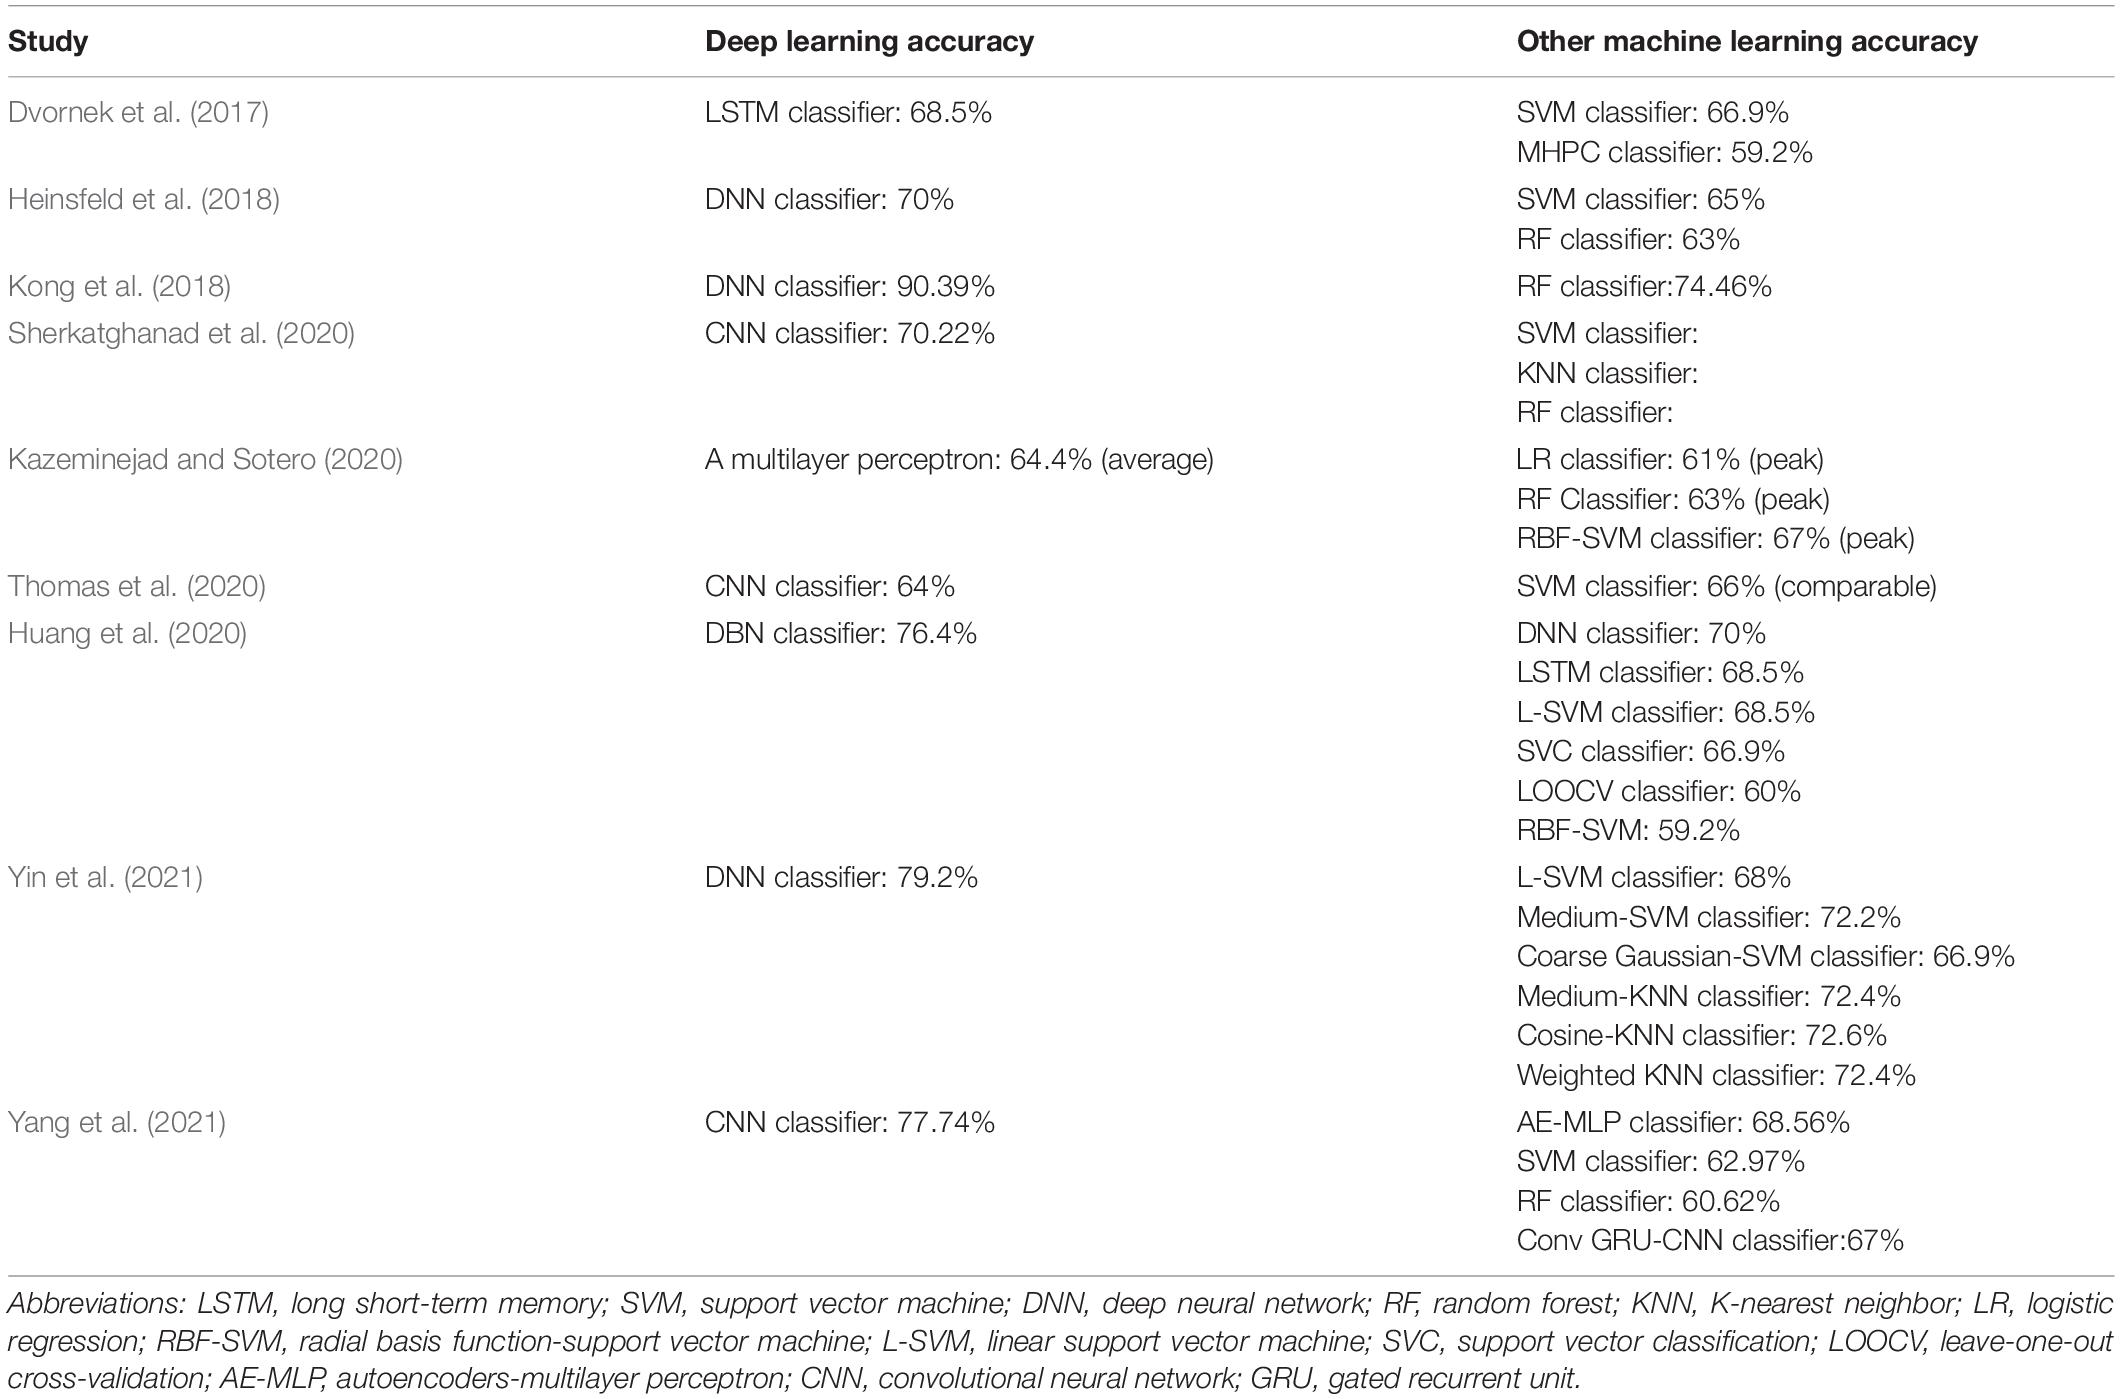
Table 2. Accuracy comparison between deep learning and othermachine learning.
Factors on Classification Accuracy
High accuracy is a critical goal of classification between ASD individuals and TCs aiming to determine biomarkers for ASD. Through analysis of the involved literatures, several factors that substantially impacted classification accuracy were summarized.
Task-Based fMRI Dataset
Many studies have proved the brain difference between ASD individuals and TCs. There is a hypothesis that the degree of alteration in the representation of self in individuals with autism would be related to behavioral measures of various social abilities, such as thinking, face processing, and ToM (Just et al., 2014). Thus, fMRI data with correlated tasks are commonly used for ASD classification studies (Murdaugh et al., 2012; Wang et al., 2012; Deshpande et al., 2013; Just et al., 2014; Chanel et al., 2016; Odriozola et al., 2016). It was found that classifications using task-based fMRI data usually obtained high accuracies as detailed in Table 1 and represented by the pink diamonds in Figure 2B, ranging from 82.8% to 97%. Compared to the rs-fMRI data used in the classification, the task-based fMRI data are an important factor for high classification accuracies. But for task-based fMRI data, it is difficult to acquire large datasets. Most task-based fMRI studies relatively involved small samples of usually less than 50 subjects (Poldrack and Gorgolewski, 2015). Interestingly, we found that the less samples, the higher the classification accuracy as shown in Figure 2B. It is worthy of note that the classification accuracy may decrease with an increase in the number of individuals in the task-based fMRI studies, which necessitates further demonstration.
Contribution of Feature Selection
Besides the factor of the task-based fMRI data, another important factor for high classification accuracy is feature selection. Feature selection methods play an important role in classifications because of the high-dimension property of fMRI data even after relative features have been constructed. Proper feature selection can further reduce the dimensionality of features, enhance classification accuracy, facilitate visualization of the data, and lead to faster classification (Guyon and Elisseeff, 2003; Kassraian-Fard et al., 2016). To realize the importance of feature selection in classification, it gradually became an indispensable part of ASD classification studies. Nevertheless, 16 of the 47 papers in this review did not introduce separate feature selection methods as detailed in Table 1, and high dimensional features were directly applied as the inputs of classifiers (Nielsen et al., 2013; Heinsfeld et al., 2018) resulting in lower classification accuracies. The performance of ASD classification with and without feature selection methods was also compared in some works. Chen et al. (2015) achieved 90.8% classification accuracy using the top 100 features with the highest variable importance compared with 58% accuracy without feature selection. Guo et al. (2017) demonstrated that classification with feature selection outperformed that without feature selection method by 9.09%, and different feature selection methods could bring different classification results. Worth mentioning was that the ASD classification studies using feature selection method in the review can averagely bring better classification accuracies than those without it as statistically illustrated in Figure 2C. In summary, feature selection methods made an indelible contribution to the performance of ASD classification.
The Property of the Dataset
Another non-ignored factor of the high classification accuracy is the property of the dataset applied for classification such as sample size and data heterogeneity. The total sample size of the involved literatures mostly concentrated less than 400 or more than 800 as shown in Figure 2A. The relationship between classification accuracy and sample size was illustrated in Figure 2B, in which the pink diamonds and others represent the results of the literatures involving tasks or not, respectively. Classification across multiple sites has to accommodate additional sources of variance in subjects, scanning procedures, and equipment in comparison to single-site datasets (Nielsen et al., 2013) and usually results in low classification accuracies detailed in Table 1. However, it is worth noting that several works in Table 1 applying the fMRI data from the ABIDE dataset brought high accuracies from 81% to 96.15% (Price et al., 2014; Chen et al., 2015; Bi et al., 2018; Kong et al., 2018; Zhao et al., 2018, 2020; Kazeminejad and Sotero, 2019). Through analysis, the commonality of datasets applied in these papers is that they are all subsets of the large dataset according to some special selection criteria, such as site limitation, single protocol, or age-related selection, which can alleviate data heterogeneity to some extent and improve the classification accuracy. Eslami et al. (2019) evaluated their proposed machine learning method on all data and each site data of the ABIDE dataset respectively, resulting in 70.1% for all data and 80% peak accuracy for the Oregon Health & Science University (OHSU) site. Likewise, several works that focused on childhood and adolescent fMRI data also attained high accuracies from 83% to 91% (Uddin et al., 2013a; Price et al., 2014; Iidaka, 2015; Bernas et al., 2018; Dekhil et al., 2018) following the principal of the above age-related selection. In the work of Kazeminejad et al., the dataset including 817 participants was split into five age ranges, and the best classification accuracies for each range were obtained ranging from 69% to 95% (Kazeminejad and Sotero, 2019). In accordance with the task-based fMRI studies, an approximately linear relationship between classification accuracies and sample size was discovered in their work as illustrated in Figure 2B. In addition, the same sample size could result in different classification accuracies due to different heterogeneity of the dataset, which was illustrated by the red dots in Figure 2B (Fredo et al., 2019; Reiter et al., 2021). All in all, the property of the applied dataset can definitely influence the classification result to some extent.
The Choice of Atlas
As discussed in section “FEATURE CONSTRUCTION FROM RAW FMRI DATA,” atlases of anatomical, functional parcellation, and data-driven extraction were applied for FC feature construction in ASD classification. It was believed that the choice of atlas could influence classification accuracy to some extent (Plitt et al., 2015; Abraham et al., 2017; Dadi et al., 2019; Liu Y. et al., 2020; Yin et al., 2021). Plitt et al. addressed the impact of three different brain atlases on classifications (Power et al., 2011; Plitt et al., 2015), which are the DiMartino atlas, the Destrieux atlas, and the Power atlas. The Destrieux atlas slightly outperformed the other two as illustrated in Figure 3, indicating that different anatomical atlases influenced the classification accuracy indeed. Meanwhile, Abraham et al. considered three different predefined atlases and four data-driven atlases and compared their classification performance (Abraham et al., 2017). The three predefined atlases are the anatomical HO atlas (Desikan et al., 2006), the functional Yeo atlas (Yeo et al., 2011), and the functional Craddock atlas (Lashkari et al., 2009), while the four data-driven atlases were derived based on K-means, Ward’s clustering, ICA, and multi-subject dictionary learning (MSDL). Data-driven atlases were reported to perform more poorly than the predefined atlases except the MSDL-based atlas, and the functional HO atlas led to maximal performance. In the work of Dadi et al., functional atlases were reported to lead to better prediction than anatomical atlases, and the MSDL-based atlas was found to perform comparably (Dadi et al., 2019). The MSDL-based atlas exhibited robust performance out of all the anatomical and data-driven atlas approaches (Yin et al., 2021). In a summary, the choice of atlas played an important role on the prediction accuracy. Apart from this, the great meaningful contribution of the choice of atlas was the explanation of discriminant features or biomarkers derived from classification.
Figure 3. Classification accuracy comparison based on different choice of atlas in the work of Plitt et al. (2015). RF, random forests; KNN, K-nearest neighbor; L-SVM, linear support vector machine; RBF-SVM, Gaussian kernel support vector machine; GNB, Gaussian naïve Bayes; LDA, linear discriminant analysis; L1LR, L1 logistic regression; L2LR, L2 logistic regression; ENLR, elastic-net logistic regression; Average, average of the above nine methods.
Development of Machine Learning Method
As the core of classification, machine learning methods are undoubtedly a crucial factor on classification accuracies. Different machine learning methods and their variants were introduced to fMRI data classification study for better classification results, determination of discriminant features, ASD biomarkers exploration, or just method innovation. Among traditional shallow machine learning methods, SVM was recognized as a powerful one than others. With the appearance and rapid development of deep learning, it was widely applied in ASD classification. Apart from its lack of interpretability restrictions and being time consuming, deep learning has shown great potential power in classification compared with traditional machine learning methods as discussed in section “Summary About Machine Learning Methods and Classification Accuracy Results.” Further and deeper study on deep learning can continue to promote the development of ASD classification. The most promising focus on the application of machine learning to the neuroimaging field may be to create specific methods for the special properties of fMRI.
Significant Results Summarized from Involved Literatures
It is well known that one major goal of the classifications between ASD and TC is to obtain high accuracies, while another is to determine the informative brain regions or networks contributing to the classifications with the ultimate goal of yielding a possible biomarker of ASD. The higher the accuracy, the more trustworthy the identified brain regions or networks. Not only the informative brain areas or networks were determined, but the physiology and behavior explanation about them were exhibited in most of the papers.
Consistent Results From FC Classification Using the AAL Atlas
Given that FCs were chosen by many researchers as classification features, we summarized informative brain regions and networks determined by classifications between ASD individuals and TCs using FCs as features in Table 3. The brain regions and networks are more comparable in different literatures which applied the same brain atlas regardless of different pattern classification methods. As an anatomically defined atlas, the AAL atlas was frequently adopted in ASD classifications (Murdaugh et al., 2012; Wang et al., 2012; Iidaka, 2015; Guo et al., 2017; Bi et al., 2018; Liu J. et al., 2020; Tang et al., 2020; Zhao et al., 2020). The informative brain regions and networks were determined separately from FC classifications as shown in Table 3 except the work of Guo et al. (2017) and Tang et al. (2020). The common brain regions determined by classifications of the several above literatures included the right posterior cingulate cortex (PCC), the left PCC, and the right thalamus. The conclusion derived from the work of Wang et al. (2012, 2017, 2020) is that weak functional connections between the frontal lobe and the rest of the cortex occurred in ASD patients compared with the TCs. Dodero et al. (2015a) obtained eight informative connections through FCs classification detailed in Table 3, in which red connections identify higher connectivity in healthy subjects while blue connections identify a higher connectivity strength in autistic subjects. Guo et al. (2017) found 32 most significant FCs between the two groups mainly from or across different pre-defined brain networks including the default mode, cingulo-opercular, frontal-parietal, and cerebellum. The detailed significant brain areas about the above papers are shown in Table 3.
Table 3. Summary of informative brain regions or networks determined by classification between ASD and TD usingFCs as features.
Consistent Results About the Default Mode Network
The DMN comprised several dispersed cortical nodes including the anterior cingulate/medial prefrontal cortices and the PCC (Raichle et al., 2001; Greicius et al., 2003; Buckner et al., 2008; Washington et al., 2014). Functionally, the DMN is considered to relate to self-referential cognition including domains of known impairment in ASD (Chen et al., 2015), which have been reported in some previous non-classification research (Monk et al., 2009; Assaf et al., 2010; Minshew and Keller, 2010; Zielinski et al., 2012; Martino et al., 2013; Redcay et al., 2013). Notably, some common regions determined by the aforementioned literatures using the AAL atlas belong to the DMN. Early in 2011, Anderson et al. have reported the phenotypic pattern of impaired communication within and between the DMN and attention control networks in ASD through classification between the two groups (Anderson et al., 2011). Soon afterward, a series of ASD classification studies were carried out and resulted in consistent conclusions about the DMN. As depicted in Table 3, impaired FCs related to the DMN were obtained in several literatures (Nielsen et al., 2013; Chen et al., 2015; Yahata et al., 2016; Abraham et al., 2017; Heinsfeld et al., 2018; Fredo et al., 2019; Reiter et al., 2021). Besides, Murdaugh et al. (2012) demonstrated that deactivation and connectivity of the DMN were altered in individuals with ASD at a high classification accuracy of 96.3%. The impaired DMN was also reported in the research by Plitt et al. together with the frontal-parietal control network (Plitt et al., 2015). In addition, seven distinctive fronto-parietal and temporal networks between ASD patients and TCs were reported in the work of Bernas et al. (2018) one of which was DMN. Lower correlation was proved between the anterior and posterior DMN in autistic individuals (Liu Y. et al., 2020). Both dorsal DMN (dDMN) and precuneus (PCUN) achieved better accuracies than other brain networks in the work of Yang et al. (2021), which are the subnetworks of the DMN. Taken together, the DMN is undoubtedly a crucial component of the underlying neurobiology and has the potentiality to serve as a biomarker of ASD.
Partial Hemispheric Distribution of Discriminant FCs or Brain Regions
It has been reported that the distributed patterns of functional abnormalities are over the whole brain of ASD patients (Zhao et al., 2018). Actually, in the work of Nielsen et al. (2013), a homogenous regional distribution of connectivity abnormalities in autism was argued against and replaced by a heterogeneous spatial distribution of connectivity disturbances that involves specific brain regions. The conclusion of partial hemispheric distribution of informative brain regions and networks in autism were identically obtained in several other involved literatures. There were significantly more regions in the right hemisphere than in the left among the brain regions involved in the 16 FCs identified in the study of Yahata et al. (2016) with the left intra-hemispheric FCs absent. Likewise, significant discriminative connections between the two groups were mostly located in the right hemisphere, and there were more involved brain areas in the right hemisphere than in the left, which was detailed in the work of Dodero et al. (2015a). Odriozola et al. (2016) also found that children with ASD displayed greater activation of the right insula when viewing deviant faces vs. scenes in contrast to their TCs (Odriozola et al., 2016). In addition, the best performance was achieved in distinguishing between ASD/TC subjects for the right hemisphere by Soussia and Rekik indicating that the right hemisphere features may have more discriminative power (Soussia and Rekik, 2018). Though not all relative papers involved the conclusion about partial hemispheric distribution, it undoubtedly supplied a novel understanding and a new prospective for ASD.
Identification of the Potential ASD Biomarker
As a prime conception in the field of psychiatric neuroimaging research, biomarkers have successfully attracted enough attraction of researchers especially with the emergence and development of machine learning. More than 10 years ago, machine learning methods were thought to be a promising method to reveal brain states that discriminate patients from controls and thus constitute a valuable tool to identify potential biomarkers (Mourão-Miranda et al., 2005; Pereira et al., 2009). Notably, 38 of 47 papers in the review mentioned “biomarker” to some extent, which appropriately proved the collaborative efforts from various research teams to explain or identify the objective biomarker of ASD using machine learning methods and fMRI data. Plitt et al. (2015) indicated that FC classification of autism identifies highly predictive brain features but falls short of biomarker standards for several reasons, such as establishing standard analytic techniques, demonstrating biomarkers robustness to variability across larger numbers of individuals and sites, and addressing the diagnostic potential of brain-based biomarkers. It was thought that the predicted autistic neural patterns determined by classification are anticipated to serve as reproducible biomarkers and important in early diagnosis and treatment (Kong et al., 2018; Huang et al., 2020). Resting-state FC measures were proved to be potential diagnostic biomarkers for ASD in several studies (Deshpande et al., 2013; Price et al., 2014; Plitt et al., 2015; Bhaumik et al., 2018; Kong et al., 2018; Soussia and Rekik, 2018; Fredo et al., 2019). The study of Iidaka (2015) indicated that an intrinsic connectivity matrix constructed from rs-fMRI data could yield a possible biomarker of ASD restricted to children and adolescents. It was proposed that the high-order FC could be affected in ASD compared with the traditional FC and thus can be used as effective biomarkers for ASD diagnosis in the work of Zhao et al. (2018). In the study of Bernas et al. a change in the coherence of temporal neurodynamics is identified to be a biomarker of ASD (Bernas et al., 2018). Thomas et al. (2020) reported that hidden somewhere in the high-dimensional spatio-temporal signal are the biomarkers that could distinguish between healthy and psychiatric subjects. A strong negative correlation between the left precuneous cortex and the left superior frontal gyrus was anticipated to serve as reproducible biomarkers (Huang et al., 2020). In the work of Yang et al. (2021), the dDMN, PCUN, and salience network (SN) are suggested to be highly different between ASD and normal control (NC) and have the potential to be reliable biomarkers for the identification of ASD. Though most works of relative papers failed to identify definite and replicated biomarkers of ASD, efforts from different research teams have put the identification of the ASD biomarker forward, and it was believed that an ideal biomarker would be derived through the continuous work.
Some Other Specific Meaningful Results
In the work of Heinsfeld et al. (2018), the most contributing conclusion is the anterior-posterior disruption in the connectivity of ASD, which has been reported to be shown in previous task-related (Adam et al., 2004; Kana et al., 2009) and rs-fMRI studies of ASD patients (Cherkassky et al., 2006). Similarly, the right supramarginal gyrus, the fusiform gyrus, and the cerebellar vermis were found to play a significant role in the diagnosis of autism (Sherkatghanad et al., 2020), which was another evidence about the disruption of anterior-posterior brain connectivity in ASD. Lower correlation between the anterior and posterior DMN was demonstrated in autistic individuals than controls (Liu Y. et al., 2020). Brain regions related to social communication, emotion expression, language comprehension, and action coordination were determined, such as inferior frontal gyrus, amygdala, angular gyrus, and hippocampus (Zhao et al., 2018). In the work of Uddin et al. the SN was identified to play a critical role in discriminating children with ASD from TC and could be a hallmark of ASD (Uddin et al., 2013b) with the explanation that regions within the SN are implicated in multiple functions, ranging from attention to interception and subjective awareness (Craig, 2011). Changes in caudate volume, caudate-cortical FC, and inferior frontal gyrus FC were reported to be highly informative in the classification of the two groups (Zhou et al., 2014). Moreover, the social brain has been accepted to be impaired in individuals with ASD, which was further confirmed from the perspective of fMRI classification through four literatures (Deshpande et al., 2013; Just et al., 2014; Chanel et al., 2016; Bernas et al., 2018). Though most involved literatures identified contributing brain regions or networks, some still gave more prominence to the methods and results of classifications and ignored the determination of informative brain regions and networks (Kassraian-Fard et al., 2016; Dvornek et al., 2017; Ktena et al., 2017; Kong et al., 2018; Kazeminejad and Sotero, 2019; Liu J. et al., 2020; Niu et al., 2020; Yin et al., 2021).
Future Work Direction
In this paper, we summarized 47 literatures involved in fMRI data classification between ASD individuals and TCs. Most researchers expected to derive the biomarkers of ASD through classification studies and have made some progress in deed, but the overall assessment of classification of ASD using fMRI data thus far falls short of biomarker standards. Despite this, several work directions may need to be paid more attention by researchers: (1) Considering the factors for high classification accuracies, development of novel feature selection methods should be an important work direction for classifications between ASD individuals and TCs, which could facilitate machine learning methods to determine the most discriminant features. (2) Another pivotal work direction is to obtain advanced machine learning methods by improving the existing methods and combining the superiority of different methods, especially trying to develop specific machine learning methods for the special properties of fMRI. (3) Non-invasive rs-fMRI data classification studies between ASD individuals and TCs will still be the prominent work direction especially since the release of the ABIDE dataset. More robust and replicated biomarkers are more likely derived from big datasets. (4) Age is an important factor in the ASD diagnosis. Age-specific research can significantly reduce the heterogeneity of ASD dataset and increase the classification rate. Therefore, the age-specific research of ASD will be a valuable research direction. (5) Because of the higher classification accuracies for task-based fMRI data, it may be a new work direction to design some easily operated and efficient tasks to acquire fMRI data to form large datasets for further research. In the future, developed feature selection and machine learning methods combined with large rs-fMRI datasets or easily operated task-based fMRI dataset may appear to serve as a promising diagnostic tool for ASD.
Author Contributions
All authors listed have made a substantial, direct and intellectual contribution to the work, and approved it for publication.
Conflict of Interest
The authors declare that the research was conducted in the absence of any commercial or financial relationships that could be construed as a potential conflict of interest.
Publisher’s Note
All claims expressed in this article are solely those of the authors and do not necessarily represent those of their affiliated organizations, or those of the publisher, the editors and the reviewers. Any product that may be evaluated in this article, or claim that may be made by its manufacturer, is not guaranteed or endorsed by the publisher.
Funding
We acknowledge funding from the National Natural Science Foundation of China (62036013, 61976248, 81301199, and 81901698), the National Key R&D Program of China (2016YFC1307100 and 2017YFC0107400), and Key Science and Technology Program of Shaanxi Province (2017ZDXM-SF-047).
Acknowledgments
We thank the reviewers for their valuable suggestions.
Footnotes
References
Abraham, A., Milhame, M., Martino, A. D., Craddock, R. C., Samaras, D., Thirion, B., et al. (2017). Deriving robust biomarkers from multi-site resting-state data: an autism-based example. Neuroimage 147, 736–745. doi: 10.1016/j.neuroimage.2016.10.045
Adam, J. M., Cherkassky, V. L., Keller, T. A., and Minshew, N. J. (2004). Cortical activation and synchronization during sentence comprehension in high-functioning autism: evidence of underconnectivity. Brain 127, 1811–1821. doi: 10.1093/brain/awh199
Aghdam, M. A., Sharifi, A., and Pedram, M. M. (2018). Combination of rs-fMRI and sMRI data to discriminate autism spectrum disorders in young children using deep belief network. J. Digit. Imaging 31, 895–903. doi: 10.1007/s10278-018-0093-8
Alessandro, G., Roma, S., and Remo, J. (2017). Editorial: advanced neuroimaging methods for studying autism disorder. Front. Neurosci. 11:533. doi: 10.3389/fnins.2017.00533
Anderson, J. S., Nielsen, J. A., Froehlich, A. L., DuBray, M. B., Druzgal, T. J., Cariello, A. N., et al. (2011). Functional connectivity magnetic resonance imaging classification of autism. Brain: J. Neurol. 134, 3739–3751. doi: 10.1093/brain/awr263
Arbabshirani, M. R., Kiehl, K. A., Pearlson, G., and Calhoun, V. D. (2013). Classification of schizophrenia patients based on resting-state functional network connectivity. Front. Neurosci. 7:133. doi: 10.3389/fnins.2013.00133
Assaf, M., Jagannathan, K., Calhoun, V. D., Miller, L., Stevens, M. C., Sahl, R., et al. (2010). Abnormal functional connectivity of default mode sub-networks in autism spectrum disorder patients. Neuroimage 53, 247–256. doi: 10.1016/j.neuroimage.2010.05.067
Baron-Cohen, S. (1988a). An assessment of violence in a young man with Asperger’s syndrome. J. Child Psychol. Psychiatry 29, 351–360. doi: 10.1111/j.1469-7610.1988.tb00723.x
Baron-Cohen, S. (1988b). Social and pragmatic deficits in autism: cognitive or affective? J. Autism Dev. Disord. 18, 379–402. doi: 10.1007/bf02212194
Baron-Cohen, S. (1988c). Without a theory of mind one cannot participate in a conversation. Cognition 29, 83–84. doi: 10.1016/0010-0277(88)90011-X
Baron-Cohen, S. (2004). The cognitive neuroscience of autism. J. Neurol. Neurosurg. Psychiatry 75, 945–948. doi: 10.1136/jnnp.2003.018713
Baron-Cohen, S., Ring, H., Moriarty, J., Schmitz, B., Costa, D., and Ell, P. (1994). Recognition of mental state terms. clinical findings in children with autism and a functional neuroimaging study of normal adults. Br. J. Psychiatry 165, 640–649. doi: 10.1192/bjp.165.5.640
Bernas, A., Aldenkamp, A. P., and Zinger, S. (2018). Wavelet coherence-based classifier: a resting-state functional MRI study on neurodynamics in adolescents with high-functioning autism. Comput. Methods Programs Biomed. 154, 143–151. doi: 10.1016/j.cmpb.2017.11.017
Bhaumik, R., Pradhan, A., Das, S., and Bhaumik, D. K. (2018). Predicting autism spectrum disorder using domain-adaptive cross-site evaluation. Neuroinformatics 16, 197–205. doi: 10.1007/s12021-018-9366-0
Bi, X.-A., Wang, Y., Shu, Q., Sun, Q., and Xu, Q. (2018). Classification of autism spectrum disorder using random suppor vector machine cluster. Front. Genet. 9:18. doi: 10.3389/fgene.2018.00018
Brown, J. A., Rudie, J. D., Bandrowski, A., Horn, J. D. V., and Bookheimer, S. Y. (2012). The UCLA multimodal connectivity database: a web-based platform for brain connectivity matrix sharing and analysis. Front. Neuroinform. 6:28. doi: 10.3389/fninf.2012.00028
Buckner, R. L., Andrews-Hanna, J. R., and Schacter, D. L. (2008). The brain’s default network anatomy, function, and relevance to disease. N. Y. Acad. Sci. 1124, 1–38. doi: 10.1196/annals.1440.011
Chanel, G., Pichon, S., Conty, L., Berthoz, S., Chevallier, C., and Grèzes, J. (2016). Classification of autistic individuals and controls using cross-task characterization of fMRI activity. Neuroimage Clin. 10, 78–88. doi: 10.1016/j.nicl.2015.11.010
Chen, C. P., Keown, C. L., Jahedi, A., Nair, A., Pflieger, M. E., Bailey, B. A., et al. (2015). Diagnostic classification of intrinsic functional connectivity highlights somatosensory, default mode, and visual regions in autism. Neuroimage Clin. 8, 238–245. doi: 10.1016/j.nicl.2015.04.002
Cherkassky, V. L., Kana, R. K., Keller, T. A., and Just, M. A. (2006). Functional connectivity in a baseline resting-state network in autism. Neuroreport 17, 1687–1690. doi: 10.1097/01.wnr.0000239956.45448.4c
Cole, D. M., Smith, S. M., and Beckmann, C. F. (2010). Advances and pitfalls in the analysis and interpretation of resting-state FMRI data. Front. Syst. Neurosci. 4:8. doi: 10.3389/fnsys.2010.00008
Craddock, R. C., James, G. A., Holtzheimer, P. E. III, Hu, X. P., and Mayberg, H. S. (2012). A whole brain fMRI atlas generated via spatially constrained spectral clustering. Hum. Brain Mapp. 33, 1914–1928. doi: 10.1002/hbm.21333
Craig, A. D. B. (2011). Significance of the insula for the evolution of human awareness of feelings from the body. Ann. N. Y. Acad. Sci. 1225, 72–82. doi: 10.1111/j.1749-6632.2011.05990.x
Cuingnet, R., Gérardin, E., Tessieras, J., Auzias, G., Lehéricy, S., Habert, M.-O., et al. (2011). Automatic classification of patients with Alzheimer’s disease from structural MRI: a comparison of ten methods using the ADNI database. Neuroimage 56, 766–781. doi: 10.1016/j.neuroimage.2010.06.013
Dadi, K., Rahim, M., Abraham, A., Chyzhyk, D., Milham, M., Thirion, B., et al. (2019). Benchmarking functional connectome-based predictive models for resting-state fMRI. Neuroimage 192, 115–134. doi: 10.1016/j.neuroimage.2019.02.062
Davatzikos, C., Fan, Y., Wu, X., Shen, D., and Resnick, S. M. (2006). Detection of prodromal Alzheimer’s disease via pattern classification of magnetic resonance imaging. Neurobiol. Aging 29, 514–523. doi: 10.1016/j.neurobiolaging.2006.11.010
Dekhil, O., Hajjdiab, H., Shalaby, A., Ali, M. T., Ayinde, B., Switala, A., et al. (2018). Using resting state functional MRI to build a personalized autism diagnosis system. PLoS One 13:e0206351. doi: 10.1371/journal.pone.020635
Deshpande, G., Libero, L. E., Sreenivasan, K. R., Deshpande, H. D., and Kana, R. K. (2013). Identification of neural connectivity signatures of autism using machine learning. Front. Hum. Neurosci. 7:670. doi: 10.3389/fnhum.2013.00670
Desikan, R. S., Seǵonne, F., Fischl, B., Quinn, B. T., Dickerson, B. C., Blacker, D., et al. (2006). An automated labeling system for subdividing the human cerebral cortex on MRI scans into gyral based regions of interest. Neuroimage 31, 968–980. doi: 10.1016/j.neuroimage.2006.01.021
Dodero, L., Sambataro, F., Murino, V., and Sona, D. (2015a). “Medical image computing and computer-assisted intervention–MICCAI 2015,” in Proceedings of the 18th International Conference, Munich.
Dodero, L., Sambataro, F., Murino, V., and Sona, D. (2015b). Kernel-Based Analysis of Functional Brain Connectivity on Grassmann Manifold. Lect. Notes Comput. Sci. 9351, 604–611. doi: 10.1007/978-3-319-24574-4_72.
Du, W., Calhoun, V. D., Li, H., Ma, S., Eichele, T., Kiehl, K., et al. (2012). High classification accuracy for schizophrenia with rest and task fMRI data. Front. Hum. Neurosci. 6:145. doi: 10.3389/fnhum.2012.00145
Du, Y., Fu, Z., and Calhoun, V. D. (2018). Classification and prediction of brain disorders using functional connectivity: promising but challenging. Front. Neurosci. 12:525. doi: 10.3389/fnins.2018.00525
Dvornek, N. C., Ventola, P., Pelphrey, K. A., and Duncan, J. S. (2017). Identifying autism from resting-state fmri using long short term memory networks. Mach. Learn. Med. Imaging. 10541, 362–370. doi: 10.1007/978-3-319-67389-9_42
Eslami, T., Mirjalili, V., Fong, A., Laird, A. R., and Saeed, F. (2019). ASD-DiagNet: a hybrid learning approach for detection of autism spectrum disorder using fMRI data. Front. Neuroinform. 13:70. doi: 10.3389/fninf.2019.00070
Fan, Y., Gur, R. E., Gur, R. C., Wu, X., Shen, D., Calkins, M. E., et al. (2008). Unaffected family members and schizophrenia patients share brain structure patterns: a high-dimensional pattern classification study. Biol. Psychiatry 63, 118–124. doi: 10.1016/j.biopsych.2007.03.015
Fredo, A. R. J., Jahedi, A., Reiter, M. A., and Muller, R.-A. (2019). Classification of severe autism in fMRI using functional connectivity and conditional random forests. Neural Comput. App. 32:8415. doi: 10.1007/s00521-019-04346-y
Ghiassian, S., Greiner, R., Jin, P., and Brown, M. R. G. (2016). Using functional or structural magnetic resonance images and personal characteristic data to identify ADHD and autism. PLoS One 11:e0166934. doi: 10.1371/journal.pone.0166934
Greicius, M. D., Krasnow, B., Reiss, A. L., and Menon, V. (2003). Functional connectivity in the resting brain: a network analysis of the default mode hypothesis. Proc. Natl. Acad. Sci. U.S.A. 100, 253–258. doi: 10.1073/pnas.0135058100
Guo, X., Lu, L. J., Dominick, K. C., Minai, A. A., Li, H., Erickson, C. A., et al. (2017). Diagnosing autism spectrum disorder from brain resting-state functional connectivity patterns using a deep neural network with a novel feature selection method. Front. Neurosci. 11:460. doi: 10.3389/fnins.2017.00460
Guyon, I., and Elisseeff, A. (2003). An introduction to variable and feature selection. J. Mach. Learn. Res. 3, 1157–1182. doi: 10.1162/153244303322753616
Heinsfeld, A. S., Franco, A. R., Craddock, R. C., Buchweitz, A., and Meneguzzi, F. (2018). Identification of autism spectrum disorder using deep learning and the ABIDE dataset. Neuroimage Clin. 17, 16–23. doi: 10.1016/j.nicl.2017.08.017
Huang, Z.-A., Zhu, Z., Member, S., Yau, C. H., and Tan, K. C. (2020). Identifying autism spectrum disorder from resting-state fMRI using deep belief network. IEEE Trans. Neural Netw. Learn. Syst. 32, 2847–2861. doi: 10.1109/tnnls.2020.3007943
Hull, J. V., Dokovna, L. B., Jacokes, Z. J., and Torgerson, C. M., Irimia, A., and Van Horn, J. D. (2017). Resting-state functional connectivity in autism spectrum disorders: a review. Front. Psychiatry 7:205. doi: 10.3389/fpsyt.2016.00205
Hyde, K. K., Novack, M. N., LaHaye, N., Parlett-Pelleriti, C., Anden, R., Dixon, D. R., et al. (2019). Applications of supervised machine learning in autism spectrum disorder research: a review. Rev. J. Autism Dev. Disord. 6, 128–146. doi: 10.1007/s40489-019-00158-x
Iidaka, T. (2015). Resting state functional magnetic resonance imaging and neural network classified autism and control. Sciencedirect Cortex 63, 55–67. doi: 10.1016/j.cortex.2014.08.011
Jon, B., Lisa, W., Christensen, D. L., Maenner, M. J., Daniels, J., Zachary, W., et al. (2018). Prevalence of autism spectrum disorder among children aged 8 years–autism and developmental disabilities monitoring network, 11 sites, United States, 2014. MMWR Surveill. Summ. 67, 1–23. doi: 10.15585/mmwr.ss6802a1
Jordan, M. I., and Mitchell, T. M. (2015). Machine learning: trends, perspectives, and prospects. Science 349, 255–260. doi: 10.1126/science.aac4520
Just, M. A., Cherkassky, V. L., Buchweitz, A., Keller, T. A., and Mitchel, T. M. (2014). Identifying autism from neural representations of social interactions: neurocognitive markers of autism. PLoS One 9:e113879. doi: 10.1371/journal.pone.0113879
Kana, R. K., Keller, T. A., Cherkassky, V. L., Minshew, N. J., and Just, M. A. (2009). Atypical frontal-posterior synchronization of theory of mind regions in autism during mental state attribution. Soc. Neurosci. 4, 135–152. doi: 10.1080/17470910802198510
Kassraian-Fard, P., Matthis, C., Balsters, J. H., Maathuis, M. H., and Wenderoth, N. (2016). Promises, pitfalls, and basic guidelines for applying machine learning classifiers to psychiatric imaging data, with autism as an example. Front. Psychiatry 7:177. doi: 10.3389/fpsyt.2016.00177
Kazeminejad, A., and Sotero, R. C. (2019). Topological properties of resting-state fmri functional networks improve machine learning-based autism classification. Front. Neurosci. 12:1018. doi: 10.3389/fnins.2018.01018
Kazeminejad, A., and Sotero, R. C. (2020). The importance of anti-correlations in graph theory based classification of autism spectrum disorder. Front. Neurosci. 14:676. doi: 10.3389/fnins.2020.00676
Kong, Y., Gao, J., Xu, Y., Pan, Y., Wang, J., and Liu, J. (2018). Classification of autism spectrum disorder by combining brain connectivity and deep neural network classifier. Neurocomputing 324, 63–68. doi: 10.1016/j.neucom.2018.04.080
Ktena, S. I., Parisot, S., Ferrante, E., Rajchl, M., Lee, M., Glocker, B., et al. (2017). Metric learning with spectral graph convolutions on brain connectivity networks. Neuroimage 169, 431–442. doi: 10.1016/j.neuroimage.2017.12.052
Lashkari, D., Vul, E., Kanwisher, N., and Golland, P. (2009). Discovering structure in the space of fMRI selectivity profiles. Neuroimage 50, 1085–1098. doi: 10.1016/j.neuroimage.2009.12.106
Li, H., Parikh, N. A., and He, L. (2018). A novel transfer learning approach to enhance deep neural network classification of brain functional connectomes. Front. Neurosci. 12:491. doi: 10.3389/fnins.2018.00491
Liu, J., Sheng, Y., Lan, W., Guo, R., Wang, Y., and Wang, J. (2020). Improved ASD classification using dynamic functional connectivity and multi-task feature selection. Pattern Recognit. Lett. 138, 82–87. doi: 10.1016/j.patrec.2020.07.005
Liu, Y., Xu, L., Li, J., Yu, J., and Yu, X. (2020). Attentional connectivity-based prediction of autism using heterogeneous rs-fMRI data from CC200 atlas. Exper. Neurobiol. 29, 27–37. doi: 10.5607/en.2020.29.1.27
Martino, A. D., Yan, C.-G., Li, Q., Denio, E., and Castellanos, F. X. (2014). The autism brain imaging data exchange: towards large-scale evaluation of the intrinsic brain architecture in autism. Mol. Psychiatry 19, 659–667. doi: 10.1038/mp.2013.78
Martino, A. D., Zuo, X.-N., Kelly, C., Grzadzinski, R., Mennes, M., Schvarcz, A., et al. (2013). Shared and distinct intrinsic functional network centrality in autism and attention-deficit/hyperactivity disorder. Biol. Psychiatry 74, 623–632. doi: 10.1016/j.biopsych.2013.02.011
Mash, L. E., Linke, A. C., Olson, L. A., Fishman, I., Liu, T. T., and Müller, R.-A. (2019). Transient states of network connectivity are atypical in autism: a dynamic functional connectivity study. Hum. Brain Mapp. 40, 2377–2389. doi: 10.1002/hbm.24529
Masona, R. A., Williams, D. L., Kana, R. K., Minshew, N., and Just, M. A. (2008). Theory of mind disruption and recruitment of the right hemisphere during narrative comprehension in autism. Neuropsychologia 46, 269–280. doi: 10.1016/j.neuropsychologia.2007.07.018
Minshew, N. J., and Keller, T. A. (2010). The nature of brain dysfunction in autism: functional brain imaging studies. Curr. Opin. Neurol. 23, 124–130. doi: 10.1097/WCO.0b013e32833782d4
Minshew, N. J., and Williams, D. L. (2007). The new neurobiology of autism: cortex, connectivity, and neuronal organization. Arch. Neurol. 64, 945–950. doi: 10.1001/archneur.64.7.945
Monk, C. S., Peltier, S. J., Wiggins, J. L., Weng, S.-J., Carrasco, M., Risi, S., et al. (2009). Abnormalities of intrinsic functional connectivity in autism spectrum disorders. Neuroimage 47, 764–772. doi: 10.1016/j.neuroimage.2009.04.069
Mourão-Miranda, J., Bokde, A. L. W., Born, C., Hampel, H., and Stetter, M. (2005). Classifying brain states and determining the discriminating activation patterns: support vector machine on functional MRI data. Neuroimage 28, 980–995. doi: 10.1016/j.neuroimage.2005.06.070
Murdaugh, D. L., Shinkareva, S. V., Deshpande, H. R., Wang, J., Pennick, M. R., and Kana, R. K. (2012). Differential deactivation during mentalizing and classification of autism based on default mode network connectivity. PLoS One 7:e50064. doi: 10.1371/journal.pone.0050064
Neufeld, J., Kuja-Halkola, R., Mevel, K., Cauvet, É, Fransson, P., and Bölte, S. (2017). Alterations in resting state connectivity along the autism trait continuum: a twin study. Mol. Psychiatry 23, 1659–1665. doi: 10.1038/mp.2017.160
Nevison, C. D. (2014). A comparison of temporal trends in United States autism prevalence to trends in suspected environmental factors. Environ. Health 13:73.
Nielsen, J. A., Zielinski, B. A., Fletcher, P. T., Alexander, A. L., Lange, N., Bigler, E. D., et al. (2013). Multisite functional connectivity MRI classification of autism: ABIDE results. Front. Hum. Neurosci. 7:599. doi: 10.3389/fnhum.2013.00599
Niu, K., Guo, J., Pan, Y., Gao, X., Peng, X., Li, N., et al. (2020). Multichannel deep attention neural networks for the classification of autism spectrum disorder using neuroimaging and personal characteristic data. Complexity 3, 1–9. doi: 10.1155/2020/1357853
Odriozola, P., Uddin, L. Q., Lynch, C. J., Kochalka, J., Chen, T., and Menon, V. (2016). Insula response and connectivity during social and non-social attention in children with autism. Soc. Cogn. Affect. Neurosci. 11, 433–444. doi: 10.1093/scan/nsv126
Patel, M. J., Andreescu, C., Price, J. C., Edelman, K. L., Reynolds, C. F. III, and Aizenstein, H. J. (2015). Machine learning approaches for integrating clinical and imaging features in LLD classification and response prediction. Int. J. Geriatr. Psychiatry 30, 1056–1067. doi: 10.1002/gps.4262
Pereira, F., Mitchell, T., and Botvinick, M. (2009). Machine learning classifiers and FMRI: a tutorial overview. Neuroimage 45, S199–S209.
Plitt, M., Barnes, K. A., and Martin, A. (2015). Functional connectivity classification of autism identifies highly predictive brain features but falls short of biomarker standards. Neuroimage Clin. 7, 359–366. doi: 10.1016/j.nicl.2014.12.013
Poldrack, R. A., Barch, D. M., Mitchell, J. P., Wager, T. D., Wagner, A., Devlin, J. T., et al. (2013). Towards open sharing of task-based fMRI data: the OpenfMRI project. Front. Neuroinform. 7:12. doi: 10.3389/fninf.2013.00012
Poldrack, R. A., and Gorgolewski, K. J. (2015). OpenfMRI: open sharing of task fMRI data. Neuroimage 144, 259–261. doi: 10.1016/j.neuroimage.2015.05.073
Power, J. D., Cohen, A. L., Nelson, S. M., Wig, G. S., Barnes, K. A., Church, J. A., et al. (2011). Functional network organization of the human brain. Neuron 72, 665–678. doi: 10.1016/j.neuron.2011.09.006
Power, J. D., Schlaggar, B. L., and Petersen, S. E. (2014). Studying brain organization via spontaneous fMRI signal. Neuron 84, 681–696. doi: 10.1016/j.neuron.2014.09.007
Price, T., Wee, C. Y., Gao, W., and Shen, D. (2014). Multiple-network classification of childhood autism using functional connectivity dynamics. Med. Image. Comput. Comput. Assist. Interv. 17, 177–184. doi: 10.1007/978-3-319-10443-0_23
Raichle, M. E., MacLeod, A. M., Snyder, A. Z., Powers, W. J., Gusnard, D. A., and Shulman, G. L. (2001). A default mode of brain function. Proc. Natl. Acad. Sci. U.S.A. 98, 676–682.
Rane, S., Jolly, E., Park, A., Jang, H., and Craddock, C. (2017). Developing predictive imaging biomarkers using whole-brain classifiers: application to the ABIDE I dataset. Res. Ideas Outcomes 3:e12733. doi: 10.3897/rio.3.e12733
Redcay, E., Moran, J. M., Mavros, P. L., Tager-Flusberg, H., Gabrieli, J. D. E., and Whitfield-Gabrieli, S. (2013). Intrinsic functional network organization in high-functioning adolescents with autism spectrum disorder. Front. Hum. Neurosci. 7:573. doi: 10.3389/fnhum.2013.00573
Reiter, M. A., Jahedi, A., Fredo, A. R. J., Fishman, I., Bailey, B., and Muller, R.-A. (2021). Performance of machine learning classification models of autism using resting-state fMRI is contingent on sample heterogeneity. Neural Comput. App. 33, 3299–3310. doi: 10.1007/s00521-020-05193-y
Sherkatghanad, Z., Zomorodi-Moghadam, M., Khosrowabadi, R., Akhondzadeh, M., Abdar, M., and Salari, V. (2020). Automated detection of autism spectrum disorder using a convolutional neural network. Front. Neurosci. 13:1325. doi: 10.3389/fnins.2019.01325
Soussia, M., and Rekik, I. (2018). Unsupervised manifold learning using high-order morphological brain networks derived from T1-w MRI for autism diagnosis. Front. Neuroinform. 12:70. doi: 10.3389/fninf.2018.00070
Tang, M., Kumar, P., Chen, H., and Shrivastava, A. (2020). Deep multimodal learning for the diagnosis of autism spectrum disorder. J. Imaging 6:47. doi: 10.3390/jimaging6060047
Thomas, R. M., Gallo, S., Cerliani, L., Zhutovsky, P., El-Gazzar, A., and Wingen, G. V. (2020). Classifying autism spectrum disorder using the temporal statistics of resting-state functional mri data with 3D convolutional neural networks. Front. Psychiatry 11:440. doi: 10.3389/fpsyt.2020.00440
Uddin, L. Q., Supekar, K., Lynch, C. J., Khouzam, A., Phillips, J., Feinstein, C., et al. (2013a). Salience network–based classification and prediction of symptom severity in children with autism. JAMA Psychiatry 70, 869–879. doi: 10.1001/jamapsychiatry.2013.104
Uddin, L.Q., Supekar, K., and Menon, V. (2013b). Reconceptualizing functional brain connectivity in autism from a developmental perspective. Front. Hum. Neurosci. 7:458. doi: 10.3389/fnhum.2013.00458
Wang, B., Zhu, J., Pierson, E., Ramazzotti, D., and Batzoglou, S. (2017). Visualization and analysis of single-cell rna-seq data by kernel-based similarity learning. Nat. Methods 14, 414–416. doi: 10.1038/nmeth.4207
Wang, H., Chen, C., and Fushing, H. (2012). Extracting multiscale pattern information of fMRI based functional brain connectivity with application on classification of autism spectrum disorders. PLoS One 7:e45502. doi: 10.1371/journal.pone.0045502
Wang, J., Zhang, L., Wang, Q., Chen, L., Shi, J., Chen, X., et al. (2020). Multi-class asd classification based on functional connectivity and functional correlation tensor via multi-source domain adaptation and multi-view sparse representation. IEEE transactions on medical imaging 39, 3137–3147. doi: 10.1109/TMI.2020.2987817
Washington, S. D., Gordon, E. M., Brar, J., Warburton, S., Sawyer, A., Wolfe, A., et al. (2014). Dysmaturation of the default mode network in autism. Hum. Brain Mapp. 35, 1284–1296. doi: 10.1002/hbm.22252
Wolfers, T., Buitelaar, J. K., Beckman, C. F., Franke, B., and Marquand, A. F. (2015). From estimating activation locality to predicting disorder: a review of pattern recognition for neuroimaging-based psychiatric diagnostics. Neurosci. Biohehav. Rev. 57, 328–349. doi: 10.1016/j.neubiorev.2015.08.001
Yahata, N., Morimoto, J., Hashimoto, R., Lisi, G., Shibata, K., Kawakubo, Y., et al. (2016). A small number of abnormal brain connections predicts adult autism spectrum disorder. Nat. Commun. 7:11254. doi: 10.1038/ncomms11254
Yang, M., Cao, M., Chen, Y., Chen, Y., Fan, G., Li, C., et al. (2021). Large-scale brain functional network integration for discrimination of autism using a 3-D deep learning model. Front. Hum. Neurosci. 15:687288. doi: 10.3389/fnhum.2021.687288
Yeo, B. T. T., Krienen, F. M., Sepulcre, J., Sabuncu, M. R., Lashkari, D., Hollinshead, M., et al. (2011). The organization of the human cerebral cortex estimated by intrinsic functional connectivity. J. Neurophysiol. 106, 1125–1165. doi: 10.1152/jn.00338.2011
Yin, W., Mostafa, S., and Wu, F. (2021). Diagnosis of autism spectrum disorder based on functional brain networks with deep learning. J. Comput. Biol. 28, 146-165. doi: 10.1089/cmb.2020.025
Zeng, L.-L., Shen, H., Liu, L., and Hu, D. (2014). Unsupervised classification of major depression using functional connectivity MRI. Hum. Brain Mapp. 35, 1630–1641. doi: 10.1002/hbm.22278
Zhao, F., Chen, Z., Rekik, I., Lee, S.-W., and Shen, D. (2020). Diagnosis of autism spectrum disorder using central-moment features from low- and high-order dynamic resting-state functional connectivity networks. Front. Neurosci. 14:258. doi: 10.3389/fnins.2020.00258
Zhao, F., Zhang, H., Rekik, I., An, Z., and Shen, D. (2018). Diagnosis of autism spectrumdisorders using multi-level high-order functional networksderived from resting-statefunctional MRI. Front. Hum. Neurosci. 12:184. doi: 10.3389/fnhum.2018.00184
Zhou, Y., Yu, F., and Duong, T. (2014). Multiparametric MRI characterization and prediction in autism spectrum disorder using graph theory and machine learning. PLoS One 9:e90405. doi: 10.1371/journal.pone.0090405
Keywords: autism spectrum disorder, functional connectivity, functional magnetic resonance imaging, machine learning, feature selection
Citation: Liu M, Li B and Hu D (2021) Autism Spectrum Disorder Studies Using fMRI Data and Machine Learning: A Review. Front. Neurosci. 15:697870. doi: 10.3389/fnins.2021.697870
Received: 20 April 2021; Accepted: 09 August 2021;
Published: 15 September 2021.
Edited by:
Sergey M. Plis, Georgia State University, United StatesReviewed by:
Tuo Zhang, Northwestern Polytechnical University, ChinaHuan Liu, Jiangsu University, China
Copyright © 2021 Liu, Li and Hu. This is an open-access article distributed under the terms of the Creative Commons Attribution License (CC BY). The use, distribution or reproduction in other forums is permitted, provided the original author(s) and the copyright owner(s) are credited and that the original publication in this journal is cited, in accordance with accepted academic practice. No use, distribution or reproduction is permitted which does not comply with these terms.
*Correspondence: Dewen Hu, dwhu@nudt.edu.cn; Baojuan Li, libjuan@fmmu.edu.cn