 Kevin K. K. Yu
 Gladys L. Y. Cheing
 Charlton Cheung
 Georg S. Kranz
 Alex Kwok-Kuen Cheung
94% of researchers rate our articles as excellent or good
Learn more about the work of our research integrity team to safeguard the quality of each article we publish.
Find out more
SYSTEMATIC REVIEW article
Front. Neurosci. , 07 June 2021
Sec. Neuroendocrine Science
Volume 15 - 2021 | https://doi.org/10.3389/fnins.2021.638861
This article is part of the Research Topic Brain and Diabetes View all 11 articles
Aims/hypothesis: Diabetes mellitus (DM) is associated with comorbid brain disorders. Neuroimaging studies in DM revealed neuronal degeneration in several cortical and subcortical brain regions. Previous studies indicate more pronounced brain alterations in type 2 diabetes mellitus (T2DM) than in type 1 diabetes mellitus (T1DM). However, a comparison of both types of DM in a single analysis has not been done so far. The aim of this meta-analysis was to conduct an unbiased objective investigation of neuroanatomical differences in DM by combining voxel-based morphometry (VBM) studies of T1DM and T2DM using dual disorder anatomical likelihood estimation (ALE) quantification.
Methods: PubMed, Web of Science and Medline were systematically searched for publications until June 15, 2020. VBM studies comparing gray matter volume (GMV) differences between DM patients and controls at the whole-brain level were included. Study coordinates were entered into the ALE meta-analysis to investigate the extent to which T1DM, T2DM, or both conditions contribute to gray matter volume differences compared to controls.
Results: Twenty studies (comprising of 1,175 patients matched with 1,013 controls) were included, with seven studies on GMV alterations in T1DM and 13 studies on GMV alterations in T2DM. ALE analysis revealed seven clusters of significantly lower GMV in T1DM and T2DM patients relative to controls across studies. Both DM subtypes showed GMV reductions in the left caudate, right superior temporal lobe, and left cuneus. Conversely, GMV reductions associated exclusively with T2DM (>99% contribution) were found in the left cingulate, right posterior lobe, right caudate and left occipital lobe. Meta-regression revealed no significant influence of study size, disease duration, and HbA1c values.
Conclusions/interpretation: Our findings suggest a more pronounced gray matter atrophy in T2DM compared to T1DM. The increased risk of microvascular or macrovascular complications, as well as the disease-specific pathology of T2DM may contribute to observed GMV reductions.
Systematic Review Registration: [PROSPERO], identifier [CRD42020142525].
Diabetes mellitus (DM) is a common disease affecting more than 451 million people worldwide, and its prevalence may increase to 693 million cases by 2,045 (Cho et al., 2018). DM is divided into two subtypes, type 1 diabetes (T1DM) and type 2 diabetes (T2DM). Both subtypes are associated with persistent hyperglycemia, but have distinct causes, a different age at onset and different pathophysiologies (Leslie et al., 2016). T1DM has an onset in childhood and young adulthood and is characterized by insulin deficiency due to an autoimmune attack of insulin producing pancreatic beta cells. Conversely, with its onset in adulthood, T2DM is a chronic condition characterized by the body's increasing inability to either respond to functional insulin effectively and/or produce sufficient insulin for normal glucose regulation. Because of impaired glucose metabolism, it is widely accepted that both types of DM share increased risk in similar clinical features and complications, primarily vascular disease such as retinopathy, neuropathy, nephropathy, and cardiovascular disease.
Growing attention has been paid to the effect of DM on central nervous system because proper glucose regulation is essential for optimal brain functioning. Cognitive decrement has been observed in neuropsychological tests among diabetic patients; in particular, information processing speed and psychomotor efficiency were more affected than other cognitive functioning domains by the disease (Ryan et al., 2003; Brands et al., 2006). Furthermore, DM has been found to be associated with increased risk of Alzheimer disease. Quantitative meta-analysis of longitudinal studies identified higher relative risk of Alzheimer disease of 1.5 (95% CI 1.2–1.8) and vascular dementia of 2.5 (95% CI 2.1–3.0) among diabetic patients when compared with their nondiabetic counterparts (Cheng et al., 2012). Collectively, both types of DM have been shown to be associated with reduced cognitive function. While several studies indicated more pronounced dysfunctions in T2DM compared to T1DM, direct comparisons showed no systematic differences in cognitive abilities such as abstract reasoning, memory, attention and executive function, visuoconstruction, and information processing speed (Brands et al., 2007).
Brain imaging such as magnetic resonance imaging (MRI) is an ideal means to explore the neural correlates of cognitive dysfunction in DM. Altered cerebral metabolism has been observed in T1DM and T2DM (Sarac et al., 2005; Sinha et al., 2014). In addition, structural neuroimaging revealed reduced gray matter volume (GMV) in both types of DM. However, results were inconsistent, which may be attributed to numerous variables including differences in sample size, imaging devices and protocols used (Gold et al., 2007; Chen et al., 2012; Moran et al., 2013; Zhang et al., 2014). Direct comparisons of MRI ratings of white matter lesions and cortical atrophy by Brands et al. (2007) revealed more pronounced deep white matter lesions and cortical atrophy in T2DM compared to T1DM (Brands et al., 2007). A more recent study by Moulton et al. (2015) attempted to review neuroimaging research including voxel-based morphometry (VBM) data and volumetric data using meta-analysis (Moulton et al., 2015). The authors performed separate meta-analyses for T1DM and T2DM and found reduced bilateral thalamus in T1DM whereas reduced global brain volume and regional atrophy in the hippocampi, basal ganglia, and orbitofrontal and occipital lobes were seen in T2DM. However, a comparison of VBM data of both types of DM in a single analysis has not been done so far. Yet, such an analysis would be needed in order to investigate the distinctiveness or similarities of T1DM and T2DM directly in an unbiased objective comparison.
VBM is an automated whole-brain based analysis method that has several advantages over a region-of-interest (ROI)-based approach. VBM measures local volume or concentration of gray matter voxel-wise across the whole brain. Thus, in order to conduct an unbiased objective investigation of neuroanatomical differences in DM, the aim of this study was to conduct a meta-analysis combining VBM studies of T1DM and T2DM using the anatomical likelihood estimation (ALE) technique.
Our meta-analysis was registered with PROSPERO (registration number CRD42020142525) and was conducted according to the Preferred Reporting Items for Systematic Reviews and Meta-Analyses (PRISMA) guidelines (Moher et al., 2009). The studies were selected from PubMed (https://pubmed.ncbi.nlm.nih.gov/), Web of Science (https://www.webofknowledge.com/) and Google Scholar (https://scholar.google.com.hk/) databases and were limited to publications before October 1, 2020. The keywords used were “diabetes” or “diabetes mellitus” or “DM” plus “VBM,” “voxel-based,” “voxel-wise,” “morphometry,” or “VBM.” In addition, review articles and reference lists of identified articles were manually checked. Individual articles had to meet the following inclusion criteria:
(1) Gray matter differences between patients with DM and non-DM controls were compared
(2) Comparison was performed at the whole-brain level
(3) The gray matter differences between patients and controls were reported in a stereotactic space in three coordinates (x, y, z), either in Montreal Neurological Institute (MNI) or Talairach space.
(4) Coordinates were included as separate studies if they contained multiple independent patient samples.
(5) Studies using ROI or seed voxel-based analysis were excluded.
(6) For studies lacking the Talairach or MNI coordinates, study authors were contacted in order to minimize the possibility of a biased sample set.
(7) Studies considered for inclusion had to be published in English in a peer-reviewed journal
(8) Subjects included had to have formal diagnosis of either type 1 or type 2 diabetes. Moreover, voxel-based imaging methods and co-ordinates reported in 3D stereotactic space had to be used.
Studies restricted to males/females or children/adults were included. Studies presenting overlapping or identical samples were identified, and only the study presenting the largest number of subjects was retained. If there was possible overlapping but different results were presented, e.g., hippocampus presented in one study while frontal lobe in another, all data were included.
A customized checklist was used to assess the quality of included studies, as done by others (Katon et al., 2010) (Table 1). The checklist contained 12 items, and was based on previous meta-analytic studies (Shepherd et al., 2012; Du et al., 2014) with additional parameters including the diagnostic procedures, the demographic and clinical characterization, the sample size, the MRI acquisition parameters, the analysis technique and the quality of the reported results. Due to the rapid changing of data-processing methods, we included a new item “included modern MRI processing methods of past 10 years” in the checklist (item 8). The checklist provided objective information about the quality of included studies. Each study was reviewed by two authors (K.K.K.Y, G.S.K), and a completeness rating was independently determined. If ratings disagreements arose, the papers were discussed, after which a consensus score was obtained. Only studies with quality score of 8 or above were included in the analysis.
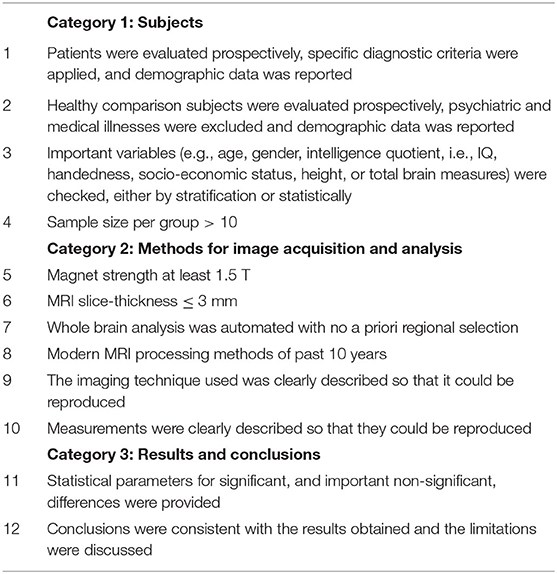
Table 1. Customized checklist for study quality assessment (adopted from Du et al., 2014).
ALE treats each foci reported in VBM as a probability distribution in order to test for agreement across studies (Turkeltaub et al., 2002; Laird et al., 2005; Ellison-Wright et al., 2008). Typically, ALE is applied on a single disorder to identify volumetric differences consistently reported across VBM studies. The result of this approach is an ALE map showing the same regions that are consistently reported across studies. In the present study, we adopted the “Dual Disorder ALE Quantification.” We have previously applied this method to study similarities across different disorders such as schizophrenia and bipolar disorder, and schizophrenia and autism (Cheung et al., 2010; Yu et al., 2010; McAlonan et al., 2011). In brief, a map of gray matter difference compared to controls was generated for each study. These “gray matter difference” maps were categorized based on their disorder type, and averaged into a mean map. As a result, a mean map of T1DM and a mean map of T2DM were created. The mean maps were combined to form a total gray matter difference map, after which whole brain permutation testing (Turkeltaub et al., 2002), and controlled false discovery rate (FDR) thresholding was conducted (Laird et al., 2005). These procedures were conducted using an ALE kernel (Leung et al., 2009) available from the open source software available at http://csl.georgetown.edu/software/ (Turkeltaub et al., 2002). The intensity of the mean disorder maps and the intensity of the final ALE result were divided such that the intensity ratio for each resultant cluster was calculated (ALE kernel and customized scripts for Matlab and SPM12).
The first stage of ALE is to generate a Gaussian distribution surrounding the central coordinates for each significant focus reported in studies. The probability that any given voxel is linked to the disorder(s) in question can be quantitatively estimated from this whole brain likelihood map. ALE eliminates unlikely foci and only points to likely foci that are close in proximity, in effect outlining regions which were reported most often across studies, to generate resultant three-dimensional clusters. It is emphasized that the approach of this study was to combine datasets from both disorders into the same entry for a single analysis. In order to do so, individual “likelihood” maps that reflect the probability of finding gray matter differences, were generated for each of the included studies. A study with no findings across subjects and controls were represented by an empty map. Each of the likelihood maps were grouped based on the type of DM (T1 or T2), and averaged together into a mean likelihood map of conditions. The purpose for generating the mean maps was to avoid bias toward the condition with more reported foci. The mean maps were summated together to a joint likelihood map and 10,000 permutations were used to sample the null distribution. The result was thresholded by FDR (p < 0.05) and clusters smaller than 100 mm3 were filtered. The resultant ALE map then contained clusters consisting of foci from T1DM, or T2DM, or both conditions. The contribution of each disorder to every resultant cluster was calculable. Two separate ALE analyses were performed for reductions and elevated gray matter volumes.
Finally, for each of the included studies, a “gray matter difference” map was generated to determine how much each study contributes toward the resultant ALE clusters. This contribution score was then used for meta-regression to test whether demographics or clinical measures including the study size, disease duration, and % glycated hemoglobin (HbA1c) have any influences toward the ALE result.
Figure 1 shows the detailed selection process of included studies. After screening through title and abstract and removal of duplicates, a total of 94 studies were checked for eligibility. Among which, 32 studies were excluded as the VBM method was not adopted, and 42 studies were not included because the coordinates representing gray matter differences were not reported. A total of 20 studies were included in this analysis, with seven studies and 13 studies describing gray matter alterations in T1DM and T2DM respectively (see Table 2). A total of 1,175 patients matched with 1,013 controls were included. The T1DM group was significantly younger than the T2DM group (with a mean age of 23.7 compared to 49.8 years, respectively). However, there were no significant differences in age and sex between patient groups and their respective control groups. A total of 509 patients in the T1DM group were matched with 351 controls, whereas a total of 666 patients constituted the T2DM group that was matched with 662 control participants. T1DM had diabetes for an average of 14.7 years which was double than the average 7.3 years of T2DM, although this difference did not reach significance given the considerable variance between studies (see Table 2). Both groups had comparable HbA1c levels (T1DM: 8.6; T2DM: 8.3).
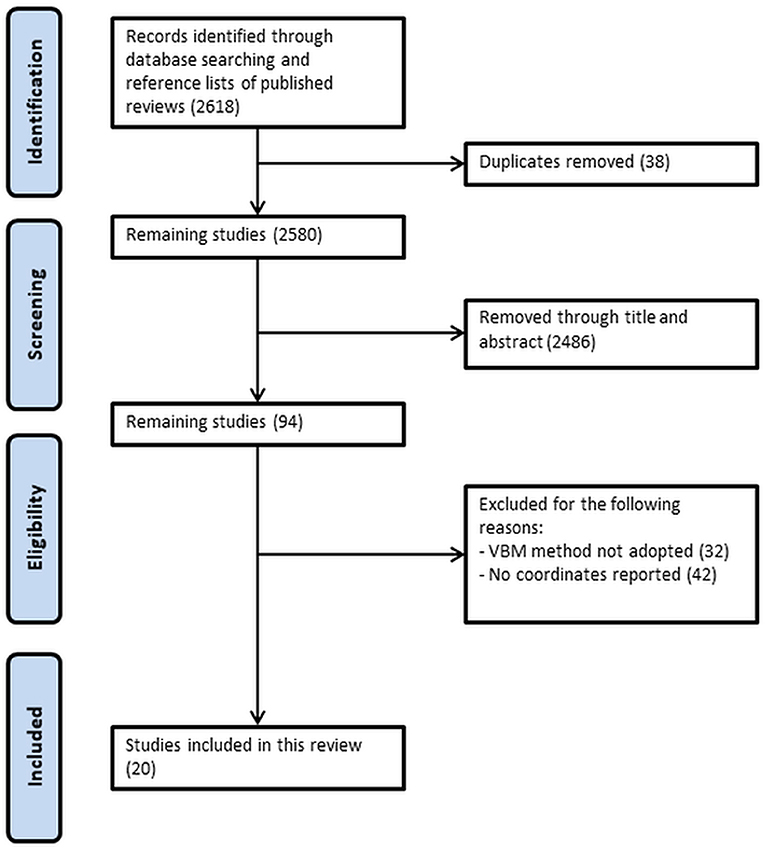
Figure 1. Preferred Reporting Items for Systematic Reviews and Meta-analyses (PRISMA) flow diagram of search strategy.
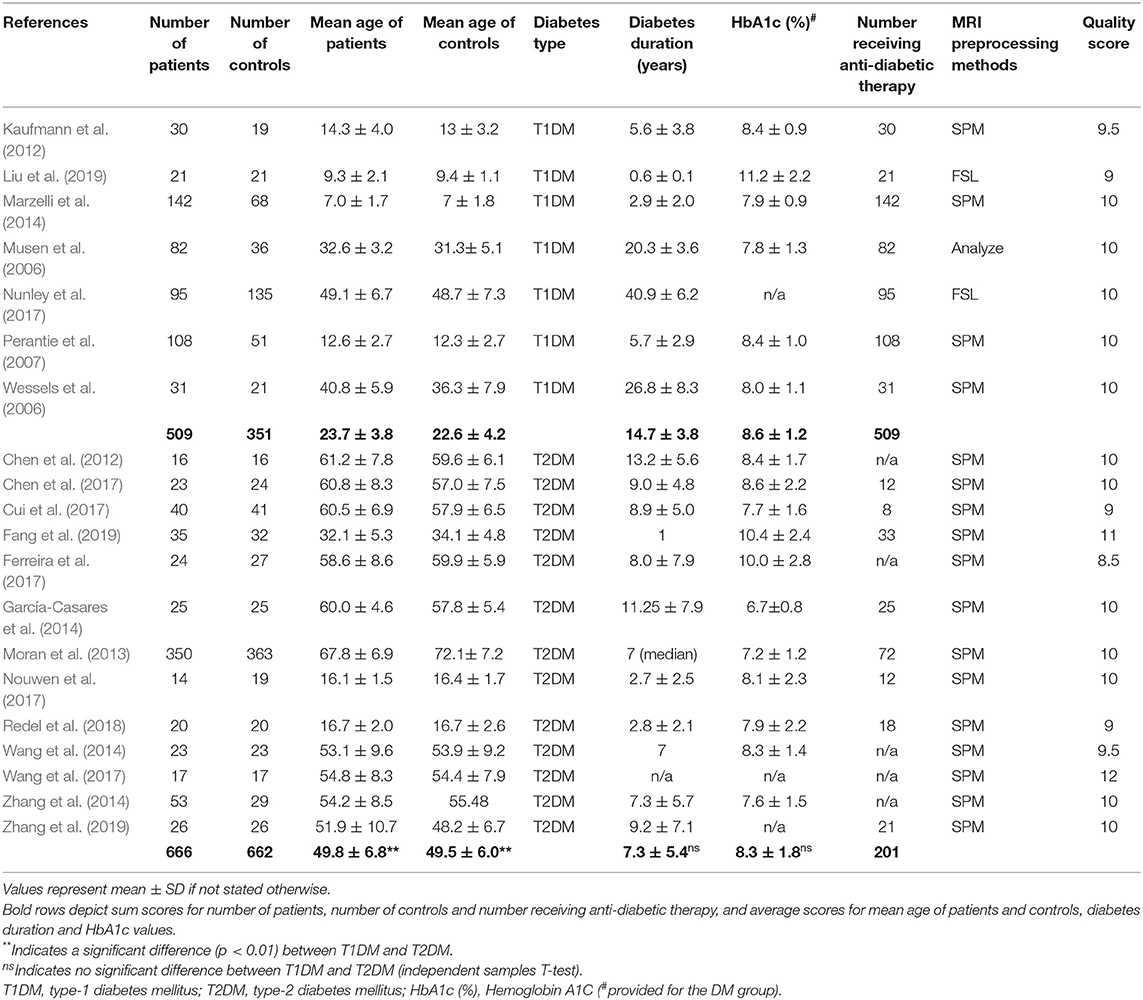
Table 2. Papers included in the current meta-analysis.
ALE analysis for GMV reductions revealed seven clusters of lower GMV in T1DM and T2DM patients relative to controls across studies (see Table 3 and Figure 2). Both DM subtypes showed GMV reductions in the left caudate, right middle temporal lobe and left cuneus (BA 19). Whereas reductions in left cuneus and right middle temporal lobe were more driven by T1DM, left caudate reductions were stronger in T2DM. Conversely, GMV reductions associated exclusively with T2DM (>99% contribution) were found in the left cingulate (BA 31), right inferior temporal lobe, right caudate and left occipital lobe. GMV reductions associated mainly with T1DM were not present (for the exact % of contribution for each cluster, see Table 2). The ALE analysis for GMV increases revealed no significant clusters for any DM subtype.
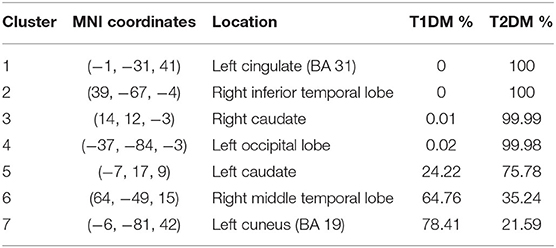
Table 3. ALE clusters of lower gray matter volumes in T1DM and T2DM compared to controls.
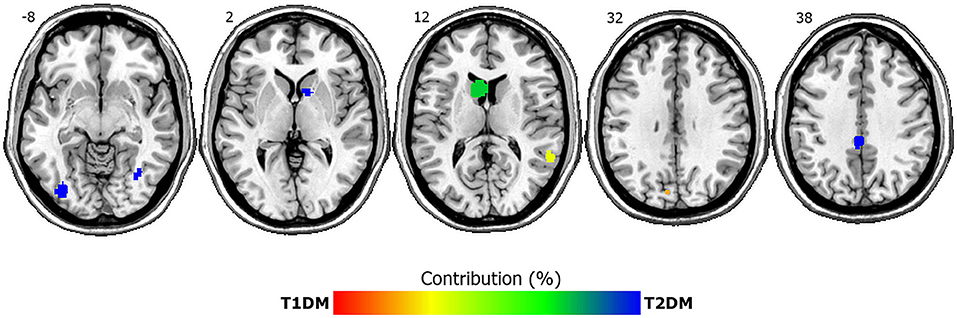
Figure 2. ALE clusters of lower gray matter volumes in T1DM and T2DM compared to controls. Depicted are seven significant clusters, overlaid onto axial structural MRI planes Numbers depict z-coordinates in MNI space. Blue clusters are driven by T2DM whereas both disorders contribute to green-yellow clusters. Percent contribution is signaled by the color bar, with red indicating 100% contribution by T1DM and blue indicating 100% contribution by T2DM. Left is left.
Finally, a meta-regression to investigate the potential influence of study size (number of included participants), disease duration, and % glycated hemoglobin (HbA1c) revealed no significant influence of these covariates, neither when tested individually, nor when combined in one regression model.
This ALE meta-analysis made use of 20 VBM studies including seven studies of T1DM patients and 13 studies of T2DM patients to reveal overlaps and differences in GMV alterations between both conditions. Our analysis showed only GMV reductions in diabetic patients compared to controls, but no GMV increases. At first glance, this is not surprising given that hyperglycemia leads to cellular damage, as seen in rodent studies (Sadeghi et al., 2016; Hamed, 2017). More specifically, our results can be explained by insulin resistance, the principal characteristics in DM, which lowers glucose metabolism in the brain, resulting in enhanced amount of plasma glucose in DM patients (Baker et al., 2011). Chronic hyperglycemia is a potential determinant for diabetes-induced problems in the brain, as it could cause metabolic and molecular alterations, leading to neuron dysfunction or death in the brain (Tomlinson and Gardiner, 2008). Similar to Alzheimer's disease (AD), tau phosphorylation and activation of advanced glycation end products (AGE) have been known to contribute to multiple proinflammatory cytokine release that eventually leads to synapse reduction and neuronal loss in diabetic brain (Zhao et al., 2018). Consequently, the resulting neuronal loss and gray matter atrophy that accounted for the frequently observed cognitive dysfunctions in DM are observable by brain MRI as GMV reductions (Brands et al., 2005).
Our meta-analysis shows a preponderance of GMV reductions in T2DM compared to T1DM, although T2DM appears to be better as compared to that of T1DM from the perspective of disease duration of patients as well as the glycemic control. Our meta-regression analysis revealed no influence of study size, disease duration, or HbA1c values on GMV, further suggesting that the involvement of other contributing factors to the GMV reductions. It is, in fact, not entirely out of our expectation considering that the etiologies of the two types are quite different. A recent review from Tamarai et al. (2019) have indicated obvious differences in the known genetic variants associated with the two types of DM (Tamarai et al., 2019). T1DM is a result of insufficient insulin secreting β-cells, and the genetic variations associated with T1DM are mainly related to alterations in insulin synthesis. While T2DM demonstrates impaired mechanisms of insulin release in response to hyperglycemia in addition to β-cells deficiency. The complexity of T2DM pathophysiology can be comprehended by interaction between multiple genes scattered all across the genome, as well as the interaction between genetic factors and environmental factors (e.g., life style; Tamarai et al., 2019).
Lower GMV in T2DM compared to T1DM is in accordance with a comparative study by Brands et al. (2007) who showed that MRI ratings of cortical atrophy are worse in T2DM compared to T1DM (Brands et al., 2007). Microvascular or macrovascular complications and comorbidities are more likely in T2DM than T1DM even when investigating youth-onset DM and adjusting for age (Luk et al., 2014; Dabelea et al., 2017). While it is possible that comorbid conditions, such as hypoglycaemia, hypercholestrolaemia, and hypertension may explain the difference, cognitive dysfunctions may also explain the differences in GMV reductions between DM types. Cognitive impairments seem to be stronger in T2DM compared to T1DM (Awad et al., 2004; Brands et al., 2005; Zilliox et al., 2016), but a direct comparison of the two DM types revealed no significant differences in cognitive dysfunctions (Brands et al., 2007).
GMV reductions in our study were confined to seven clusters in specified brain regions including left and right caudate, temporal, occipital lobes, and cingulate cortex. GMV reductions in caudate, cingulate, inferior temporal, occipital lobe were exclusively driven by T2DM. These results partly concur with a volumetric meta-analysis by Moulton et al. (2015) who also observed occipital and caudate GMV reductions in T2DM (Moulton et al., 2015). The caudate exhibits a high insulin receptor density, so GMV in this region may be especially vulnerable to diabetes-associated atrophy (Schulingkamp et al., 2000). Interestingly, a recent transcriptomic analysis conducted with over 300 T2DM samples found that the T2DM-associated genes are expressed in the caudate significantly more than other brain regions (Zhou et al., 2019). Functional analysis revealed that these T2DM-associated genes affects synaptic functions and are related to other neurodegenerative diseases.
Co-occurrence of DM and depression was observed previously (Katon et al., 2010; Balhara, 2011; Roy and Lloyd, 2012; Bãdescu et al., 2016), and the prevalence of developing depression is three times higher in T1DM patients and two times higher in T2DM patients as compared to general population (Roy and Lloyd, 2012). Moreover, those with depression are 60% more likely to develop T2DM (Mezuk et al., 2008). Consistent with our result, in structural and functional connectivity studies of depression disorder, it was reported that there is lower gray matter in the bilateral caudates (Shah et al., 2002; Kim et al., 2008; Ma et al., 2012) and right middle temporal gyrus (Peng et al., 2011; Ma et al., 2012; Kandilarova et al., 2019), and altered functional connectivity in the right caudate and right middle temporal gyrus (Ma et al., 2012). Deficits of these regions may suggest shared pathways that contribute to DM and depression.
GMV reductions in the cingulate cortex observed in our study were confined to a cluster in the posterior cingulate cortex (PCC). The PCC is considered as one of the “key hub” of the DMN, and is associated with functions such as memory retrieval (Gusnard et al., 2001a) and regulating attention (Gusnard et al., 2001b). It has been reported that T2DM subjects have poorer memory and attention impairments as compared to matched controls (Gregg et al., 2000; Kanaya et al., 2004; van den Berg et al., 2010). Also, resting-states fMRI meta-analysis using ALE demonstrates that the PCC is affected in T2DM patients (Xia et al., 2017). Other quantitative fMRI studies using functional connectivity also show that resting-states is altered in the PCC (Cui et al., 2015; Ishibashi et al., 2018). These studies suggest that T2DM may have a disrupted DMN. Furthermore, Chen et al. found reduced functional activity in the PCC in T2DM patients when performing an encoding task related episodic memory, suggesting that DMN is affected in T2DM (Chen et al., 2016). It has also been observed that fractional anisotropy (FA) of the cingulum bundle are correlated to PCC and the medial frontal gyrus, which are important regions of the DMN (Hoogenboom et al., 2014). A previous meta-analysis speculated that gray matter volume differences in the DMN regions including PCC may be the reason why brain activation is affected in the DMN of T2DM patients, in terms of functional connectivity and activity, and ultimately leading to reduced cognitive performance (Liu et al., 2017).
DM (especially T2DM) and AD both shared some common neurocognitive functional deficits, one of which is the impaired memory (Karvani et al., 2019; Backeström et al., 2021). Most research, especially using animal model, places hippocampus as the center of focus on memory loss. While hippocampal atrophy has been observed in T2DM, enlarged hippocampus was reported in T1DM (Hershey et al., 2010; Heyden et al., 2011), further indicating the mechanistic differences between T1DM and T2DM. Hippocampus, located deep within the temporal lobe, is not the only region responsible for memory function. Middle and Inferior temporal gyri, which are relatively superficial as compared to hippocampus, also play critical role in memory. Our data has revealed GMV reductions in right middle temporal gyrus and right inferior temporal gyrus. Middle and inferior temporal gyri (Musen et al., 2006; Chen et al., 2012; Wang et al., 2014; Redel et al., 2018; Zhang et al., 2019) have been associated with semantic memory and semantic priming, in which semantically related stimuli resulted in faster or more effective activation. Early study has already shown a reduced cerebral blood flow in temporal lobe (Jimenez-Bonilla et al., 1996), which is believed to induce neuronal cell loss that resulted in temporal gyri atrophy that accounts for the reduced GMV of the respective regions.
Our data also indicated that left occipital lobe, and left cuneus which is also located in occipital lobe, demonstrated differential GMV in T2DM as compared to control. Occipital lobe is the center for visual processing, and it is possible that differential GMV could be a consequence of early sign of diabetic retinopathy. For example, glaucoma induced retinal damages has been shown to correlate with atrophy in occipital lobe, in particular the BA19 (Jiang et al., 2017). BA19 is located in parts of the cuneus and lingual gyrus. While lingual gyrus is associated with visual memory, cuneus is known to relate to inhibitory control (Haldane et al., 2008; Wang et al., 2018), the ability to inhibit or control impulsive responses by using attention and reasoning. Dysfunction in inhibition, although best known in people with attention deficits and hyperactivity disorder (ADHD), is also observed in T2DM (Cooke et al., 2020). In addition, strong correlation was observed between impaired cognitive performance in T2DM patients and reduced blood flow in cerebral regions, one of which was the occipital lobe (Cui et al., 2017). Therefore, GMV reduction in occipital lobe and cuneus may represent not only visual but also cognitive deficits.
Schizophrenia has long been found to link with increased risk of T2DM, as the prevalence of type 2 diabetes is 2–5-fold higher in patients with schizophrenia when compared with those without DM (Mamakou et al., 2018). While this may due to the impact of antipsychotic treatment and also the disease progression, the fact that drug native patients of schizophrenia were still at 1.27–1.63-fold of risk of having T2DM than general population (Cohen and De Hert, 2011) may suggested that there is uniquely shared risk factor between the two diseases. A review of the genetic databases found 37 common susceptibility genes between schizophrenia and T2DM (Mamakou et al., 2018). Association studies of the TCF7L2 gene in diabetes suggested increased risk of schizophrenia (Hansen et al., 2011; Alkelai et al., 2012).
Contrast to the suggested linkage between T2DM and schizophrenia, a large population study of over 800 k individuals in Finland suggested the reverse between T1DM and schizophrenia (Juvonen et al., 2007). The study found an incidence of 0.21/10,000 schizophrenia in type 1 diabetes, while it was 0.56 /1,000 schizophrenia in the general public, an over 60% reduction in risk of schizophrenia in type 1 diabetes. Our findings in predominantly larger contribution of T2DM in bilateral caudate deficit in gray matter echoes with the contradictive difference in linkage between T1DM and T2DM with schizophrenia. Bilateral caudate deficit was found in drug naïve patients of schizophrenia (Chua et al., 2007) but not with treated patients (Leung et al., 2009), suggesting caudate's role in the early stage and also in the treatment stage of schizophrenia.
In addition to focus given to the contribution of diabetes on cognitive dysfunction, association of antidiabetic treatment on cognitive performance on diabetic patients has also gained attention. A recent meta-analysis (Zhang et al., 2020) summarized 10 studies comprising 254,679 participants to determine the relationship between metformin therapy and cognitive function in T2DM patients, and compared metformin treatment with other antidiabetic drugs, including sulfonylureas, thiazolidinediones, and insulin. Despite all the treatments targeting T2DM, only metformin exhibited significant improvement in cognitive dysfunction, while insulin, suprisingly, aggravated cognitive dysfunction. Furthermore, such improvement was only significant in Americans and Europeans but not in Asian patients, indicating perhaps glycemic control alone might not be as effective in improving DM-induced cognitive dysfunction as expected. In addition to its primary antidiabetic action on reduction of glucose production in liver, metformin has also been shown to prevent neuronal cell death (El-Mir et al., 2008) and inhibited the molecular and pathological development of AD in cell culture model (Gupta et al., 2011). Metformin has been demonstrated to improve cognitive performance in AD patients (Cao et al., 2018) as well as in SAMP8 mice, one of the commonly used animal AD model, without altering blood glucose level (Farr et al., 2019), suggesting that this antidiabetic drug may improve cognitive function by acting on pathways other than glycemic control but the exact mechanism remained unclear. Although cognitive impairment in DM may arise from hyperglycemia, it is believed that a combinatorial effect of inflammation, oxidative stress, impaired cerebrovasculature, increase β-amyloid deposition, cerebral insulin resistance and formation of AGE all contribute to the progressive development of cognitive dysfunction in DM patients.
We acknowledge that there are a number of limitations to this study. First is the “file-drawer” problem which means that studies reporting null results are under-represented in the literature. This is a problem which all meta-analyses suffer. In this study, we tried to minimize this error by generating an empty ALE map for studies that reported no gray matter differences between patient groups and controls. However, such studies demonstrating no differences are uncommon and not likely to be published. Second, MRI methodology is continually being improved, and the data extracted from various studies were pre-processed and analyzed in different ways. It is unfortunate that there were not enough studies to control for confounding factors including modulation and smoothing. To reduce the difference in methodologies affecting the outcome of our present study, we made use of a customized checklist to assess the quality of each study. The quality scores (mean: 9.9; s.d: 0.7) provide an overview of rigorous of each study. Without checking for quality scores, it is possible that lower quality studies (ex: outdated MRI acquisition or data processing methods, and low sample size) could influence the results. Lastly, while all T1DM patients were medicated, only about one third of T2DM patients received medication, hence we cannot rule out that our results could partly reflect an effect of medication.
Our meta-analysis using the ALE methodology indicated GMV reductions in seven brain regions in T1DM and T2DM relative to controls. Clusters of lower GMV associated with both diabetes types were found in left caudate, right middle temporal lobe and left cuneus, whereas clusters exclusively found in T2DM were located in left cingulate, right inferior temporal lobe, right caudate and left occipital lobe. Our results indicate a more pronounced gray matter atrophy in T2DM compared to T1DM. We interpret this finding in terms of microvascular or macrovascular complications and disease-specific pathology of T2DM. To our knowledge, this study is the first meta-analysis of VBM studies in patients with DM which highlights overlapping and distinct brain atrophy found in T1DM and T2DM. The results of our study will aid understanding of the underlying neurodegenerative process in T1DM and T2DM.
The original contributions presented in the study are included in the article/supplementary material, further inquiries can be directed to the corresponding author/s.
GC, KY, and AC designed and conceptualized the study. KY and CC performed the data analysis. GK interpreted the data. KY, GK, CC, and AC contributed to discussion. GK and KY wrote the manuscript. All authors edited and reviewed the manuscript and agreed to its final version.
This work was supported by the Hong Kong Polytechnic University (ZVP8 and ZVR4) and by a Grant from the Hong Kong Research Grants Council (25100219) to GK.
The authors declare that the research was conducted in the absence of any commercial or financial relationships that could be construed as a potential conflict of interest.
Alkelai, A., Greenbaum, L., Lupoli, S., Kohn, Y., Sarner-Kanyas, K., and Ben-Asher, E. (2012). Association of the type 2 diabetes mellitus susceptibility gene TCF7L2 with schizophrenia in an Arab-Israeli family sample. PLoS ONE 7:e29228. doi: 10.1371/journal.pone.0029228
Awad, N., Gagnon, M., and Messier, C. (2004). The relationship between impaired glucose tolerance, type 2 diabetes, and cognitive function. J. Clin. Exp. Neuropsychol. 26, 1044–1080. doi: 10.1080/13803390490514875
Backeström, A., Papadopoulos, K., Eriksson, S., Olsson, T., Andersson, M., Blennow, K., et al. (2021). Acute hyperglycaemia leads to altered frontal lobe brain activity and reduced working memory in type 2 diabetes. PLoS ONE 16:e0247753. doi: 10.1371/journal.pone.0247753
Bãdescu, S. V., Tãtaru, C., Kobylinska, L., Georgescu, E. L., Zahiu, D. M., Zãgrean, A. M., et al. (2016). The association between Diabetes mellitus and Depression. J. Med. Life 9, 120–125.
Baker, L. D., Cross, D. J., Minoshima, S., Belongia, D., Watson, G. S., and Craft, S. (2011). Insulin resistance and Alzheimer-like reductions in regional cerebral glucose metabolism for cognitively normal adults with prediabetes or early type 2 diabetes. Arch. Neurol. 68, 51–57. doi: 10.1001/archneurol.2010.225
Balhara, Y. P. (2011). Diabetes and psychiatric disorders. Indian J. Endocrinol. Metab. 15, 274–283. doi: 10.4103/2230-8210.85579
Brands, A. M., Biessels, G. J., de Haan, E. H., Kappelle, L. J., and Kessels, R. P. (2005). The effects of type 1 diabetes on cognitive performance: a meta-analysis. Diabetes Care 28, 726–735. doi: 10.2337/diacare.28.3.726
Brands, A. M., Biessels, G. J., Kappelle, L. J., de Haan, E. H., de Valk, H. W., Algra, A., et al. (2007). Cognitive functioning and brain MRI in patients with type 1 and type 2 diabetes mellitus: a comparative study. Dement. Geriatr. Cogn. Disord. 23, 343–350. doi: 10.1159/000100980
Brands, A. M., Kessels, R. P., Hoogma, R. P., Henselmans, J. M., van der Beek Boter, J. W., Kappelle, L. J., et al. (2006). Cognitive performance, psychological well-being, and brain magnetic resonance imaging in older patients with type 1 diabetes. Diabetes 55, 1800–1806. doi: 10.2337/db05-1226
Cao, B., Rosenblat, J. D., Brietzke, E., Park, C., Lee, Y., Musial, N., et al. (2018). Comparative efficacy and acceptability of antidiabetic agents for Alzheimer's disease and mild cognitive impairment: a systematic review and network meta-analysis. Diabetes Obes. Metab. 20, 2467–2471. doi: 10.1111/dom.13373
Chen, J., Zhang, J., Liu, X., Wang, X., Xu, X., Li, H., et al. (2017). Abnormal subcortical nuclei shapes in patients with type 2 diabetes mellitus. Eur. Radiol. 27, 4247–4256. doi: 10.1007/s00330-017-4790-3
Chen, Y., Liu, Z., Wang, A., Zhang, J., Zhang, S., Qi, D., et al. (2016). Dysfunctional organization of default mode network before memory impairments in type 2 diabetes. Psychoneuroendocrinology 74, 141–148. doi: 10.1016/j.psyneuen.2016.08.012
Chen, Z., Li, L., Sun, J., and Ma, L. (2012). Mapping the brain in type II diabetes: voxel-based morphometry using DARTEL. Eur. J. Radiol. 81, 1870–1876. doi: 10.1016/j.ejrad.2011.04.025
Cheng, G., Huang, C., Deng, H., and Wang, H. (2012). Diabetes as a risk factor for dementia and mild cognitive impairment: a meta-analysis of longitudinal studies. Intern. Med. J. 42, 484–491. doi: 10.1111/j.1445-5994.2012.02758.x
Cheung, C., Yu, K., Fung, G., Leung, M., Wong, C., Li, Q., et al. (2010). Autistic disorders and schizophrenia: related or remote? An anatomical likelihood estimation. PLoS ONE 5:e12233. doi: 10.1371/journal.pone.0012233
Cho, N. H., Shaw, J. E., Karuranga, S., Huang, Y., da Rocha Fernandes, J. D., Ohlrogge, A. W., et al. (2018). IDF Diabetes Atlas: global estimates of diabetes prevalence for 2017 and projections for 2045. Diabetes Res. Clin. Pract. 138, 271–281. doi: 10.1016/j.diabres.2018.02.023
Chua, S. E., Cheung, C., Cheung, V., Tsang, J. T., Chen, E. Y., Wong, J. C., et al. (2007). Cerebral grey, white matter and csf in never-medicated, first-episode schizophrenia. Schizophr. Res. 89, 12–21. doi: 10.1016/j.schres.2006.09.009
Cohen, D., and De Hert, M. (2011). Endogenic and iatrogenic diabetes mellitus in drug-naïve schizophrenia: the role of olanzapine and its place in the psychopharmacological treatment algorithm. Neuropsychopharmacology 36, 2368–2369. doi: 10.1038/npp.2011.94
Cooke, S., Pennington, K., Jones, A., Bridle, C., Smith, M. F., and Curtis, F. (2020). Effects of exercise, cognitive, and dual-task interventions on cognition in type 2 diabetes mellitus: a systematic review and meta-analysis. PLoS ONE 15:e0232958. doi: 10.1371/journal.pone.0232958
Cui, Y., Jiao, Y., Chen, H. J., Ding, J., Luo, B., Peng, C. Y., et al. (2015). Aberrant functional connectivity of default-mode network in type 2 diabetes patients. Eur. Radiol. 25, 3238–3246. doi: 10.1007/s00330-015-3746-8
Cui, Y., Liang, X., Gu, H., Hu, Y., Zhao, Z., Yang, X. Y., et al. (2017). Cerebral perfusion alterations in type 2 diabetes and its relation to insulin resistance and cognitive dysfunction. Brain Imag. Behav. 11, 1248–1257. doi: 10.1007/s11682-016-9583-9
Dabelea, D., Stafford, J. M., Mayer-Davis, E. J., D'Agostino, R. Jr., Dolan, L., Imperatore, G., et al. (2017). Association of type 1 diabetes vs. type 2 diabetes diagnosed during childhood and adolescence with complications during teenage years and young adulthood. JAMA 317, 825–835. doi: 10.1001/jama.2017.0686
Du, M., Liu, J., Chen, Z., Huang, X., Li, J., Kuang, W., et al. (2014). Brain grey matter volume alterations in late-life depression. J. Psychiatry Neurosci. 39, 397–406. doi: 10.1503/jpn.130275
Ellison-Wright, I., Glahn, D. C., Laird, A. R., Thelen, S. M., and Bullmore, E. (2008). The anatomy of first-episode and chronic schizophrenia: an anatomical likelihood estimation meta-analysis. Am. J. Psychiatry 165, 1015–1023. doi: 10.1176/appi.ajp.2008.07101562
El-Mir, M. Y., Detaille, D., R-Villanueva, G., Delgado-Esteban, M., Guigas, B., Attia, S., et al. (2008). Neuroprotective role of antidiabetic drug metformin against apoptotic cell death in primary cortical neurons. J. Mol. Neurosci. 34, 77–87. doi: 10.1007/s12031-007-9002-1
Fang, F., Lai, M. Y., Huang, J. J., Kang, M., Ma, M. M., Li, K. A., et al. (2019). Compensatory hippocampal connectivity in young adults with early-stage type 2 diabetes. J. Clin. Endocrinol. Metab. 104, 3025–3038. doi: 10.1210/jc.2018-02319
Farr, S. A., Roesler, E., Niehoff, M. L., Roby, D. A., McKee, A., and Morley, J. E. (2019). Metformin improves learning and memory in the SAMP8 mouse model of Alzheimer's disease. J. Alzheimers Dis. 68, 1699–1710. doi: 10.3233/JAD-181240
Ferreira, F. S., Pereira, J. M. S., Reis, A., Sanches, M., Duarte, J. V., Gomes, L., et al. (2017). Early visual cortical structural changes in diabetic patients without diabetic retinopathy. Graefes. Arch. Clin. Exp. Ophthalmol. 255, 2113–2118. doi: 10.1007/s00417-017-3752-4
García-Casares, N., Berthier, M. L., Jorge, R. E., Gonzalez-Alegre, P., Gutiérrez Cardo, A., Rioja Villodres, J., et al. (2014). Structural and functional brain changes in middle-aged type 2 diabetic patients: a cross-sectional study. J. Alzheimers Dis. 40, 375–386. doi: 10.3233/JAD-131736
Gold, S. M., Dziobek, I., Sweat, V., Tirsi, A., Rogers, K., Bruehl, H., et al. (2007). Hippocampal damage and memory impairments as possible early brain complications of type 2 diabetes. Diabetologia 50, 711–719. doi: 10.1007/s00125-007-0602-7
Gregg, E. W., Yaffe, K., Cauley, J. A., Rolka, D. B., Blackwell, T. L., Narayan, K. M., et al. (2000). Is diabetes associated with cognitive impairment and cognitive decline among older women? Study of Osteoporotic Fractures Research Group. Arch. Intern. Med. 160, 174–180. doi: 10.1001/archinte.160.2.174
Gupta, A., Bisht, B., and Dey, C. S. (2011). Peripheral insulin-sensitizer drug metformin ameliorates neuronal insulin resistance and Alzheimer's-like changes. Neuropharmacology 60, 910–920. doi: 10.1016/j.neuropharm.2011.01.033
Gusnard, D. A., Akbudak, E., Shulman, G. L., and Raichle, M. E. (2001a). Medial prefrontal cortex and self-referential mental activity: relation to a default mode of brain function. Proc. Natl. Acad. Sci. U. S. A. 98, 4259–4264. doi: 10.1073/pnas.071043098
Gusnard, D. A., Raichle, M. E., and Raichle, M. E. (2001b). Searching for a baseline: functional imaging and the resting human brain. Nat. Rev. Neurosci. 2, 685–694. doi: 10.1038/35094500
Haldane, M., Cunningham, G., Androutsos, C., and Frangou, S. (2008). Structural brain correlates of response inhibition in Bipolar Disorder, I. J. Psychopharmacol. 22, 138–143. doi: 10.1177/0269881107082955
Hamed, S. A. (2017). Brain injury with diabetes mellitus: evidence, mechanisms and treatment implications. Expert. Rev. Clin. Pharmacol. 10, 409–428. doi: 10.1080/17512433.2017.1293521
Hansen, T., Ingason, A., Djurovic, S., Melle, I., Fenger, M., Gustafsson, O., et al. (2011). At-risk variant in TCF7L2 for type II diabetes increases risk of schizophrenia. Biol. Psychiatry 70, 59–63. doi: 10.1016/j.biopsych.2011.01.031
Hershey, T., Perantie, D. C., Wu, J., Weaver, P. M., Black, K. J., and White, N. H. (2010). Hippocampal volumes in youth with type 1 diabetes. Diabetes 59, 236–241. doi: 10.2337/db09-1117
Heyden, A., Ionescu, M. C., Romorini, S., Kracht, B., Ghiglieri, V., Calabresi, P., et al. (2011). Hippocampal enlargement in Bassoon-mutant mice is associated with enhanced neurogenesis, reduced apoptosis, and abnormal BDNF levels. Cell Tissue Res. 346, 11–26. doi: 10.1007/s00441-011-1233-3
Hoogenboom, W. S., Marder, T. J., Flores, V. L., Huisman, S., Eaton, H. P., Schneiderman, J. S., et al. (2014). Cerebral white matter integrity and resting-state functional connectivity in middle-aged patients with type 2 diabetes. Diabetes 63, 728–738. doi: 10.2337/db13-1219
Ishibashi, K., Sakurai, K., Shimoji, K., Tokumaru, A. M., and Ishii, K. (2018). Altered functional connectivity of the default mode network by glucose loading in young, healthy participants. BMC Neurosci. 19:33. doi: 10.1186/s12868-018-0433-0
Jiang, M. M., Zhou, Q., Liu, X. Y., Shi, C. Z., Chen, J., and Huang, X. H. (2017). Structural and functional brain changes in early- and mid-stage primary open-angle glaucoma using voxel-based morphometry and functional magnetic resonance imaging. Medicine 96:e6139. doi: 10.1097/MD.0000000000006139
Jimenez-Bonilla, J. F., Carril, J. M., Quirce, R., Gomez-Barquin, R., Amado, J. A., and Gutierrez-Mendiguchia, C. (1996). Assessment of cerebral blood flow in diabetic patients with no clinical history of neurological disease. Nucl. Med. Commun. 17, 790–794. doi: 10.1097/00006231-199609000-00009
Juvonen, H., Reunanen, A., Haukka, J., Muhonen, M., Suvisaari, J., Arajärvi, R., et al. (2007). Incidence of schizophrenia in a nationwide cohort of patients with type 1 diabetes mellitus. Arch. Gen. Psychiatry 64, 894–899. doi: 10.1001/archpsyc.64.8.894
Kanaya, A. M., Barrett-Connor, E., Gildengorin, G., and Yaffe, K. (2004). Change in cognitive function by glucose tolerance status in older adults: a 4-year prospective study of the Rancho Bernardo study cohort. Arch. Intern. Med. 164, 1327–1333. doi: 10.1001/archinte.164.12.1327
Kandilarova, S., Stoyanov, D., Sirakov, N., Maes, M., and Specht, K. (2019). Reduced grey matter volume in frontal and temporal areas in depression: contributions from voxel-based morphometry study. Acta Neuropsychiatr. 31, 252–257. doi: 10.1017/neu.2019.20
Karvani, M., Simos, P., Stavrakaki, S., and Kapoukranidou, D. (2019). Neurocognitive impairment in type 2 diabetes mellitus. Hormones 18, 523–534. doi: 10.1007/s42000-019-00128-2
Katon, W. J., Lin, E. H., Williams, L. H., Ciechanowski, P., Heckbert, S. R., Ludman, E., et al. (2010). Comorbid depression is associated with an increased risk of dementia diagnosis in patients with diabetes: a prospective cohort study. J. Gen. Intern. Med. 25, 423–429. doi: 10.1007/s11606-009-1248-6
Kaufmann, L., Pixner, S., Starke, M., Zotter, S., Köhle, J., Meraner, D., et al. (2012). Neurocognition and brain structure in pediatric patients with type 1 diabetes. J. Pediatr. Neuroradiol. 1, 25–35. doi: 10.3233/PNR-2012-005
Kim, M. J., Hamilton, J. P., and Gotlib, I. H. (2008). Reduced caudate gray matter volume in women with major depressive disorder. Psychiatry Res. 164, 114–122. doi: 10.1016/j.pscychresns.2007.12.020
Laird, A. R., Fox, P. M., Price, C. J., Glahn, D. C., Uecker, A. M., Lancaster, J. L., et al. (2005). ALE meta-analysis: controlling the false discovery rate and performing statistical contrasts. Hum. Brain Mapp. 25, 155–164. doi: 10.1002/hbm.20136
Leslie, R. D., Palmer, J., Schloot, N. C., and Lernmark, A. (2016). Diabetes at the crossroads: relevance of disease classification to pathophysiology and treatment. Diabetologia 59, 13–20. doi: 10.1007/s00125-015-3789-z
Leung, M., Cheung, C., Yu, K., Yip, B., Sham, P., Li, Q., et al. (2009). Gray matter in first-episode schizophrenia before and after antipsychotic drug treatment. Anatomical likelihood estimation meta-analyses with sample size weighting. Schizophr. Bull. 2009:sbp099. doi: 10.1093/schbul/sbp099
Liu, J., Liu, T., Wang, W., Ma, L., Ma, X., Shi, S., et al. (2017). Reduced gray matter volume in patients with type 2 diabetes mellitus. Front. Aging Neurosci. 9:161. doi: 10.3389/fnagi.2017.00161
Liu, K., Huang, X., Cui, S., Ye, X., Zhou, Y., Song, J., et al. (2019). Voxel-based morphometry reveals regional reductions of gray matter volume in school-aged children with short-term type 1 diabetes mellitus. Neuroreport 30, 516–521. doi: 10.1097/WNR.0000000000001238
Luk, A. O., Lau, E. S., So, W. Y., Ma, R. C., Kong, A. P., Ozaki, R., et al. (2014). Prospective study on the incidences of cardiovascular-renal complications in Chinese patients with young-onset type 1 and type 2 diabetes. Diabetes Care 37, 149–157. doi: 10.2337/dc13-1336
Ma, C., Ding, J., Li, J., Guo, W., Long, Z., Liu, F., et al. (2012). Resting-state functional connectivity bias of middle temporal gyrus and caudate with altered gray matter volume in major depression. PLoS ONE 7:e45263. doi: 10.1371/journal.pone.0045263
Mamakou, V., Thanopoulou, A., Gonidakis, F., Tentolouris, N., and Kontaxakis, V. (2018). Schizophrenia and type 2 diabetes mellitus. Psychiatriki 29, 64–73. doi: 10.22365/jpsych.2018.291.64
Marzelli, M. J., Mazaika, P. K., Barnea-Goraly, N., Hershey, T., Tsalikian, E., Tamborlane, W., et al. (2014). Neuroanatomical correlates of dysglycemia in young children with type 1 diabetes. Diabetes 63, 343–353. doi: 10.2337/db13-0179
McAlonan, G. M., Yu, K. K., Chan, R. C. K., Chua, S. E., and Cheung, C. (2011). Is there an anatomical endophenotype for neurodevelopmental disorders? A review of dual disorder anatomical likelihood estimation (ALE) meta-analyses of grey matter volumes. Chin. Sci. Bull. 56, 3376–3381. doi: 10.1007/s11434-011-4743-1
Mezuk, B., Eaton, W. W., Albrecht, S., and Golden, S. H. (2008). Depression and type 2 diabetes over the lifespan: a meta-analysis. Diabetes Care 31, 2383–2390. doi: 10.2337/dc08-0985
Moher, D., Liberati, A., Tetzlaff, J., Altman, D. G., and Group, P. (2009). Preferred reporting items for systematic reviews and meta-analyses: the PRISMA statement. BMJ 339:b2535. doi: 10.1136/bmj.b2535
Moran, C., Phan, T. G., Chen, J., Blizzard, L., Beare, R., Venn, A., et al. (2013). Brain atrophy in type 2 diabetes: regional distribution and influence on cognition. Diabetes Care 36, 4036–4042. doi: 10.2337/dc13-0143
Moulton, C. D., Costafreda, S. G., Horton, P., Ismail, K., and Fu, C. H. (2015). Meta-analyses of structural regional cerebral effects in type 1 and type 2 diabetes. Brain Imag. Behav. 9, 651–662. doi: 10.1007/s11682-014-9348-2
Musen, G., Lyoo, I. K., Sparks, C. R., Weinger, K., Hwang, J., Ryan, C. M., et al. (2006). Effects of type 1 diabetes on gray matter density as measured by voxel-based morphometry. Diabetes 55, 326–333. doi: 10.2337/diabetes.55.02.06.db05-0520
Nouwen, A., Chambers, A., Chechlacz, M., Higgs, S., Blissett, J., Barrett, T. G., et al. (2017). Microstructural abnormalities in white and gray matter in obese adolescents with and without type 2 diabetes. Neuroimage Clin. 16, 43–51. doi: 10.1016/j.nicl.2017.07.004
Nunley, K. A., Ryan, C. M., Aizenstein, H. J., Jennings, J. R., MacCloud, R. L., Orchard, T. J., et al. (2017). Regional gray matter volumes as related to psychomotor slowing in adults with type 1 diabetes. Psychosom. Med. 79, 533–540. doi: 10.1097/PSY.0000000000000449
Peng, J., Liu, J., Nie, B., Li, Y., Shan, B., Wang, G., et al. (2011). Cerebral and cerebellar gray matter reduction in first-episode patients with major depressive disorder: a voxel-based morphometry study. Eur. J. Radiol. 80, 395–399. doi: 10.1016/j.ejrad.2010.04.006
Perantie, D. C., Wu, J., Koller, J. M., Lim, A., Warren, S. L., Black, K. J., et al. (2007). Regional brain volume differences associated with hyperglycemia and severe hypoglycemia in youth with type 1 diabetes. Diabetes Care 30, 2331–2337. doi: 10.2337/dc07-0351
Redel, J. M., DiFrancesco, M., Vannest, J., Altaye, M., Beebe, D., Khoury, J., et al. (2018). Brain gray matter volume differences in obese youth with type 2 diabetes: a pilot study. J. Pediatr. Endocrinol. Metab. 31, 261–268. doi: 10.1515/jpem-2017-0349
Roy, T., and Lloyd, C. E. (2012). Epidemiology of depression and diabetes: a systematic review. J. Affect. Disord. 142(Suppl.), S8–S21. doi: 10.1016/S0165-0327(12)70004-6
Ryan, C. M., Geckle, M. O., and Orchard, T. J. (2003). Cognitive efficiency declines over time in adults with Type 1 diabetes: effects of micro- and macrovascular complications. Diabetologia 46, 940–948. doi: 10.1007/s00125-003-1128-2
Sadeghi, A., Hami, J., Razavi, S., Esfandiary, E., and Hejazi, Z. (2016). The effect of diabetes mellitus on apoptosis in hippocampus: cellular and molecular aspects. Int. J. Prev. Med. 7:57. doi: 10.4103/2008-7802.178531
Sarac, K., Akinci, A., Alkan, A., Aslan, M., Baysal, T., and Ozcan, C. (2005). Brain metabolite changes on proton magnetic resonance spectroscopy in children with poorly controlled type 1 diabetes mellitus. Neuroradiology 47, 562–565. doi: 10.1007/s00234-005-1387-3
Schulingkamp, R. J., Pagano, T. C., Hung, D., and Raffa, R. B. (2000). Insulin receptors and insulin action in the brain: review and clinical implications. Neurosci. Biobehav. Rev. 24, 855–872. doi: 10.1016/S0149-7634(00)00040-3
Shah, P. J., Glabus, M. F., Goodwin, G. M., and Ebmeier, K. P. (2002). Chronic, treatment-resistant depression and right fronto-striatal atrophy. Br. J. Psychiatry. 180, 434–440. doi: 10.1192/bjp.180.5.434
Shepherd, A. M., Matheson, S. L., Laurens, K. R., Carr, V. J., and Green, M. J. (2012). Systematic meta-analysis of insula volume in schizophrenia. Biol. Psychiatry 72, 775–784. doi: 10.1016/j.biopsych.2012.04.020
Sinha, S., Ekka, M., Sharma, U. P. R., Pandey, R. M., and Jagannathan, N. R. (2014). Assessment of changes in brain metabolites in Indian patients with type-2 diabetes mellitus using proton magnetic resonance spectroscopy. BMC Res. Notes 7:41. doi: 10.1186/1756-0500-7-41
Tamarai, K., Bhatti, J. S., and Reddy, P. H. (2019). Molecular and cellular bases of diabetes: focus on type 2 diabetes mouse model-TallyHo. Biochim. Biophys. Acta Mol. Basis Dis. 1865, 2276–2284. doi: 10.1016/j.bbadis.2019.05.004
Tomlinson, D. R., and Gardiner, N. J. (2008). Glucose neurotoxicity. Nat. Rev. Neurosci. 9, 36–45. doi: 10.1038/nrn2294
Turkeltaub, P. E., Eden, G. F., Jones, K. M., and Zeffiro, T. A. (2002). Meta-analysis of the functional neuroanatomy of single-word reading: method and validation. Neuroimage. 16, 765–780. doi: 10.1006/nimg.2002.1131
van den Berg, E., Reijmer, Y. D., de Bresser, J., Kessels, R. P., Kappelle, L. J., and Biessels, G. J. (2010). A 4 year follow-up study of cognitive functioning in patients with type 2 diabetes mellitus. Diabetologia 53, 58–65. doi: 10.1007/s00125-009-1571-9
Wang, C., Fu, K., Liu, H., Xing, F., and Zhang, S. (2014). Brain structural changes and their correlation with vascular disease in type 2 diabetes mellitus patients: a voxel-based morphometric study. Neural. Regen. Res. 9, 1548–1556. doi: 10.4103/1673-5374.139482
Wang, J., Fan, Y., Dong, Y., Ma, M., Dong, Y., Niu, Y., et al. (2018). Combining gray matter volume in the cuneus and the cuneus-prefrontal connectivity may predict early relapse in abstinent alcohol-dependent patients. PLoS ONE 13:e0196860. doi: 10.1371/journal.pone.0196860
Wang, Y. F., Kong, X., Lu, G. M., and Zhang, L. J. (2017). Diabetes mellitus is associated with more severe brain spontaneous activity impairment and gray matter loss in patients with cirrhosis. Sci. Rep. 7:7775. doi: 10.1038/s41598-017-08075-x
Wessels, A. M., Simsek, S., Remijnse, P. L., Veltman, D. J., Biessels, G. J., Barkhof, F., et al. (2006). Voxel-based morphometry demonstrates reduced grey matter density on brain MRI in patients with diabetic retinopathy. Diabetologia 49, 2474–2480. doi: 10.1007/s00125-006-0283-7
Xia, W., Chen, Y. C., and Ma, J. (2017). Resting-state brain anomalies in type 2 diabetes: a meta-analysis. Front. Aging Neurosci. 9:14. doi: 10.3389/fnagi.2017.00014
Yu, K., Cheung, C., Leung, M., Li, Q., Chua, S., and McAlonan, G. (2010). Are bipolar disorder and schizophrenia neuroanatomically distinct? An anatomical likelihood meta-analysis. Front. Hum. Neurosci. 2010:189. doi: 10.3389/fnhum.2010.00189
Zhang, D., Shi, L., Song, X., Shi, C., Sun, P., Lou, W., et al. (2019). Neuroimaging endophenotypes of type 2 diabetes mellitus: a discordant sibling pair study. Quant Imag. Med. Surg. 9, 1000–1013. doi: 10.21037/qims.2019.05.18
Zhang, Q. Q., Li, W. S., Liu, Z., Zhang, H. L., Ba, Y. G., and Zhang, R. X. (2020). Metformin therapy and cognitive dysfunction in patients with type 2 diabetes: a meta-analysis and systematic review. Medicine 99:e19378. doi: 10.1097/MD.0000000000019378
Zhang, Y., Zhang, X., Zhang, J., Liu, C., Yuan, Q., Yin, X., et al. (2014). Gray matter volume abnormalities in type 2 diabetes mellitus with and without mild cognitive impairment. Neurosci. Lett. 562, 1–6. doi: 10.1016/j.neulet.2014.01.006
Zhao, Y., Luo, C., Chen, J., Sun, Y., Pu, D., Lv, A., et al. (2018). High glucose-induced complement component 3 up-regulation via RAGE-p38MAPK-NF-kappaB signalling in astrocytes: in vivo and in vitro studies. J. Cell Mol. Med. 22, 6087–6098. doi: 10.1111/jcmm.13884
Zhou, Z., Zhu, Y., Liu, Y., and Yin, Y. (2019). Comprehensive transcriptomic analysis indicates brain regional specific alterations in type 2 diabetes. Aging 11, 6398–6421. doi: 10.18632/aging.102196
Keywords: anatomical likelihood estimation, diabetes mellitus, voxel-based morphometry, meta-analysis, systematic review
Citation: Yu KKK, Cheing GLY, Cheung C, Kranz GS and Cheung AK-K (2021) Gray Matter Abnormalities in Type 1 and Type 2 Diabetes: A Dual Disorder ALE Quantification. Front. Neurosci. 15:638861. doi: 10.3389/fnins.2021.638861
Received: 07 December 2020; Accepted: 07 May 2021;
Published: 07 June 2021.
Edited by:
Neil James MacLusky, University of Guelph, CanadaReviewed by:
Mikhail Votinov, Jülich Research Centre, GermanyCopyright © 2021 Yu, Cheing, Cheung, Kranz and Cheung. This is an open-access article distributed under the terms of the Creative Commons Attribution License (CC BY). The use, distribution or reproduction in other forums is permitted, provided the original author(s) and the copyright owner(s) are credited and that the original publication in this journal is cited, in accordance with accepted academic practice. No use, distribution or reproduction is permitted which does not comply with these terms.
*Correspondence: Georg S. Kranz, Z2Vvcmcua3JhbnpAcG9seXUuZWR1Lmhr
†These authors share first authorship
Disclaimer: All claims expressed in this article are solely those of the authors and do not necessarily represent those of their affiliated organizations, or those of the publisher, the editors and the reviewers. Any product that may be evaluated in this article or claim that may be made by its manufacturer is not guaranteed or endorsed by the publisher.
Research integrity at Frontiers
Learn more about the work of our research integrity team to safeguard the quality of each article we publish.