 Yu Han†
 Wen Wang
 Yang Yang
 Lin-Feng Yan
94% of researchers rate our articles as excellent or good
Learn more about the work of our research integrity team to safeguard the quality of each article we publish.
Find out more
ORIGINAL RESEARCH article
Front. Neurosci. , 21 February 2020
Sec. Brain Imaging Methods
Volume 14 - 2020 | https://doi.org/10.3389/fnins.2020.00144
This article is part of the Research Topic Advanced Imaging Methods in Neuroscience View all 37 articles
Background: To compare the efficacies of univariate and radiomics analyses of amide proton transfer weighted (APTW) imaging in predicting isocitrate dehydrogenase 1 (IDH1) mutation of grade II/III gliomas.
Methods: Fifty-nine grade II/III glioma patients with known IDH1 mutation status were prospectively included (IDH1 wild type, 16; IDH1 mutation, 43). A total of 1044 quantitative radiomics features were extracted from APTW images. The efficacies of univariate and radiomics analyses in predicting IDH1 mutation were compared. Feature values were compared between two groups with independent t-test and receiver operating characteristic (ROC) analysis was applied to evaluate the predicting efficacy of each feature. Cases were randomly assigned to either the training (n = 49) or test cohort (n = 10) for the radiomics analysis. Support vector machine with recursive feature elimination (SVM-RFE) was adopted to select the optimal feature subset. The adverse impact of the imbalance dataset in the training cohort was solved by synthetic minority oversampling technique (SMOTE). Subsequently, the performance of SVM model was assessed on both training and test cohort.
Results: As for univariate analysis, 18 features were significantly different between IDH1 wild-type and mutant groups (P < 0.05). Among these parameters, High Gray Level Run Emphasis All Direction offset 8 SD achieved the biggest area under the curve (AUC) (0.769) with the accuracy of 0.799. As for radiomics analysis, SVM model was established using 19 features selected with SVM-RFE. The AUC and accuracy for IDH1 mutation on training set were 0.892 and 0.952, while on the testing set were 0.7 and 0.84, respectively.
Conclusion: Radiomics strategy based on APT image features is potentially useful for preoperative estimating IDH1 mutation status.
World Health Organization (WHO) grade II/III gliomas include a heterogeneous group of infiltrative neoplasms with astrocytic and oligodendroglia morphology (Louis et al., 2016). Much interest has been focused on histologic class over the past several decades (Daumas-Duport et al., 1988; Fuller and Scheithauer, 2007). However, highly variable clinical behaviors are not adequately predicted based on the histologic phenotype (van den Bent, 2010; Reuss et al., 2015). Therefore, revealing the specific molecular hallmarks has the potential to reduce bias and improve diagnosis as well as prognosis. Notably, in the 2016 WHO classification of central nervous system (CNS) tumors, grade II/III astrocytomas are molecularly divided into IDH mutant, IDH wild-type, and not otherwise specified categories, emphasizing the diagnostic and prognostic value of IDH mutation status in glioma (Louis et al., 2016).
IDHs are critical enzymes that catalyze the oxidative decarboxylation of isocitrate to α-ketoglutarate (α-KG) (Yan et al., 2009). IDH mutations occur in up to 75% of WHO grade II/III gliomas, but are rarely found in primary glioblastomas (Hartmann et al., 2009; Yang et al., 2012). Patients with IDH mutation were more sensitive to chemoradiation therapy and survived longer than IDH wild-type ones (Sanson et al., 2009; van den Bent et al., 2010). Moreover, IDH mutation would help stratify grade II/III gliomas into subgroups with distinct prognostic characteristics, therapeutic response, and clinical management (Rohle et al., 2013; Olar et al., 2015; Reuss et al., 2015; Jiang T. et al., 2016).
Currently, IDH mutation is determined by immunohistochemical staining and DNA sequencing, both are invasive methods with major limitations associated with inherent sampling bias or inability to predict the patient prognosis before surgical resection (Agarwal et al., 2013). As a non-invasive diagnostic tool, magnetic resonance imaging (MRI) technique plays an important role in determining IDH mutation. Although promising, the results of most previous experimental studies are conflicting (Arita et al., 2018; Suh et al., 2018), which has hampered consistent clinical application. Notably, identification of 2-hydroxyglutarate (2HG), the metabolite of mutated IDH, with MR spectroscopy (MRS) is suggested to be an optimal strategy in identifying IDH mutation (Andronesi et al., 2012; Choi et al., 2012; Pope et al., 2012). However, this technique requires a large tumor volume (de la Fuente et al., 2016) and is time-consuming, which limits its application. In addition, partial volume effects between different tumor regions may obscure the identification of 2-HG in smaller regions.
Because widespread disturbances of cellular metabolism occur after IDH mutation, including alteration of amino acid concentrations and enzymatic activity (Reitman et al., 2011), and global downregulation of protein expression (Doll et al., 2017). Therefore, more specific imaging modalities are urgently needed to identify IDH mutation. Amide proton transfer weighted (APTW) imaging is a promising molecular MR imaging technique developed to non-invasively quantify endogenous proteins and peptides (Zhou et al., 2003). For gliomas, APTW imaging was consistently demonstrating potential for grading (Togao et al., 2014), differential diagnosis (Jiang S. et al., 2016; Yu et al., 2017), and treatment response assessment (Sagiyama et al., 2014). Although APTW imaging has been used in a study (Jiang et al., 2017) to predict IDH mutation and encouraging results has been obtained, only univariate analysis was focused on histogram and conventional parameters such as the mean, minimal, or maximal values extracted from manually drawn region of interest (ROI). Higher-dimensional quantitative features from APTW images were not fully utilized.
Recently, radiomics analysis has drawn attention (Gillies et al., 2016; Kotrotsou et al., 2016). A large amount of quantitative high-dimensional features can be extracted, processed and analyzed to discover their associations with underlying pathology and genomics. Currently, radiomics approach based on other advanced MRI techniques are promising in predicting glioma genotype (Li et al., 2018; Shofty et al., 2018) and patient survival (Prasanna et al., 2017). However, radiomics analysis based on APTW images in predicting IDH mutation has not been reported yet.
Based on these observations, the purpose of this study was to explore whether radiomics analysis of APTW images could acquire a higher efficacy than commonly used univariate analysis in predicting IDH mutation of grade II/III gliomas.
This prospective single institution study has been approved by the Ethics Committee of Tangdu Hospital (TDLL-20151013) and was also registered to ClinicalTrials.gov (NCT03102112).1 From June 2016 to October 2017, a total of 429 consecutive patients with suspected gliomas underwent the MRI scanning.
Inclusion criteria were: (1) receiving no corticosteroid, surgery or any conservative treatment before MRI scan; (2) pathologically confirmed grade II/III gliomas based on the 2016 WHO classification; (3) underwent near total or gross total resection. Eighty-one patients were enrolled in this study. Among them, 22 patients were excluded for the following reasons: (1) without APTW image (n = 8); (2) the image quality was unsatisfying with susceptibility or motion artifacts (n = 10); (3) without IDH information (n = 4). Finally, 59 patients were enrolled. The process flow diagram is shown in Figure 1.
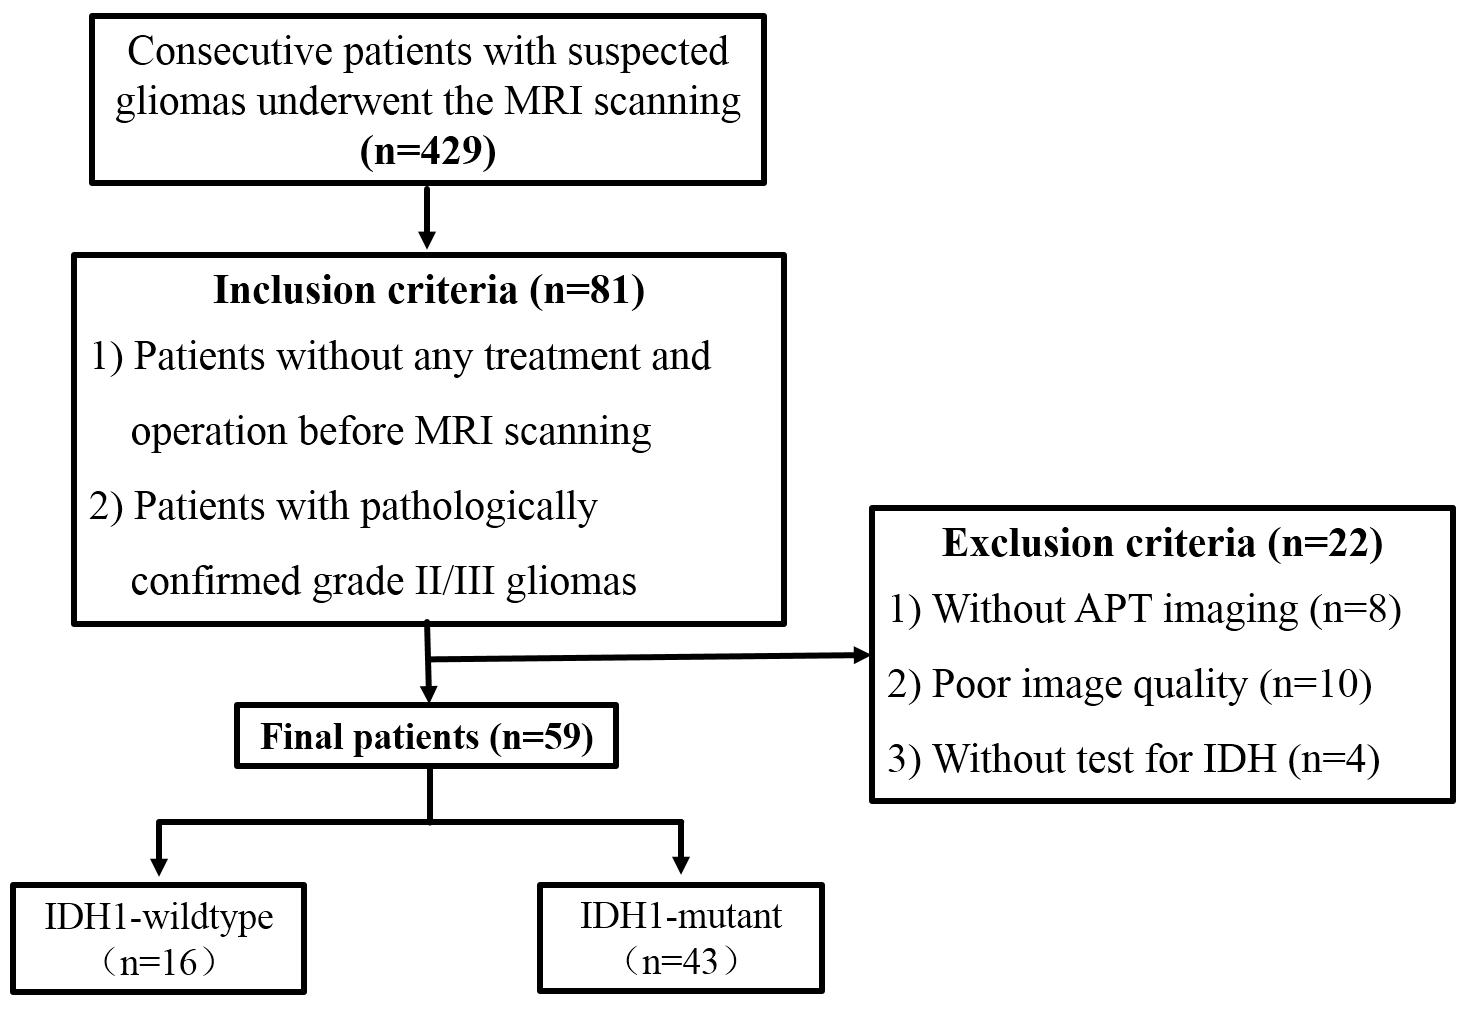
Figure 1. Flow diagram for patient selection.
The whole brain MRI examinations were performed on a 3T MRI system (Discovery MR750, General Electric Medical System, Milwaukee, WI, United States) with an eight-channel head coil (GE Medical System). Conventional MRI, contrast-enhanced MRI, and APTW imaging were implemented during the examination.
Conventional MRI scanning included four sequences. (1) axial T1-weighted spin-echo image (T1WI): repetition time/echo time (TR/TE), 1750 ms/24 ms; matrix size, 256 × 256; field of view (FOV), 24 cm × 24 cm; number of excitation, 1; slice thickness, 5 mm; gap, 1.5 mm. (2) T2-weighted spin-echo image (T2WI): TR/TE, 4247 ms/93 ms; matrix size, 512 × 512; FOV, 24 cm × 24 cm; number of excitation, 1; slice thickness, 5 mm; gap, 1.5 mm. (3) sagittal T2WI: TR/TE, 4338 ms/96 ms; matrix size, 384 × 384; FOV, 24 cm × 24 cm; number of excitation, 2; slice thickness, 5 mm; gap, 1.0 mm. (4) axial fluid-attenuated inversion recovery (FLAIR): TR/TE, 8000 ms/165 ms; matrix size, 256 × 256; FOV, 24 cm × 24 cm; number of excitation, 1; slice thickness, 5 mm; gap, 1.5 mm.
Amide proton transfer weighted imaging was performed prior to the injection of contrast agents. Single-section transverse APTW image at the maximum area of the tumor was obtained with a single-shot echo planar imaging (EPI) sequence using the following parameters: TR/TE, 3000 ms/22.6 ms; matrix size, 128 × 128; FOV, 24 cm × 24 cm; section thickness, 8 mm. Saturation scheme included a total of 4 saturation pulses placed before the EPI readout. The parameters for saturation scheme were as the follows: Fermi-shape saturation pulse width is 500 ms, pulse amplitude 2.0 μT, saturation frequencies include 49 frequency points as well as 3 S0 (without saturation pulses). The frequency points were 0, ±25, ±50, ±75, ±100, ±125, ±150, ±175, ±200, ±225, ±250, ±275, ±300, ±325, ±350, ±375, ±400, ±425, ±450, ±475, ±500, ±525, ±550, ±575, ±600 Hz. B0 filed map demonstrating the local field shift in Hz was generated from APTw images at the frequency between 275 and −275 Hz.
Finally, contrast-enhanced T1WI sequence was acquired in the transverse, sagittal, and coronal planes after intravenous administration of 0.1 mmol/kg gadodiamide (Omniscan; GE Healthcare, Co., Cork, Ireland).
After MRI acquisition, all raw data of APTW images were transferred to the workstation (Advantage Workstation 4.6; GE Medical Systems) to generate the B0 map and B0 corrected magnetization transfer ratio asymmetry (MTRasym) at 3.5 ppm parametric maps (Part 1 of Figure 2). The APT effect was quantified using MTRasym at 3.5 ppm with respect to the water resonance using the following formula:
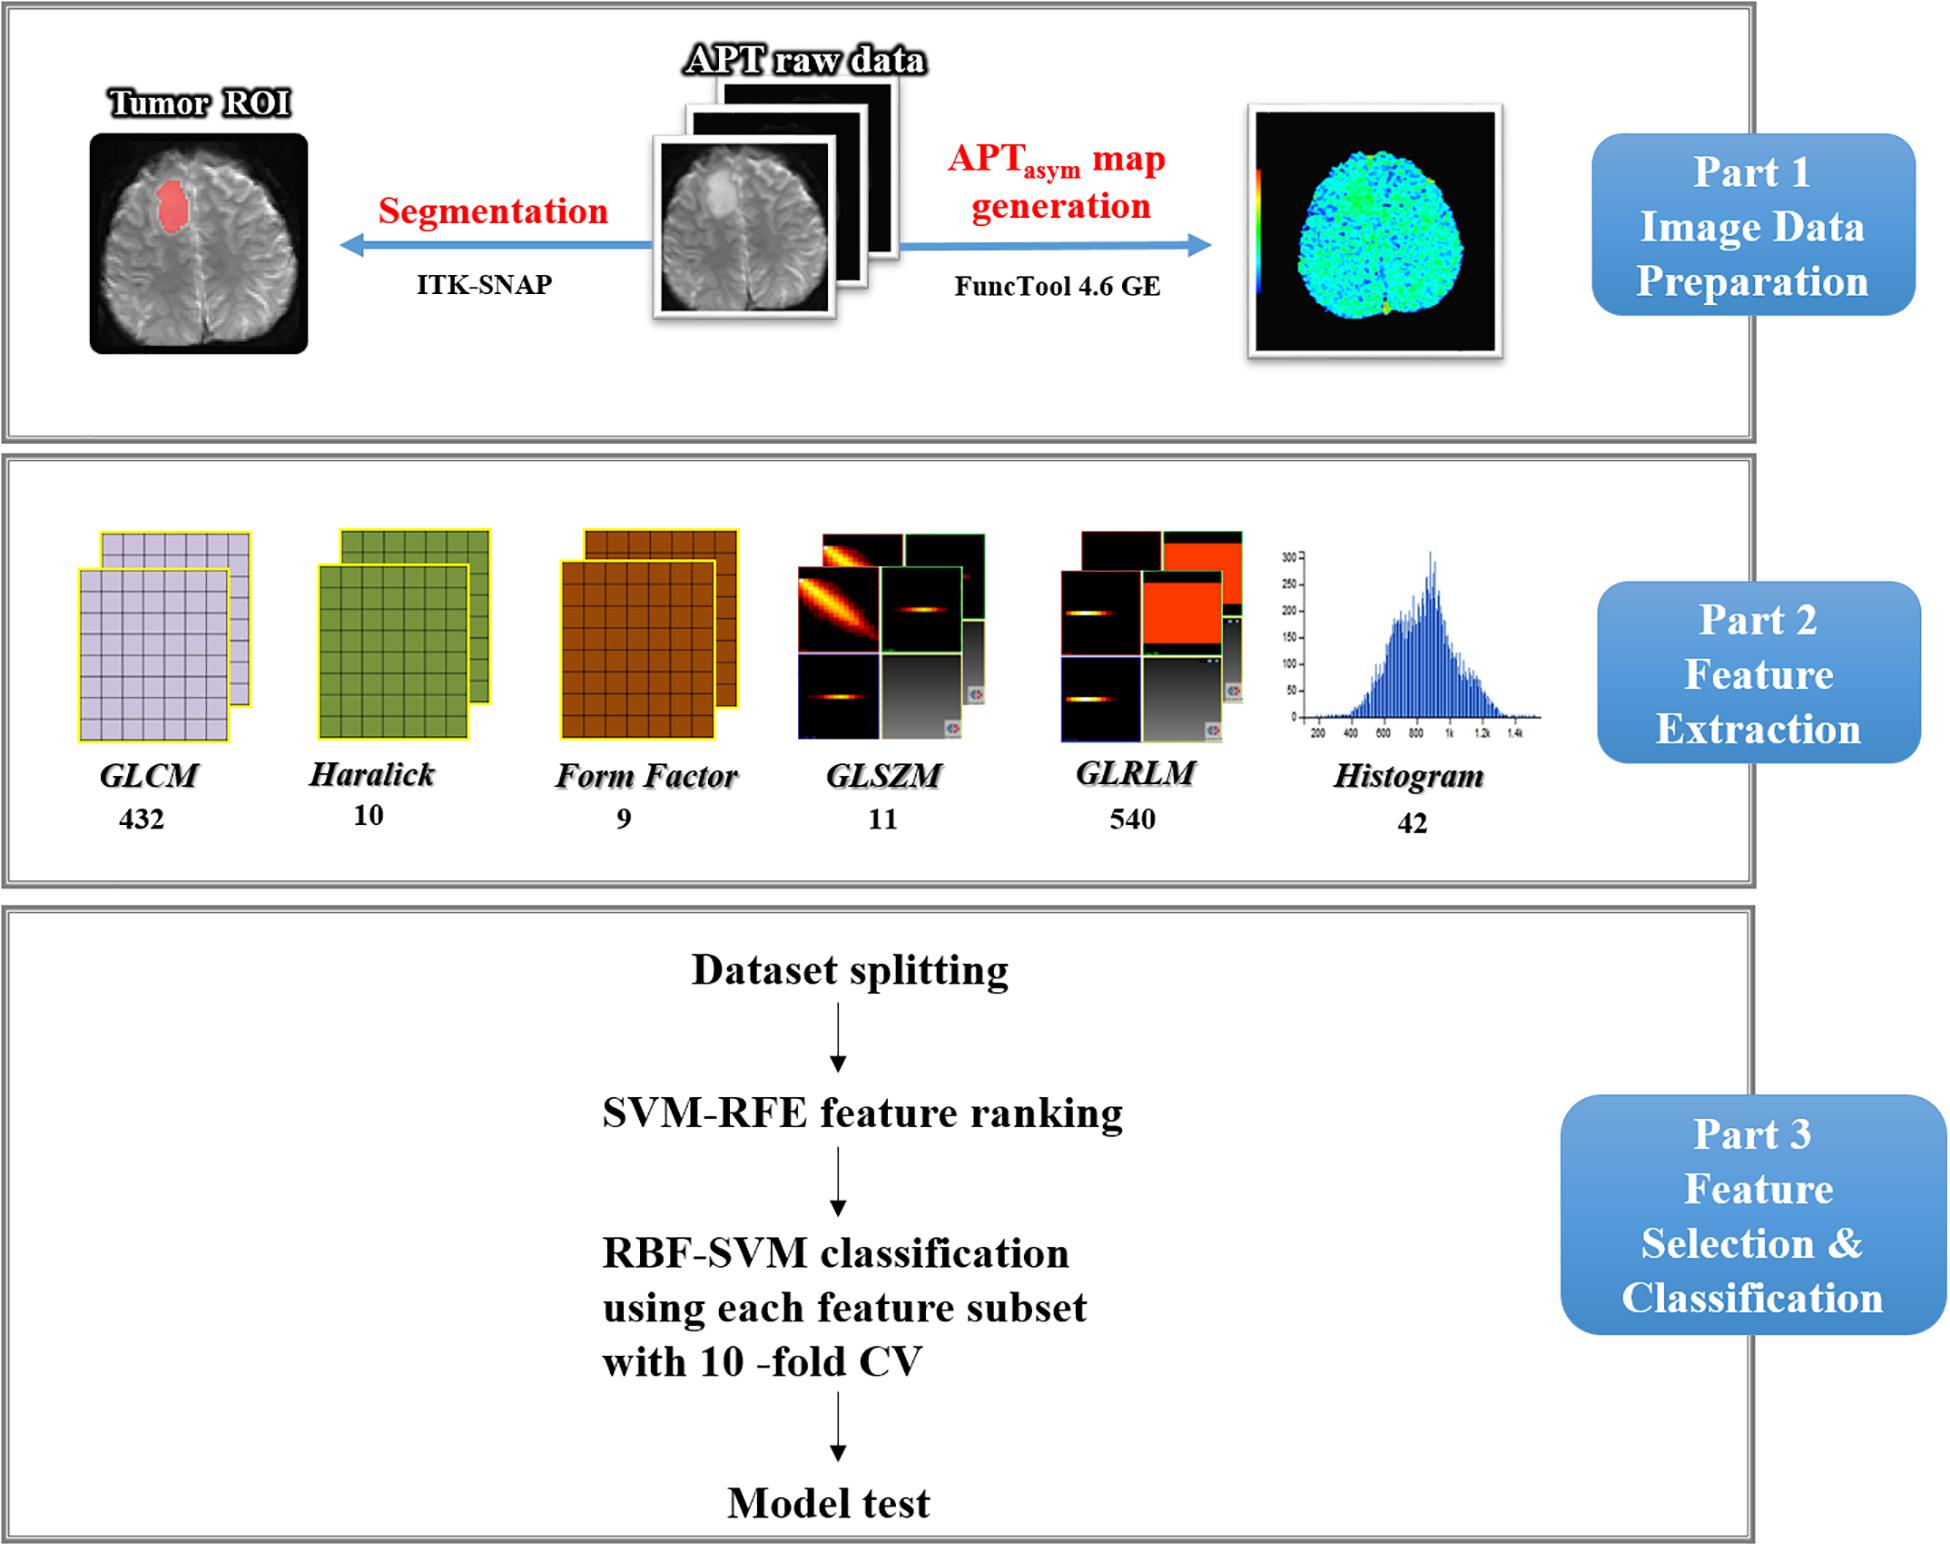
Figure 2. Study flow chart. First, APTasym map was generated from APT raw data and ROI segmentation was done. Second, six types of texture features within ROIs were extracted by using Analysis-Kinetics software, including the histogram, form, GLCM, GLRLM, GLSZM, and Haralick features. At last, automatic glioma IDH1 mutation classification using RBF-SVM combined with SVM-RFE feature selection and 10-fold cross-validation were carried out. Finally, model was tested by the pre-reserved test data.
All images were anonymized and stored in DICOM format. Two experienced neuroradiologists (L-FY and GX who have 7 and 5 years of experience, respectively, in neuro-oncology imaging) reviewed the conventional plain and contrast-enhanced MR images carefully to determine the margin of tumor. The APT raw data were imported into the ITK-SNAP software (version 3.6.0)2 and the S0 map of APT raw data were identified. The contour line of the ROI was drawn manually based on S0 map while attempting to maintain an approximate distance of 2–3 mm from the tumor margin to minimize the partial volume effect. As shown in Figure 3, two-dimensional ROI including tumor, possible edema, cystic degeneration and necrosis was acquired for each patient.
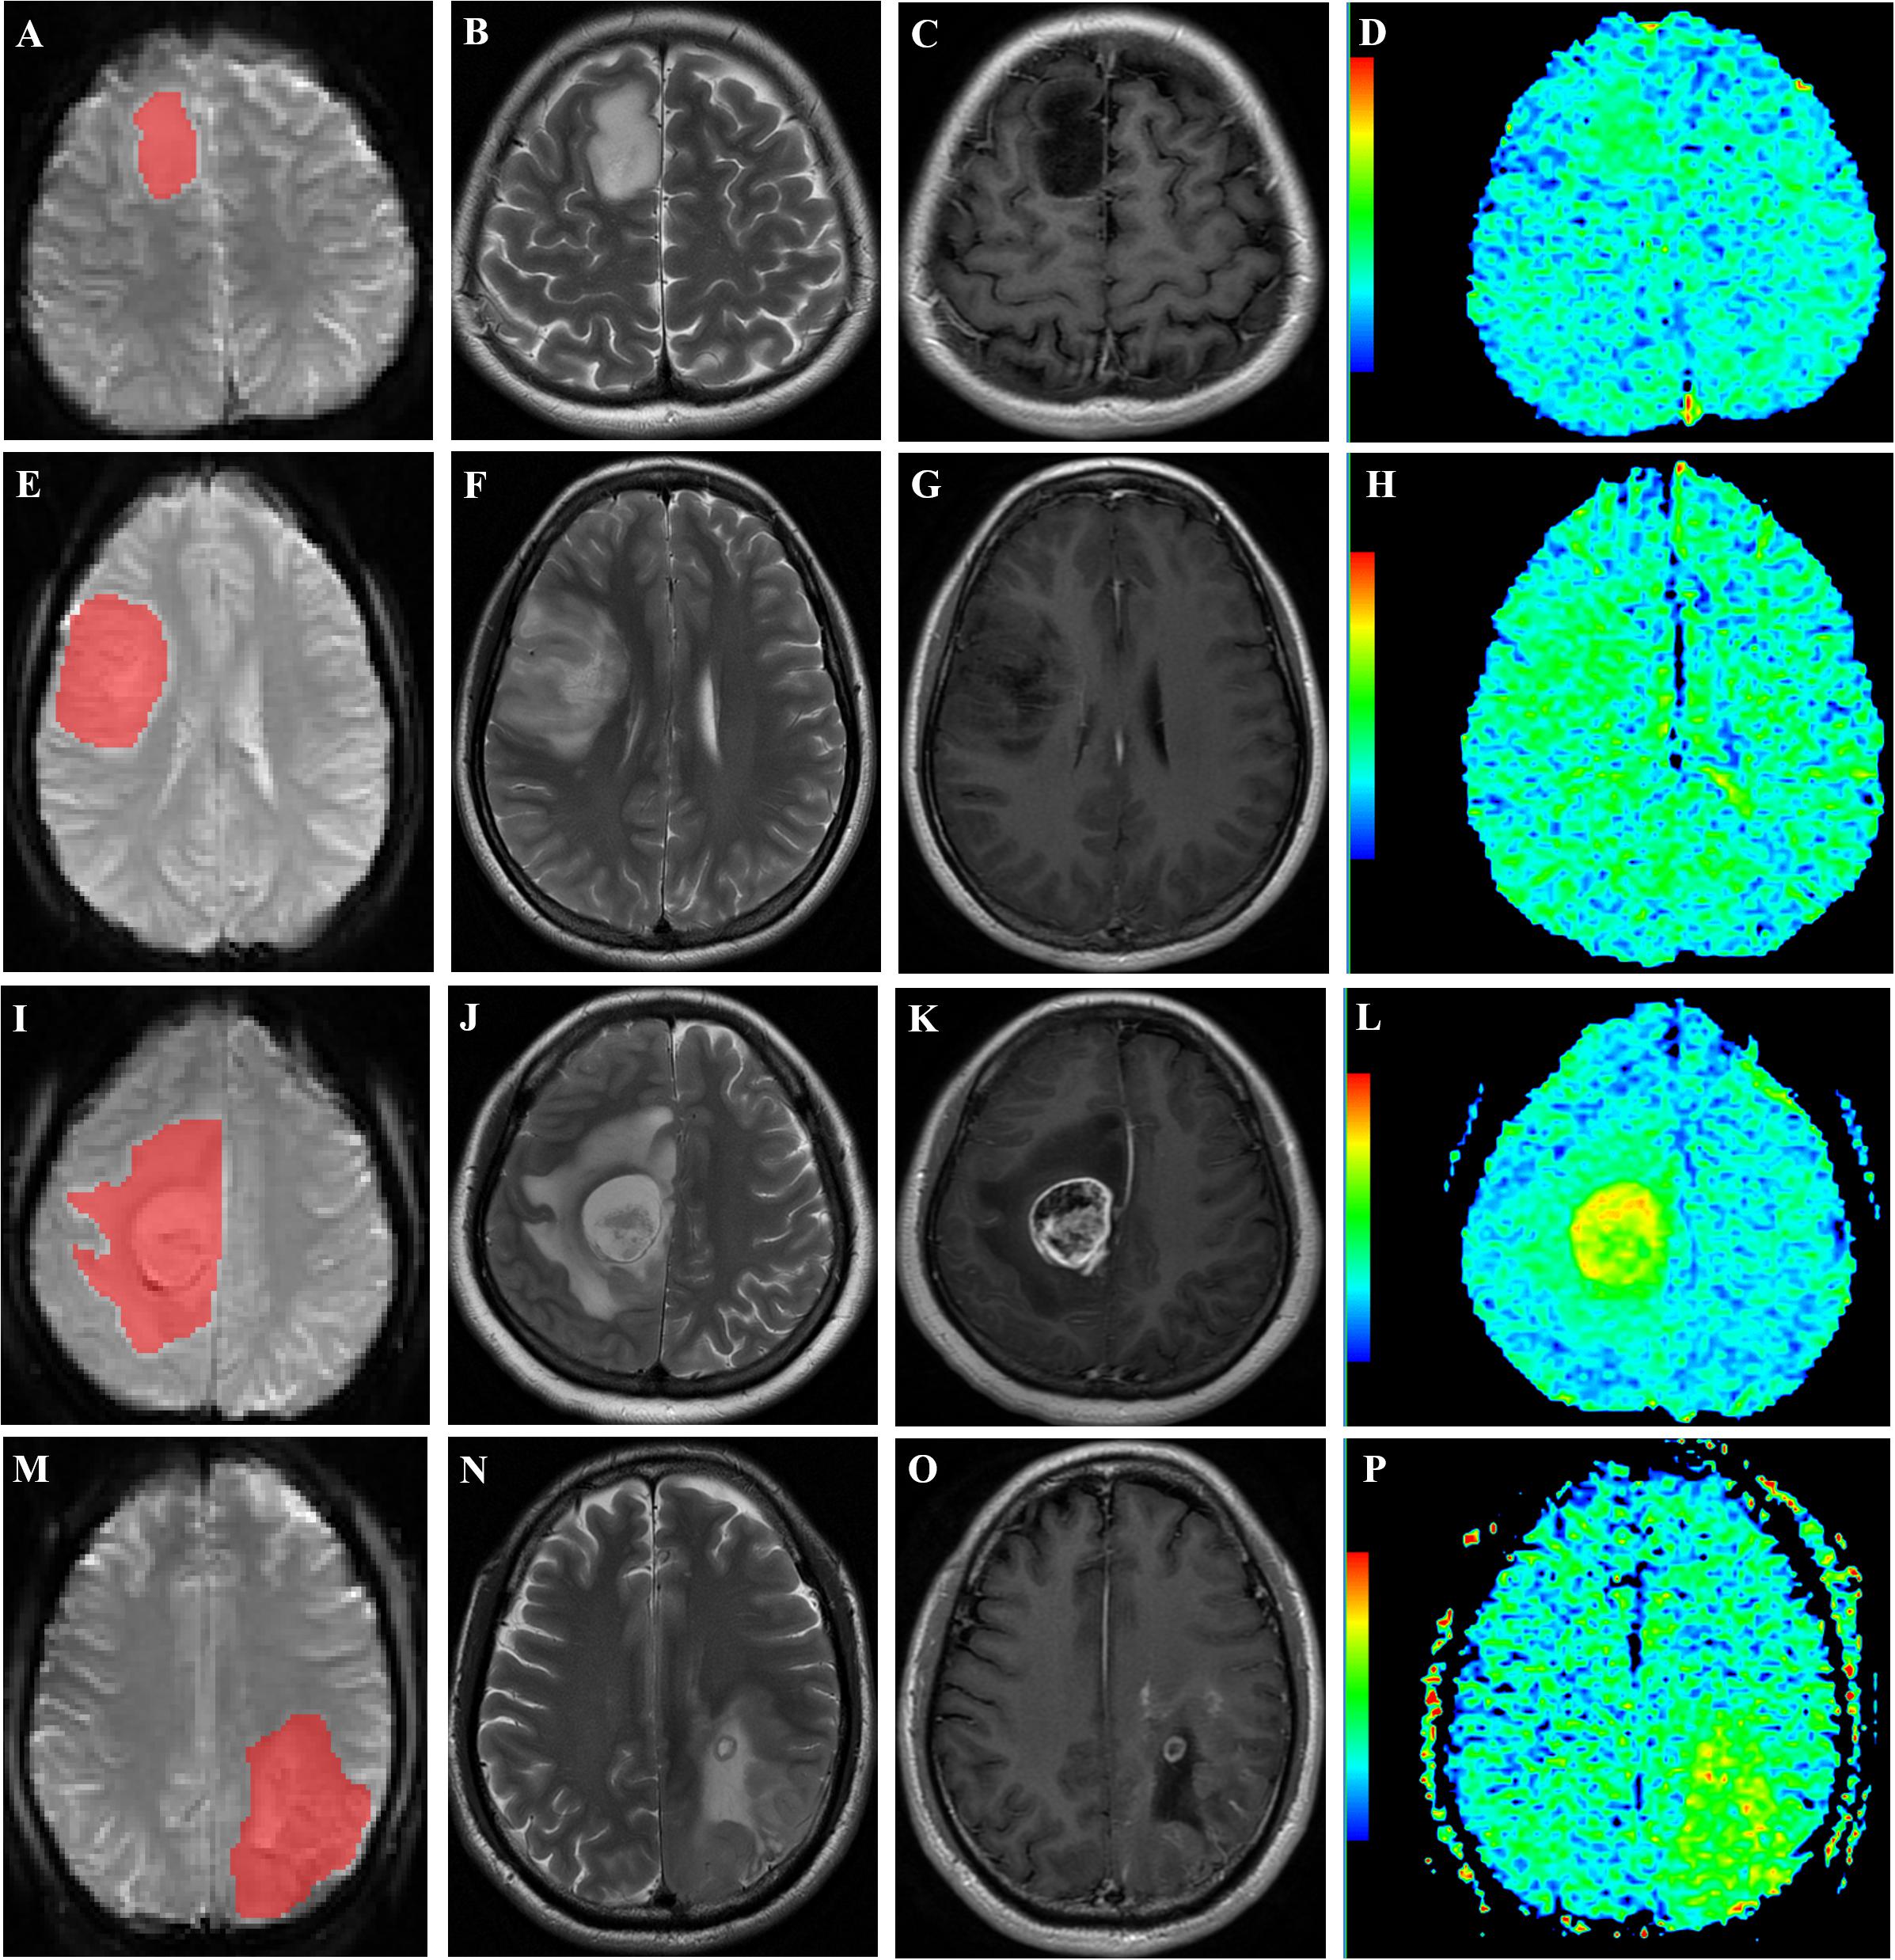
Figure 3. Representative cases. (A–D): a 36-year-old woman with WHO grade II diffuse astrocytoma with IDH1 mutation in the right frontal lobe. ROI selection is based on S0 map of APT raw data (A). The lesion shows hyperintensity on axial T2WI (B) and no enhancement on postcontrast T1WI (C). The APTW image (D) exhibits increased signal intensity in the lesion. E–H: a 31-year-old woman with WHO grade II diffuse astrocytoma with IDH1 wild type in the right frontal lobe. ROI selection is based on S0 map of APT raw data (E). The lesion shows heterogeneous hyperintensity on axial T2WI (F) and no enhancement on postcontrast T1WI (G). The APTW image (H) exhibits increased signal intensity in the lesion. I–L: a 31-year-old woman with anaplastic astrocytoma with IDH1 mutation in the right frontal lobe. ROI selection is based on S0 map of APT raw data (I). The tumor and peritumoral edema shows hyperintensity on axial T2WI (J) and heterogeneous enhancement of tumor on postcontrast T1WI (K). The APTw image (L) exhibits increased signal intensity in the tumor and peritumoral edema. (M–P): a 45-year-old man with anaplastic oligodendroglioma with IDH1 wild type in the left parietal lobe. ROI selection is based on S0 map of APT raw data (M). The tumor shows heterogeneous hyperintensity on axial T2WI (N) and ring-like and strip-like enhancement within tumor on postcontrast T1WI (O). The APTw image (P) exhibits increased signal intensity in the tumor.
As depicted in Part 2 of Figure 2, using a non-commercial Analysis-Kit software (GE Healthcare, China), the method of quantitative feature extraction was conducted on MTRasym (3.5 ppm) parametric maps. Forty-two first-order histogram, 983 s-order texture [432 gray level co-occurrence matrix (GLCM), 540 gray level run length matrix (GLRLM), and 11 gray level size zone matrix (GLSZM)], 9 form and 10 Haralick features were extracted from MTRasym (3.5 ppm) parametric maps. Thus, a total of 1044 quantitative features were obtained from the original images. Details regarding the quantitative features extracted in this study are presented in Supplementary Appendix S1.
As all the extracted data depend on the ROIs delineated by radiologists, the robustness of all the features was evaluated by both test-retest analysis and inter-rater analysis. For test-retest analysis, ROIs for each patient were segmented twice by one rater based on 20 randomly selected patients. Another 20 randomly selected patients were independently segmented by two raters for interrater analysis. The features extracted from these ROIs were assessed using the intraclass correlation coefficient (ICC).
As shown in Part 3 of Figure 2, the classification procedure included data grouping, data augmentation, feature selection, model building and model testing. First, the majority of patients’ data from each group were randomly selected to train the model, i.e., 11 IDH1 wild type and 38 IDH1 mutation. To solve the potential impact of the imbalance dataset in the training cohort, a synthetic minority oversampling technique (SMOTE) was applied to solve this issue and its merit has also been confirmed in our previous study (Zhang et al., 2017). In this study, the number of IDH1 wild-type patients in training data were augmented to that of IDH1 mutation, i.e., 0.38. The synthetic cases would have features with values similar to the existing cases and were not merely replications, thus improving the representation of the minority group in the dataset. The data of five patients in each group were left out for testing without applying SMOTE.
Highly correlated or less effective features may lead to the overfitting issue as well as increase the computing burden. Thus, SVM-based recursive feature elimination (SVM-RFE) algorithm was applied to select the most effective features in the training set to prevent overfitting and improve model generalization. It is able to rank the features according to their weight during N times iterations (N is the total number of extracted features). At each iteration, the feature with the minimal weight was eliminated, leading the feature ranking from the most to the least important one. Then, N feature subsets were established by selecting the first n features from the ranked sequence (1 ≤ n ≤ N). To compare the performance of different feature subsets, each subset was input into SVM with radial basis function (RBF) kernel and tested with 10-fold cross-validation.
All the classifications were performed using Waikato Environment for Knowledge Analysis (WEKA, version 3.8.2). SVM constructs a hyperplane that provides the optimal separation boundary to maximize the separation of the objects in a high-dimensional space, and this approach is widely used because of its stability and favorable performance. In this feature space, a decision surface is created with different subspaces. Each subspace corresponds to one class of training data. Once the training is completed, the test data are mapped to the feature space. A class is then assigned to those data depending on which subspace they are mapped to. Before that, each feature was normalized into the range from 0 to 1. A RBF kernel maps the original data with the kernel function as K(x) = exp(gx−t2), where x and t are two feature vectors, and gamma (g) controls the shape of the decision hyperplane. Loss function assesses the degree of inconsistency between the predicted and real values. The parameter g in the kernel function and epsilon in loss function were set to 1/3 (default value, 1/max_index) and 0.1, respectively. Probability estimation and shrinking heuristics were applied. The optimal feature subset would be got according to the classification performance. Then, the test data were put into the model built by using the optimal feature subset to test the performance of the final model.
The classification accuracy and AUC were measured in both training and test cohorts to evaluate the predictive efficiency of the radiomics model.
Resected tumor tissues were processed using standard clinical techniques. IDH1 R132H analysis was confirmed by immunohistochemistry and DNA sequencing as previously described (Yip et al., 2012; Agarwal et al., 2013). Paraffin sections of the intracranial tumor specimens were stained with IDH1 R132H mutation-specific antibodies (1:50; H09 clone, Dianova). The IDH forward primer (5′-ACC AAA TGG CAC CAT ACG A-3′) and reverse primer (5′-GCA AAATCA CAT TAT TGC CAA C-3′) were designed to amplify exon 4 (codon R132) of the IDH gene.
All statistical analyses were performed by using SPSS 20.0 software (IBM Corp, Chicago, IL, United States), WEKA software (WEKA version 3.8.2), and R software (version 3.3.2). All the extracted features in our study were assessed using ICC for both test-retest and inter-rater analyses. According to a previous study (Gevaert et al., 2014), features with ICC ≥0.6 were considered as robust against intra- and inter-rater uncertainties. The normal distribution of data was investigated with Kolmogorov-Smirnov (K-S) test. The between-group comparisons of quantitative data (age and quantitative features), categorical data (gender, cortical involvement, midline cross and location) were analyzed using independent sample t-test and chi-square test. Receiver operating characteristic (ROC) curve analysis was performed to determine the performance of single feature or radiomics model, and accuracy and area under the curve (AUC) were obtained. P < 0.05 indicated a significant difference.
Among 59 patients enrolled in this study, 16 were IDH1 wild-type (male, 11; female, 5; age range, 3–76 years), and the remained 43 were IDH1 mutant (male, 25; female, 18; age range, 17–67 years). Age and radiomics features were normally distributed. Statistical results were summarized in Table 1. There were no significant differences in age, gender, midline cross and multi-lobe involvement between the two groups (P > 0.05), whereas IDH1 mutant gliomas were mostly located in the frontal lobe and involving the cortex (P < 0.05).
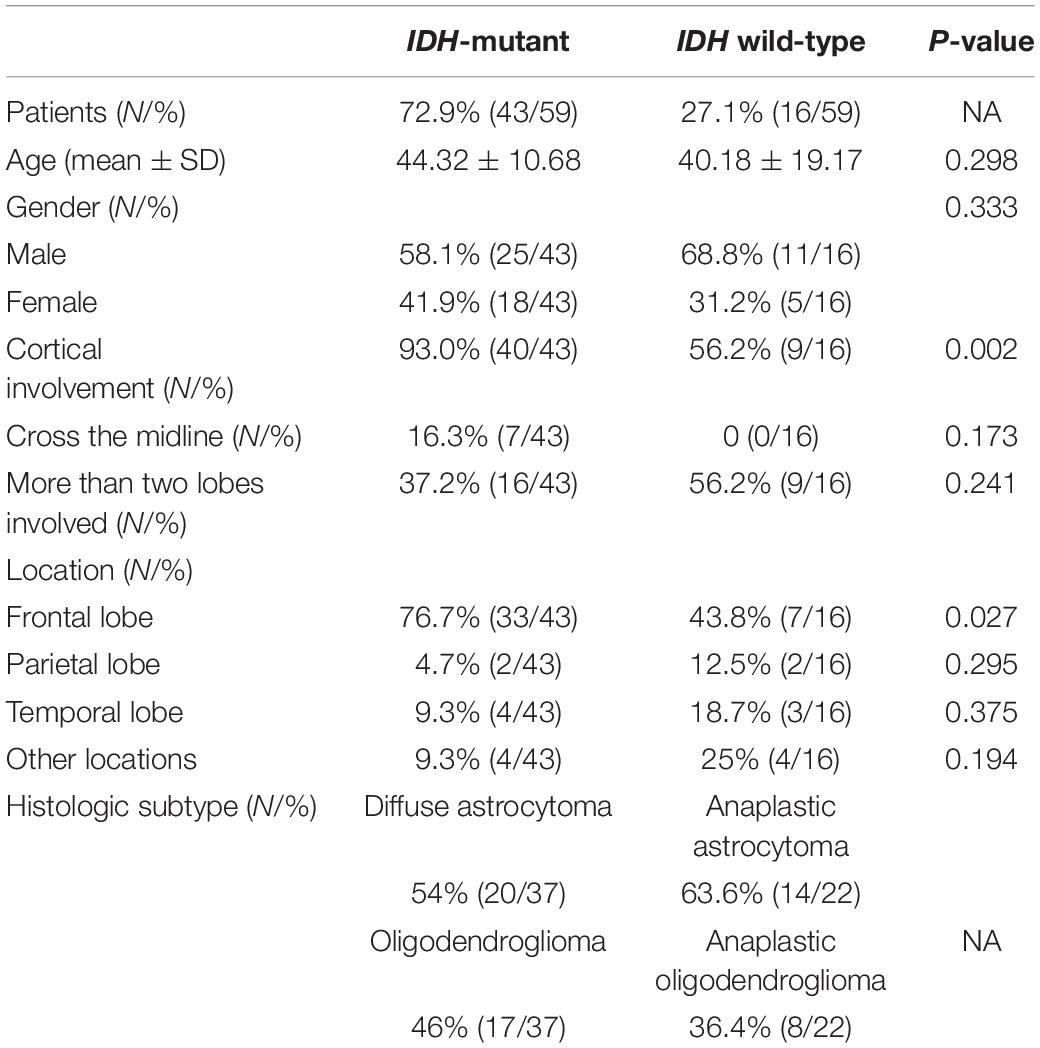
Table 1. Baseline demographics and clinical characteristics of patients.
Among 1044 radiomics features, the ICCs of 1038 features for both test-retest analysis (0.823-1) and interrater analysis (0.712-1) were greater than 0.6, thus were robust for further analysis.
Significant differences were observed in 18 out of 1038 extracted quantitative features between the IDH1 wild-type and mutant groups, including 8 first-order histograms, 6 GLCM and 4 GLRLM. The accuracies and AUC of these features were shown in Table 2. Among 18 features, High Gray Level Run Emphasis All Direction offset 8 SD achieved the highest AUC [0.769, 95% confidence interval (CI) 0.641–0.869] with the accuracy of 0.799.
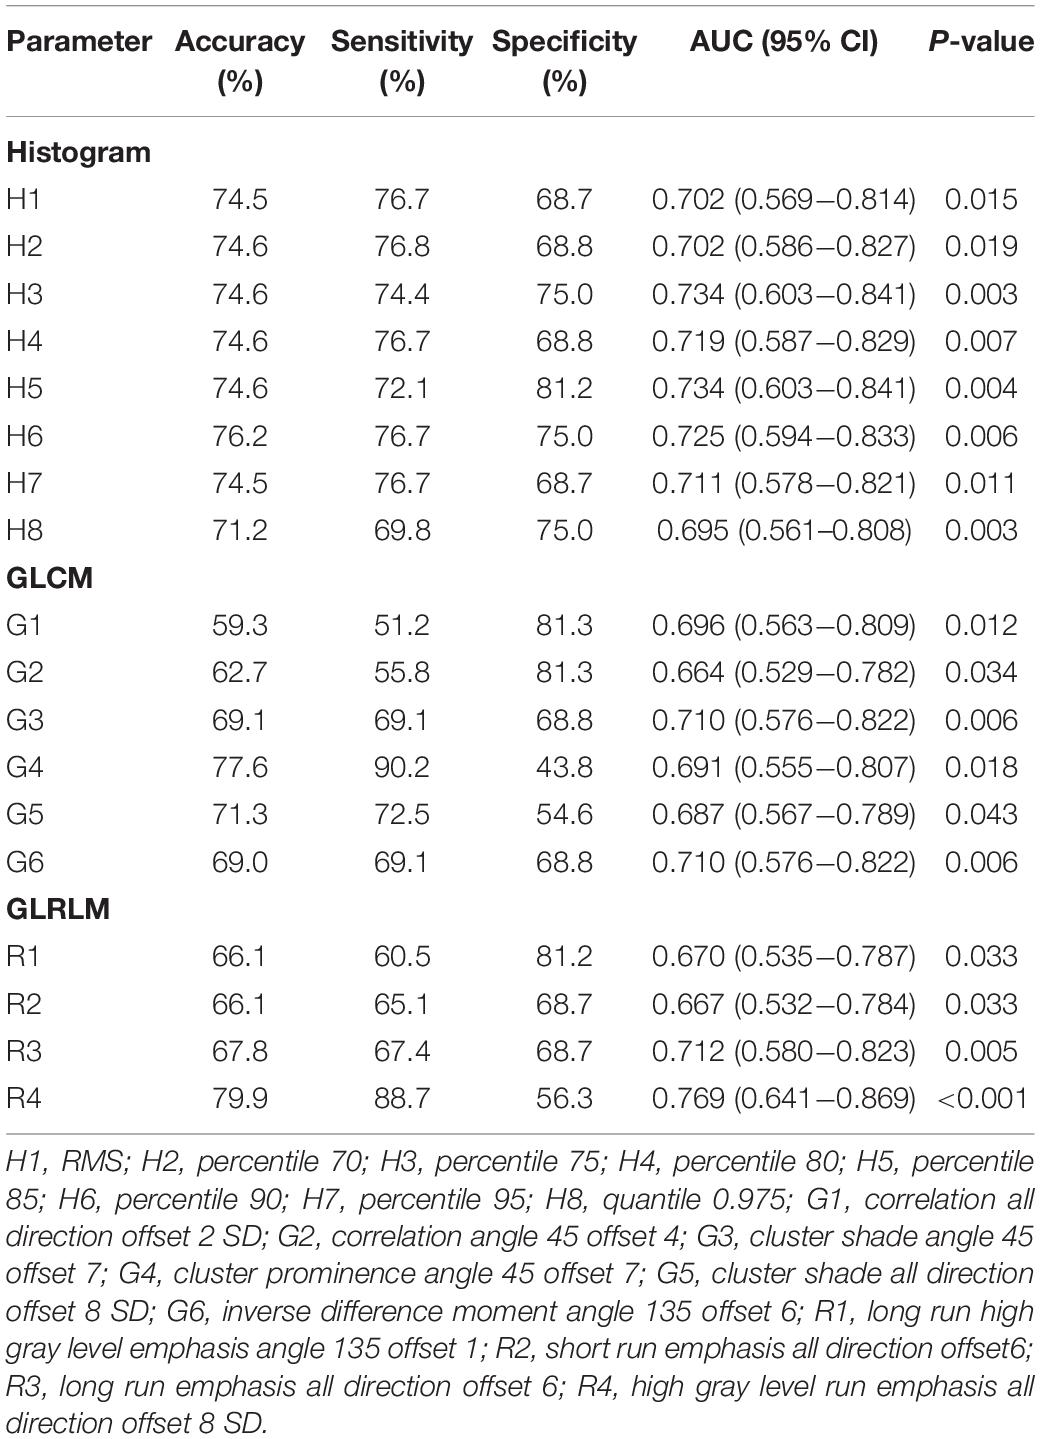
Table 2. Diagnostic performance of univariate analyses in predicting IDH1 mutation.
Based on the IDH1 mutation status, 1038 robust features extracted from APTW images were employed to construct the machine-learning model. Nineteen features were selected to be the optimal feature subset for IDH1 mutation prediction using SVM-RFE. Figure 4 illustrates the feature selection process. With the participation of new twenty ranked features sequentially, the overall tendencies of classification accuracy first declined and gradually increased. The peak of curve was achieved by using the top-20 feature subset. For the top-20 features, classification accuracy was evaluated again with inclusion of each ranked feature one by one. The best performance was achieved by using the top-19 feature subset, which was determined as the optimal feature subset.
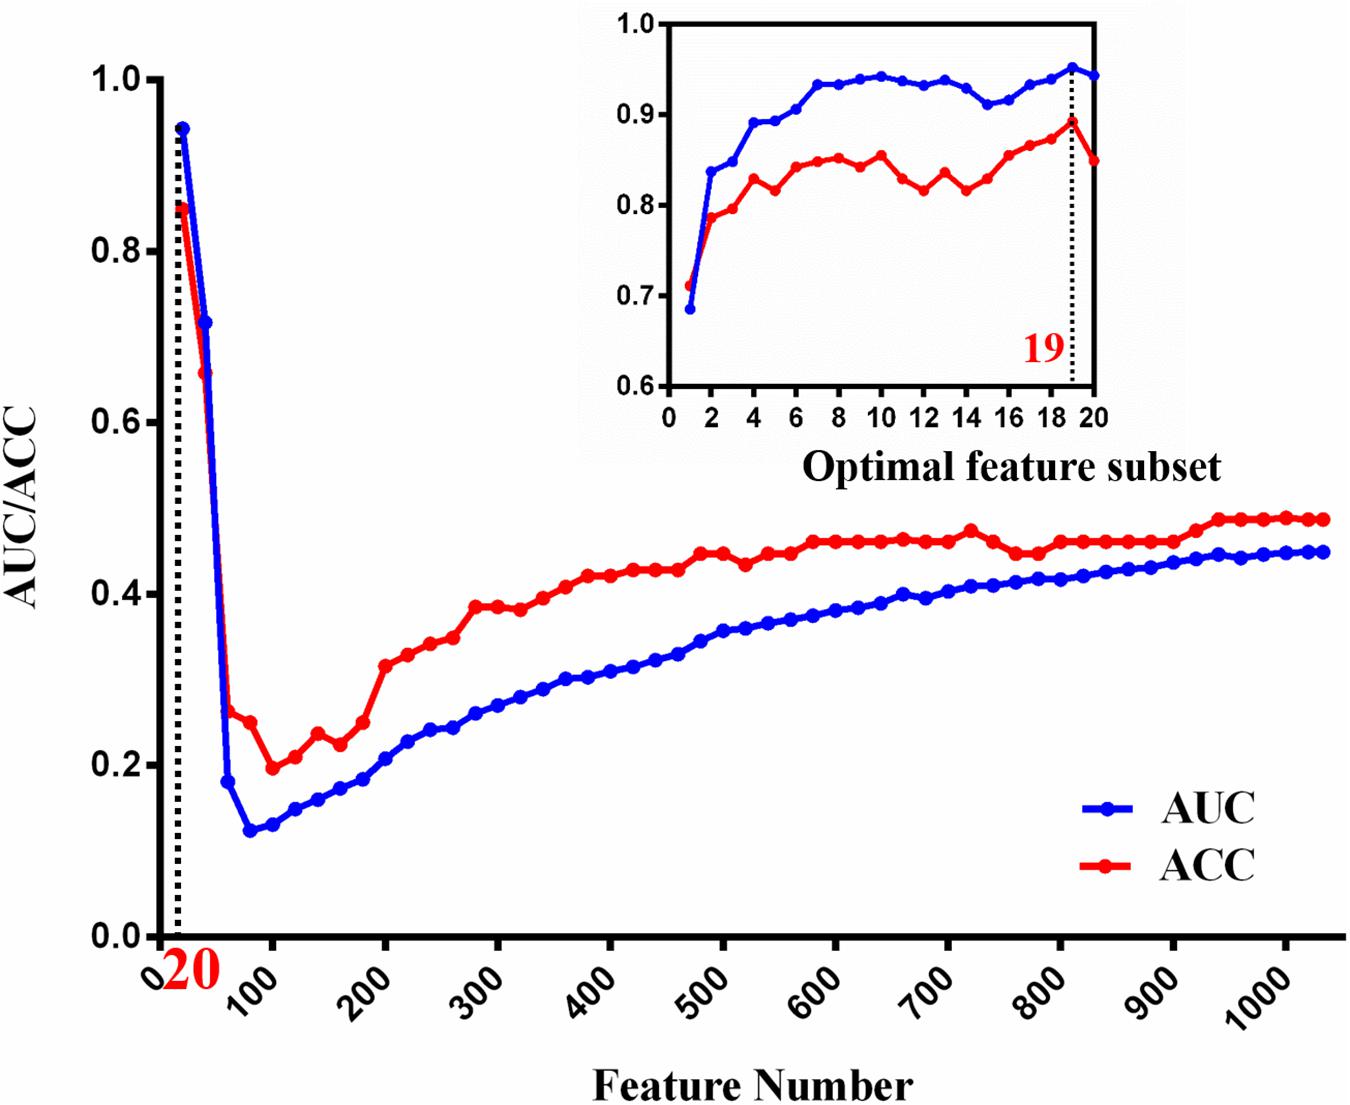
Figure 4. The tendency of classification AUC and ACC value during optimal attribute determination of machine-learning model. The horizontal axis is the attribute number and the vertical axis is the AUC/ACC value. The local classification performance at peak point is magnified to view on the top right corner.
Afterward, the independent test data were used to test the final solution in order to confirm the actual classification power. The test accuracy and AUC of the model were 0.70 and 0.84, respectively.
As described above, 19 out of the 1038 features were selected to be the optimal feature subset to establish IDH1 mutation prediction model. It can be observed that GLCM features (n = 13) accounted for a high proportion, and the rest (n = 6) were GLRLM features. Detailed descriptions of the 19 features are listed in Table 3. The ROC and the heat maps of feature correlations before and after feature selection were shown in Figure 5. The machine-learning model achieved better discriminative ability to predict IDH1 mutation, with the ACC and AUC of 0.892 and 0.952, respectively (Figure 5A). As further demonstrated in Figure 5B, before feature selection, there was mass redundant information among the 1038 features, which appeared as the high correlation coefficients ranging from −1 (blue) to 1 (red). After feature selection, 19 optimal features had a relatively low correlation and high effectiveness, as shown in Figure 5C.
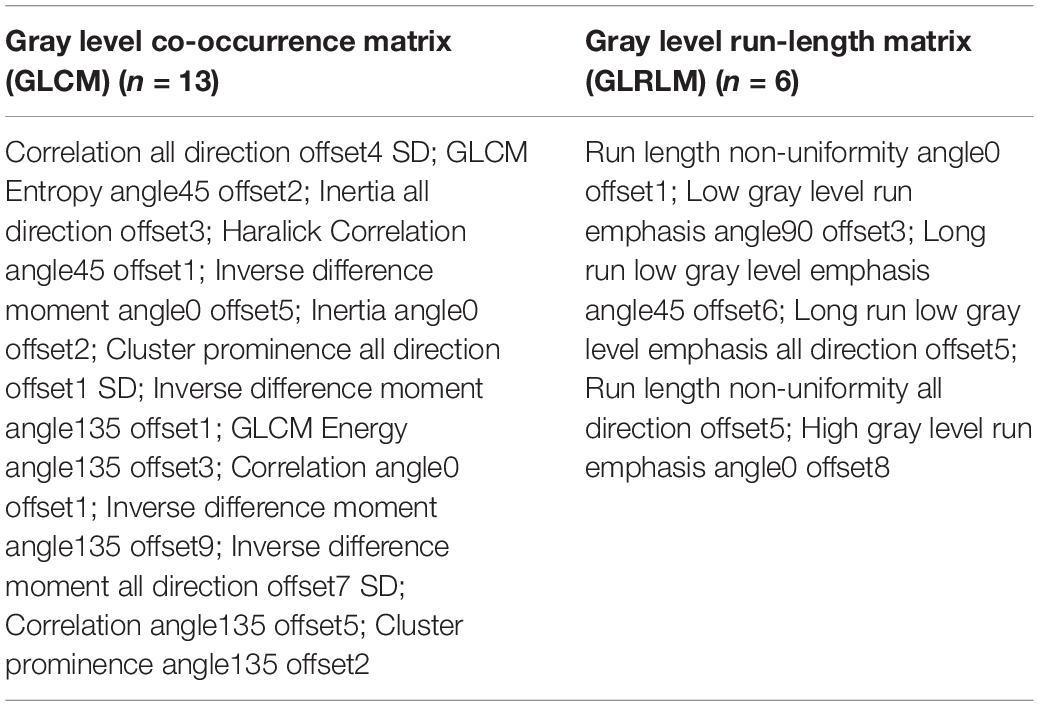
Table 3. The optimal radiomic features selected by the SVM-RFE method.
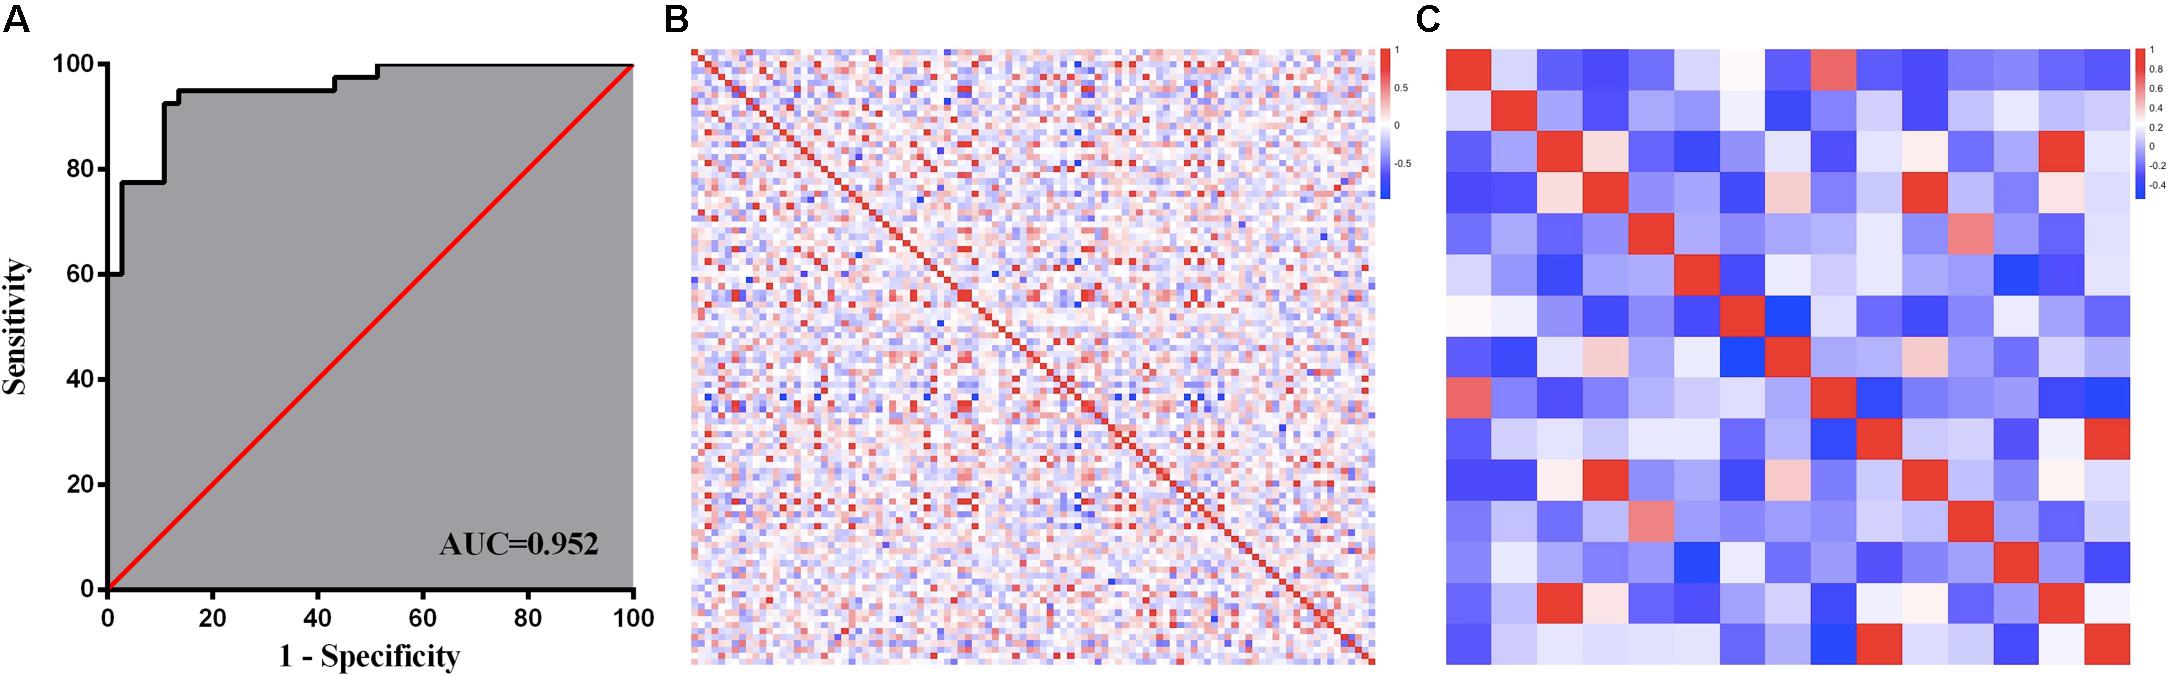
Figure 5. Feature selection and analysis. ROC curve of machine-learning model (A); Heat maps of feature correlation analysis before (B) and after (C) feature selection.
The contributing weight and correlation coefficient between each feature and the classification class of the optimal feature subset were shown in Figure 6. It is obvious that the corresponding trend of the blue and orange bars of each feature does not match, which indicates that the performance of an individual feature does not determine its contribution to the optimal feature subset. That is to say the feature subset does not necessarily require that each feature to be very powerful, but the complementarity between features can help the subset achieve the best results. Therefore, to simply combine several individual parameters with higher classification performance may not achieve enough good results.
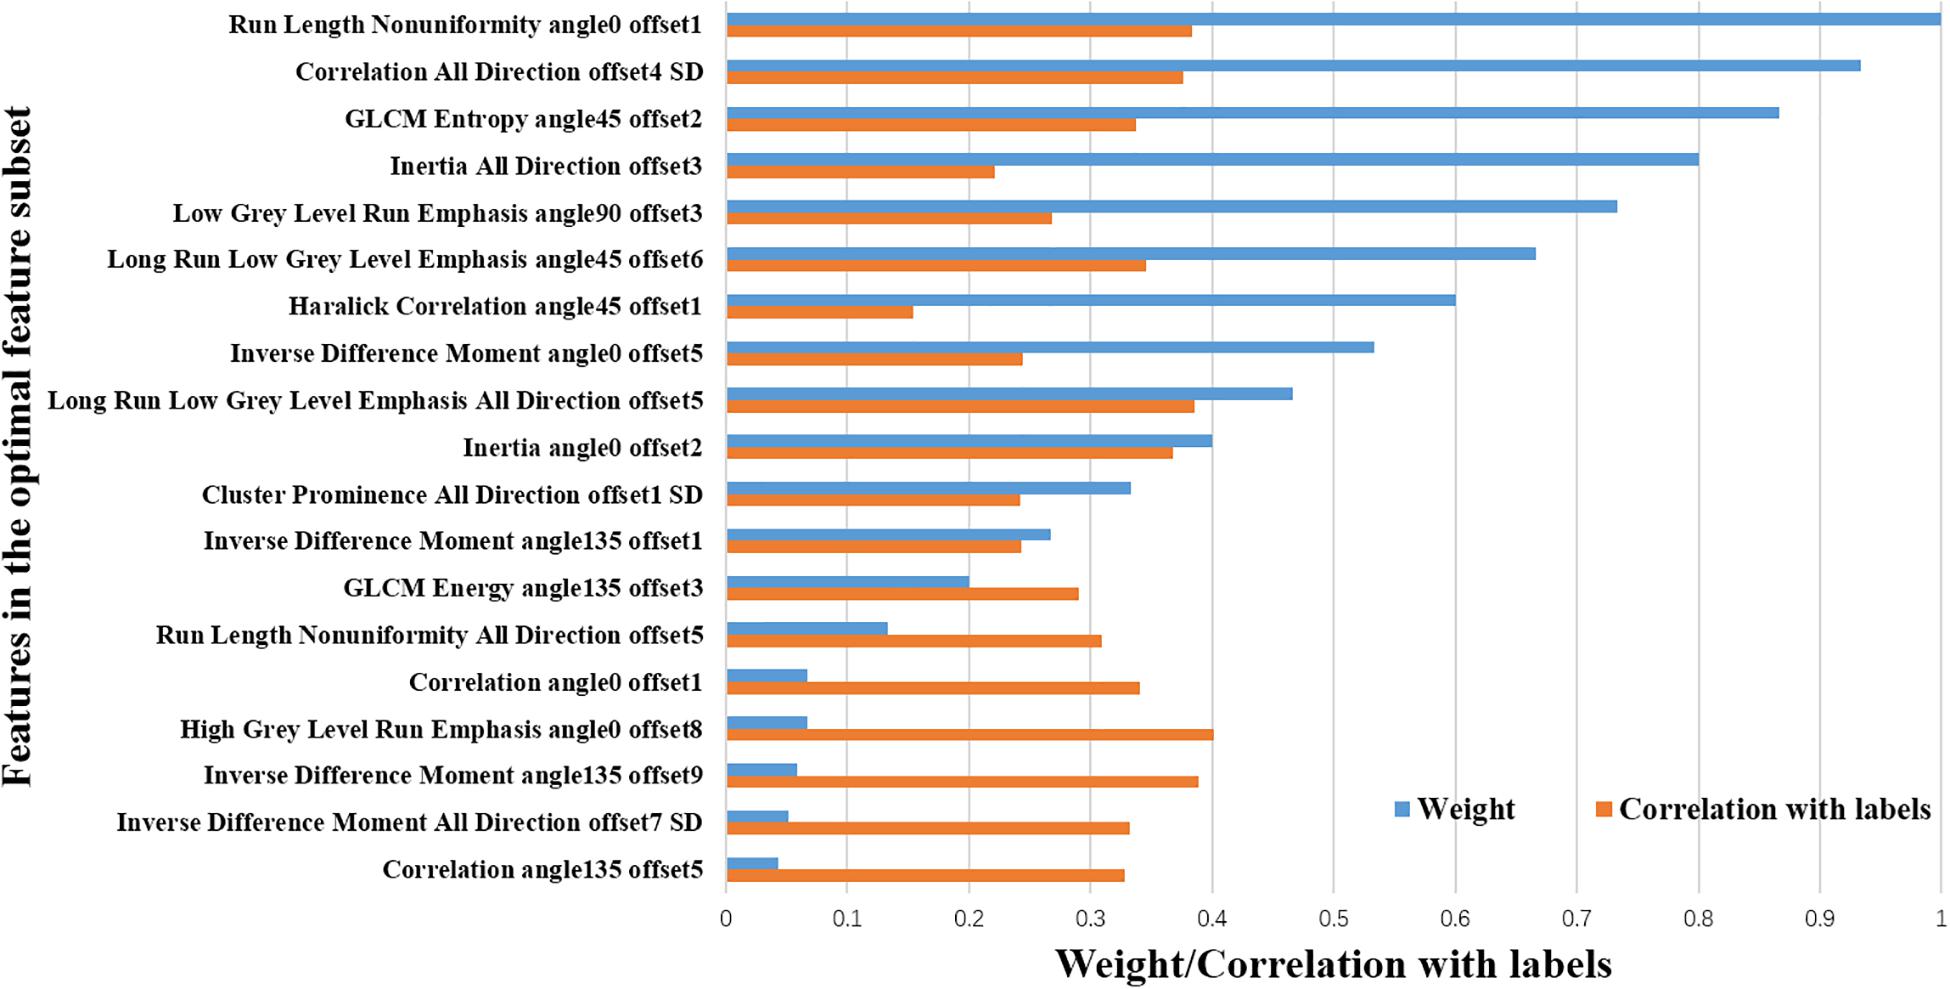
Figure 6. Analysis of the optimal feature subset of machine-learning model. The blue bars represent the contribution weights of the optimal feature subset of machine-learning model. The orange bars represent the correlation coefficient for features and the classification class.
In this study, the histogram and high-order features were extracted from APTW images. Both univariate and radiomics analyses were performed to compare the efficacies in predicting IDH1 mutation. Our SVM model achieved an AUC of 0.952 and 0.84 in the training set and test set, respectively. Notably, the efficacy achieved by SVM model was superior to that of univariate analysis.
Jiang et al. (2017) first confirmed the ability of APTW images in identifying the IDH1 mutation status. Based on their study, IDH wild-type gliomas were associated with relatively high APTW signal intensities as compared with IDH-mutant ones. Similarly, our univariate analysis revealed that 8 out of 18 determinant variables were histogram features. Among these histogram features, the higher AUCs (0.734) were achieved by using the 75th and 85th percentile APTW values. However, different from their study, the best diagnostic performance was achieved by using High Gray Level Run Emphasis All Direction offset 8 SD with AUC of 0.769. Furthermore, the highest AUC of 0.952 was achieved by using radiomics model. The following factors may contribute to the differences: (1) different study population; only WHO grade II gliomas with relatively small sample size were enrolled in their study. In light of the 2016 WHO classification, the anaplasia and mitotic activity in WHO grade II from III gliomas may result in inter-observer variability. Furthermore, clinical outcome differences of grade II/III gliomas rely far more on molecular subtypes than on grading, suggesting that molecular parameters may in fact be a better tool in identifying subgroups with distinct prognosis. Consequently, in accordance with cancer genome archive (TCGA), we merged WHO grade II/III gliomas as “lower grade glioma”; (2) different ROI strategy; in their study, both whole tumor histogram-based and multi-ROI-based analyses were adopted. The best AUC of 0.89 was achieved by multi-ROI-based maximal APTw value. Though suitable for application in clinical practice, the hot-spot ROI analysis might limit the reproducibility of the results. (3) different order feature and statistical methodology; conventional univariate analysis based on first-order features (maximum, minimum and other histogram features) were used in their study. In our study, apart from histogram features, higher order features were extracted. Moreover, radiomics analyses were performed for feature selection and classifier modeling.
Our study expands the current scarce but promising evidence on the diagnostic ability of APTW images to predict IDH1 mutation. Both univariate and radiomics analyses were performed. The efficacy achieved by radiomics analysis was superior to that with univariate analysis. The promising results may be partially attributed to two reasons: (1) Compared to first-order texture features based on histograms of the original image, higher order features provided spatial information among pixels and may better reflect the tumor heterogeneity (Hu et al., 2015); (2) Machine learning method enabled the integration of quantitative textural image features to build a model to predict IDH1 mutation. Especially, the SVM classifier is considered to be a robust and effective machine-learning approach that has been predominately used in the fields of neuroimaging and molecular biology.
In addition, the promising prediction performance partly benefited from the feature selection procedure (to decrease the redundancy between features and the risk of model overfitting) by identifying a set of the most contributing features. Here, in the optimal feature subset for IDH1 mutation prediction, most of the selected features were GLCM and GLRLM, which partly benefited from their high proportion in raw feature sets. However, it is worth noting that selected GLCM and GLRLM represent voxel-based change of grayscale and could reflect the complexity and heterogeneity of the tumor. Although the underlying biological mechanism for how these features relate to IDH1 mutation status is presently unclear, our findings is in accordance with previous studies (Choi et al., 2016; Liu et al., 2018; Zhang et al., 2018). Besides, the results suggested that the feature subset does not necessarily require that each feature be very powerful, but the complementarity between features can help the subset achieve the best results.
There are several limitations in this study. First, our sample size was relatively small, especially for the IDH1 wild-type group due to the inherent IDH1 mutation distribution ratio in the general population. The results presented here require confirmation in a larger study. Second, only two-dimensional ROIs at each representative slice were delineated for feature extraction. Third, we did not thoroughly reveal the biological process behind the selected texture feature. Lastly, multi-model MRI data should be integrated into our model to improve efficiency of IDH1 mutation prediction.
In conclusion, the current study revealed that radiomic features derived from APTW images are associated with IDH1 mutation status in grade II/III gliomas. Using texture analysis and SVM, a machine learning model was established and the IDH1 mutation status was predicted effectively. Our findings indicate that quantitative radiomics analysis based on APTW images can potentially provide a non-invasive methodology for mutation status detection.
The datasets generated for this study are available on request to the corresponding author.
The studies involving human participants were reviewed and approved by the Ethics Committee of Tangdu Hospital. Written informed consent to participate in this study was provided by the participants’ legal guardian/next of kin.
G-BC, L-FY, YH, and WW contributed to the conception and design of the study and drafting the work. YY, GX, Y-ZS, QT, and JZ contributed to the acquisition, analysis and interpretation of the data, and drafting and revision the work. All authors gave the final approval and agreement to all the aspects of the work.
This study received financial support from the National Key Research and Development Program of China (No. 2016YFC0107105) to G-BC, the Young Talent Foundation of Tangdu Hospital to WW, the Key Industrial Chain Projects in the Field of Social Development of Shaanxi Province (No. 2019ZDLSF02-07) to G-BC, and the General Projects in the Field of Social Development of Shaanxi Province (No. 2019SF-002) to L-FY.
The authors declare that the research was conducted in the absence of any commercial or financial relationships that could be construed as a potential conflict of interest.
We would like to thank Dr. Xiao-Cheng Wei from GE Healthcare for providing technical support regarding the appropriate amide proton transfer weighted imaging and data analysis.
The Supplementary Material for this article can be found online at: https://www.frontiersin.org/articles/10.3389/fnins.2020.00144/full#supplementary-material
Agarwal, S., Sharma, M. C., Jha, P., Pathak, P., Suri, V., Sarkar, C., et al. (2013). Comparative study of IDH1 mutations in gliomas by immunohistochemistry and DNA sequencing. Neurol. Oncol. 15, 718–726. doi: 10.1093/neuonc/not015
Andronesi, O. C., Kim, G. S., Gerstner, E., Batchelor, T., Tzika, A. A., Fantin, V. R., et al. (2012). Detection of 2-hydroxyglutarate in IDH-mutated glioma patients by in vivo spectral-editing and 2D correlation magnetic resonance spectroscopy. Sci. Transl. Med. 4:116ra114. doi: 10.1126/scitranslmed.3002693
Arita, H., Kinoshita, M., Kawaguchi, A., Takahashi, M., Narita, Y., Terakawa, Y., et al. (2018). Lesion location implemented magnetic resonance imaging radiomics for predicting IDH and TERT promoter mutations in grade II/III gliomas. Sci. Rep. 8:11773. doi: 10.1038/s41598-018-30273-4
Choi, C., Ganji, S. K., DeBerardinis, R. J., Hatanpaa, K. J., Rakheja, D., Kovacs, Z., et al. (2012). 2-hydroxyglutarate detection by magnetic resonance spectroscopy in IDH-mutated patients with gliomas. Nat. Med. 18, 624–629. doi: 10.1038/nm.2682
Choi, E. R., Lee, H. Y., Jeong, J. Y., Choi, Y. L., Kim, J., Bae, J., et al. (2016). Quantitative image variables reflect the intratumoral pathologic heterogeneity of lung adenocarcinoma. Oncotarget 7, 67302–67313. doi: 10.18632/oncotarget.11693
Daumas-Duport, C., Scheithauer, B., O’Fallon, J., and Kelly, P. (1988). Grading of astrocytomas. A simple and reproducible method. Cancer 62, 2152–2165. doi: 10.1002/1097-0142(19881115)62:10<2152::aid-cncr2820621015>3.0.co;2-t
de la Fuente, M. I., Young, R. J., Rubel, J., Rosenblum, M., Tisnado, J., Briggs, S., et al. (2016). Integration of 2-hydroxyglutarate-proton magnetic resonance spectroscopy into clinical practice for disease monitoring in isocitrate dehydrogenase-mutant glioma. Neurol. Oncol. 18, 283–290. doi: 10.1093/neuonc/nov307
Doll, S., Urisman, A., Oses-Prieto, J. A., Arnott, D., and Burlingame, A. L. (2017). Quantitative proteomics reveals fundamental regulatory differences in oncogenic HRAS and isocitrate dehydrogenase (IDH1) driven astrocytoma. Mol. Cell Proteom. 16, 39–56. doi: 10.1074/mcp.M116.063883
Fuller, G. N., and Scheithauer, B. W. (2007). The 2007 revised world health organization (WHO) classification of tumours of the central nervous system: newly codified entities. Brain Pathol. 17, 304–307. doi: 10.1111/j.1750-3639.2007.00084.x
Gevaert, O., Mitchell, L. A., Achrol, A. S., Xu, J., Echegaray, S., Steinberg, G. K., et al. (2014). Glioblastoma multiforme: exploratory radiogenomic analysis by using quantitative image features. Radiology 273, 168–174. doi: 10.1148/radiol.14131731
Gillies, R. J., Kinahan, P. E., and Hricak, H. (2016). Radiomics: images are more than pictures. They are data. Radiology 278, 563–577. doi: 10.1148/radiol.2015151169
Hartmann, C., Meyer, J., Balss, J., Capper, D., Mueller, W., Christians, A., et al. (2009). Type and frequency of IDH1 and IDH2 mutations are related to astrocytic and oligodendroglial differentiation and age: a study of 1,010 diffuse gliomas. Acta Neuropathol. 118, 469–474. doi: 10.1007/s00401-009-0561-9
Hu, L. S., Ning, S., Eschbacher, J. M., Gaw, N., Dueck, A. C., Smith, K. A., et al. (2015). Multi-parametric MRI and texture analysis to visualize spatial histologic heterogeneity and tumor extent in glioblastoma. PLoS One 10:e0141506. doi: 10.1371/journal.pone.0141506
Jiang, S., Yu, H., Wang, X., Lu, S., Li, Y., Feng, L., et al. (2016). Molecular MRI differentiation between primary central nervous system lymphomas and high-grade gliomas using endogenous protein-based amide proton transfer MR imaging at 3 Tesla. Eur. Radiol. 26, 64–71. doi: 10.1007/s00330-015-3805-1
Jiang, S., Zou, T., Eberhart, C. G., Villalobos, M. A. V., Heo, H. Y., Zhang, Y., et al. (2017). Predicting IDH mutation status in grade II gliomas using amide proton transfer-weighted (APTw) MRI. Magn. Reson. Med. 78, 1100–1109. doi: 10.1002/mrm.26820
Jiang, T., Mao, Y., Ma, W., Mao, Q., You, Y., Yang, X., et al. (2016). CGCG clinical practice guidelines for the management of adult diffuse gliomas. Cancer Lett. 375, 263–273. doi: 10.1016/j.canlet.2016.01.024
Kotrotsou, A., Zinn, P. O., and Colen, R. R. (2016). Radiomics in brain tumors: an emerging technique for characterization of tumor environment. Magn. Reson. Imaging Clin. N. Am. 24, 719–729. doi: 10.1016/j.mric.2016.06.006
Li, Y., Liu, X., Qian, Z., Sun, Z., Xu, K., Wang, K., et al. (2018). Genotype prediction of ATRX mutation in lower-grade gliomas using an MRI radiomics signature. Eur. Radiol. 28, 2960–2968. doi: 10.1007/s00330-017-5267-0
Liu, S., Zheng, H., Zhang, Y., Chen, L., Guan, W., Guan, Y., et al. (2018). Whole-volume apparent diffusion coefficient-based entropy parameters for assessment of gastric cancer aggressiveness. J. Magn. Reson. Imaging 47, 168–175. doi: 10.1002/jmri.25752
Louis, D. N., Perry, A., Reifenberger, G., von Deimling, A., Figarella-Branger, D., Cavenee, W. K., et al. (2016). The 2016 world health organization classification of tumors of the central nervous system: a summary. Acta Neuropathol. 131, 803–820. doi: 10.1007/s00401-016-1545-1
Olar, A., Wani, K. M., Alfaro-Munoz, K. D., Heathcock, L. E., van Thuijl, H. F., Gilbert, M. R., et al. (2015). IDH mutation status and role of WHO grade and mitotic index in overall survival in grade II-III diffuse gliomas. Acta Neuropathol. 129, 585–596. doi: 10.1007/s00401-015-1398-z
Pope, W. B., Prins, R. M., Albert Thomas, M., Nagarajan, R., Yen, K. E., Bittinger, M. A., et al. (2012). Non-invasive detection of 2-hydroxyglutarate and other metabolites in IDH1 mutant glioma patients using magnetic resonance spectroscopy. J. Neurooncol. 107, 197–205. doi: 10.1007/s11060-011-0737-8
Prasanna, P., Patel, J., Partovi, S., Madabhushi, A., and Tiwari, P. (2017). Radiomic features from the peritumoral brain parenchyma on treatment-naive multi-parametric MR imaging predict long versus short-term survival in glioblastoma multiforme: preliminary findings. Eur. Radiol. 27, 4188–4197. doi: 10.1007/s00330-016-4637-3
Reitman, Z. J., Jin, G., Karoly, E. D., Spasojevic, I., Yang, J., Kinzler, K. W., et al. (2011). Profiling the effects of isocitrate dehydrogenase 1 and 2 mutations on the cellular metabolome. Proc. Natl. Acad. Sci. U.S.A. 108, 3270–3275. doi: 10.1073/pnas.1019393108
Reuss, D. E., Mamatjan, Y., Schrimpf, D., Capper, D., Hovestadt, V., Kratz, A., et al. (2015). IDH mutant diffuse and anaplastic astrocytomas have similar age at presentation and little difference in survival: a grading problem for WHO. Acta Neuropathol. 129, 867–873. doi: 10.1007/s00401-015-1438-8
Rohle, D., Popovici-Muller, J., Palaskas, N., Turcan, S., Grommes, C., Campos, C., et al. (2013). An inhibitor of mutant IDH1 delays growth and promotes differentiation of glioma cells. Science 340, 626–630. doi: 10.1126/science.1236062
Sagiyama, K., Mashimo, T., Togao, O., Vemireddy, V., Hatanpaa, K. J., Maher, E. A., et al. (2014). In vivo chemical exchange saturation transfer imaging allows early detection of a therapeutic response in glioblastoma. Proc. Natl. Acad. Sci. U.S.A. 111, 4542–4547. doi: 10.1073/pnas.1323855111
Sanson, M., Marie, Y., Paris, S., Idbaih, A., Laffaire, J., Ducray, F., et al. (2009). Isocitrate dehydrogenase 1 codon 132 mutation is an important prognostic biomarker in gliomas. J. Clin. Oncol. 27, 4150–4154. doi: 10.1200/JCO.2009.21.9832
Shofty, B., Artzi, M., Ben Bashat, D., Liberman, G., Haim, O., Kashanian, A., et al. (2018). MRI radiomics analysis of molecular alterations in low-grade gliomas. Int. J. Comput. Assist. Radiol. Surg. 13, 563–571. doi: 10.1007/s11548-017-1691-5
Suh, C. H., Kim, H. S., Jung, S. C., Choi, C. G., and Kim, S. J. (2018). Imaging prediction of isocitrate dehydrogenase (IDH) mutation in patients with glioma: a systemic review and meta-analysis. Eur. Radiol. 20, 1573–1583. doi: 10.1007/s00330-018-5608-7
Togao, O., Yoshiura, T., Keupp, J., Hiwatashi, A., Yamashita, K., Kikuchi, K., et al. (2014). Amide proton transfer imaging of adult diffuse gliomas: correlation with histopathological grades. Neurol. Oncol. 16, 441–448. doi: 10.1093/neuonc/not158
van den Bent, M. J. (2010). Interobserver variation of the histopathological diagnosis in clinical trials on glioma: a clinician’s perspective. Acta Neuropathol. 120, 297–304. doi: 10.1007/s00401-010-0725-7
van den Bent, M. J., Dubbink, H. J., Marie, Y., Brandes, A. A., Taphoorn, M. J., Wesseling, P., et al. (2010). IDH1 and IDH2 mutations are prognostic but not predictive for outcome in anaplastic oligodendroglial tumors: a report of the european organization for research and treatment of cancer brain tumor group. Clin. Cancer Res. 16, 1597–1604. doi: 10.1158/1078-0432.CCR-09-2902
Yan, H., Parsons, D. W., Jin, G., McLendon, R., Rasheed, B. A., Yuan, W., et al. (2009). IDH1 and IDH2 mutations in gliomas. N. Engl. J. Med. 360, 765–773. doi: 10.1056/NEJMoa0808710
Yang, H., Ye, D., Guan, K. L., and Xiong, Y. (2012). IDH1 and IDH2 mutations in tumorigenesis: mechanistic insights and clinical perspectives. Clin. Cancer Res. 18, 5562–5571. doi: 10.1158/1078-0432.CCR-12-1773
Yip, S., Butterfield, Y. S., Morozova, O., Chittaranjan, S., Blough, M. D., An, J., et al. (2012). Concurrent CIC mutations, IDH mutations, and 1p/19q loss distinguish oligodendrogliomas from other cancers. J. Pathol. 226, 7–16. doi: 10.1002/path.2995
Yu, H., Lou, H., Zou, T., Wang, X., Jiang, S., Huang, Z., et al. (2017). Applying protein-based amide proton transfer MR imaging to distinguish solitary brain metastases from glioblastoma. Eur. Radiol. 27, 4516–4524. doi: 10.1007/s00330-017-4867-z
Zhang, X., Tian, Q., Wang, L., Liu, Y., Li, B., Liang, Z., et al. (2018). Radiomics strategy for molecular subtype stratification of lower-grade glioma: detecting IDH and TP53 mutations based on multimodal MRI. J. Magn. Reson. Imaging. 48, 916–926. doi: 10.1002/jmri.25960
Zhang, X., Yan, L. F., Hu, Y. C., Li, G., Yang, Y., Han, Y., et al. (2017). Optimizing a machine learning based glioma grading system using multi-parametric MRI histogram and texture features. Oncotarget 8, 47816–47830. doi: 10.18632/oncotarget.18001
Keywords: glioma, radiomics, isocitrate dehydrogenase 1 mutation, support vector machine, magnetic resonance imaging
Citation: Han Y, Wang W, Yang Y, Sun Y-Z, Xiao G, Tian Q, Zhang J, Cui G-B and Yan L-F (2020) Amide Proton Transfer Imaging in Predicting Isocitrate Dehydrogenase 1 Mutation Status of Grade II/III Gliomas Based on Support Vector Machine. Front. Neurosci. 14:144. doi: 10.3389/fnins.2020.00144
Received: 07 November 2019; Accepted: 05 February 2020;
Published: 21 February 2020.
Edited by:
Miguel Castelo-Branco, Coimbra Institute for Biomedical Imaging and Translational Research (CIBIT), PortugalReviewed by:
Dong-Hoon Lee, The University of Sydney, AustraliaCopyright © 2020 Han, Wang, Yang, Sun, Xiao, Tian, Zhang, Cui and Yan. This is an open-access article distributed under the terms of the Creative Commons Attribution License (CC BY). The use, distribution or reproduction in other forums is permitted, provided the original author(s) and the copyright owner(s) are credited and that the original publication in this journal is cited, in accordance with accepted academic practice. No use, distribution or reproduction is permitted which does not comply with these terms.
*Correspondence: Guang-Bin Cui, Y3VpZ2J0ZEBmbW11LmVkdS5jbg==; Y2didGRAMTI2LmNvbQ==; Lin-Feng Yan, eWFubGluZmVuZ0BmbW11LmVkdS5jbg==
†These authors have contributed equally to this work
Disclaimer: All claims expressed in this article are solely those of the authors and do not necessarily represent those of their affiliated organizations, or those of the publisher, the editors and the reviewers. Any product that may be evaluated in this article or claim that may be made by its manufacturer is not guaranteed or endorsed by the publisher.
Research integrity at Frontiers
Learn more about the work of our research integrity team to safeguard the quality of each article we publish.