 Tadashi Watabe1,2*
 Jun Hatazawa1,2†
- 1Department of Nuclear Medicine and Tracer Kinetics, Graduate School of Medicine, Osaka University, Osaka, Japan
- 2Institute for Radiation Sciences, Osaka University, Osaka, Japan
Resting-state networks (RSNs) exhibit spontaneous functional connectivity in the resting state. Previous studies have evaluated RSNs mainly based on spontaneous fluctuations in blood oxygenation level-dependent (BOLD) signals during functional magnetic resonance imaging (fMRI). However, separation between regional increases in cerebral blood flow (CBF) and oxygen consumption is theoretically difficult using BOLD-fMRI. Such separation can be achieved using quantitative 15O-gas and water positron emission tomography (PET). In addition, 18F-FDG PET can be used to investigate functional connectivity based on changes in glucose metabolism, which reflects local brain activity. Previous studies have highlighted the feasibility and clinical usefulness of 18F-FDG-PET for the analysis of RSNs, and recent studies have utilized simultaneous PET/fMRI for such analyses. While PET provides seed information regarding the focus of the abnormalities (e.g., hypometabolism and reduced target binding), fMRI is used for the analysis of functional connectivity. Thus, as PET and fMRI provide different types of information, integrating these modalities may aid in elucidating the pathological mechanisms underlying certain diseases, and in characterizing individual patients.
Introduction
Resting-state networks (RSNs) exhibit spontaneous functional connectivity in the resting state. Among these is the default mode network (DMN), in which the posterior cingulate cortex (PCC) plays a central role, connecting with the medial-prefrontal, hippocampal, and lateral temporal areas (Raichle et al., 2001; Buckner et al., 2008; Raichle, 2015). While the DMN is active during the resting state, it becomes deactivated during task states (McCormick and Telzer, 2018). Previous studies have demonstrated that the DMN is related to cognitive functions including memory, thinking, and the integration of social information. Furthermore, DMN abnormalities have been observed in patients with autism, schizophrenia, and Alzheimer’s disease (AD) (Buckner et al., 2008).
The default mode network was first discovered by Raichle et al. using positron emission tomography (PET) (2001). The authors focused on the regional oxygen extraction fraction (OEF), and which refers to the ratio of the cerebral metabolic rate of oxygen (CMRO2) to cerebral blood flow (CBF). Increases in CBF during task-related brain activation occur in conjunction with smaller changes in CMRO2, resulting in a relative decrease in the OEF. In contrast, the OEF increases during the deactivated state. Raichle et al. (2001) reported that the OEF increases in the visual cortex of healthy adults during the resting state (i.e., awake with eyes closed). Eye closure usually induces deactivation in the visual cortex and corresponding increases in OEF. However, many brain regions exhibit decreases in OEF when compared to the mean hemispheric value, suggesting that some areas are activated even in the baseline or “default” state of the brain.
Since the discovery of the DMN, several studies have used functional magnetic resonance imaging (fMRI) to analyze functional connectivity based on spontaneous fluctuations in blood oxygenation-level dependent (BOLD) signals (Greicius et al., 2003). When an area of the brain is activated, the BOLD signal of the corresponding region increases, reflecting a larger increase in regional CBF than in regional CMRO2 (Raichle et al., 2001). Therefore, functional connectivity among brain regions can be estimated by evaluating the correlations among the time-courses of changes in BOLD signals. While the methodologies for detecting decreased OEF on PET and increased BOLD signaling on fMRI are similar, PET is associated with superior quantitative accuracy for the evaluation of CBF and CMRO2, which are determined separately in the calculation of OEF.
In the present study, we summarized recent advances in the evaluation of functional connectivity using PET. Since the methodological aspects of connectivity analysis have been summarized by Aiello et al. (2016), Yakushev et al. (2017), and Verger and Guedj (2018), we mainly focused on how PET data beyond fluorodeoxyglucose (FDG) can be utilized for functional connectivity analyses. Using the term “functional connectivity PET,” we searched PubMed for articles published between February 2016 and February 2019. Similarly, we searched PubMed using the term “functional connectivity FDG PET” for articles published between February 2014 and February 2019. We included clinical studies involving patients or healthy volunteers in which PET was used for connectivity analyses. Preliminary studies and those with incomplete methodological information were excluded from our analysis.
Evaluation of Functional Correlations Using 15O-gas PET
Regional CBF and CMRO2 can be quantitatively evaluated via 15O-labeled gas and water PET (Hatazawa et al., 1996; Watabe et al., 2014). Our group recently reported that functional correlations in the DMN can be estimated using quantitative 15O-PET (Aoe et al., 2018). Our findings indicated that evaluation based on changes in CBF revealed a larger number of brain networks than evaluation based on changes in CMRO2, suggesting that the contribution of blood flow to functional correlations in the DMN is greater than that of oxygen consumption (Figure 1). In this method, two brain regions are considered functionally correlated when their quantitative CBF or CMRO2 values exhibit a significant positive inter-subject correlation. Similar methods were also adopted in another previous study (Di et al., 2012).
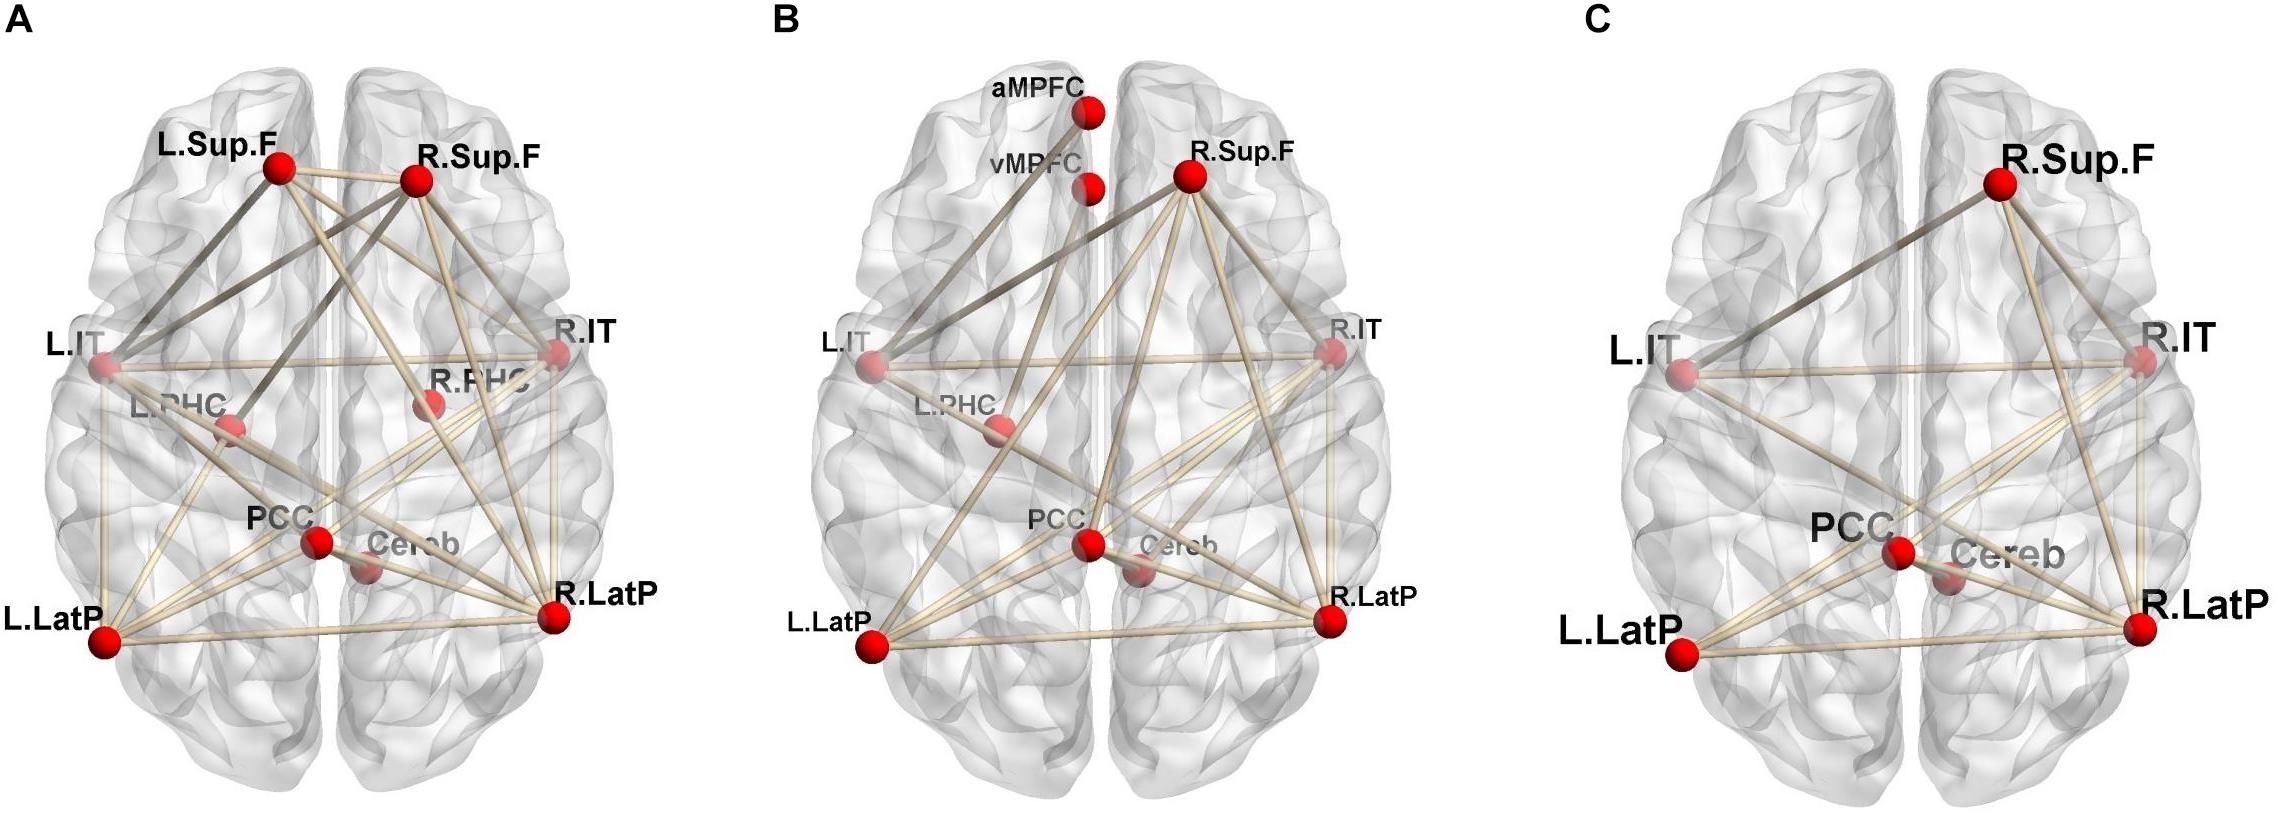
Figure 1. Significant positive functional correlations involving the DMN. (A) Correlations based on CBF; (B) CMRO2; (C) the overlap between CBF and CMRO2 (reprint from Aoe et al., 2018; permission obtained from the Annals of Nuclear Medicine in accordance with their open access policy).
Unlike BOLD-fMRI, 15O-gas and water PET is advantageous in that CBF, and CMRO2 can be evaluated separately. Local brain activation first increases regional CMRO2, reflecting increases in energy metabolism, following which CBF increases (Figure 2). However, one disadvantage of PET is that it is difficult to clarify temporal changes due to the long scan duration of each acquisition and the time required for radioactive decay when compared with fMRI, which exhibits a temporal resolution on the order of seconds. Therefore, researchers should remain aware that the theoretical bases of determining functional correlations via PET and determining functional connectivity via BOLD-fMRI are different.
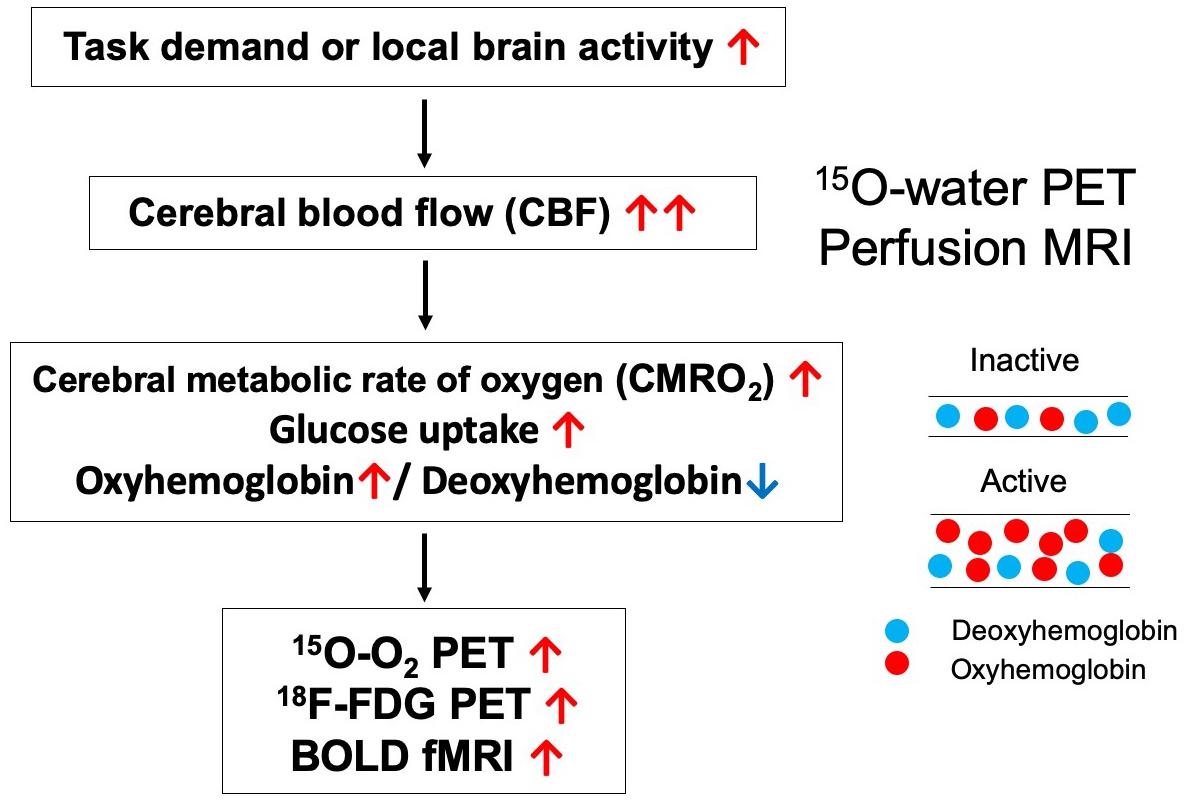
Figure 2. Brain responses during activation for each modality.
Evaluation of Functional Connectivity Via 18F-FDG PET
Glucose is the fundamental metabolic substrate in the brain. Given that glucose metabolism reflects local brain activity, this measure can be used to analyze functional connectivity. Passow et al. (2015) reported a close association between local metabolic activity and functional connectivity by comparing fluctuations in FDG-uptake and BOLD signals, suggesting that 18F-FDG-PET is feasible and reliable for functional connectivity analyses in the brain. In their study, FDG-PET images were acquired in 12 frames (5 min each) following intravenous injection of FDG, and fluctuations among these frames were evaluated based on global normalization. Wehrl et al. (2013) also utilized temporal information from dynamic PET, while additional studies have highlighted the utility of static PET data for the evaluation of metabolic functional connectivity. In a graph theory-based network analysis, Vanicek et al. (2016) evaluated preoperative FDG-PET data for patients with right-sided temporal lobe epilepsy (TLE) (RTLE; n = 30), left-sided TLE (LTLE; n = 32), and healthy controls (n = 31). FDG-PET has also been used in clinical practice to detect seizure lateralization in patients with TLE. Indeed, patients with RTLE exhibit higher lobar connectivity weights than those with LTLE for connections involving the temporal and parietal lobes of the contralateral hemisphere. Although the mechanisms underlying such differences remain to be fully elucidated, the authors suspected that compensatory mechanisms were more prominent in patients with RTLE than in those with LTLE.
Pagani et al. (2017) performed independent-component analysis of 18F-FDG PET data, revealing that patients with AD exhibit gradual disruptions in functional brain connectivity during the progression of cognitive decline. Chen et al. (2018) investigated alterations in whole-brain intrinsic functional connectivity in patients with dementia with Lewy Bodies (DLB). In their study, the DLB group exhibited increases in the strength of some connections when compared to the healthy control group. These findings suggest that alterations in functional connectivity can be evaluated with a certain level of sensitivity in patients with dementia using 18F-FDG PET.
Another study highlighted the usefulness of functional connectivity analysis for predicting responses to vagus nerve stimulation (VNS) in patients with epileptic seizures (Yu et al., 2018). Yu et al. (2018) performed preoperative FDG-PET in pediatric patients with refractory epilepsy undergoing VNS and analyzed metabolic connectivity via an independent component analysis. The authors reported significant differences in metabolic connectivity between the VNS-effective and VNS-ineffective groups. Relative changes in glucose metabolism were strongly connected among areas of the brainstem, cingulate gyrus, cerebellum, bilateral insula, and putamen in the VNS-effective group. Thus, these studies demonstrate that 18F-FDG-PET analyses of functional connectivity are clinically useful for identifying potential responders to therapy.
In, Villien et al., 2014 reported a new method for overcoming the temporal limitations of 18F-FDG-PET, observing that temporal changes in glucose metabolism can be evaluated during continuous injection of FDG. Since FDG is metabolically trapped in neurons or glial cells in the brain after being metabolized into glucose-6-phosphate by hexokinase, the upslope of the time-activity curves reflects real-time glucose metabolism. This technique can used to detect focal brain regions exhibiting task- or stimulus-related activation, similar to BOLD-fMRI (Jamadar et al., 2019). Although further technical adjustments are required to improve the analysis of functional connectivity during continuous-infusion PET, this technique is promising for overcoming the temporal limitations of PET.
Integrated Detection Via PET and MRI
Recent studies have utilized simultaneous or combined PET/MRI for functional connectivity analysis, allowing for perfect co-registration in terms of spatial, and temporal matching (Table 1). Using an independent component analysis, Savio et al. (2017) compared the detection of RSNs between resting-state fMRI and 18F-FDG PET using simultaneous PET/MR in healthy volunteers (2017). Similar networks were detected using the two modalities, suggesting that coupling between glucose metabolism and blood oxygenation responses is preserved in healthy individuals. Marchitelli et al. (2018) reported that bioenergetic coupling between glucose utilization and neurovascular transmission decreases with age in healthy adults, and that more marked decreases are observed in patients with amnestic mild cognitive impairment (MCI) and mild-to-moderate AD (2018). In their study, 18F-FDG-PET was used to detect regions exhibiting hypometabolism, rather than for connectivity analysis. Within-subject analysis, in which correlations between glucose utilization (PET) and connectivity (fMRI) were evaluated for each participant, revealed that patients with MCI/AD exhibited significant decreases in such correlations. For between-subjects comparisons of PET/fMRI data, in which each imaging modality and metric (volumes) were concatenated across all participants, overlap between the two modalities varied depending on fMRI connectivity parameters.
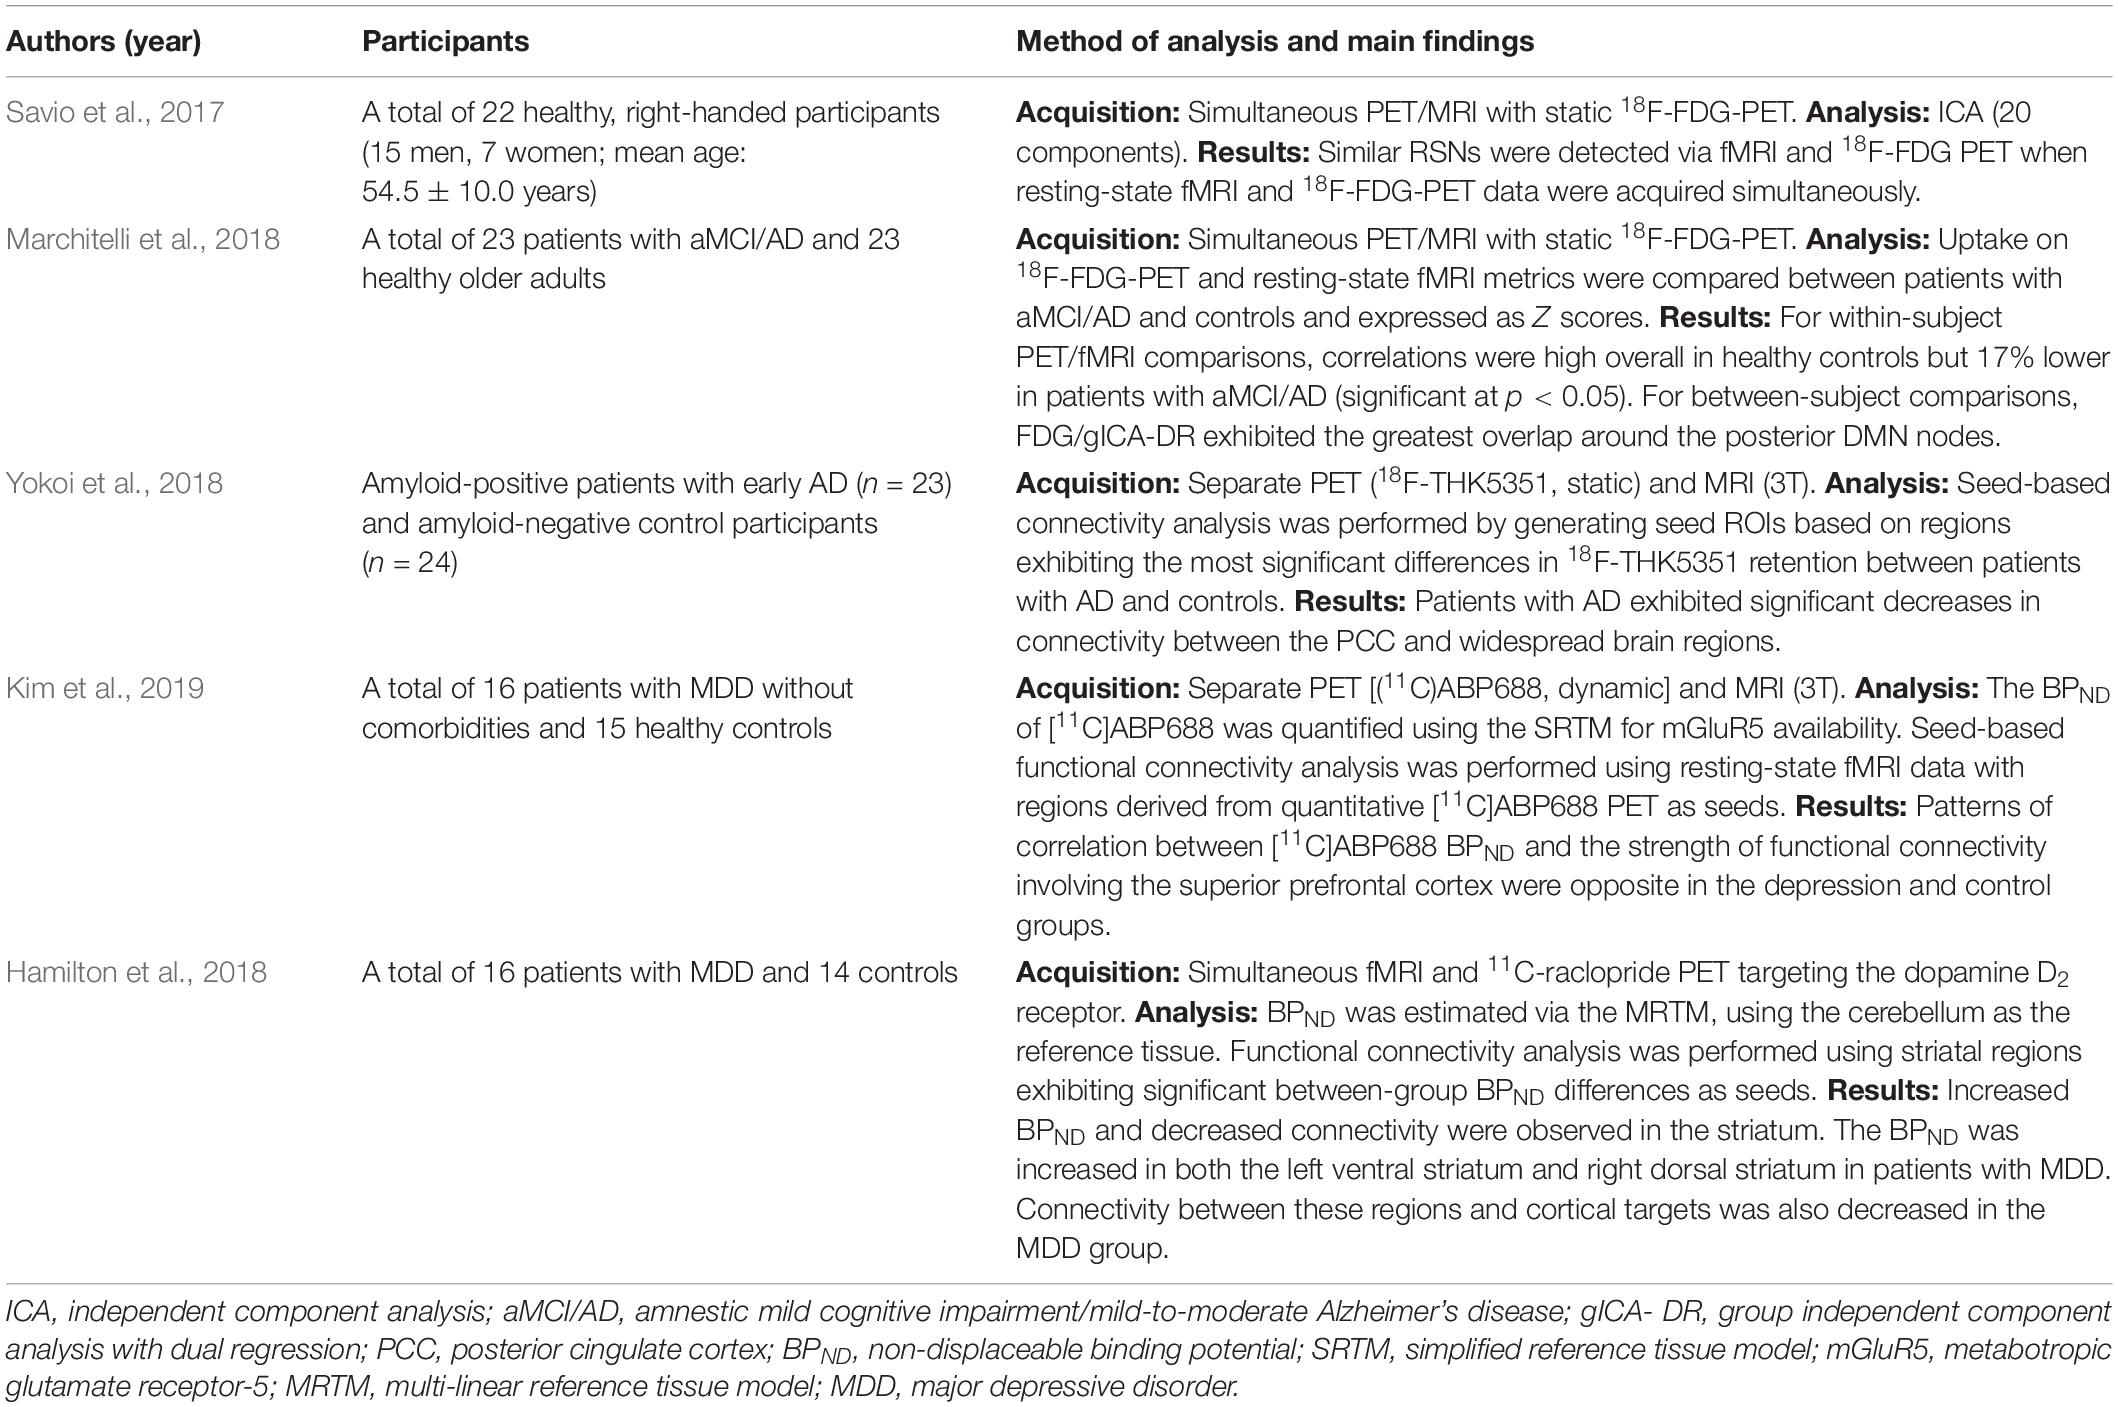
Table 1. Main findings of functional connectivity analyses using PET and fMRI.
Utility of PET as a Seed for fMRI Analysis
Previous studies have compared the correlations between PET and fMRI data using simultaneous PET/MRI. Wehrl et al. (2014) proposed the concept of cometomics, which combines connectivity data and metabolic information. When comparing patients with healthy controls, regions exhibiting hypometabolism or reduced target binding on PET can be identified via statistical parametric mapping or region-of-interest (ROI)-based analyses. Resting-state BOLD-fMRI data can be used to derive RSN maps or related parameters during functional connectivity analyses. When combining these methods, regions exhibiting abnormalities on PET images are used as seed regions for the connectivity analysis.
Yokoi et al. (2018) performed resting-state fMRI and 18F-THK5351 PET in amyloid-positive patients with early AD (n = 23) and healthy, amyloid-negative controls (n = 24). To perform seed-based connectivity analysis, they generated several seed ROIs based on significant differences in 18F-THK5351 retention between the AD and control groups. Histological evaluations at autopsy indicated that 18F-THK5351 retention corresponded to tau deposition, monoamine oxidase-B (MAO-B) levels, and astrogliosis in the brains of patients with AD. Furthermore, seed-based connectivity analysis revealed significant decreases in connectivity between the posterior cingulate cortex (PCC) and widespread brain regions in patients with AD.
Kim et al. (2019) performed seed-based functional connectivity analysis using resting-state fMRI data with seed regions derived from quantitative [11C]ABP688 PET analysis in patients with major depression. To determine metabotropic glutamate receptor-5 (mGluR5) availability, the binding potential (BPND) of [11C]ABP688 was quantified using the simplified reference tissue model. ROI-based analysis revealed that the [11C]ABP688 BPND in the prefrontal cortex was significantly lower in patients than in controls. BPND seed-based functional connectivity analysis revealed significantly reduced connectivity between the inferior parietal cortex and fusiform gyrus/inferior occipital cortex in patients, relative to that observed in controls. Patterns of correlation between [11C]ABP688 BPND and the strength of functional connectivity involving the superior prefrontal cortex seed were opposite in the depression and control groups. Thus, using PET to determine mGluR5 availability revealed related alterations in functional connectivity in the patient group. In addition, Hamilton et al. (2018) conducted whole-brain functional connectivity analysis via fMRI using striatal regions exhibiting significant BPND differences on 11C-raclopride PET as seeds. They examined dopamine D2 receptors using 11C-raclopride PET in patients with major depressive disorder (n = 16) and controls (n = 14). Increased BPND in both the left ventral striatum and right dorsal striatum and decreased functional connectivity between the affected striatal areas and their respective cortical targets were observed in patients with major depressive disorder.
Although previous reports on functional connectivity determined using simultaneous PET/MR are still limited (Table 1), a combination of connectivity data and metabolic/receptor information will be the major approach in future research.
Conclusion
Functional correlations between blood flow and oxygen consumption can be separately estimated using quantitative 15O-gas and water PET. Glucose metabolism during 18F-FDG PET can also be used for functional connectivity analysis. Moreover, PET can provide information regarding the focus of abnormalities, which can then be used for functional connectivity analyses via fMRI. Comparisons between PET and fMRI data may thus allow for improved understanding of the pathophysiology of several brain disorders. Such comparisons may also aid in characterizing individual patients with these disorders.
Author Contributions
Both authors wrote and approved the final version of the manuscript.
Conflict of Interest Statement
The authors declare that the research was conducted in the absence of any commercial or financial relationships that could be construed as a potential conflict of interest.
References
Aiello, M., Cavaliere, C., and Salvatore, M. (2016). Hybrid PET/MR imaging and brain connectivity. Front. Neurosci. 10:64. doi: 10.3389/fnins.2016.00064
Aoe, J., Watabe, T., Shimosegawa, E., Kato, H., Kanai, Y., Naka, S., et al. (2018). Evaluation of the default-mode network by quantitative (15)O-PET: comparative study between cerebral blood flow and oxygen consumption. Ann. Nucl. Med. 32, 485–491. doi: 10.1007/s12149-018-1272-x
Buckner, R. L., Andrews-Hanna, J. R., and Schacter, D. L. (2008). The brain’s default network: anatomy, function, and relevance to disease. Ann. N. Y. Acad. Sci. 1124, 1–38. doi: 10.1196/annals.1440.011
Chen, D., Lu, J., Zhou, H., Jiang, J., Wu, P., Guo, Q., et al. (2018). Glucose metabolic brain network differences between chinese patients with lewy body dementia and healthy control. Behav. Neurol. 2018:8420658. doi: 10.1155/2018/8420658
Di, X., Biswal, B. B., and Alzheimer’s Disease Neuroimaging Initiative. (2012). Metabolic brain covariant networks as revealed by FDG-PET with reference to resting-state fMRI networks. Brain Connect. 2, 275–283. doi: 10.1089/brain.2012.0086
Greicius, M. D., Krasnow, B., Reiss, A. L., and Menon, V. (2003). Functional connectivity in the resting brain: a network analysis of the default mode hypothesis. Proc. Natl. Acad. Sci. U.S.A. 100, 253–258. doi: 10.1073/pnas.0135058100
Hamilton, J. P., Sacchet, M. D., Hjornevik, T., Chin, F. T., Shen, B., Kampe, R., et al. (2018). Striatal dopamine deficits predict reductions in striatal functional connectivity in major depression: a concurrent (11)C-raclopride positron emission tomography and functional magnetic resonance imaging investigation. Transl. Psychiatry 8:264. doi: 10.1038/s41398-018-0316-2
Hatazawa, J., Sasajima, T., Shimosegawa, E., Fujita, H., Okudera, T., Kanno, I., et al. (1996). Regional cerebral blood flow response in gray matter heterotopia during finger tapping: an activation study with positron emission tomography. AJNR Am. J. Neuroradiol. 17, 479–482.
Jamadar, S. D., Ward, P. G., Li, S., Sforazzini, F., Baran, J., Chen, Z., et al. (2019). Simultaneous task-based BOLD-fMRI and [18-F] FDG functional PET for measurement of neuronal metabolism in the human visual cortex. Neuroimage 189, 258–266. doi: 10.1016/j.neuroimage.2019.01.003
Kim, J. H., Joo, Y. H., Son, Y. D., Kim, J. H., Kim, Y. K., Kim, H. K., et al. (2019). In vivo metabotropic glutamate receptor 5 availability-associated functional connectivity alterations in drug-naive young adults with major depression. Eur. Neuropsychopharmacol. 29, 278–290. doi: 10.1016/j.euroneuro.2018.12.001
Marchitelli, R., Aiello, M., Cachia, A., Quarantelli, M., Cavaliere, C., Postiglione, A., et al. (2018). Simultaneous resting-state FDG-PET/fMRI in alzheimer disease: relationship between glucose metabolism and intrinsic activity. Neuroimage 176, 246–258. doi: 10.1016/j.neuroimage.2018.04.048
McCormick, E. M., and Telzer, E. H. (2018). Contributions of default mode network stability and deactivation to adolescent task engagement. Sci. Rep. 8:18049. doi: 10.1038/s41598-018-36269-4
Pagani, M., Giuliani, A., Oberg, J., De Carli, F., Morbelli, S., Girtler, N., et al. (2017). Progressive disintegration of brain networking from normal aging to alzheimer disease: analysis of independent components of (18)F-FDG PET data. J. Nucl. Med. 58, 1132–1139. doi: 10.2967/jnumed.116.184309
Passow, S., Specht, K., Adamsen, T. C., Biermann, M., Brekke, N., Craven, A. R., et al. (2015). Default-mode network functional connectivity is closely related to metabolic activity. Hum. Brain Mapp. 36, 2027–2038. doi: 10.1002/hbm.22753
Raichle, M. E. (2015). The brain’s default mode network. Annu. Rev. Neurosci. 38, 433–447. doi: 10.1146/annurev-neuro-071013-014030
Raichle, M. E., MacLeod, A. M., Snyder, A. Z., Powers, W. J., Gusnard, D. A., and Shulman, G. L. (2001). A default mode of brain function. Proc. Natl. Acad. Sci. U.S.A. 98, 676–682. doi: 10.1073/pnas.98.2.676
Savio, A., Funger, S., Tahmasian, M., Rachakonda, S., Manoliu, A., Sorg, C., et al. (2017). Resting-state networks as simultaneously measured with functional MRI and PET. J. Nucl. Med. 58, 1314–1317. doi: 10.2967/jnumed.116.185835
Vanicek, T., Hahn, A., Traub-Weidinger, T., Hilger, E., Spies, M., Wadsak, W., et al. (2016). Insights into intrinsic brain networks based on graph theory and PET in right- compared to left-sided temporal lobe epilepsy. Sci. Rep. 6:28513. doi: 10.1038/srep28513
Verger, A., and Guedj, E. (2018). The renaissance of functional (18)F-FDG PET brain activation imaging. Eur. J. Nucl. Med. Mol. Imaging. 45, 2338–2341. doi: 10.1007/s00259-018-4165-2
Villien, M., Wey, H. Y., Mandeville, J. B., Catana, C., Polimeni, J. R., Sander, C. Y., et al. (2014). Dynamic functional imaging of brain glucose utilization using fPET-FDG. Neuroimage 100, 192–199. doi: 10.1016/j.neuroimage.2014.06.025
Watabe, T., Shimosegawa, E., Kato, H., Isohashi, K., Ishibashi, M., Tatsumi, M., et al. (2014). Paradoxical reduction of cerebral blood flow after acetazolamide loading: a hemodynamic and metabolic study with (15)O PET. Neurosci. Bull. 30, 845–856. doi: 10.1007/s12264-013-1459-z
Wehrl, H. F., Hossain, M., Lankes, K., Liu, C. C., Bezrukov, I., Martirosian, P., et al. (2013). Simultaneous PET-MRI reveals brain function in activated and resting state on metabolic, hemodynamic and multiple temporal scales. Nat. Med. 19, 1184–1189. doi: 10.1038/nm.3290
Wehrl, H. F., Wiehr, S., Divine, M. R., Gatidis, S., Gullberg, G. T., Maier, F. C., et al. (2014). Preclinical and translational PET/MR imaging. J. Nucl. Med. 55(Suppl. 2), 11S–18S. doi: 10.2967/jnumed.113.129221
Yakushev, I., Drzezga, A., and Habeck, C. (2017). Metabolic connectivity: methods and applications. Curr. Opin. Neurol. 30, 677–685. doi: 10.1097/WCO.0000000000000494
Yokoi, T., Watanabe, H., Yamaguchi, H., Bagarinao, E., Masuda, M., Imai, K., et al. (2018). Involvement of the precuneus/posterior cingulate cortex is significant for the development of alzheimer’s disease: a PET (THK5351, PiB) and resting fMRI study. Front. Aging Neurosci. 10:304. doi: 10.3389/fnagi.2018.00304
Yu, R., Park, H. J., Cho, H., Ko, A., Pae, C., Oh, M. K., et al. (2018). Interregional metabolic connectivity of 2-deoxy-2[(18) F]fluoro-D-glucose positron emission tomography in vagus nerve stimulation for pediatric patients with epilepsy: a retrospective cross-sectional study. Epilepsia 59, 2249–2259. doi: 10.1111/epi.14590
Keywords: PET, functional connectivity, default mode network, blood flow, metabolism
Citation: Watabe T and Hatazawa J (2019) Evaluation of Functional Connectivity in the Brain Using Positron Emission Tomography: A Mini-Review. Front. Neurosci. 13:775. doi: 10.3389/fnins.2019.00775
Received: 22 February 2019; Accepted: 10 July 2019;
Published: 26 July 2019.
Edited by:
Nicoletta Cera, University of Porto, PortugalReviewed by:
Anne Lise Pitel, University of Caen Normandy, FranceMaria Mathew D’Souza, Institute of Nuclear Medicine & Allied Sciences (DRDO), India
Copyright © 2019 Watabe and Hatazawa. This is an open-access article distributed under the terms of the Creative Commons Attribution License (CC BY). The use, distribution or reproduction in other forums is permitted, provided the original author(s) and the copyright owner(s) are credited and that the original publication in this journal is cited, in accordance with accepted academic practice. No use, distribution or reproduction is permitted which does not comply with these terms.
*Correspondence: Tadashi Watabe, d2F0YWJlQHRyYWNlci5tZWQub3Nha2EtdS5hYy5qcA==
†Present address: Jun Hatazawa, Joint Research Division for the Quantum Cancer Therapy, Research Center for Nuclear Physics, Osaka University, Osaka, Japan