 Lining Su
 Sufen Chen2
94% of researchers rate our articles as excellent or good
Learn more about the work of our research integrity team to safeguard the quality of each article we publish.
Find out more
ORIGINAL RESEARCH article
Front. Neurosci., 03 July 2019
Sec. Neurogenomics
Volume 13 - 2019 | https://doi.org/10.3389/fnins.2019.00633
This article is part of the Research TopicMulti-“omics” in Neurodevelopmental DisordersView all 5 articles
Alzheimer's disease (AD), also known as senile dementia, is a progressive neurodegenerative disease. The etiology and pathogenesis of AD have not yet been elucidated. We examined common differentially expressed genes (DEGs) from different AD tissue microarray datasets by meta-analysis and screened the AD-associated genes from the common DEGs using GCBI. Then we studied the gene expression network using the STRING database and identified the hub genes using Cytoscape. Furthermore, we analyzed the microRNAs (miRNAs), long non-coding RNAs (lncRNAs), and single nucleotide polymorphisms (SNPs) associated with the AD-associated genes, and then identified feed-forward loops. Finally, we performed SNP analysis of the AD-associated genes. Our results identified 207 common DEGs, of which 57 have previously been reported to be associated with AD. The common DEG expression network identified eight hub genes, all of which were previously known to be associated with AD. Further study of the regulatory miRNAs associated with the AD-associated genes and other genes specific to neurodegenerative diseases revealed 65 AD-associated miRNAs. Analysis of the miRNA associated transcription factor-miRNA-gene-gene associated TF (mTF-miRNA-gene-gTF) network around the AD-associated genes revealed 131 feed-forward loops (FFLs). Among them, one important FFL was found between the gene SERPINA3, hsa-miR-27a, and the transcription factor MYC. Furthermore, SNP analysis of the AD-associated genes identified 173 SNPs, and also found a role in AD for miRNAs specific to other neurodegenerative diseases, including hsa-miR-34c, hsa-miR-212, hsa-miR-34a, and hsa-miR-7. The regulatory network constructed in this study describes the mechanism of cell regulation in AD, in which miRNAs and lncRNAs can be considered AD regulatory factors.
Alzheimer's disease (AD) is the most well-reported neurodegenerative disease, and seriously affects patients' ability to perform daily activities. The characteristic pathological changes of AD are the formation of extracellular amyloid plaques by abnormal amyloid beta accumulation, the formation of intracellular neurofibrillary tangles by tau hyperphosphorylation, and neuronal loss with gliosis proliferation (Huttenrauch et al., 2018). The etiology and pathogenesis of AD have not yet been elucidated.
To identify the genetic variation in AD, large cohort studies have been carried out. The expression of stromal interaction molecule 1 (STIM1) protein decreases with the progression of neurodegeneration in AD by triggering voltage-regulated Ca2+ entry-dependent cell death (Pascual-Caro et al., 2018). The cerebrospinal fluid levels of C-X3-C motif chemokine ligand 1 which is a chemokine expressed by neurons, are decreased in AD dementia patients compared with controls (Perea et al., 2018). Genome-wide association studies (GWAS) studies have also revealed that some single nucleotide polymorphisms (SNPs) contribute to AD disease onset. These include common variants such as estrogen receptor 1 (ESR1), presenilin 1 (PSEN1), cholinergic receptor muscarinic 2 (CHRM2), cholinergic receptor muscarinic 3 (CHRM3), apolipoprotein E (APOE), apolipoprotein C1 (APOC1), and choline acetyltransferase (CHAT) (Zhou et al., 2014; Liu et al., 2016; Bagyinszky et al., 2018; Chee and Cumming, 2018; Li et al., 2018), and also rare variants in genes such as eukaryotic translation initiation factor 2 alpha kinase 3 (EIF2AK3) (Wong et al., 2018). EIF2AK3 is a single-pass type 1 membrane protein, which represses global protein synthesis as an endoplasmic reticulum stress sensor (Liu et al., 2012). Several SNPs within EIF2AK3 appear to significantly increase the risk of AD (Liu et al., 2013), especially rs147458427, an SNP that changes arginine to histidine at amino acid 240 (R240H) (Wong et al., 2018). Although EIF2AK3 polymorphisms are related to a risk of delayed AD (Liu et al., 2013), their function in neurodegenerative diseases is not very clear.
Different microRNAs (miRNAs) are also associated with the pathophysiology of several neurodegenerative diseases (Gaughwin et al., 2011; Zovoilis et al., 2011), including AD (Kumar and Reddy, 2018). miRNA-377 promotes cell proliferation and inhibits cell apoptosis by regulating the expression level of cadherin 13 (CDH13), thus participating in the development of AD (Liu et al., 2018). The level of miR-221 is downregulated in AD cases compared with controls, and it is potentially a new therapeutic target for increasing ADAM metallopeptidase domain 10 (ADAM10) levels in AD (Manzine et al., 2018).
Long non-coding RNAs (lncRNAs) are widely reported to be associated with various physiological and pathological processes, such as neurodegenerative diseases (Wang et al., 2016; Wang D. Q. et al., 2018). Brain cytoplasmic (BC) RNA is a lncRNA present at higher levels in the AD-affected region of the brain than in normal brain (Mus et al., 2007), and overexpression of BC in AD may cause synaptic/dendritic degeneratio (Wang H. et al., 2018).
miRNAs function by targeting mRNAs for cleavage or translational repression. lncRNAs may affect miRNA activity by chelating them, thereby upregulating the expression of the miRNA target genes. The study of gene regulatory networks is important for disease analysis (Rankin and Zorn, 2014). However, research on the association of these AD markers in the context of biological networks is limited. To understand AD correctly, regulatory networks involving genes, miRNAs, transcription factors (TF), and lncRNAs need to be studied.
We used “Alzheimer” as a keyword to search for gene expression studies from different brain tissues in the NCBI-GEO database (http://www.ncbi.nlm.nih.gov/geo/). Only original experimental studies that screened for genes differing between AD and healthy humans were selected. Our criteria were as follows: (1) the type of dataset was expression profiling by array; (2) the brain regions were the entorhinal cortex (EC), hippocampus (HIP), and medial temporal gyrus (MTG); (3) for each brain tissue dataset, the total number of available samples were ≥10. Finally, the samples from seven studies including three tissues (EC, HIP, and MTG) were screened out. We then performed a meta-analysis of three datasets from EC tissue (GSE48350, GSE5281, and GSE26927), five datasets from HIP tissue (GSE5281, GSE36980, GSE1297, GSE29378, and GSE48350), and two datasets from MTG tissue (GSE5281 and GSE84422). A detailed description of the microarray datasets is presented in Table 1. Detailed descriptions of the samples, including the brain regions, sex, and mean age, are provided in Table S1.
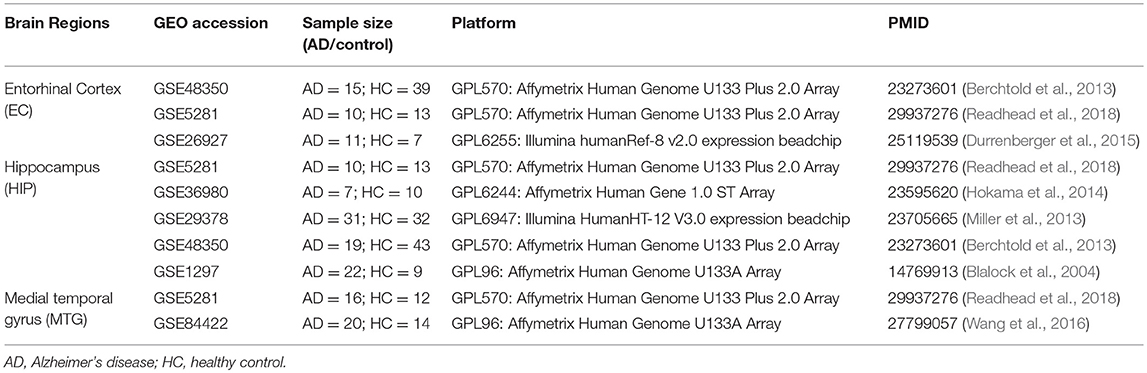
Table 1. Datasets used in the meta-analysis.
Searches were executed up to October 2017.
Background correction and normalization of each individual dataset were performed using Robust Multichip Averaging (RMA) (Taminau et al., 2012). The differentially expressed genes (DEGs) between AD and healthy control samples (HC) were computed using the limma package (Derkow et al., 2018) in R. Gene symbol probes without gene annotation were removed. When multiple probes were matched with the same gene, the average value was used as the expression value.
Datasets from the same brain region (EC, HIP, or MTG) were combined to perform the meta-analysis. Initially, the data files were normalized using RMA. The normalized datasets were then merged using Fisher's exact test in the MetaDE package (Wang et al., 2012). The differentially expressed genes (DEGs) between AD and HC were selected using a P < 0.05 as the cut-off (Figure 1). In addition, the heterogeneity tests and differential expression analysis for each gene were analyzed using the ES algorithm of the MetaDE package in R (Wang et al., 2012). When multiple probes were matched with the same gene, we chose the average fold change of each probe. The thresholds of homogeneity were set as meta fold change > 1, tau2 = 0, and FDR > 0.05. The genes with tau2 = 0 and FDR > 0.05 were considered homogeneous and unbiased, from which the genes with a P < 0.05 in the Fisher's exact test of the MetaDE package were selected as DEGs. Tau2 represents the difference among study samples and reflects the heterogeneity between studies. The smaller the tau2 value, the smaller the heterogeneity.
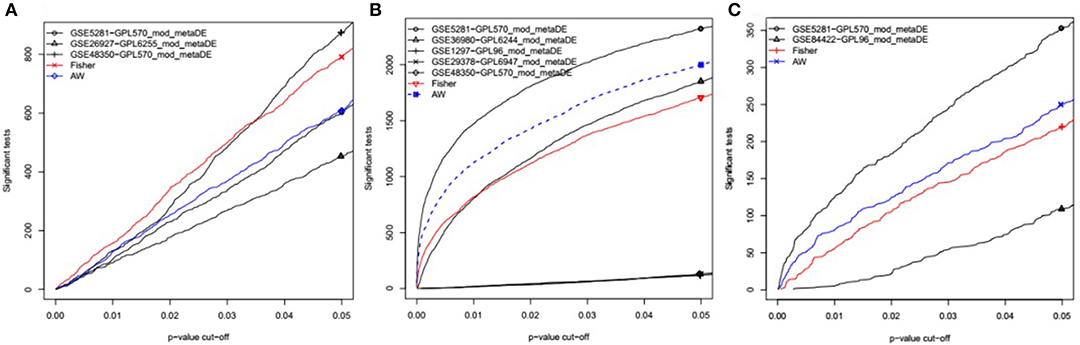
Figure 1. P-value vs. number of detected DEGs for individual analysis as well as meta-analysis. In each individual dataset, moderated-t statistics was used to generate p-values while adaptive weight and Fisher's methods were utilized to combine these p-values for meta-analysis. This figure is generated using the “MetaDE” package in R. (A) The datasets from Entorhinal Cortex; (B) the datasets from Hippocampus; (C) the datasets from Medial temporal gyrus.
In this study, sub-meta-analyses on males and females with GSEs from different tissues were performed. The methods of normalization, meta-analysis, heterogeneity detection of each gene and threshold for selecting DEGs were the same as above.
We searched for gene expression studies from the NCBI-GEO database according to our criteria. The criteria were: (1) original studies between AD and healthy humans; (2) the type of dataset was expression profiling by high-throughput sequencing; (3) the brain regions used were EC, HIP, and MTG; (4) RNA-Seq data with poor quality controls were excluded. Finally, one gene expression dataset was selected, GSE67333, which uses samples from hippocampi brain regions and is based on GPL11154 platform information. Detailed information on these RNA-Seq samples is shown in Table S2. The available analyzed expression profiles of GSE67333 were used (Moradifard et al., 2018).
STRING is a protein interaction network analysis tool. The latest version of the STRING database is 11.0 (Szklarczyk et al., 2019), which covers more than 5,090 species and 24.6 million proteins and supports the upload of genome-level data sets. To determine which proteins encoded by the DEGs play a leading role in AD, the DEGs were subjected to STRING v.11.0 with medium confidence scores of 0.4. To identify the hub nodes, we visualized the protein–protein interaction (PPI) network using Cytoscape v.3.6.0 software and analyzed the topological properties of these nodes using the Network Analyzer tool based on the degree parameter (Shannon et al., 2003). Then we selected the nodes with high degrees and high closeness centrality values as hubs. The degree is the number of protein-specific interactions, and a high value reflects an important role in the network. The closeness centrality reflects the ability of nodes to influence other nodes in the network, which reveals the centrality of the node in the network.
The Gene Radar online tool in GCBI (Shanghai, China, https://www.gcbi.com.cn/gclib/html/index) mainly uses the disease classification in the Mesh database to mine correspondence between genes and diseases from the PubMed database. We used Gene Radar to identify the DEGs associated with AD and those associated with other neurodegenerative diseases.
DIANA-Tarbase v.8.0, containing 670,000 unique experimentally-supported miRNA–gene pairs (Karagkouni et al., 2018), was used to analyze the miRNAs associated with the AD-associated and other neurodegenerative disease-associated DEGs. Then, the miRNAs associated with AD and other neurodegenerative diseases were filtered using the miRdSNP v.11.03 online database (Bruno et al., 2012).
DIANA-LncBase Experimental v.2, which provides more than 70,000 low- and high-throughput experimentally-supported miRNA–lncRNA interactions (Paraskevopoulou et al., 2016), was used to examine interactions between lncRNAs and these miRNAs. In our study, experimentally validated (prediction score ≥ 0.90) lncRNAs in human brain tissue were selected.
High-throughput data on miRNAs in AD is rare, so we collected only one miRNA microarray dataset in GEO (GSE16759), which studied miRNA expression in AD patients and controls (Nunez-Iglesias et al., 2010). The differentially expressed miRNAs were screened using the GEO2R tool, which is an interactive web tool based on GEO query and limma R packages (Davis and Meltzer, 2007).
To study the molecular regulatory mechanisms in AD, we built regulatory networks comprising AD-associated/other neurodegenerative disease-associated DEGs, TFs associated with these genes (gTFs), AD-associated/other neurodegenerative disease-associated miRNAs targeting these genes, and TFs related to these miRNAs (mTFs).
Information on the TF binding sites associated with these genes were studied using TRANSFAC (Fogel et al., 2005) based on the Match™ algorithm. The TRANSFAC database comprises eukaryotic transcription factors, DNA binding sites, and their effects on gene expression (Fogel et al., 2005). In our study, the matrix similarity score (MSS) and the core similarity score (CSS) were used to estimate the result. The threshold values of MSS and CSS for selection were both score = 1.
Regulatory information on the TFs associated with these miRNAs was analyzed using TransmiR v.2.0 database, an updated TF–miRNA regulation database (Wang et al., 2010). In our study, the literature-curated TF–miRNA regulations and the TF–miRNA interactions from ChIP-Seq evidence in human neural tissue were selected.
In order to verify the positive finding, FFL between the gene SERPINA3, hsa-miR-27a, and TF MYC, we collected GSE16759 dataset, which jointly profiled mRNA and miRNA expression in AD patients and controls (Nunez-Iglesias et al., 2010). The differentially expressed mRNA and miRNAs were screened using the GEO2R tool (Davis and Meltzer, 2007).
To further verify the positive finding, GSE46579 dataset which studied miRNA expression in AD patients and controls blood and GSE97760 dataset which studied mRNA expression in AD patients and controls blood were collected. The available analyzed expression profiles of GSE46579 were used (Leidinger et al., 2013). The differentially expressed mRNA were also screened using the GEO2R tool.
To identify the AD-associated SNPs, SNP analysis of the AD-associated DEGs was performed. We used miRdSNP v.11.03 (Bruno et al., 2012) and LincSNP v.2.0 (Ning et al., 2014) to identify AD-associated SNPs associated with AD-associated DEGs (Yousef, 2015) Chromosome locus and allele gene information associated with each of the SNPs were received from dbSNP database (https://www.ncbi.nlm.nih.gov/snp/?term=).
Each individual dataset selected for use in the meta-analysis were corrected and normalized using the oligopackage (Liu et al., 2018) in R. All results are shown in Additional Figures, parts of which are shown in Figure 2.
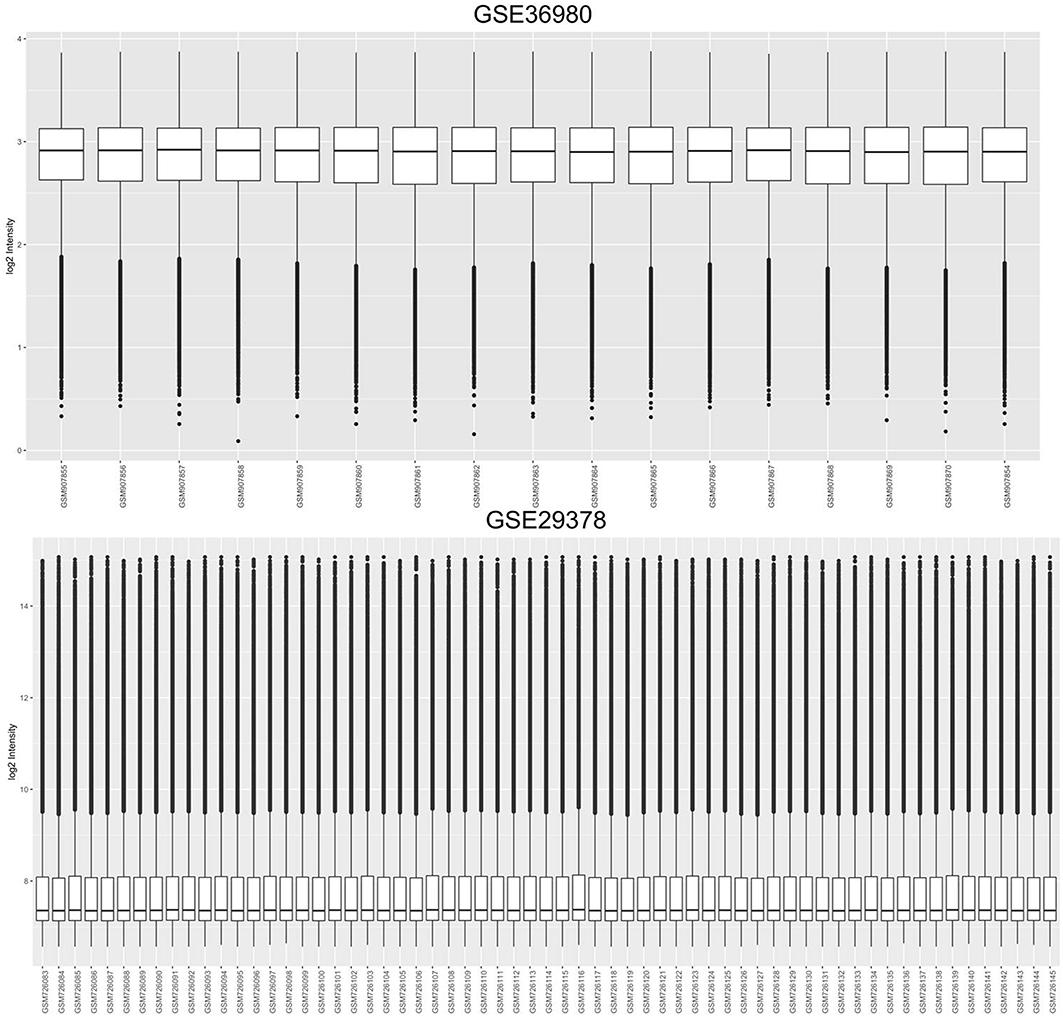
Figure 2. Cassette figures of the expression data after standardization.
To identify common DEGs in different brain regions between AD and healthy controls, microarray datasets (Table 1) from three different brain regions (EC, HIP, and MTG) were meta-analyzed using the “MetaDE” package in R. With the threshold of P < 0.05 in Fisher's exact test, 781 DEGs in the EC brain region, 1707 DEGs in the HIP brain region and 220 DEGs in the MTG brain region were obtained. Then, with the homogeneity thresholds of meta fold change > 1, tau2 = 0, and FDR > 0.05, the DEGs with P < 0.05 in the meta-analysis from each tissue were collected and are shown in Table 2. The final results identified 183 DEGs in the EC brain region (120 upregulated and 63 downregulated), nine DEGs in the HIP brain region (four upregulated and five downregulated) and 15 DEGs in the MTG brain region (14 upregulated and one downregulated). A total of 207 DEGs were identified between the AD and HC samples (Table 2). More details about the DEGs are presented in Table 3, including the meta-expression between AD and HC and the Qpval in the meta-analysis. These 207 genes were identified as DEGs for the subsequent analysis.
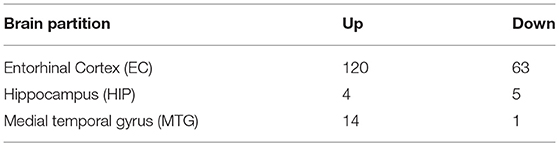
Table 2. DEGs of Alzheimer's disease in different brain regions.
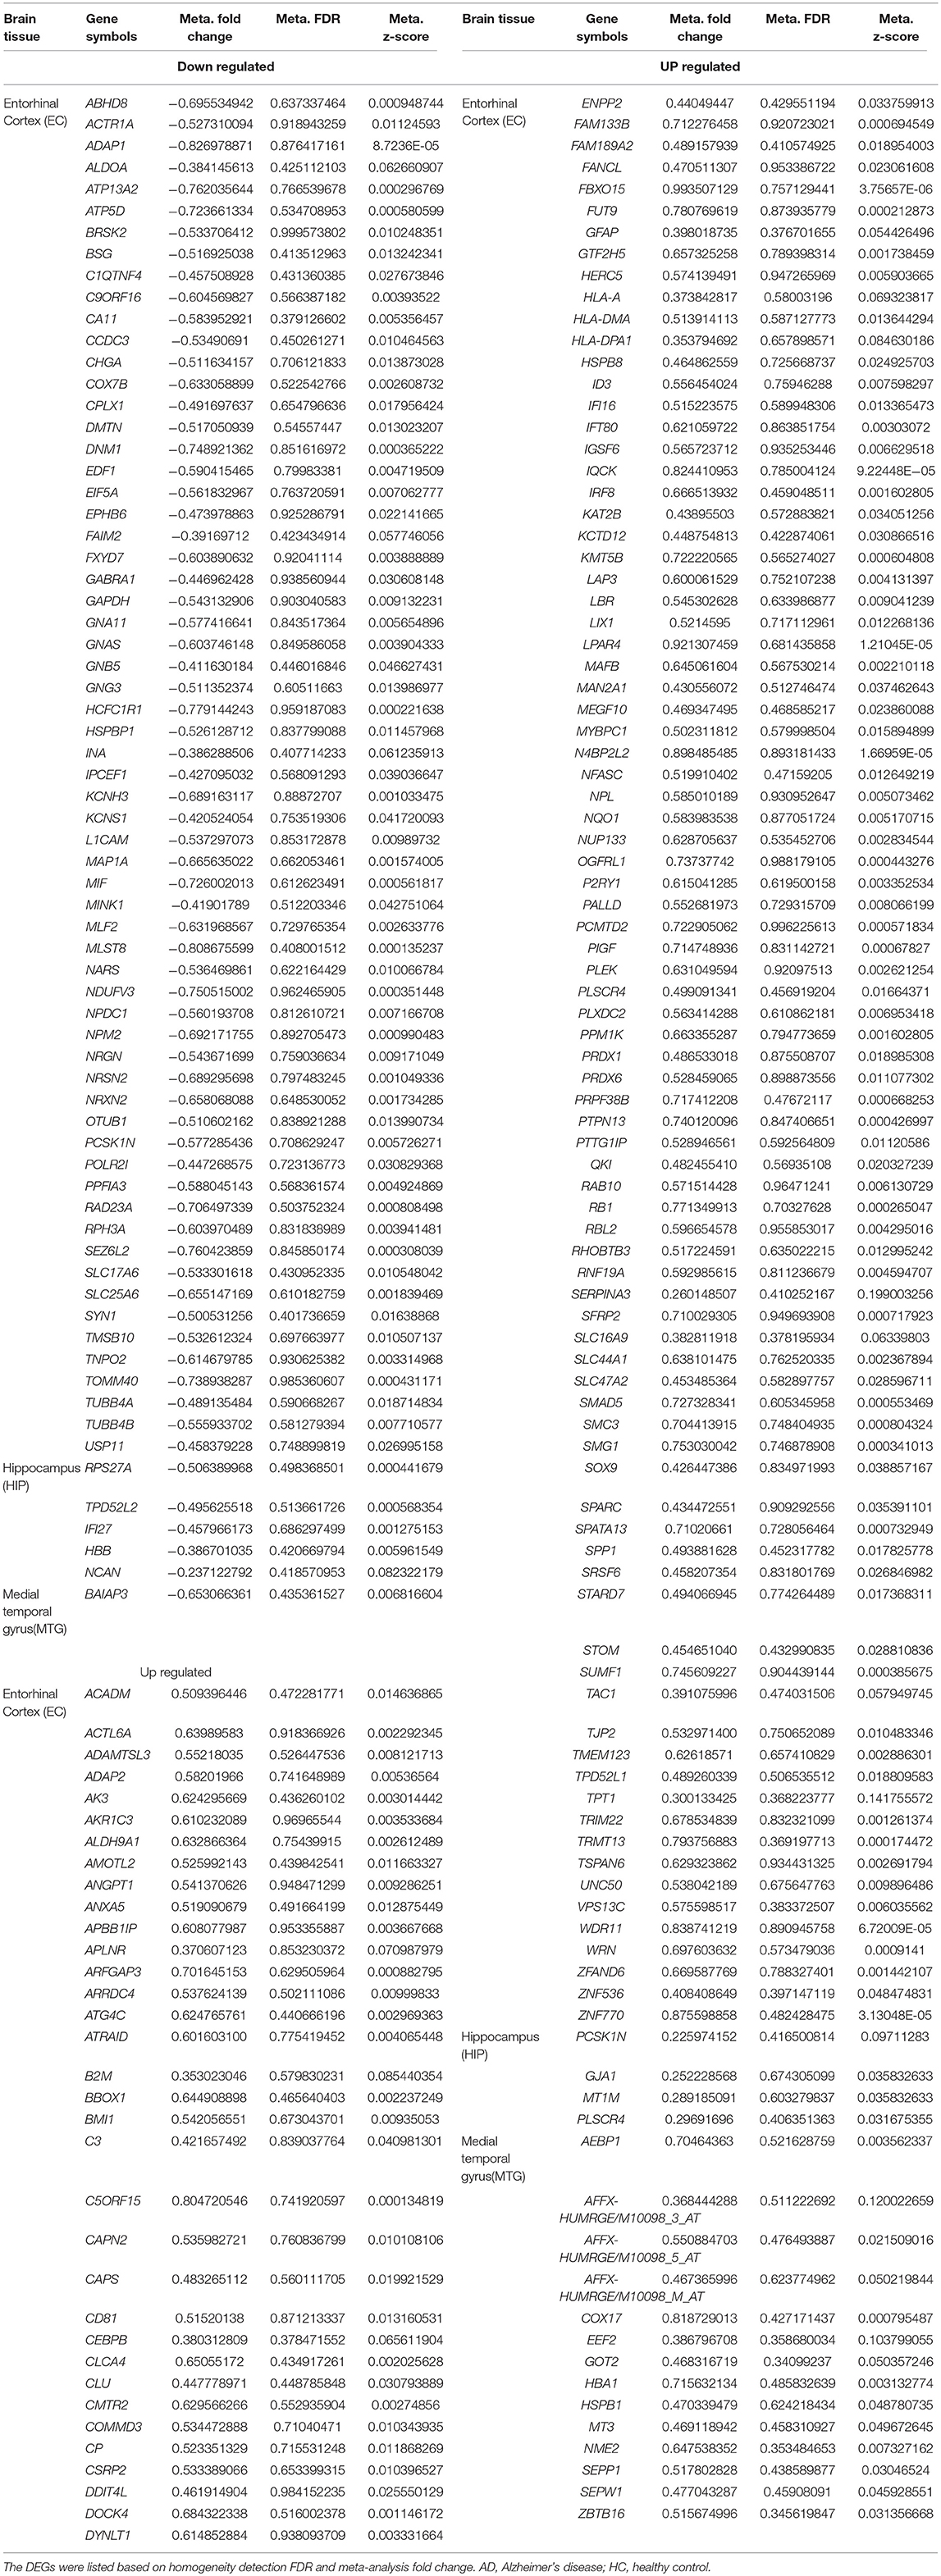
Table 3. Diferentially expressed genes (DEGs) identifed in the meta-analysis of AD datasets.
A sub-meta-analysis on females and males was performed using datasets from each brain region (EC, HIP, and MTG). The results of the sub-meta-analysis of the EC brain region in males and females revealed that there were 217 DEGs in males (176 upregulated and 41 downregulated), of which 212 were male-specific, and 175 DEGs in females (five upregulated and 170 downregulated), of which 170 were female-specific (Table S3). Only five common DEGs were identified in females and males. The result of this analysis is also shown in a Venn diagram (Figure 3).
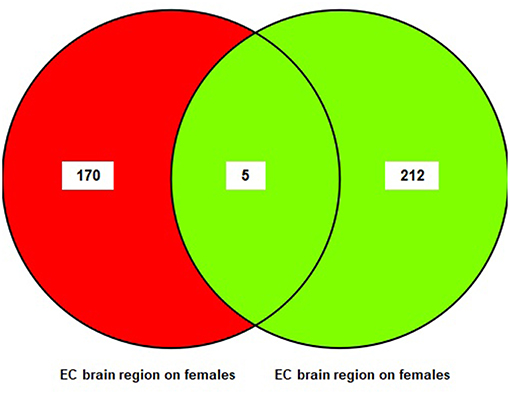
Figure 3. The number of common genes obtained from entorhinal Cortex (EC) in females and males visualized by a Venn diagram.
The results of the sub-meta-analysis of the HIP brain region in males and females showed that there were 11 DEGs in males (one upregulated and 10 downregulated), and 28 DEGs in females (10 upregulated and 18 downregulated). No overlapping DEGs were obtained between females and males (Table S4).
The results of the sub-meta-analysis of the MTG brain region in males and females showed that there were 293 DEGs in males (11 upregulated and 282 downregulated), and 30 DEGs in females (19 upregulated and 11 downregulated) (Table S5). Only one common DEG was identified in females and males. The result of this analysis is also shown in a Venn diagram (Figure 4).
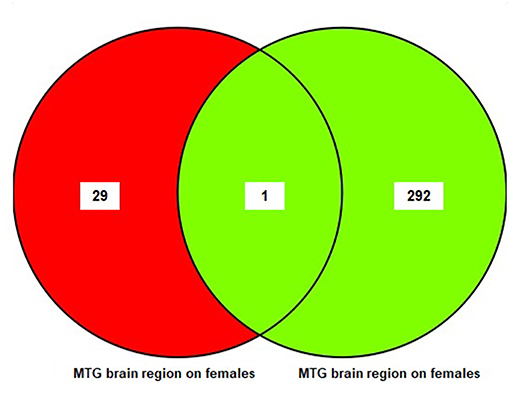
Figure 4. The number of common genes obtained from medial temporal gyrus (MTG) in females and males visualized by a Venn diagram.
To further validate the results from the microarray data with public RNA-Seq data, we selected datasets that used the same brain regions as the microarray datasets. Hence, the DEGs between AD and HC were analyzed in the GSE67333 RNA-Seq dataset. This revealed that 1102 DEGs were filtered from GSE67333 with a threshold of P < 0.05 and fold change ≥ 1.23 (Moradifard et al., 2018). Detailed information on these DEGs is shown in Table S6. Then, we analyzed the common DEGs between the RNA-Seq and microarray data, which revealed 72 common DEGs in the HIP brain region in both the RNA-Seq and microarray data.
AD-associated and other neurodegenerative disease-associated genes were identified from the DEGs using the Gene Radar tool from the GCBI online software. Out of the 207 total DEGs, 57 had previously been shown to be associated with AD (AD-associated genes; 34 upregulated and 23 downregulated), and 43 DEGs had previously been shown to be associated with several other neurodegenerative diseases (other neurodegenerative disease-associated genes; 30 upregulated and 13 downregulated), such as multiple sclerosis, Parkinson's disease (PD) and Huntington disease (HD) (Table 4). Overall, the number of upregulated genes was greater than the number of downregulated genes. These AD-associated or other neurodegenerative disease-associated DEGs are important genes for further research. The detailed down/upregulated status of the 57 AD-associated DEGs in each individual dataset is provided in Table 5.
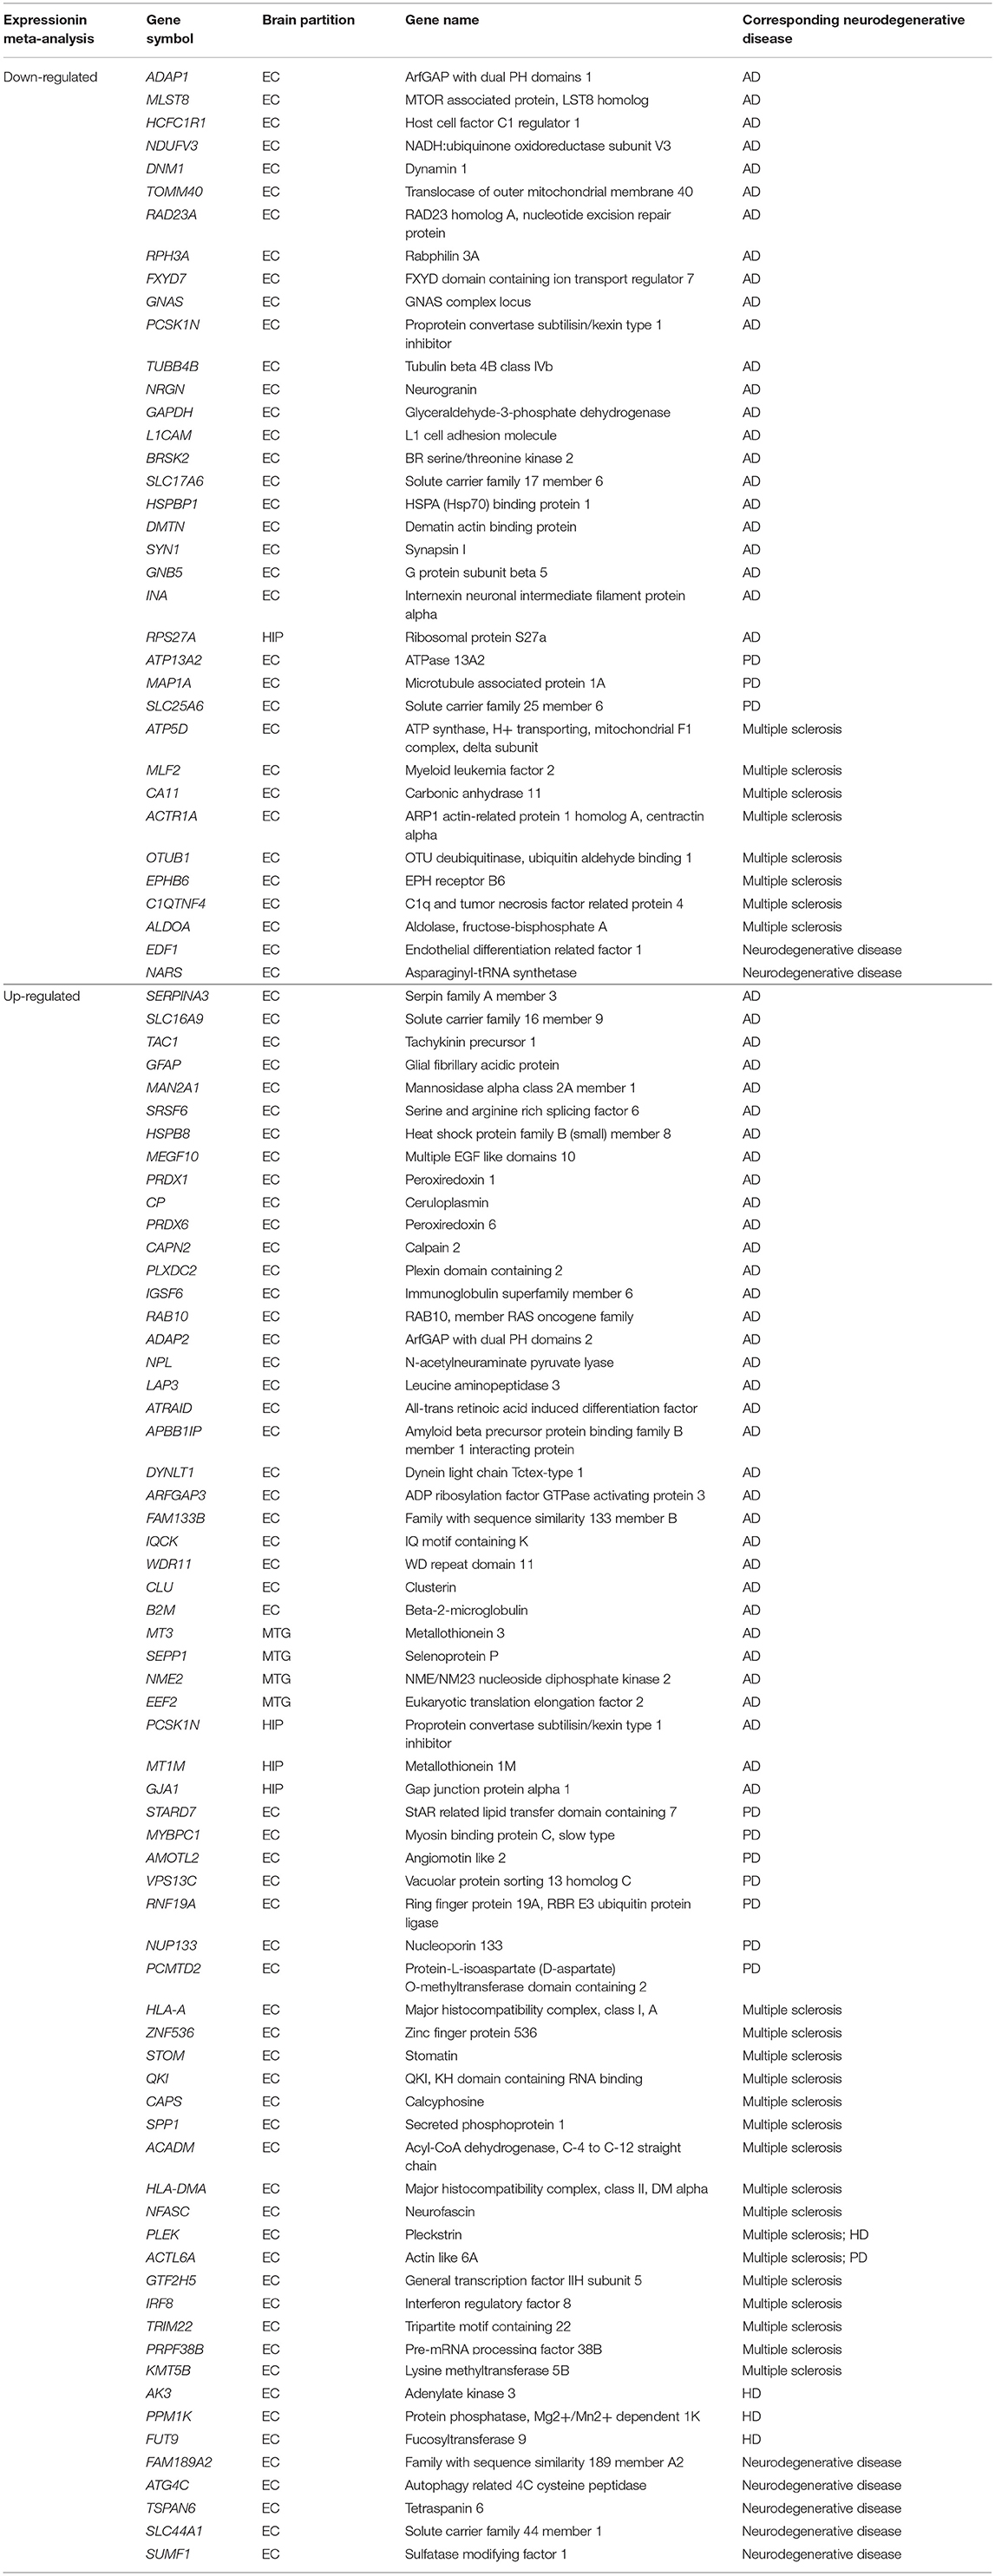
Table 4. AD and other neurodegenerative diseases associate genes identified from DEGs using GCBI online software.
Table 5. The down/up situation of 57 AD-associate genes identified in the meta-analysis in each individual dataset.
The 207 DEGs were subjected to STRING v.11.0 to study the PPI network, and 154 nodes were sorted. The interaction network was then analyzed using the Network Analyzer tool (Shannon et al., 2003) (Figure 5). The 154 genes showed varying degrees of distribution, with a maximum degree of 39 and a minimum degree of 1. The upper eight nodes (top 5% of all nodes) with high degree and high closeness centrality values were chosen as hub nodes (Table 6). These eight hubs (GAPDH, RPS27A, GFAP, B2M, CLU, EEF2, GJA1, and CP) have all previously been found to be involved in the process of AD (Deane et al., 2005; Li et al., 2005; Olah et al., 2011; El Kadmiri et al., 2014; Guerreiro et al., 2015; Kamphuis et al., 2015; Almeida et al., 2018; Karagkouni et al., 2018).
Figure 5. PPI network of the DEGs. Red, up-regulation; green, down-regulation.
Table 6. The hub genes identified from the meta-analysis DEGs.
To investigate the interactions between the AD-associated DEGs and non-coding RNAs, miRNAs associated with these genes were analyzed using the DIANA-Tarbase v.8.0 database. Of these miRNAs, 48 miRNAs were related to AD (Table 7), and 22 miRNAs were associated with other neurodegenerative diseases, such as multiple sclerosis and Parkinson's disease (Table 8). To investigate the interactions between the other neurodegenerative disease-associated DEGs and non-coding RNAs, 17 miRNAs were identified as being related to AD (Table 9). Moreover, most of these miRNAs were in turn regulated by many lncRNAs.
Table 7. AD-associate miRNAs associated with the AD-associate DEGs.
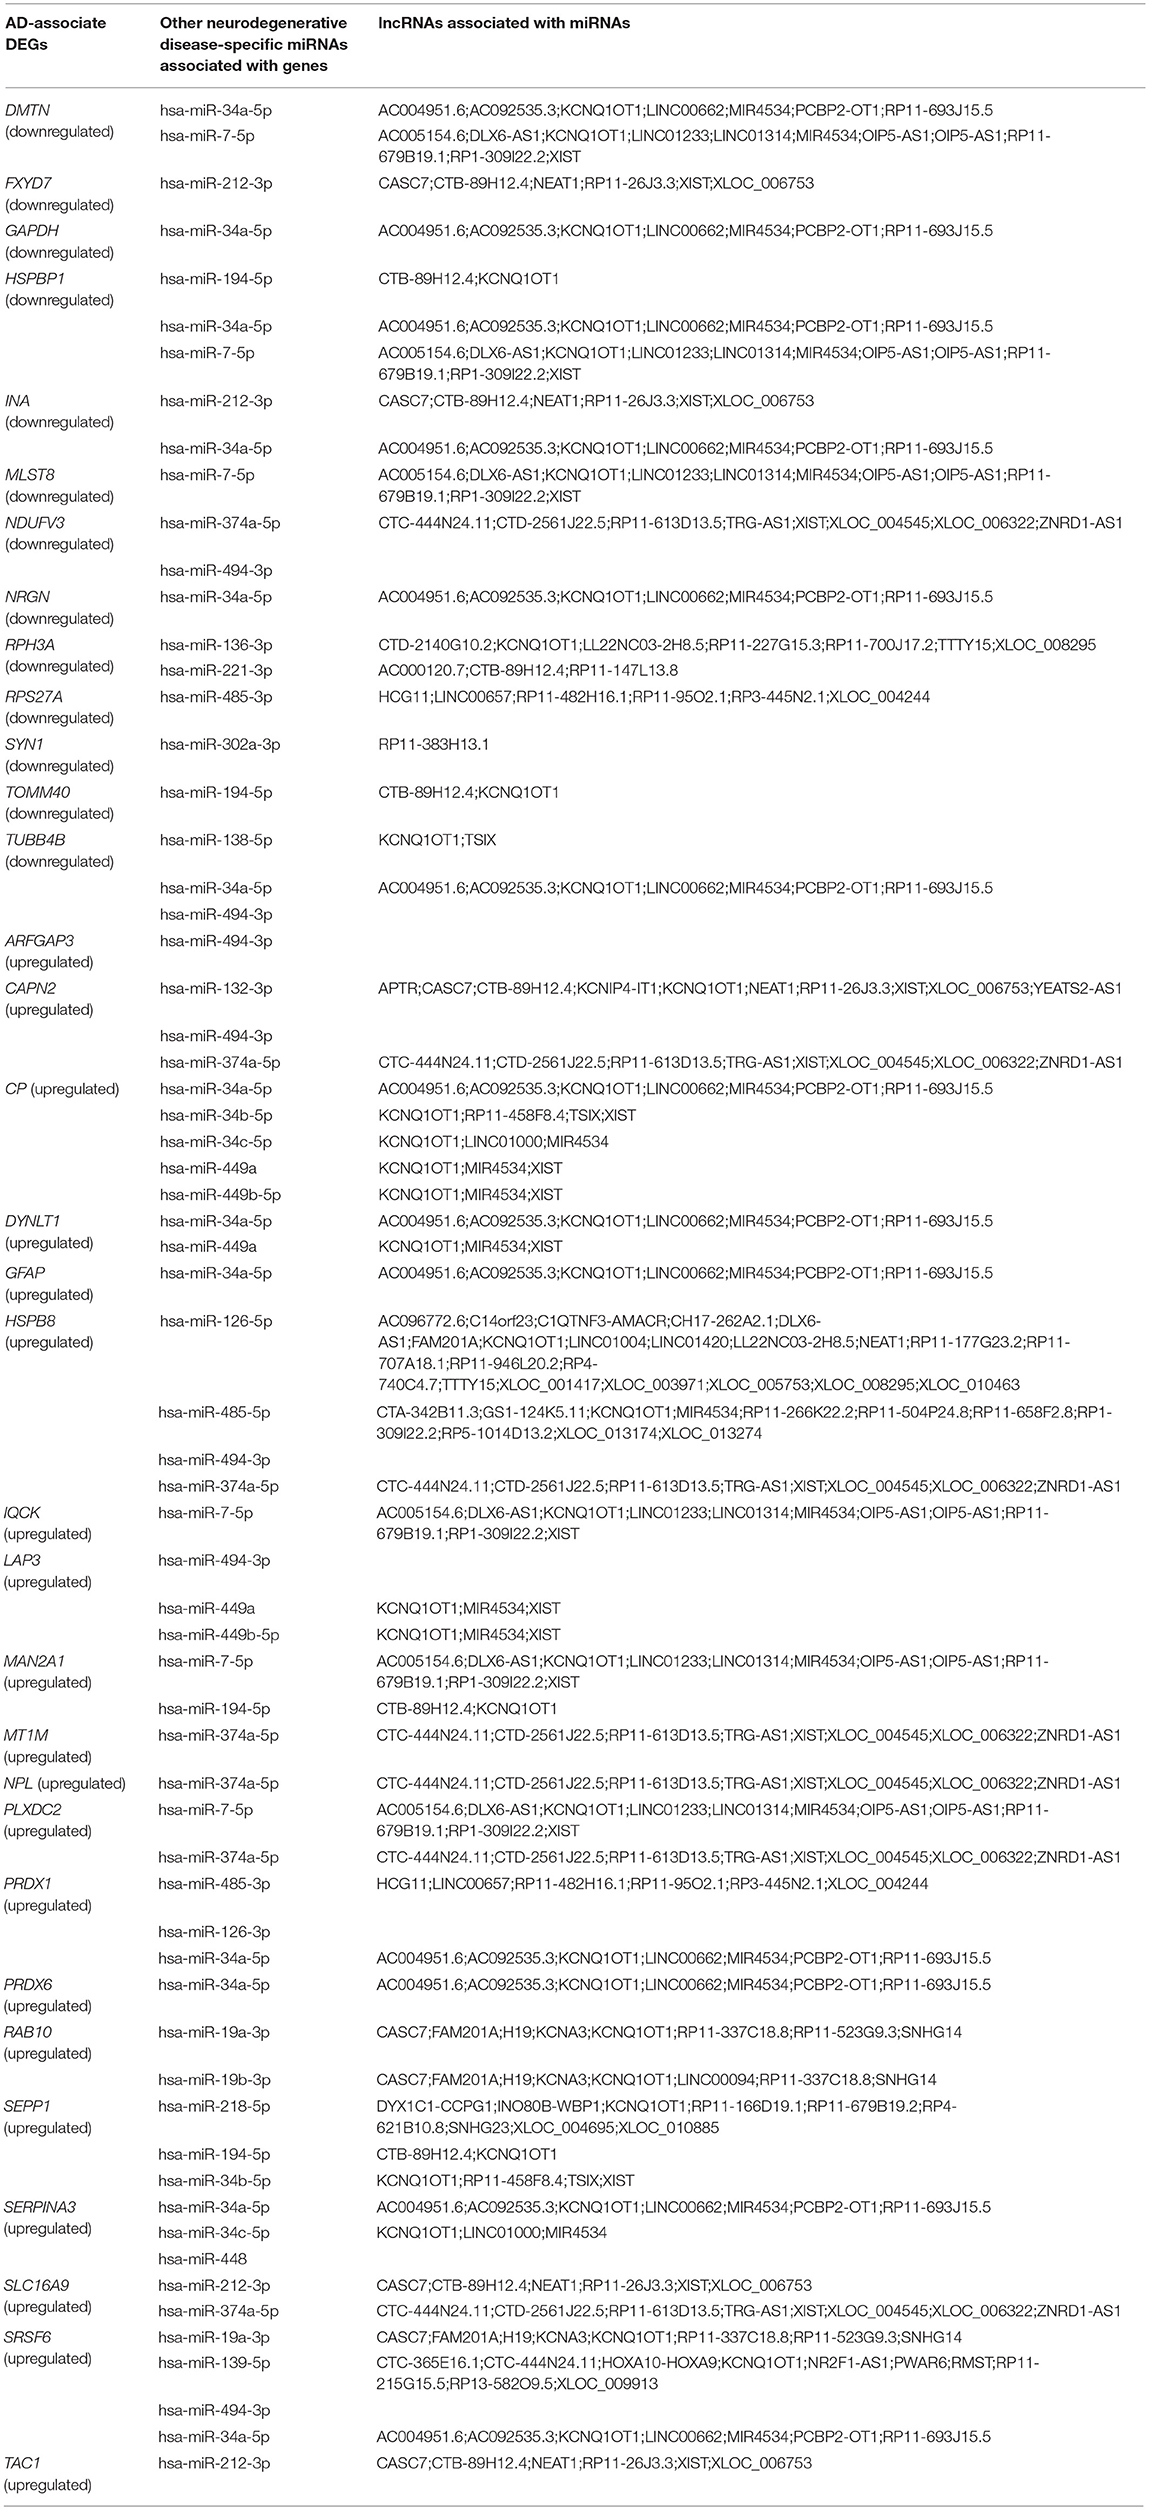
Table 8. Other neurodegenerative disease-specific miRNAs associated with the AD-associate DEGs.
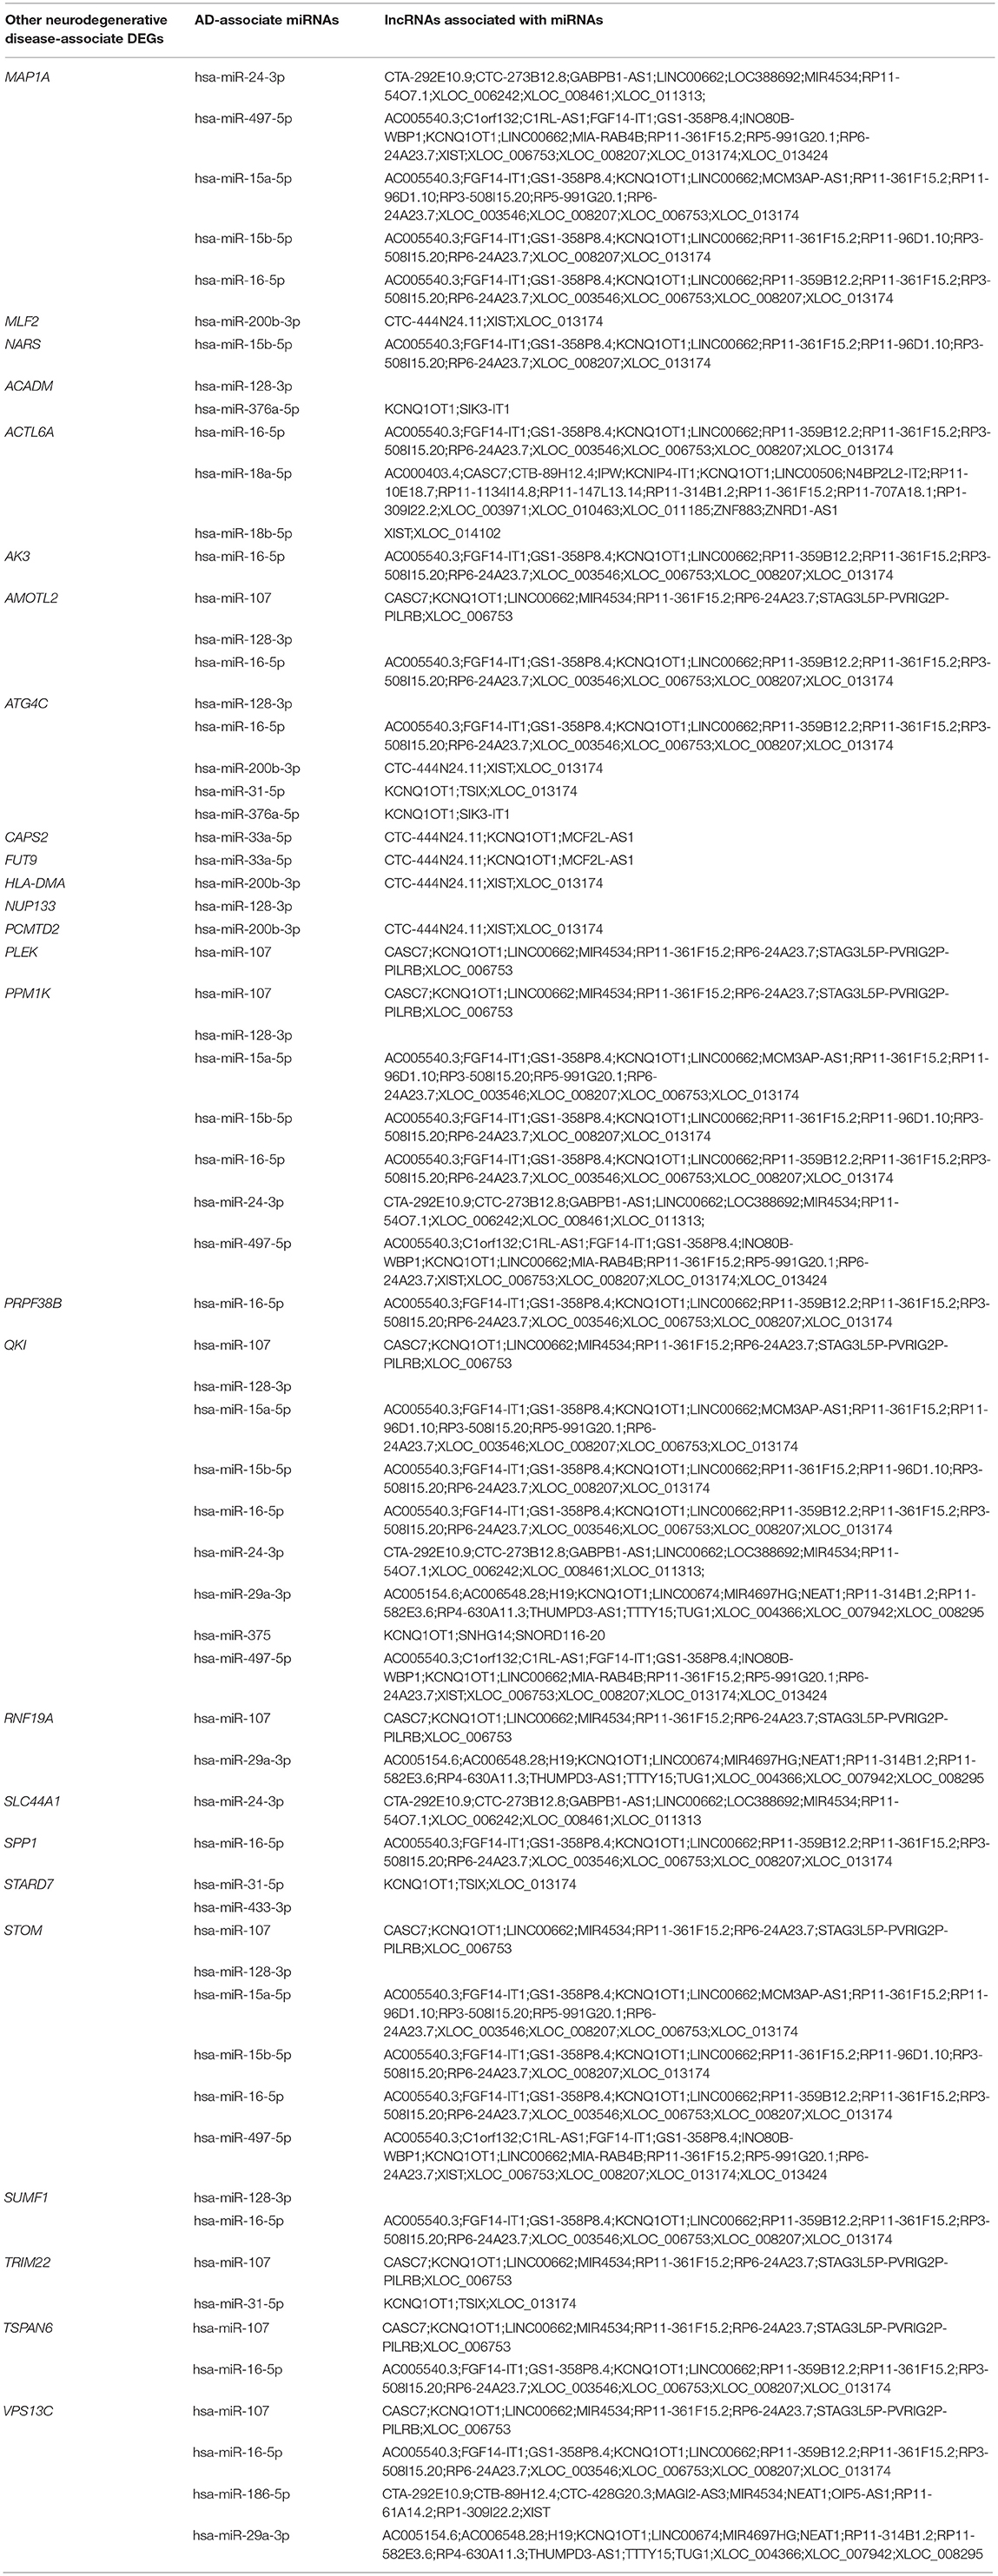
Table 9. AD-associate miRNAs associated with other neurodegenerative disease-associate DEGs.
To study the predicted expression of the AD-associated miRNAs further, a GEO dataset (GSE16759) studying miRNA was analyzed. This revealed 870 differentially expressed miRNAs. Detailed information on these miRNAs is shown in Table S7. Then, we analyzed the miRNAs common to both GSE16759 and our AD-associated miRNAs, and detected 47 of our AD-associated miRNAs in the GEO data. The top 12 significant miRNAs common to both GSE16759 and our AD-associated miRNAs are listed in Table 10.
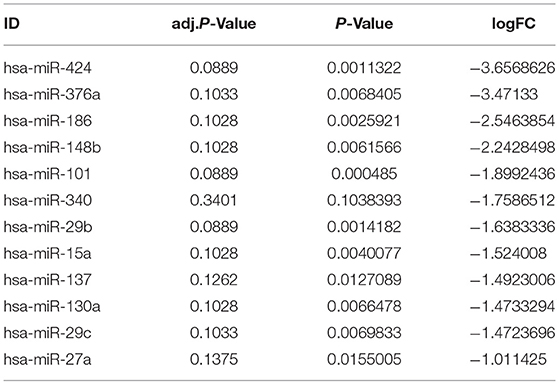
Table 10. The top significant common genes in GSE16759 and our AD-associated miRNA.
By analyzing TF–gene regulation, we found 442 gene-associated TFs (gTFs) associated with 55 AD-associated DEGs (Table S8), and 400 gTFs associated with 42 other neurodegenerative disease-associated DEGs (Table S9).
By studying the regulatory relationships between TFs and miRNAs, we obtained 253 miRNA-associated TFs (mTFs) associated with 50 AD-associated miRNAs (Table S10), and 118 mTFs associated with 22 other neurodegenerative disease-associated miRNAs whose target genes were identified as AD-associated DEGs in our study (Table S11).
A regulatory network was constructed to study the regulatory interactions further, containing the AD-associated DEGs, the TFs associated with these genes (gTFs), the AD-associated miRNAs associated with these genes, the other neurodegenerative disease-associated miRNAs targeting these DEGs, and the TFs related to these miRNAs (mTFs). To study the other neurodegenerative disease-associated DEGs further, the TFs associated with these genes (gTFs), the AD-associated miRNAs targeting these genes, and the TFs related to these miRNAs (mTFs) were also analyzed.
This showed that NFASC and ADAP1 are regulated by the most gTFs, 114 and 111, respectively. NFASC is involved in multiple sclerosis (Kawamura, 2014), and ADAP1 is involved in AD (Stricker and Reiser, 2014). We also found gTFs for the hub genes Glyceraldehyde-3-phosphate dehydrogenase (GAPDH), ribosomal protein S27a (RPS27A), Glial fibrillary acidic protein (GFAP), Beta-2 microglobulin (B2M), Clusterin (CLU), Eukaryotic elongation factor 2 (EEF2), Gap junction protein alpha 1 (GJA1), and Ceruloplasmin (CP).
RAB10 and TUBB4B are regulated by the most miRNAs, 25 and 16, respectively. Both genes have been reported to be associated with AD (Olah et al., 2011; Martins-de-Souza et al., 2012).
Analysis of the regulatory network identified the presence of 131 interesting feed-forward loops (FFLs) (Table S12), in which a TF controls a miRNA and together they coregulate a target gene. These 131 FFLs involved 22 DEGs (20 AD-associated DEGs and two other neurodegenerative disease-associated DEGs), 31 miRNAs (26 AD-associated miRNAs and five other neurodegenerative disease-associated miRNAs), and 28 TFs. It was interesting that an FFL was identified between the gene SERPINA3, hsa-miR-27a, and the TF MYC, shown in Figure 6. Interestingly, our study found that two other neurodegenerative disease-associated DEGs are involved in such FFLs between the gene STARD7, hsa-miR-433, and the TF SMAD3, the gene STARD7, hsa-miR-31, and the TF SMAD3, the gene TRIM22, hsa-miR-31, and the TF ELK1, the gene TRIM22, hsa-miR-31, and the TF SMAD3, and the gene TRIM22, hsa-miR-31, and the TF SOX4. Hsa-miR-433 and hsa-miR-31 have already been reported to be associated with AD. Therefore, the associations between AD and the genes STARD7 and TRIM22 were studied further.
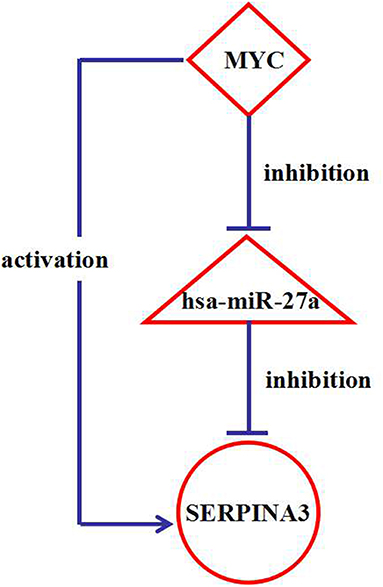
Figure 6. The interaction network among a FFL nodes. The triangle-shaped node represents miRNAs, ellipse-shaped node represents genes, and diamond-shaped node represents transcription factors (TFs).
GEO dataset (GSE16759) studying mRNA and miRNA was analyzed. This result revealed that SERPINA3 and MYC are upregulated, and hsa-miR-27a is downregulated in AD patients compared with controls. Detailed information is shown in Table 11.
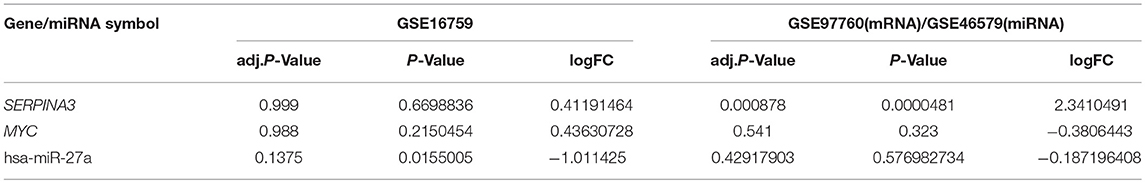
Table 11. The expression the gene SERPINA3, hsa-miR-27a, and TF MYC from FFL in different datasets.
To further verify the results, GSE46579 dataset studying miRNA expression in AD patients and controls blood was analyzed. Hsa-miR-27a was shown downregulated in AD patients blood. GSE97760 dataset studying mRNA expression was analyzed. The expression of SERPINA3 was shown upregulated, however MYC was shown downregulated. Detailed information is shown in Table 11.
SNPs corresponding to the AD-associated DEGs were obtained from the MirSNP online database. This showed that 1051 miRNAs were related to these SNPs, of which 79 miRNAs were AD associated. The results showed that 173 SNPs were related to these 79 miRNAs, and these 173 SNPs were associated with 40 AD-associated DEGs identified in our study. The chromosome loci information of these 173 SNPs is shown in Table S13.
In the past decades, research on the progression of AD has been productive, however identification of more potential genes and pathways in the pathogenesis of AD is needed. Therefore, large sample studies are essential for studying the effects of genes on the development of AD, and meta-analysis allows new biological insights.
In this study, we obtained DEGs by meta-analysis merging several AD-related microarray gene expression studies. This resulted in eight hubs with high degree and closeness centrality values, which are GAPDH, RPS27A, GFAP, B2M, CLU, EEF2, GJA1, and CP.
GAPDH co-localizes with most neurofibrillary tangles in the AD brain, and co-immunoprecipitates with abnormal tau antibodies in AD (Wang et al., 2005). The expression level of GAPDH in blood samples from familial AD patients is decreased compared with healthy controls (El Kadmiri et al., 2014).
RPS27A, a component of the 40S subunit of the ribosome, are associated with AD (Soler-Lopez et al., 2011).
GFAP, an astrocyte-specific intermediate filament, is significantly increased in AD mouse models compared with wildtype mice (Kamphuis et al., 2012).
B2M is the light chain of the first major histocompatibility (MHC) antigen. Increased plasma B2M results in deposition of amyloid fibrils, which is associated with over 20 degenerative diseases, including AD (Kardos et al., 2004).
CLU protein, an apolipoprotein, is responsible for clearing amyloid peptide and has neuroprotective effects for AD (Karch and Goate, 2015).
EEF2 is significantly decreased in AD compared with controls (Li et al., 2005).
GJA1, also known as connexin 43, shows upregulated mRNA and protein levels in AD (Ren et al., 2018). Specific deletion of astroglial connexin 43 in AD mice improved cognitive dysfunction (Ren et al., 2018).
CP, a ferrous oxidase enzyme, plays an important role in regulating iron metabolism and redox reactions. CP expression was significantly downregulated in the hippocampus region of AD patients, resulting in memory impairment and increased iron accumulation (Zhao et al., 2018).
However, the role of these genes in AD is not very clear. The importance of these genes requires further study in AD.
Studies also have shown that there is a difference between different sexes in neuroanatomy and function, so gender differences may be of great significance in the treatment of AD (Moradifard et al., 2018). More and more attention has been paid to the gender differences in AD prevalence. Some evidence showed that the risk of AD due to APOE ε4 allele is different in two sexes: female carriers are at higher risk of AD than male carriers (Nyarko et al., 2018). Based on our results, there are also a number of genes which specifically expressed in male and female. Such as CHC22 protein encoded by CLTCL1 gene was strongly suggested to play important function in affecting neuronal progenitor cells or immature neurons, and CLTCL1 was significantly upregulated in the development of human brain, especially cerebral cortex (Nahorski et al., 2015). LPIN1 plays a role in abdominal obesity, insulin sensitivity, and hypertriglyceridemia and it is associated to blood pressure regulation, especially in men (Ong et al., 2008). FOLR1 was reported to be overexpressed in ovarian cancer (Lin et al., 2013), and its expression could be regulated by both female sex hormones and retinoic acid (Kelemen et al., 2014). ELAVL2 might be critical for normal neuronal and synaptic function in the brain by regulating important genetic pathways participated in human neurodevelopment (Berto et al., 2016).
Analysis of FFL identified the bioregulatory relationship between the gene SERPINA3, hsa-miR-27a, and the TF MYC. TransmiR information revealed that hsa-miR-27a is repressed by the TF MYC. By combining the results of the DIANA-LncBase and TRANSFAC databases, both MYC and hsa-miR-27a were found to regulate the target gene SERPINA3. The expression of hsa-miR-27a is downregulated in AD patients compared with controls (Nunez-Iglesias et al., 2010), this result is also verified in our study and GSE46579 dataset (Table 11). MYC is also physiologically relevant and is increased in vulnerable neurons in patients with AD (Ferrer et al., 2001). This suggests that this TF may be highly expressed in the brain tissues of AD patients, indicating that MYC downregulates hsa-miR-27a. SERPINA3 is also involved in AD (Guan et al., 2012) and was detected to be upregulated in our study. Therefore, this validates our findings in AD. It also verifies that MYC and SERPINA3 have an activation relationship. This activation relationship is also verified in the GEO dataset GSE16759. However, in GSE97760, the result is different to ours and GSE16759, which may be due to different samples (The samples in GSE16759 were the tissues, however the samples in GSE97760 were blood).
There were 173 SNPs identified as being associated with 40 AD-associated DEGs, which were in turn regulated by AD-associated miRNAs. This enhances the relevance of these 173 SNPs in AD (Table S13). The function of these 173 SNPs was further analyzed using the SNP annotation tool SNPnexus (http://snp-nexus.org/index.html) (Dayem Ullah et al., 2018). Several SNPs related to hsa-miR-27a were identified. Among them were SNPs rs76463641 and rs79339279, located at the BRSK2 and GNB5 loci, respectively, which are both already known to be AD-associated genes (Katsumata et al., 2019). Therefore, hsa-miR-27a may be an important AD epigenetic biomarker in our study.
Furthermore, our study identified several SNPs associated with five other neurodegenerative disease-associated miRNAs involved in FFL of the regulatory network. Interestingly, SNPs associated with hsa-miR-34c, hsa-miR-212, hsa-miR-34a, and hsa-miR-7 are located at known AD-associated gene loci. Thus, these four miRNAs may be associated with AD, although this requires further study for confirmation.
Although this study is strict, it has some limitations. As the power of gene analysis is affected by the sample size, especially the number of cases, the current study may not have the strongest power. In addition, not all brain regions were studied. The other limitation is that only one dataset on the HIP brain region was selected to validate the microarray results, as RNA-Seq data for the other brain regions we studied (EC and MTG) in AD is lacking. So, further study is required, possibly with larger sample sizes, more brain regions. Considering the latent effects of the identified biomolecules in the pathogenesis of AD, experimental studies should be conducted to determine the possible roles of these molecules, but are lacking. In addition, the FFL between the gene SERPINA3, hsa-miR-27a and the TF MYC possibly provides new candidates for treatment of AD, so further experimental verification is needed.
In this study, based on high degree and closeness centrality values in the gene expression network, eight hub genes were identified, all of which have been reported to be associated with AD. By analyzing the mTF-miRNA-gene-gTF regulatory network, 131 FFLs were identified, in which an important FFL between the gene SERPINA3, hsa-miR-27a, and the TF MYC was identified. Further study on the lncRNA-mediated regulatory network suggested that these lncRNAs may be significant in AD, and these have not been found in previous studies. Moreover, 173 important SNPs were identified by SNP analysis, which may be helpful for predicting AD at an earlier stage.
All the data supporting the results of this study are included in the manuscript and the related Supplementary Documents.
LS and HW designed the study. LS, SC, CZ, HW, and XS performed the data analysis. LS wrote the manuscript. HW supervised this work. All authors read and approved the final manuscript.
This work was supported by the Scientific Research Projects of Colleges and Universities in Hebei Province (QN2019099), the Key Project of Hebei North University (No. 120177), the Project of Hebei North University (QN2018022), and the National Innovation and Entrepreneurship Training Program for College Students (201810092001), China.
CZ was employed by company Shenzhen RealOmics (Biotech) Co., Ltd.
The remaining authors declare that the research was conducted in the absence of any commercial or financial relationships that could be construed as a potential conflict of interest.
We thank Catherine Perfect, MA (Cantab), from Liwen Bianji, Edanz Editing China (www.liwenbianji.cn/ac), for editing the English text of a draft of this manuscript.
The Supplementary Material for this article can be found online at: https://www.frontiersin.org/articles/10.3389/fnins.2019.00633/full#supplementary-material
Additional Figures. All cassette figures of the expression data after standardization.
Table S1. Detailed descriptions of the samples including the brain regions, sex and mean age.
Table S2. Detailed information on the RNA-Seq samples collected from GEO data GSE67333.
Table S3. Results of sub-meta-analysis of EC brain regions on males and females.
Table S4. Results of sub-meta-analysis of HIP brain regions on males and females.
Table S5. Results of sub-meta-analysis of MTG brain regions on males and females.
Table S6. Detailed information on the DEGs in RNA-Seq data set GSE67333.
Table S7. Detailed information on the differentially expressed miRNAs from GEO data GSE16759.
Table S8. gTFs associated with AD-associated DEGs.
Table S9. gTFs associated with other neurodegenerative disease-associated DEGs.
Table S10. mTFs associated with AD-associated miRNAs.
Table S11. mTFs associated with other neurodegenerative disease-associated miRNAs.
Table S12. Feed-forward loop from the mTF–miRNA–gene–gTF regulatory networks.
Table S13. Important SNPs in AD and their related AD-associated miRNAs and genes.
DEGs, differentially expressed genes; gTF, transcription factor associated with gene; lncRNA, long non-coding RNA; miRNA, microRNA; mTF, transcription factor associated with miRNA; AD, Alzheimer's disease; SNP, single nucleotide polymorphism; TF, transcription factor; PPI, protein–protein interaction; FFL, feed-forward loop.
Almeida, J. F. F., Dos Santos, L. R., Trancozo, M., and de Paula, F. (2018). Updated meta-analysis of Bin1, Cr1, Ms4a6a, Clu, and Abca7 variants in Alzheimer's disease. J. Mol. Neurosci. 64, 471–477. doi: 10.1007/s12031-018-1045-y
Bagyinszky, E., Lee, H. M., Van Giau, V., Koh, S. B., Jeong, J. H., An, S. S. A., et al. (2018). Psen1 P.Thr116ile variant in two korean families with young onset Alzheimer's disease. Int. J. Mol. Sci. 19:E2604. doi: 10.3390/ijms19092604
Berchtold, N. C., Coleman, P. D., Cribbs, D. H., Rogers, J., Gillen, D. L., and Cotman, C. W. (2013). Synaptic genes are extensively downregulated across multiple brain regions in normal human aging and Alzheimer's disease. Neurobiol. Aging 34, 1653–1661. doi: 10.1016/j.neurobiolaging.2012.11.024
Berto, S., Usui, N., Konopka, G., and Fogel, B. L. (2016). Elavl2-regulated transcriptional and splicing networks in human neurons link neurodevelopment and autism. Hum. Mol. Genet. 25, 2451–2464. doi: 10.1093/hmg/ddw110
Blalock, E. M., Geddes, J. W., Chen, K. C., Porter, N. M., Markesbery, W. R., and Landfield, P. W. (2004). Incipient Alzheimer's disease: microarray correlation analyses reveal major transcriptional and tumor suppressor responses. Proc. Natl. Acad. Sci. U.S.A. 101, 2173–2178. doi: 10.1073/pnas.0308512100
Bruno, A. E., Li, L., Kalabus, J. L., Pan, Y., Yu, A., and Hu, Z. (2012). Mirdsnp: a database of disease-associated SNPs and microRNA target sites on 3'utrs of human genes. BMC Genomics 13:44. doi: 10.1186/1471-2164-13-44
Chee, L. Y., and Cumming, A. (2018). Polymorphisms in the cholinergic receptors muscarinic (Chrm2 and Chrm3) genes and Alzheimer's disease. Avicenna J. Med. Biotechnol. 10, 196–199.
Davis, S., and Meltzer, P. S. (2007). Geoquery: a bridge between the Gene Expression Omnibus (Geo) and bioconductor. Bioinformatics 23, 1846–1847. doi: 10.1093/bioinformatics/btm254
Dayem Ullah, A. Z., Oscanoa, J., Wang, J., Nagano, A., Lemoine, N. R., and Chelala, C. (2018). Snpnexus: assessing the functional relevance of genetic variation to facilitate the promise of precision medicine. Nucleic Acids Res. 46, W109–W113. doi: 10.1093/nar/gky399
Deane, R., Sagare, A., Hamm, K., Parisi, M., LaRue, B., Guo, H., et al. (2005). Igg-assisted age-dependent clearance of Alzheimer's amyloid beta peptide by the blood-brain barrier neonatal Fc receptor. J. Neurosci. 25, 11495–11503. doi: 10.1523/JNEUROSCI.3697-05.2005
Derkow, K., Rossling, R., Schipke, C., Kruger, C., Bauer, J., Fahling, M., et al. (2018). Distinct expression of the neurotoxic microRNA family Let-7 in the cerebrospinal fluid of patients with Alzheimer's disease. PLoS ONE 13:e0200602. doi: 10.1371/journal.pone.0200602
Durrenberger, P. F., Fernando, F. S., Kashefi, S. N., Bonnert, T. P., Seilhean, D., Nait-Oumesmar, B., et al. (2015). Common mechanisms in neurodegeneration and neuroinflammation: a BrainNet Europe gene expression microarray study. J. Neural Transm. 122, 1055–1068. doi: 10.1007/s00702-014-1293-0
El Kadmiri, N., Slassi, I., El Moutawakil, B., Nadifi, S., Tadevosyan, A., Hachem, A., et al. (2014). Glyceraldehyde-3-phosphate dehydrogenase (Gapdh) and Alzheimer's disease. Pathol. Biol. 62, 333–336. doi: 10.1016/j.patbio.2014.08.002
Ferrer, I., Blanco, R., Carmona, M., and Puig, B. (2001). Phosphorylated C-Myc expression in Alzheimer disease, Pick's disease, progressive supranuclear palsy and corticobasal degeneration. Neuropathol. Appl. Neurobiol. 27, 343–351. doi: 10.1046/j.1365-2990.2001.00348.x
Fogel, G. B., Weekes, D. G., Varga, G., Dow, E. R., Craven, A. M., Harlow, H. B., et al. (2005). A statistical analysis of the transfac database. Bio Systems. 81, 137–154. doi: 10.1016/j.biosystems.2005.03.003
Gaughwin, P. M., Ciesla, M., Lahiri, N., Tabrizi, S. J., Brundin, P., and Bjorkqvist, M. (2011). Hsa-Mir-34b Is a plasma-stable microRNA that is elevated in pre-manifest Huntington's disease. Hum. Mol. Genet. 20, 2225–2237. doi: 10.1093/hmg/ddr111
Guan, F., Gu, J., Hu, F., Zhu, Y., and Wang, W. (2012). Association between Alpha1-antichymotrypsin signal peptide−15a/T polymorphism and the risk of Alzheimer's disease: a meta-analysis. Mol. Biol. Rep. 39, 6661–6669. doi: 10.1007/s11033-012-1472-8
Guerreiro, C., Silva, B., Crespo, A. C., Marques, L., Costa, S., Timoteo, A., et al. (2015). Decrease in App and Cp mRNA expression supports impairment of iron export in Alzheimer's disease patients. Biochim. Biophys. Acta 1852, 2116–2122. doi: 10.1016/j.bbadis.2015.07.017
Hokama, M., Oka, S., Leon, J., Ninomiya, T., Honda, H., Sasaki, K., et al. (2014). Altered expression of diabetes-related genes in Alzheimer's disease brains: the Hisayama study. Cereb. Cortex 24, 2476–2488. doi: 10.1093/cercor/bht101
Huttenrauch, M., Ogorek, I., Klafki, H., Otto, M., Stadelmann, C., Weggen, S., et al. (2018). Glycoprotein Nmb: a novel Alzheimer's disease associated marker expressed in a subset of activated microglia. Acta Neuropathol. Commun. 6:108. doi: 10.1186/s40478-018-0612-3
Kamphuis, W., Kooijman, L., Orre, M., Stassen, O., Pekny, M., and Hol, E. M. (2015). Gfap and vimentin deficiency alters gene expression in astrocytes and microglia in wild-type mice and changes the transcriptional response of reactive glia in mouse model for Alzheimer's disease. Glia 63, 1036–1056. doi: 10.1002/glia.22800
Kamphuis, W., Mamber, C., Moeton, M., Kooijman, L., Sluijs, J. A., Jansen, A. H., et al. (2012). Gfap isoforms in adult mouse brain with a focus on neurogenic astrocytes and reactive astrogliosis in mouse models of Alzheimer disease. PLoS ONE 7:e42823. doi: 10.1371/journal.pone.0042823
Karagkouni, D., Paraskevopoulou, M. D., Chatzopoulos, S., Vlachos, I. S., Tastsoglou, S., Kanellos, I., et al. (2018). Diana-tarbase V8: a decade-long collection of experimentally supported miRNA-gene interactions. Nucleic Acids Res. 46, D239–D245. doi: 10.1093/nar/gkx1141
Karch, C. M., and Goate, A. M. (2015). Alzheimer's disease risk genes and mechanisms of disease pathogenesis. Biol. Psychiatry 77, 43–51. doi: 10.1016/j.biopsych.2014.05.006
Kardos, J., Yamamoto, K., Hasegawa, K., Naiki, H., and Goto, Y. (2004). Direct measurement of the thermodynamic parameters of amyloid formation by isothermal titration calorimetry. J. Biol. Chem. 279, 55308–55314. doi: 10.1074/jbc.M409677200
Katsumata, Y., Nelson, P. T., Estus, S., and Fardo, D. W. (2019). Translating Alzheimer's disease-associated polymorphisms into functional candidates: a survey of IGAP genes and SNPs. Neurobiol. Aging 74, 135–146. doi: 10.1016/j.neurobiolaging.2018
Kawamura, N. (2014). [Neurofascin: a novel target for combined central and peripheral demyelination]. Rinsho Shinkeigaku 54, 978–980. doi: 10.5692/clinicalneurol.54.978
Kelemen, L. E., Brenton, J. D., Parkinson, C. H. C. W., Piskorz, A. M., Csizmadi, I, et al. (2014). Conditions associated with circulating tumor-associated folate receptor 1 protein in healthy men and women. PLoS ONE 9:e96542. doi: 10.1371/journal.pone.0096542
Kumar, S., and Reddy, P. H. (2018). Microrna-455-3p as a potential biomarker for Alzheimer's disease: an update. Front. Aging Neurosci. 10:41. doi: 10.3389/fnagi.2018.00041
Leidinger, P., Backes, C., Deutscher, S., Schmitt, K., Mueller, S. C., Frese, K., et al. (2013). A blood based 12- miRNA signature of Alzheimer disease patients. Genome Biol. 14:R78. doi: 10.1186/gb-2013-14-7-r78
Li, X., Alafuzoff, I., Soininen, H., Winblad, B., and Pei, J. J. (2005). Levels of mtor and its downstream targets 4e-Bp1, Eef2, and Eef2 kinase in relationships with Tau in Alzheimer's disease brain. FEBS J. 272, 4211–4220. doi: 10.1111/j.1742-4658.2005.04833.x
Li, X., Zhu, X., Zhang, W., Yang, F., Hui, J., Tan, J., et al. (2018). The etiological effect of a new low-frequency Esr1 variant on mild cognitive impairment and Alzheimer's disease: a population-based study. Aging 10, 2316–2337. doi: 10.18632/aging.101548
Lin, J., Spidel, J. L., Maddage, C. J., Rybinski, K. A., Kennedy, R. P., Krauthauser, C. L., et al. (2013). The antitumor activity of the human Folr1-specific monoclonal antibody, farletuzumab, in an ovarian cancer mouse model is mediated by antibody-dependent cellular cytotoxicity. Cancer Biol. Ther. 14, 1032–1038. doi: 10.4161/cbt.26106
Liu, F. F., Zhang, Z., Chen, W., Gu, H. Y., and Yan, Q. J. (2018). Regulatory mechanism of Microrna-377 on Cdh13 expression in the cell model of Alzheimer's disease. Eur. Rev. Med. Pharmacol. Sci. 22, 2801–2808. doi: 10.26355/eurrev_201805_14979
Liu, J., Hoppman, N., O'Connell, J. R., Wang, H., Streeten, E. A., McLenithan, J. C., et al. (2012). A functional haplotype in Eif2ak3, an Er stress sensor, is associated with lower bone mineral density. J. Bone Miner. Res. 27, 331–341. doi: 10.1002/jbmr.549
Liu, Q. Y., Yu, J. T., Miao, D., Ma, X. Y., Wang, H. F., Wang, W., et al. (2013). An exploratory study on Stx6, Mobp, Mapt, and Eif2ak3 and late-onset Alzheimer's disease. Neurobiol. Aging 34, 1519.e13–1519.e17. doi: 10.1016/j.neurobiolaging.2012
Liu, Y., Chen, Q., Liu, X., Dou, M., Li, S., Zhou, J., et al. (2016). Genetic Association of Chat Rs3810950 and Rs2177369 polymorphisms with the risk of Alzheimer's disease: a meta-analysis. Biomed Res. Int. 2016:9418163. doi: 10.1155/2016/9418163
Manzine, P. R., Pelucchi, S., Horst, M. A., Vale, F. A. C., Pavarini, S. C. I., Audano, M., et al. (2018). MicroRNA 221 targets adam10 mRNA and is downregulated in Alzheimer's disease. J. Alzheimers. Dis. 61, 113–123. doi: 10.3233/JAD-170592
Martins-de-Souza, D., Guest, P. C., Mann, D. M., Roeber, S., Rahmoune, H., Bauder, C., et al. (2012). Proteomic analysis identifies dysfunction in cellular transport, energy, and protein metabolism in different brain regions of atypical frontotemporal lobar degeneration. J. Proteome Res. 11, 2533–2543. doi: 10.1021/pr2012279
Miller, J. A., Woltjer, R. L., Goodenbour, J. M., Horvath, S., and Geschwind, D. H. (2013). Genes and pathways underlying regional and cell type changes in Alzheimer's disease. Genome Med. 5:48. doi: 10.1186/gm452
Moradifard, S., Hoseinbeyki, M., Ganji, S. M., and Minuchehr, Z. (2018). Analysis of microRNA and gene expression profiles in Alzheimer's disease: a meta-analysis approach. Sci. Rep. 8:4767. doi: 10.1038/s41598-018-20959-0
Mus, E., Hof, P. R., and Tiedge, H. (2007). Dendritic Bc200 RNA in aging and in Alzheimer's disease. Proc. Natl. Acad. Sci. U.S.A. 104, 10679–10684. doi: 10.1073/pnas.0701532104
Nahorski, M. S., Al-Gazali, L., Hertecant, J., Owen, D. J., Borner, G. H., Chen, Y. C., et al. (2015). A novel disorder reveals clathrin heavy chain-22 is essential for human pain and touch development. Brain 138, 2147–2160. doi: 10.1093/brain/awv149
Ning, S., Zhao, Z., Ye, J., Wang, P., Zhi, H., Li, R., et al. (2014). Lincsnp: a database of linking disease-associated SNPs to human large intergenic non-coding RNAs. BMC Bioinformatics 15:152. doi: 10.1186/1471-2105-15-152
Nunez-Iglesias, J., Liu, C. C., Morgan, T. E., Finch, C. E., and Zhou, X. J. (2010). Joint genome-wide profiling of miRNA and mRNA expression in Alzheimer's disease cortex reveals altered miRNA regulation. PLoS ONE 5:e8898. doi: 10.1371/journal.pone.0008898
Nyarko, J. N. K., Quartey, M. O., Pennington, P. R., Heistad, R. M., Dea, D., Poirier, J., et al. (2018). Profiles of beta-amyloid peptides and key secretases in brain autopsy samples differ with sex and apoe Epsilon4 status: impact for risk and progression of Alzheimer disease. Neuroscience 373, 20–36. doi: 10.1016/j.neuroscience.2018.01.005
Olah, J., Vincze, O., Virok, D., Simon, D., Bozso, Z., Tokesi, N., et al. (2011). Interactions of pathological hallmark proteins: tubulin polymerization promoting Protein/P25, beta-amyloid, and alpha-synuclein. J. Biol. Chem. 286, 34088–34100. doi: 10.1074/jbc.M111.243907
Ong, K. L., Leung, R. Y., Wong, L. Y., Cherny, S. S., Sham, P. C., Lam, T. H., et al. (2008). Association of a polymorphism in the Lipin 1 gene with systolic blood pressure in men. Am. J. Hypertens. 21, 539–545. doi: 10.1038/ajh.2008.21
Paraskevopoulou, M. D., Vlachos, I. S., Karagkouni, D., Georgakilas, G., Kanellos, I., Vergoulis, T., et al. (2016). Diana-Lncbase V2: indexing microRNA targets on non-coding transcripts. Nucleic Acids Res. 44, D231–D238. doi: 10.1093/nar/gkv1270
Pascual-Caro, C., Berrocal, M., Lopez-Guerrero, A. M., Alvarez-Barrientos, A., Pozo-Guisado, E., Gutierrez-Merino, C., et al. (2018). Stim1 deficiency is linked to Alzheimer's disease and triggers cell death in Sh-Sy5y cells by upregulation of L-type voltage-operated Ca(2+) entry. J. Mol. Med. 96, 1061–1079. doi: 10.1007/s00109-018-1677-y
Perea, J. R., Lleo, A., Alcolea, D., Fortea, J., Avila, J., and Bolos, M. (2018). Decreased Cx3cl1 levels in the cerebrospinal fluid of patients with Alzheimer's disease. Front. Neurosci. 12:609. doi: 10.3389/fnins.2018.00609
Rankin, S. A., and Zorn, A. M. (2014). Gene regulatory networks governing lung specification. J. Cell. Biochem. 115, 1343–1350. doi: 10.1002/jcb.24810
Readhead, B., Haure-Mirande, J. V., Funk, C. C., Richards, M. A., Shannon, P., Haroutunian, V., et al. (2018). Multiscale analysis of independent Alzheimer's cohorts finds disruption of molecular, genetic, and clinical networks by human herpesvirus. Neuron 99, 64–82. doi: 10.1016/j.neuron.2018.05.023
Ren, R., Zhang, L., and Wang, M. (2018). Specific deletion Connexin43 in astrocyte ameliorates cognitive dysfunction in App/Ps1 mice. Life Sci. 208, 175–191. doi: 10.1016/j.lfs.2018.07.033
Shannon, P., Markiel, A., Ozier, O., Baliga, N. S., Wang, J. T., Ramage, D., et al. (2003). Cytoscape: a software environment for integrated models of biomolecular interaction networks. Genome Res. 13, 2498–2504. doi: 10.1101/gr.1239303
Soler-Lopez, M., Zanzoni, A., Lluis, R., Stelzl, U., and Aloy, P. (2011). Interactome mapping suggests new mechanistic details underlying Alzheimer's disease. Genome Res. 21, 364–376. doi: 10.1101/gr.114280.110
Stricker, R., and Reiser, G. (2014). Functions of the neuron-specific protein Adap1 (Centaurin-Alpha1) in neuronal differentiation and neurodegenerative diseases, with an overview of structural and biochemical properties of Adap1. Biol. Chem. 395, 1321–1340. doi: 10.1515/hsz-2014-0107
Szklarczyk, D., Gable, A. L., Lyon, D., Junge, A., Wyder, S., Huerta-Cepas, J., et al. (2019). String V11: protein-protein association networks with increased coverage, supporting functional discovery in genome-wide experimental datasets. Nucleic Acids Res. 47 D607–D613. doi: 10.1093/nar/gky1131
Taminau, J., Meganck, S., Lazar, C., Steenhoff, D., Coletta, A., Molter, C., et al. (2012). Unlocking the potential of publicly available microarray data using insilicodb and insilicomerging R/Bioconductor packages. BMC Bioinformatics 13:335. doi: 10.1186/1471-2105-13-335
Wang, D. Q., Fu, P., Yao, C., Zhu, L. S., Hou, T. Y., Chen, J. G., et al. (2018). Long non-coding RNAs, novel culprits, or bodyguards in neurodegenerative diseases. Mol. Ther. Nucleic Acids 10, 269–276. doi: 10.1016/j.omtn.2017.12.011
Wang, H., Li, Y., Ryder, J. W., Hole, J. T., Ebert, P. J., Airey, D. C., et al. (2018). Genome-wide RNAseq study of the molecular mechanisms underlying microglia activation in response to pathological tau perturbation in the Rtg4510 Tau transgenic animal model. Mol. Neurodegener. 13:65. doi: 10.1186/s13024-018-0296-y
Wang, J., Lu, M., Qiu, C., and Cui, Q. (2010). Transmir: a transcription Factor-microRNA regulation database. Nucleic Acids Res. 38, D119–D122. doi: 10.1093/nar/gkp803
Wang, Q., Woltjer, R. L., Cimino, P. J., Pan, C., Montine, K. S., Zhang, J., et al. (2005). Proteomic analysis of neurofibrillary tangles in Alzheimer disease identifies gapdh as a detergent-insoluble paired helical filament tau binding protein. FASEB J. 19, 869–871. doi: 10.1096/fj.04-3210fje
Wang, W. T., Sun, Y. M., Huang, W., He, B., Zhao, Y. N., and Chen, Y. Q. (2016). Genome-wide long non-coding RNA analysis identified circulating LncRNAs as novel non-invasive diagnostic biomarkers for gynecological disease. Sci. Rep. 6:23343. doi: 10.1038/srep23343
Wang, X., Kang, D. D., Shen, K., Song, C., Lu, S., Chang, L. C., et al. (2012). An R package suite for microarray meta-analysis in quality control, differentially expressed gene analysis and pathway enrichment detection. Bioinformatics 28, 2534–2536. doi: 10.1093/bioinformatics/bts485
Wong, T. H., van der Lee, S. J., van Rooij, J. G. J., Meeter, L. H. H., Frick, P., Melhem, S., et al. (2018). Eif2ak3 variants in dutch patients with Alzheimer's disease. Neurobiol. Aging 73:229. doi: 10.1016/j.neurobiolaging.2018.08.016
Yousef, G. M. (2015). Mirsnp-based approach identifies a miRNA that regulates prostate-specific antigen in an allele-specific manner. Cancer Discov. 5, 351–352. doi: 10.1158/2159-8290.CD-15-0230
Zhao, Y. S., Zhang, L. H., Yu, P. P., Gou, Y. J., Zhao, J., You, L. H., et al. (2018). Ceruloplasmin, a potential therapeutic agent for Alzheimer's disease. Antioxid. Redox Signal. 28, 1323–1337. doi: 10.1089/ars.2016.6883
Zhou, Q., Peng, D., Yuan, X., Lv, Z., Pang, S., Jiang, W., et al. (2014). Apoe and Apoc1 gene polymorphisms are associated with cognitive impairment progression in Chinese patients with late-onset Alzheimer's disease. Neural Regen. Res. 9, 653–660. doi: 10.4103/1673-5374.130117
Keywords: Alzheimer's disease, long non-coding RNA, microRNA, single nucleotide polymorphisms, network, meta-analysis
Citation: Su L, Chen S, Zheng C, Wei H and Song X (2019) Meta-Analysis of Gene Expression and Identification of Biological Regulatory Mechanisms in Alzheimer's Disease. Front. Neurosci. 13:633. doi: 10.3389/fnins.2019.00633
Received: 15 February 2019; Accepted: 31 May 2019;
Published: 03 July 2019.
Edited by:
Cristian Bonvicini, Centro San Giovanni di Dio Fatebenefratelli (IRCCS), ItalyReviewed by:
Nadia Cattane, Centro San Giovanni di Dio Fatebenefratelli (IRCCS), ItalyCopyright © 2019 Su, Chen, Zheng, Wei and Song. This is an open-access article distributed under the terms of the Creative Commons Attribution License (CC BY). The use, distribution or reproduction in other forums is permitted, provided the original author(s) and the copyright owner(s) are credited and that the original publication in this journal is cited, in accordance with accepted academic practice. No use, distribution or reproduction is permitted which does not comply with these terms.
*Correspondence: Huiping Wei, MTkzMTQ1MTM4N0BxcS5jb20=
Disclaimer: All claims expressed in this article are solely those of the authors and do not necessarily represent those of their affiliated organizations, or those of the publisher, the editors and the reviewers. Any product that may be evaluated in this article or claim that may be made by its manufacturer is not guaranteed or endorsed by the publisher.
Research integrity at Frontiers
Learn more about the work of our research integrity team to safeguard the quality of each article we publish.