 Rongbo Lu
 Liang Luo2*
 Bolin Liao
- 1College of Computer and Artificial Intelligence, Huaihua University, Huaihua, China
- 2College of Computer Science and Engineering, Jishou University, Jishou, China
This study introduces an intelligent learning model for classification tasks, termed the voting-based Double Pseudo-inverse Extreme Learning Machine (V-DPELM) model. Because the traditional method is affected by the weight of input layer and the bias of hidden layer, the number of hidden layer neurons is too large and the model performance is unstable. The V-DPELM model proposed in this paper can greatly alleviate the limitations of traditional models because of its direct determination of weight structure and voting mechanism strategy. Through extensive simulations on various real-world classification datasets, we observe a marked improvement in classification accuracy when comparing the V-DPELM algorithm to traditional V-ELM methods. Notably, when used for machine recognition classification of breast tumors, the V-DPELM method demonstrates superior classification accuracy, positioning it as a valuable tool in machine-assisted breast tumor diagnosis models.
1 Introduction
Extreme Learning Machine (ELM) (Huang et al., 2004) is a powerful machine learning algorithm that has emerged as a popular alternative to traditional neural networks [such as Back-Propagation (Haykin, 1998) algorithm (BP) and Levenberg Marquardt (Levenberg, 1944; Marquardt, 1963) algorithm] due to its speed, simplicity, and high performance. ELM is a single-layer feedforward neural network that uses random weight initialization and least-squares optimization to learn from input data (Huang et al., 2006). The algorithm has shown remarkable results in a wide range of applications, from image recognition (Tang et al., 2015) and speech processing (Han et al., 2014) to financial forecasting (Fernández et al., 2019) and anomaly detection (Huang et al., 2015).
One drawback of the ELM algorithm is that the learning parameters of the hidden nodes are randomly assigned and remain unchanged during training, which may lead to a significant impact on its predictive performance and algorithm stability (Gao and Jiang, 2012; Lu et al., 2014). ELM might misclassify certain samples, particularly those near the classification boundaries. In an attempt to address this issue, Cao et al. (2012) proposed a voting-based variant of ELM, referred to as V-ELM. The main idea behind V-ELM is to perform multiple independent ELM trainings instead of a single training, and then make the final decision based on majority voting. However, this approach does not fundamentally resolve the problem of random determination of ELM's various parameters.
Zhang et al. (2014) have highlighted that the performance of Extreme Learning Machine (ELM) is not always optimal when the input weights and hidden layer biases are chosen entirely at random. This randomness is also a significant factor contributing to the redundancy of neurons in the hidden layer of the ELM algorithm (Zhu et al., 2005). In response, scholars have proposed the use of swarm intelligence optimization (Lahoz et al., 2013; Figueiredo and Ludermir, 2014; Zhang et al., 2016), pruning methods (Miche et al., 2009, 2011), and adaptive algorithms (Pratama et al., 2016; Zhao et al., 2017) to optimize the ELM algorithm and enhance its overall performance. However, in practical applications, although these algorithms do succeed in optimizing the number of hidden layer neurons, they introduce a plethora of hyperparameters that typically require iterative optimization, thereby increasing the computational complexity of the algorithm and rendering it challenging to address real-time problems with high time constraints. To tackle this issue, this paper presents an improved algorithm known as Voting based double Pseudo-inverse weights determination Extreme Learning Machine (V-DPELM). The core concept of V-DPELM lies in the stochastic determination of output weights, while input weights are obtained through pseudoinverse calculations. Subsequently, the pseudo-inverse method is employed again to determine optimal output weights, ensuring that both input and output weights are optimal. The obtained DPELM algorithm is subjected to multiple independent trainings, and the final decision is made based on majority voting.
In the 21st century, breast cancer is increasingly recognized as a significant factor negatively impacting the overall quality of life for women worldwide. According to statistics from the World Health Organization (WHO), approximately 1.5 million women suffer greatly from the torment of breast cancer, with approximately 500,000 losing their lives to this disease (Fahad Ullah, 2019). The incidence and mortality rates of breast cancer exhibit a clear and alarming upward trend each year. Research has demonstrated the paramount importance of timely detection, diagnosis, and initiation of treatment in achieving favorable therapeutic outcomes for breast cancer (Lee et al., 2019; Aldhaeebi et al., 2020). Ten crucial features, including symmetry and fractal dimension of breast tumor lesions, play a vital role in determining the nature of the tumor, whether benign or malignant (Wang et al., 2016, 2019). Therefore, it is possible to extract relevant features closely associated with tumor characteristics from acquired patient samples. By employing the proposed V-DPELM algorithm for parameter optimization and subsequent breast tumor classification, the obtained classification and identification results can provide valuable references, assisting physicians in making diagnostic decisions and offering more accurate and rational assessments of patients' conditions.
2 V-DPELM algorithm design
In the section, we first review the basic concept of the traditional ELM algorithm in Section 2.1. Then, we analyzed the DPELM algorithm in Section 2.2. Finally, the new proposed V-DPELM algorithm will be presented in Section 2.3.
2.1 Brief review of ELM
Extreme Learning Machine (ELM) is suitable for generalized Single Hidden Layer Feedforward Networks (SLFN). The structure of traditional ELM is similar to SLFN, consisting of three layers: input layer, hidden layer, and output layer. The essence of ELM is that it does not require tuning the hidden layer of SLFN. The structure of ELM is shown in Figure 1.
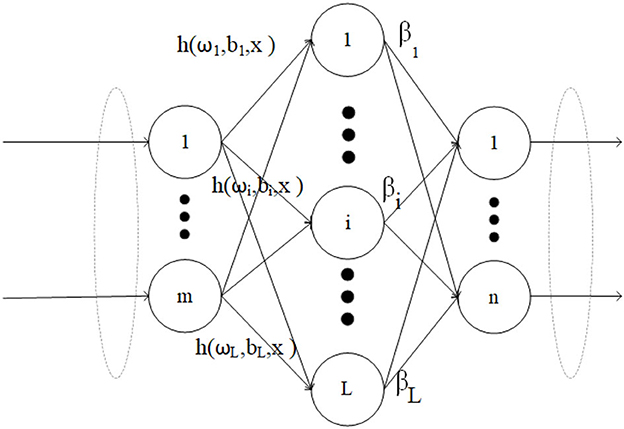
Figure 1. ELM network structure.
In the context of N arbitrary training samples , where each sample , , the resulting output of the ELM with L hidden nodes can be expressed as follows:
Here, ωj = (ωj1, ωj2, ..., ωjn) represents the weight vector of the jth neuron in the input layer, and bj is the bias associated with the jth neuron. h(.) indicates the activation function. Furthermore, βj denotes the linked weights between the jth hidden neurons and output neurons, βj = (βj1, βj2, ..., βjm).
For all N samples, the equivalent canonical form of linear equation (1) can be expressed as:
In Equation (2), T represents the desired output matrix for the training samples, and
is the randomized matrix mapping. It is worth noting that the parameters (ωj, bj) of the hidden layer neurons are randomly generated and remain fixed throughout the entire training process of ELM.
The ELM algorithm can be summarized as three steps as follow.
• Step 1: Randomly generate parameters for the hidden layer nodes.
• Step 2: Calculate the output matrix H of the hidden layer.
• Step 3: Calculate the output weight using , † represents the pseudo-inverse of the matrix.
2.2 DPELM learning algorithm
Due to the random determination of input weights in traditional ELM, it has resulted in low classification accuracy and an issue of too many hidden layer nodes. Therefore, this section introduces a new method for determining ELM's weights, referred to as the double pseudo-inverse weights determination ELM (DPELM), aiming to enhance its classification accuracy and achieve a more stable structure. DPELM is similar to the traditional ELM network structure, which consists of input layer, hidden layer and output layer. Upon a more comprehensive analysis of the traditional ELM principle, Equation 1 can be reformulated as follows:
where , , , β and Ω represent the output weight matrix and the input weight matrix, respectively. Where
Derivation process: Assuming the bias B and output weight β are randomly generated within the interval [a1, a2], and the activation function h(·) is strictly monotonous, the ideal Ω should be equal to Ω = (h−1(β†T)+B)X†.
Since B and β are randomly generated, multiplying both sides of Equation 3 by β† results in:
By finding the inverse function of the activation function h(·), we can obtain:
The above equation can be rewritten as:
Finally, multiplying equation 5 by X† simultaneously results in
namely,
This concludes the proof.
Once the optimal Ω has been determined, the formula can be employed to compute the value of .
2.3 V-DPELM model training process
Based on theoretical principles, the specific training process for V-DPELM model is outlined as follows:
• Step 1: Given a sample dataset , where xi, ti, N represent the input vector, target vector, and the total number of samples, respectively. This step introduces essential parameters, including the hidden node output function h(ω, b, x), the count of hidden nodes L, and the number of independent training repetitions K.
• Step 2: Randomly initialize output weights β and hidden layer biases B within the interval [a1, a2].
• Step 3: In the case where the training sample is determined, the optimal input weights Ω are computed using the formula Ω = (h−1(β†T)+B)X†.
• Step 4: Subsequently, upon obtaining the optimal input weights Ω, the optimal output weights are determined as .
• Step 5: Repeat steps 2 to 4 for a total of K times to get K independent DPELMs model. Then, perform test tasks on these DPELMs, and the final result is obtained by aggregating the test results using a voting strategy.
The network structure of V-DPELM model is shown in Figure 2. Algorithm 1 provides a specific introduction to the pseudo code of the V-DPELM method.
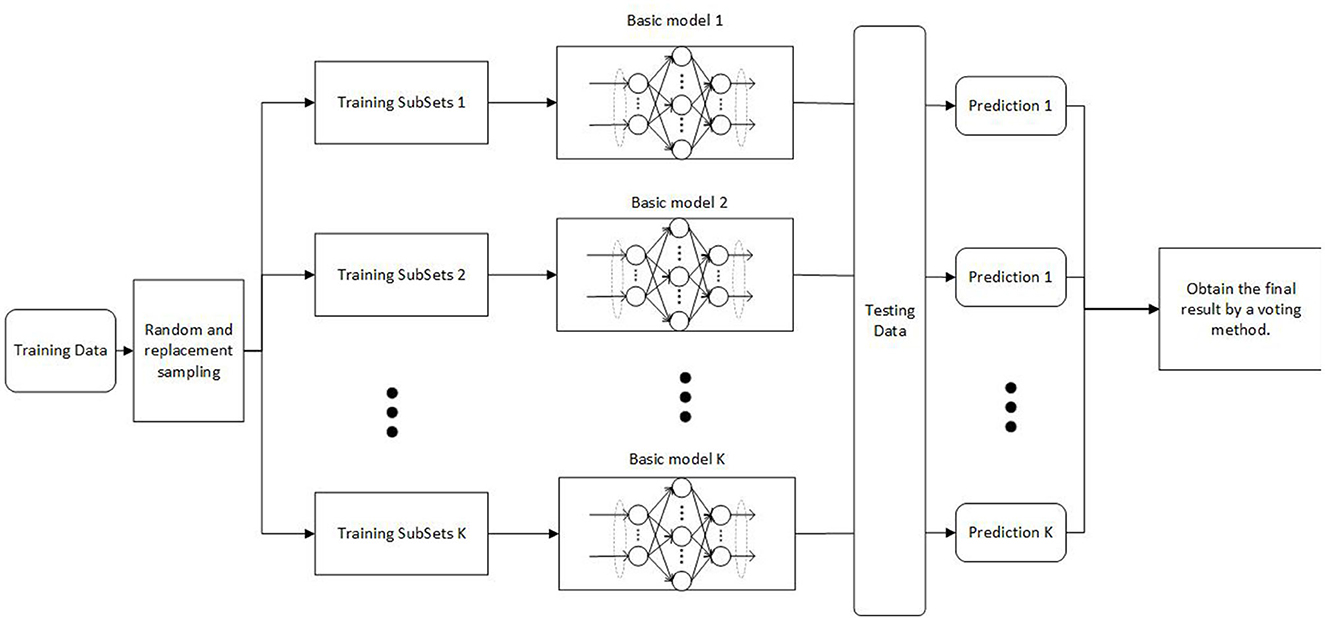
Figure 2. V-DPELM network structure.

Algorithm 1. V-DPELM.
3 Experimental results and analysis
This section randomly selects 12 datasets from the UCI database to assess the classification performance of the improved Extreme Learning Machine algorithm. All experiments in this paper were conducted using Matlab 2016(a) on a regular PC with an Intel(R) Core(TM) i5-12500H CPU running at 3.60GHz and 16GB of memory.
3.1 Experimental description
The present text conducts a series of experiments to evaluate the performance of the algorithm from various perspectives, including the efficacy of its categorization, the precision of its predictions, the requisite count of neurons within its hidden layers, and the stability of its resultant outputs. The datasets utilized in this research were sourced from the UCI (University of California, Irvine) repository, encompassing both binary classification and multi-classification datasets. It is important to note that the training and test data within each dataset were randomly shuffled for each simulation experiment, ensuring unbiased evaluations. Detailed specifications of these 12 datasets are presented in Table 1.
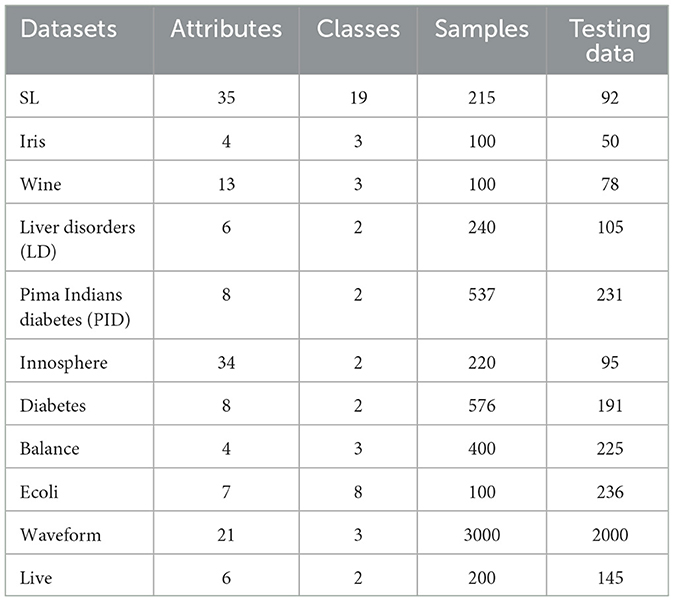
Table 1. Specifications of classification datasets.
3.2 Experimental results and analytical discussion
In this subsection, we begin by employing the Iris dataset, the features of which are displayed in Table 1, to ascertain the efficacy of the V-DPELM algorithm. The corresponding outcomes are illustrated through Figures 3–5 and Table 2. Figures 3, 4 depict the graphs of the confusion matrix. Within these figures, the values along the diagonal of the matrix signify the correctly classified samples, whereas those located elsewhere indicate the misclassified samples.
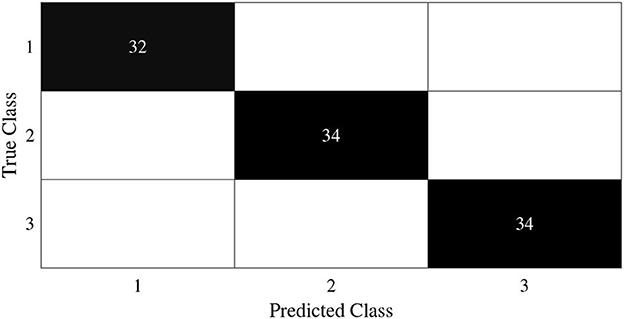
Figure 3. Training confusion matrix of Iris dataset.
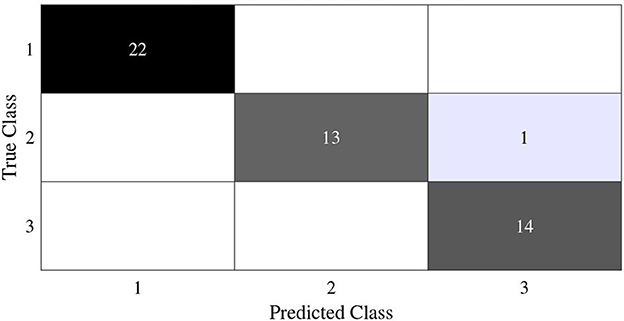
Figure 4. Test confusion matrix of Iris dataset.
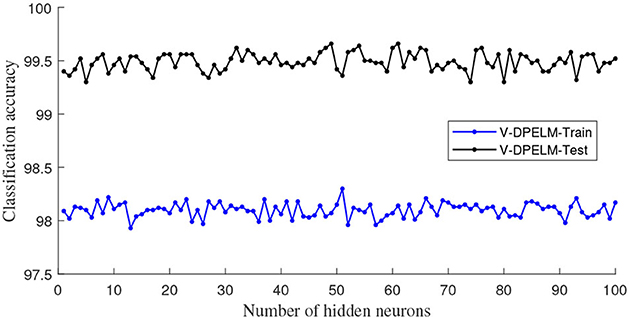
Figure 5. V-DPELM classification accuracy for Iris dataset.
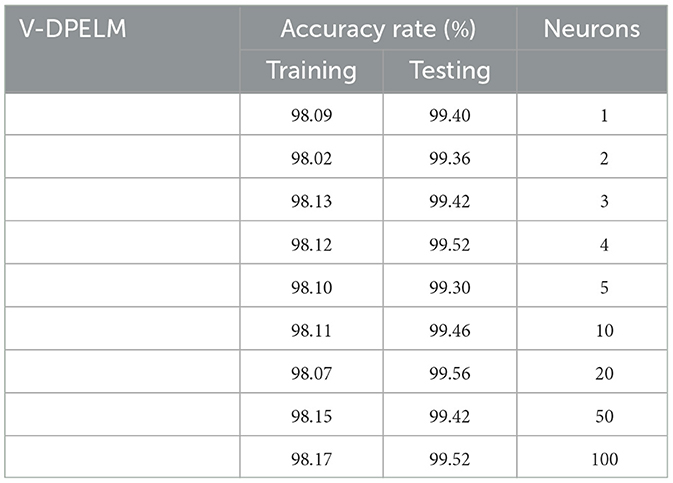
Table 2. Classification performance of V-DPELM with different hidden layer neuron numbers in the Iris Dataset.
It is evident that V-DPELM exhibits noteworthy proficiency in performing classification tasks, both in testing and training scenarios. Furthermore, as evident from Figure 5, the optimal classification accuracy reaches approximately 99.5% during testing and 98% during training. Notably, Figure 5 unveils a significant observation: the generalization performance of V-DPELM remains stable even with a modest number of hidden-layer neurons. This finding is corroborated by Table 2. Specifically, when the count of hidden-layer neurons is set to 3, optimal and consistent classification accuracy is achieved. This phenomenon holds true for other cases as well.
Regarding Table 2, there is an additional aspect that requires elucidation. In the context of assessing the presented growth methodology, the number of hidden-layer neurons in V-DPELM is tuned either manually, with an increment of 1, or automatically through the growth method. As demonstrated in the table, the proposed growth method effectively identifies the optimal structure for V-DPELM. Consequently, the effectiveness of V-DPELM in pattern classification is preliminarily affirmed.
The impact of the number of neurons in the hidden layer on the predictive performance of both the traditional V-ELM and the algorithm proposed in this study is investigated through experimental comparisons. Initially, a subset of samples from each dataset is selected as training and testing data, with the division between them fixed throughout the experiment. The growing method is employed to determine the number of neurons in the hidden layer, where the accuracy is observed after each addition of one neuron. The corresponding algorithm is considered to have the best network structure when the accuracy remains unchanged or the change falls below a predefined threshold. Subsequently, the ELM algorithm and the algorithm proposed in this paper are executed 100 times within the optimized network structure, and the average classification accuracy is computed using the test dataset. In this experiment, the tangent function (tan) is chosen as the activation function, with its inverse function being the arctangent function (arctan). The comparative analysis of classification accuracy for different algorithms and the required number of neurons in the hidden layer to achieve the highest classification accuracy are presented in Table 3.
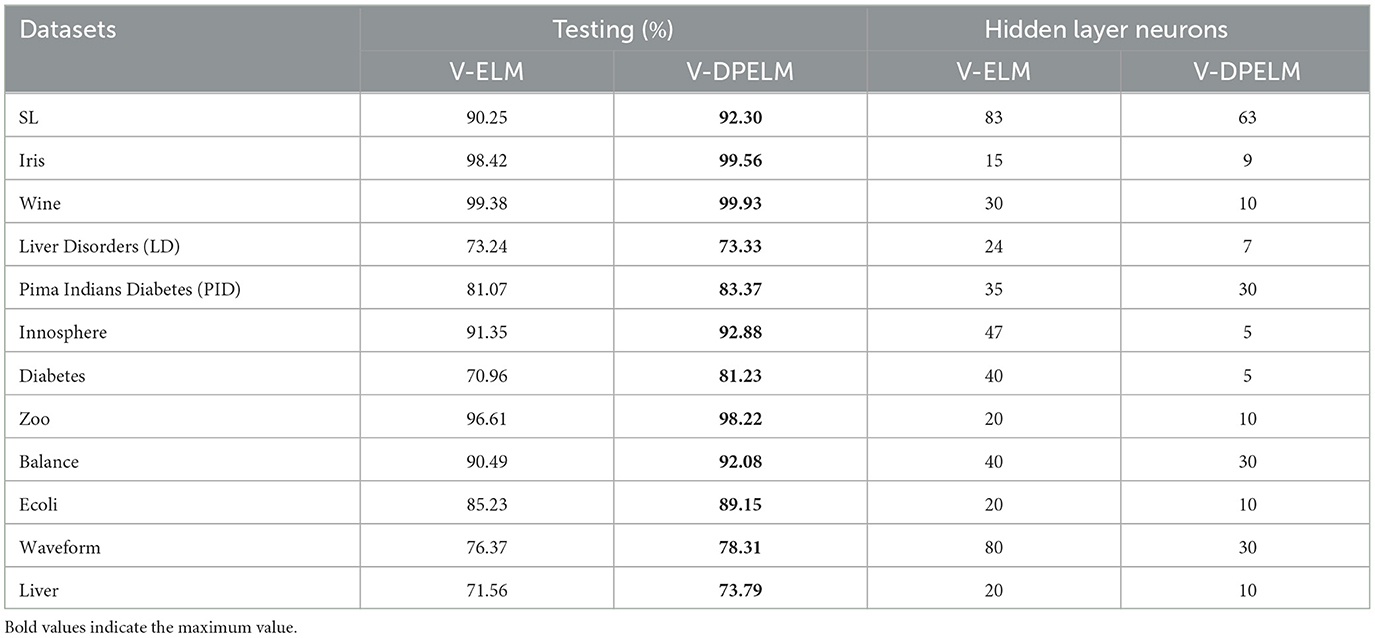
Table 3. Comparisons of classification accuracy and number of hidden layer neurons of different algorithms.
From Table 3, it can be observed that the algorithm proposed in this paper outperforms the traditional V-ELM algorithm in terms of classification performance, both in binary datasets and multi-classification datasets. The proposed algorithm achieves higher classification accuracy with fewer neurons in the hidden layer, resulting in a simpler network structure. This indicates that the analytical weight initialization method employed in this paper yields superior results compared to the random weight initialization method. Furthermore, to further analyze the impact of algorithm parameters on classification performance and algorithm stability, this study selects one dataset each from binary and multi-class problems for performance comparison.
The SL dataset, a multi-class dataset, and the Diabetes dataset, a binary classification dataset, are selected for this study. The training and testing sets for both datasets are fixed and unchanged throughout the experiments. The number of neurons in the hidden layer is set to increment from 1 to 100. For each additional neuron, the ELM algorithm and the algorithm proposed in this paper are executed 100 times. The experimental results are analyzed in terms of the mean, variance, and range, as depicted in Figures 6, 7. In these figures, the positions indicated by black pentagons and triangles represent the locations where each algorithm achieves the highest classification accuracy.
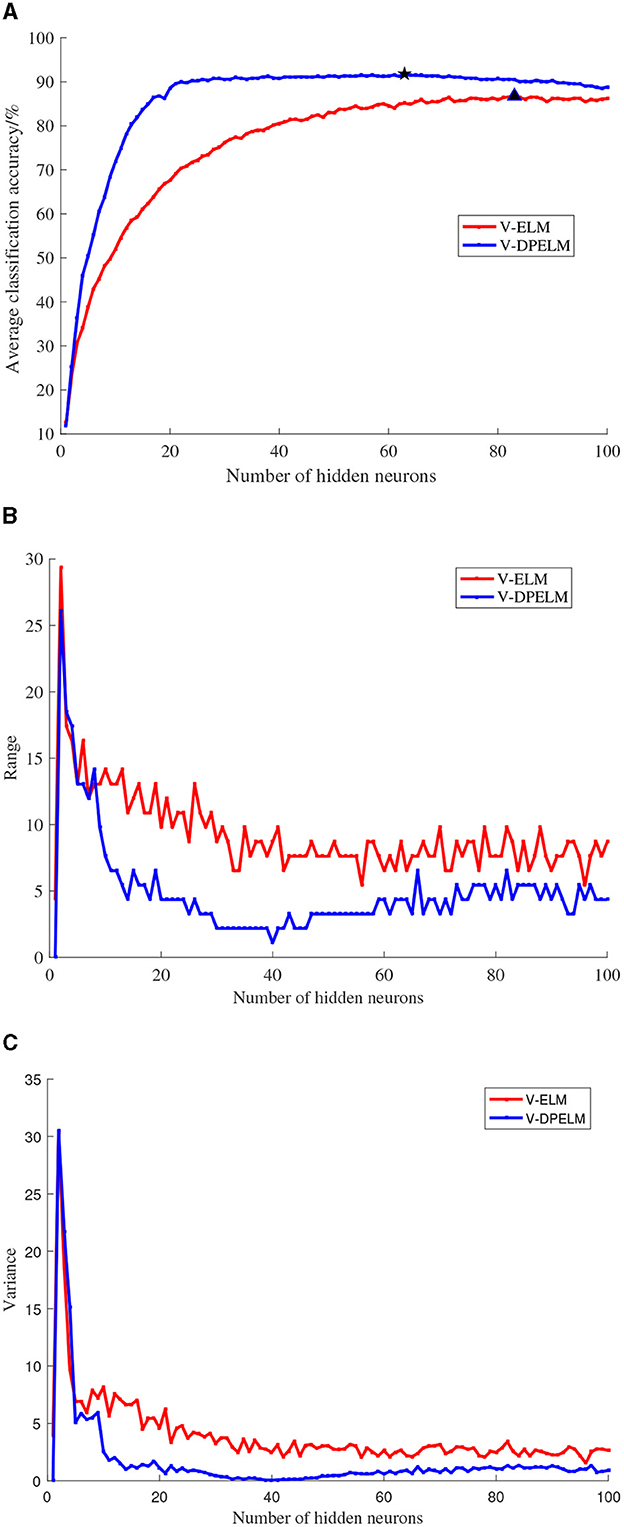
Figure 6. SL data set comparison experiment results. (A) Changes in classification accuracy. (B) Changes in range. (C) Changes in variance.
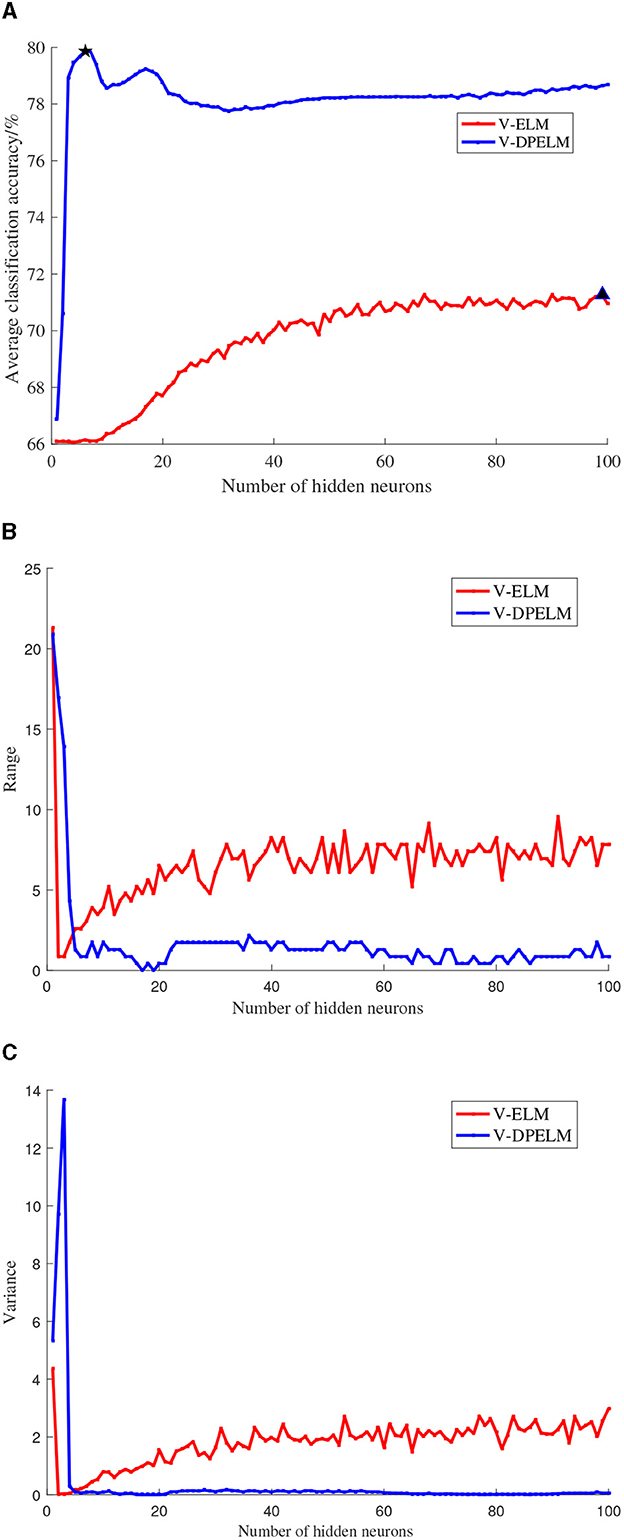
Figure 7. Diabetes data set comparison experiment results. (A) Changes in classification accuracy. (B) Changes in range. (C) Changes in variance.
Observing Figures 6A, 7A, it becomes evident that the increase in the number of neurons in the hidden layer leads to an initial rapid rise in prediction accuracy for both the traditional V-ELM algorithm and the algorithm proposed in this paper. However, after reaching a certain point, the accuracy levels off or slightly declines. By considering the experimental findings and the Theorem presented in Huang et al. (2006), it can be deduced that the algorithm proposed in this study shares similar characteristics with the traditional V-ELM algorithm. Specifically, as the number of neurons in the hidden layer increases, the algorithm's fitting performance improves. Nevertheless, beyond a critical threshold, further augmenting the number of hidden neurons may cause overfitting on the training samples, resulting in a slower or even decreasing classification accuracy on the test samples.
Furthermore, a thorough examination of Figures 6, 7 reveals that, in both the multi-class SL dataset and the binary Diabetes dataset, the proposed algorithm demonstrates a faster rate of average classification accuracy improvement compared to the conventional V-ELM algorithm. Remarkably, achieving this progress requires a smaller number of neurons in the hidden layer. Additionally, the analysis of variance and range reveals that the proposed algorithm exhibits lower values for both metrics compared to the traditional V-ELM algorithm on the SL and Diabetes datasets. This finding suggests that the proposed algorithm possesses superior stability in comparison to the traditional V-ELM algorithm.
4 Application of V-DPELM in the diagnosis of breast tumors
In order to further validate the accuracy of voting based double pseudo-inverse weights determination extreme learning machine algorithm, this study applies it to the classification and recognition of breast tumor diagnosis. Multiple distinct algorithms are employed to train and recognize the same breast tumor training and testing sets, which are then compared against the performance of the method proposed in this paper.
4.1 Experimental data
Data in this study were collected from an open data set published by the University of Wisconsin School of Medicine, including 569 cases of breast tumors, 357 benign and 212 malignant. In this paper, 450 groups of tumor data (282 benign cases, 168 malignant cases) were randomly selected as the training set, and the remaining 119 groups of tumor data (75 benign cases, 44 malignant cases) were selected as the test set. Each sample was composed of 30 data, including the mean, standard deviation and maximum value of 10 characteristic values extracted from the breast tumor sample data.
4.2 Experimental results and analysis
For the purpose of comparing algorithmic performance, three performance metrics were considered: the mean diagnostic rate for benign tumors (referred to as benign diagnosis rate), the mean diagnostic rate for malignant tumors (referred to as malignant diagnosis rate), and the average diagnostic accuracy rate. To ensure robustness of the comparison, independent experiments were conducted 20 times for each algorithm, including the proposed algorithm, V-ELM, Artificial Fish Swarm Algorithm-Extreme Learning Machine (AFSA-ELM), ELM, Learning Vector Quantization (LVQ), and Backpropagation Algorithm (BP). The average values of the benign diagnosis rate, malignant diagnosis rate, and overall accuracy rate were calculated and compared. It should be noted that the experimental results for V-ELM, AFSA-ELM, ELM, LVQ, and BP algorithms were sourced from Zhou and Yuan (2017). The comparative findings are summarized in Table 4.
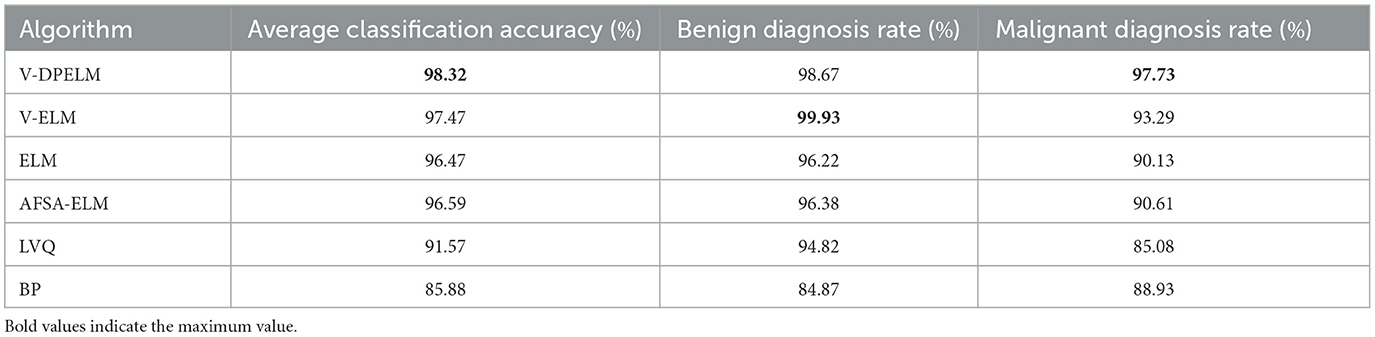
Table 4. Performance comparison of multiple algorithms.
From the findings presented in Table 4, it is apparent that the average accuracy rate achieved by the proposed algorithm surpasses that of the other algorithms. Although the benign diagnosis rate is slightly lower than that of the V-ELM algorithm, the malignant tumor diagnosis rate is considerably higher. These results highlight the efficacy of the proposed algorithm in rapidly and accurately identifying malignant tumors, thus mitigating the risks associated with delayed treatment and potential impacts on treatment efficacy resulting from misdiagnosis.
5 Conclusions
In the 12 randomly selected UCI datasets, the algorithm proposed in this paper, voting based double pseudo-inverse weights determination extreme learning machine algorithm, exhibits varying degrees of improvement in classification performance compared to the traditional V-ELM algorithm. Among these datasets, the Diabetes dataset shows the greatest increase in classification accuracy, with a significant enhancement of 10.27%. On the other hand, the LD dataset demonstrates the smallest improvement, with a marginal increase of only 0.09% in classification accuracy.
Moreover, the improved algorithm achieves optimal classification accuracy with fewer hidden layer neurons compared to the traditional ELM algorithm, resulting in a simpler network structure.
Additionally, the improved algorithm exhibits reduced variance and range in both the SL and Diabetes dataset experiments, indicating enhanced stability. Furthermore, in the breast tumor classification and recognition experiments, the diagnostic performance of the proposed algorithm surpasses that of V-ELM, AFSA-ELM, ELM, LVQ, and BP methods. This observation highlights the advantage of the proposed algorithm in achieving high classification accuracy in breast tumor auxiliary diagnosis. Thus, the application of this method for breast tumor auxiliary diagnosis is deemed feasible. In addition, it is worth pointing out that processing multi-dimensional data can be a research direction for future work.
Data availability statement
Publicly available datasets were analyzed in this study. This data can be found here: https://archive.ics.uci.edu/datasets.
Author contributions
RL: Funding acquisition, Investigation, Supervision, Validation, Writing—review & editing. LL: Conceptualization, Data curation, Formal analysis, Project administration, Resources, Software, Visualization, Writing—original draft, Writing—review & editing. BL: Investigation, Methodology, Writing—review & editing.
Funding
The author(s) declare that financial support was received for the research, authorship, and/or publication of this article. This work was supported in part by the National Natural Science Foundation of China under Grant No. 62066015.
Conflict of interest
The authors declare that the research was conducted in the absence of any commercial or financial relationships that could be construed as a potential conflict of interest.
Publisher's note
All claims expressed in this article are solely those of the authors and do not necessarily represent those of their affiliated organizations, or those of the publisher, the editors and the reviewers. Any product that may be evaluated in this article, or claim that may be made by its manufacturer, is not guaranteed or endorsed by the publisher.
References
Aldhaeebi, M. A., Alzoubi, K., Almoneef, T. S., Bamatraf, S. M., Attia, H., and Ramahi, O. M. (2020). Review of microwaves techniques for breast cancer detection. Sensors 20, 2390. doi: 10.3390/s20082390
Cao, J., Lin, Z., Huang, G.-B., and Liu, N. (2012). Voting based extreme learning machine. Inf. Sci. 185, 66–77. doi: 10.1016/j.ins.2011.09.015
Fahad Ullah, M. (2019). Breast cancer: current perspectives on the disease status. Adv. Exp. Med. Biol. 1152, 51–64. doi: 10.1007/978-3-030-20301-6_4
Fernández, C., Salinas, L., and Torres, C. E. (2019). A meta extreme learning machine method for forecasting financial time series. Appl. Intell. 49, 532–554. doi: 10.1007/s10489-018-1282-3
Figueiredo, E. M., and Ludermir, T. B. (2014). Investigating the use of alternative topologies on performance of the pso-elm. Neurocomputing 127, 4–12. doi: 10.1016/j.neucom.2013.05.047
Gao, G.-Y., and Jiang, G.-P. (2012). Prediction of multivariable chaotic time series using optimized extreme learning machine. Acta Phys. Sin. 61, 040506. doi: 10.7498/aps.61.040506
Han, K., Yu, D., and Tashev, I. (2014). “Speech emotion recognition using deep neural network and extreme learning machine, in In Interspeech 2014. doi: 10.21437/Interspeech.2014-57
Huang, G.-B., Bai, Z., Kasun, L. L. C., and Vong, C. M. (2015). Local receptive fields based extreme learning machine. IEEE Comput. Intell. Magaz. 10, 18–29. doi: 10.1109/MCI.2015.2405316
Huang, G.-B., Zhu, Q.-Y., and Siew, C.-K. (2004). “Extreme learning machine: a new learning scheme of feedforward neural networks, in 2004 IEEE International Joint Conference on Neural Networks (IEEE Cat. No. 04CH37541) (IEEE), 985–990.
Huang, G.-B., Zhu, Q.-Y., and Siew, C.-K. (2006). Extreme learning machine: theory and applications. Neurocomputing 70, 489–501. doi: 10.1016/j.neucom.2005.12.126
Lahoz, D., Lacruz, B., and Mateo, P. M. (2013). A multi-objective micro genetic elm algorithm. Neurocomputing 111, 90–103. doi: 10.1016/j.neucom.2012.11.035
Lee, K., Kruper, L., Dieli-Conwright, C. M., and Mortimer, J. E. (2019). The impact of obesity on breast cancer diagnosis and treatment. Curr. Oncol. Rep. 21, 1–6. doi: 10.1007/s11912-019-0787-1
Levenberg, K. (1944). A method for the solution of certain non-linear problems in least squares. Quart. Appl. Mathem. 2, 164–168. doi: 10.1090/qam/10666
Lu, H. J., An, C. L., Zheng, E. H., and Lu, Y. (2014). Dissimilarity based ensemble of extreme learning machine for gene expression data classification. Neurocomputing 128, 22–30. doi: 10.1016/j.neucom.2013.02.052
Marquardt, D. W. (1963). An algorithm for least-squares estimation of nonlinear parameters. J. Soc. Ind. Appl. Mathem. 11, 431–441. doi: 10.1137/0111030
Miche, Y., Sorjamaa, A., Bas, P., Simula, O., Jutten, C., and Lendasse, A. (2009). OP-ELM: optimally pruned extreme learning machine. IEEE Trans. Neural Netw. 21, 158–162. doi: 10.1109/TNN.2009.2036259
Miche, Y., Van Heeswijk, M., Bas, P., Simula, O., and Lendasse, A. (2011). Trop-elm: a double-regularized elm using lars and tikhonov regularization. Neurocomputing 74, 2413–2421. doi: 10.1016/j.neucom.2010.12.042
Pratama, M., Zhang, G., Er, M. J., and Anavatti, S. (2016). An incremental type-2 meta-cognitive extreme learning machine. IEEE Trans. Cybern. 47, 339–353. doi: 10.1109/TCYB.2016.2514537
Tang, J., Deng, C., and Huang, G.-B. (2015). Extreme learning machine for multilayer perceptron. IEEE Trans. Neural Netw. Learn. Syst. 27, 809–821. doi: 10.1109/TNNLS.2015.2424995
Wang, Z., Li, M., Wang, H., Jiang, H., Yao, Y., Zhang, H., et al. (2019). Breast cancer detection using extreme learning machine based on feature fusion with cnn deep features. IEEE Access 7, 105146–105158. doi: 10.1109/ACCESS.2019.2892795
Wang, Z., Qu, Q., Yu, G., and Kang, Y. (2016). Breast tumor detection in double views mammography based on extreme learning machine. Neural Comput. Applic. 27, 227–240. doi: 10.1007/s00521-014-1764-0
Zhang, W.-B., Ji, H.-B., Wang, L., and Zhu, M.-Z. (2014). Multiple hidden layer output matrices extreme learning machine. Syst. Eng. Electr. 36, 1656–1659.
Zhang, Y., Wu, J., Cai, Z., Zhang, P., and Chen, L. (2016). Memetic extreme learning machine. Patt. Recogn. 58, 135–148. doi: 10.1016/j.patcog.2016.04.003
Zhao, Y.-P., Li, Z.-Q., Xi, P.-P., Liang, D., Sun, L., and Chen, T.-H. (2017). Gram-schmidt process based incremental extreme learning machine. Neurocomputing 241, 1–17. doi: 10.1016/j.neucom.2017.01.049
Zhou, H.-p., and Yuan, Y. (2017). Application of elm in computer-aided diagnosis of breast tumors based on improved fish swarm optimization algorithm. Comput. Eng. Sci. 39, 2145.
Keywords: intelligent learning model, neural network, machine recognition classification, weights determination, machine-assisted diagnosis
Citation: Lu R, Luo L and Liao B (2023) Voting based double-weighted deterministic extreme learning machine model and its application. Front. Neurorobot. 17:1322645. doi: 10.3389/fnbot.2023.1322645
Received: 16 October 2023; Accepted: 31 October 2023;
Published: 21 November 2023.
Edited by:
Long Jin, Lanzhou University, ChinaReviewed by:
Zhongbo Sun, Changchun University of Technology, ChinaLiangming Chen, Chinese Academy of Sciences (CAS), China
Copyright © 2023 Lu, Luo and Liao. This is an open-access article distributed under the terms of the Creative Commons Attribution License (CC BY). The use, distribution or reproduction in other forums is permitted, provided the original author(s) and the copyright owner(s) are credited and that the original publication in this journal is cited, in accordance with accepted academic practice. No use, distribution or reproduction is permitted which does not comply with these terms.
*Correspondence: Rongbo Lu, bHVyb25nYm84NTYzQDE2My5jb20=; Liang Luo, bHVvbGlhbmc5OTExMDVAMTYzLmNvbQ==