 Fengjun Xi
 Liyun Tu2
 Yun Peng
- 1Department of Radiology, Beijing Tiantan Hospital, Capital Medical University, Beijing, China
- 2School of Artificial Intelligence, Beijing University of Posts and Telecommunications, Beijing, China
- 3Imaging Center, Beijing Children’s Hospital, National Center for Children’s Health, Capital Medical University, Beijing, China
Objective: Our research aims to develop an automated method for segmenting brain CT images in healthy 2-year-old children using the ResU-Net deep learning model. Building on this model, we aim to quantify the volumes of specific brain regions and establish a normative reference database for clinical and research applications.
Methods: In this retrospective study, we included 1,487 head CT scans of 2-year-old children showing normal radiological findings, which were divided into training (n = 1,041) and testing (n = 446) sets. We preprocessed the Brain CT images by resampling, intensity normalization, and skull stripping. Then, we trained the ResU-Net model on the training set and validated it on the testing set. In addition, we compared the performance of the ResU-Net model with different kernel sizes (3 × 3 × 3 and 1 × 3 × 3 convolution kernels) against the baseline model, which was the standard 3D U-Net. The performance of the model was evaluated using the Dice similarity score. Once the segmentation model was established, we derived the regional volume parameters. We then conducted statistical analyses to evaluate differences in brain volumes by sex and hemisphere, and performed a Spearman correlation analysis to assess the relationship between brain volume and age.
Results: The ResU-Net model we proposed achieved a Dice coefficient of 0.94 for the training set and 0.96 for the testing set, demonstrating robust segmentation performance. When comparing different models, ResU-Net (3,3,3) model achieved the highest Dice coefficient of 0.96 in the testing set, followed by ResU-Net (1,3,3) model with 0.92, and the baseline 3D U-Net with 0.88. Statistical analysis showed that the brain volume of males was significantly larger than that of females in all brain regions (p < 0.05), and age was positively correlated with the volume of each brain region. In addition, specific structural asymmetries were observed between the right and left hemispheres.
Conclusion: This study highlights the effectiveness of deep learning for automatic brain segmentation in pediatric CT imaging, providing a reliable reference for normative brain volumes in 2-year-old children. The findings may serve as a benchmark for clinical assessment and research, complementing existing MRI-based reference data and addressing the need for accessible, population-based standards in pediatric neuroimaging.
1 Introduction
Abnormalities in brain volumetrics have been associated with congenital and acquired diseases in children, such as hydrocephalus (1), brain trauma (2), and neuropsychiatric disorders (3). Most in vivo studies have used magnetic resonance imaging (MRI) of healthy volunteers to measure global and regional volume loss (4–7). However, this approach encounters difficulties when applied to pediatric populations, resulting in a lack of an accepted normative database, which limits quantitative reporting (4, 5, 8).
CT is a fast, cost-effective, and widely accessible imaging modality, providing a viable alternative for pediatric patients unable to undergo MR examination, enabling the generation of a large reference database for statistical analysis (9, 10). Research indicates that CT-based visual classifications and quantitative metrics are comparable to MRI results for certain pathological features and show significant correlations with cognitive test outcomes (11–13). However, MRI is widely used for high-resolution brain volume measurements due to its strong soft tissue contrast. However, MRI remains the preferred modality for high-resolution brain volume measurements due to its superior soft tissue contrast. Previous CT volume assessments have primarily used semi-quantitative methods, which are time-intensive and require trained specialists. Recent advances in automated brain CT segmentation, particularly through deep learning, have demonstrated faster and more accurate segmentation, with results strongly correlating with those from MRI segmentation (14–16).
In this study, we focused on children aged 2 years, applying an automated segmentation algorithm to a large set of retrospectively identified head multidetector computed tomography (MDCT) scans with normal radiological findings to develop a clinical reference database for regional brain volumes. This database can serve as a quantitative benchmark for evaluating cases within similar clinical peer groups.
2 Materials and methods
2.1 Study cohort and imaging protocol
This study was a retrospective analysis of head CTs identified from the clinical PACS, with institutional review board approval and a consent waiver obtained prior to data collection.
We consecutively collected scans from a CT scanner between October 2017 and May 2022. Cases consisted of patients with nonspecific symptoms (e.g., head injury, headache, fever, vomiting) and no known systemic disease. All control cases were reviewed by two board-certified neuroradiologists and confirmed as normal, without acute or chronic abnormalities. Cases with image artifacts or a history of brain conditions-such as intracranial hemorrhage, skull fracture, or neurodevelopmental impairments-were excluded. Additionally, patients with prior or follow-up CT/MRI revealing intracranial abnormalities (e.g., cysts, hyperintense FLAIR lesions) were excluded from the analysis.
2.2 CT segmentation with ResU-Net model
In this study, we applied the ResU-Net (17) model to segment brain anatomical regions on CT images. First, this study involved 1,487 patients with multidetector computed tomography (MDCT) scans. We trained and tested the ResU-Net model on this dataset. Then, we used the trained ResU-Net model to obtain segmentation results on the CT data set. Further details on data acquisition, preprocessing, and model training and testing methodologies are provided below.
2.2.1 Data acquisition
To train the ResU-Net model, 1,487 patients were enrolled. All enrolled patients underwent multidetector computed tomography (MDCT) scans. MDCT images were used for the brain segmentation task and volume analysis task. All scans were performed using a 256-row detector CT scanner (Revolution CT, GE Healthcare) in axial scan mode. The detector coverage was adjusted based on the patient’s head size, with options of 12, 14, or 16 cm. The tube voltage was set at 120 kVp, and the gantry rotation time was 0.8 s. The tube current was tailored to the children’s age, ranging from 150 mA for children aged 0–2 years, 170 mA for children aged 3–6 years, 190 mA for children aged 7–12 years, and 210 mA for children aged 13 years and older. Additionally, radiologic technologists could adjust the tube current by ±10 mA based on their experience.
The scan matrix size was 512 × 512, with both slice thickness and slice spacing set to 0.625 mm. The volume CT dose index (CTDIVOL) was approximately 16–20 mGy. The original scan data were then reconstructed into standard window images with a slice thickness of 0.625 mm and a slice spacing of 0.625 mm. Bone window images were also reconstructed using a window width of 4,000 and a window level of 700, while standard window images had a window width of 100 and a window level of 30. These images were subsequently uploaded to the PACS system.
The scans were performed in a single rotation with the patient in a fixed, supine position. The scanning range extended from the base of the skull to the top of the skull. For children unable to cooperate during the procedure, sedation was administered using oral chloral hydrate (10%, 0.4 mL/kg) before the scan.
The dataset was divided into training (n = 1,041) and test (n = 446) sets in a 7:3 ratio. The training set was utilized to train the ResU-Net model, while the test set was reserved for independent evaluation to assess the model’s performance. This approach ensures that the model is trained on a sufficiently large sample while also enabling an unbiased assessment of its ability to generalize to new, unseen data.
2.2.2 Data preprocessing
Before training and testing the model, we applied a series of preprocessing steps to all the images, including resampling, intensity normalization, and skull stripping. First, we resampled all 3D images using linear interpolation to achieve a voxel spacing of 1 × 1 × 1 mm3. Next, we performed intensity normalization through adaptive histogram equalization to enhance the contrast of the images. Finally, we used the Python library SimpleITK to perform skull stripping by applying threshold segmentation to remove the skull. This process eliminated the skull’s occlusion of the brain tissue, allowing for clearer visualization of the brain tissue’s morphology and density.
In this study, expert labeling was first established through manual labeling by a neuroradiologist with 6 years of experience, under the supervision of a pediatric neurodiagnostic specialist with over 15 years of expertise. Segmentation followed neuroanatomical atlases and previous studies (16, 18–21), with manual labeling performed on axial slices and adjusted in coronal and sagittal views. These expert labels were then used as the segmentation templates. To generate a large labeled dataset for model training, pseudo-labels were created through a template-based registration process using ANTs (Advanced Normalization Tools). The pseudo-labels were then roughly visually inspected by the experts to correct any evident segmentation errors. After correction, these pseudo-labels were treated as the ground truth labels for training the deep learning model.
The segmentation focused on 10 brain regions, including the right/left frontal lobes, parietal lobes, occipital lobes, temporal lobes, cerebellum, and brainstem. These regions were selected based on their clear anatomical boundaries and the feasibility of accurate segmentation in pediatric CT images. Due to the ongoing myelination process in children’s brains, distinguishing gray and white matter is challenging. As a result, we prioritized larger brain lobes and structures that are more easily identifiable in CT scans. Manual labeling was performed on axial slices, with adjustments made in coronal and sagittal views to ensure accuracy. ITK-SNAP software (Version 3.6.0) was used for these manual annotations.
2.2.3 Model training and testing
The network architecture of the ResU-Net model used in this study is shown in Figure 1. The ResU-Net model processes 3D CT images through a combination of residual connections, U-Net skip connections, subsampling, and up-sampling operations. It uses 27 convolutional layers to achieve precise and detailed segmentation, enhancing convergence speed and computational efficiency.
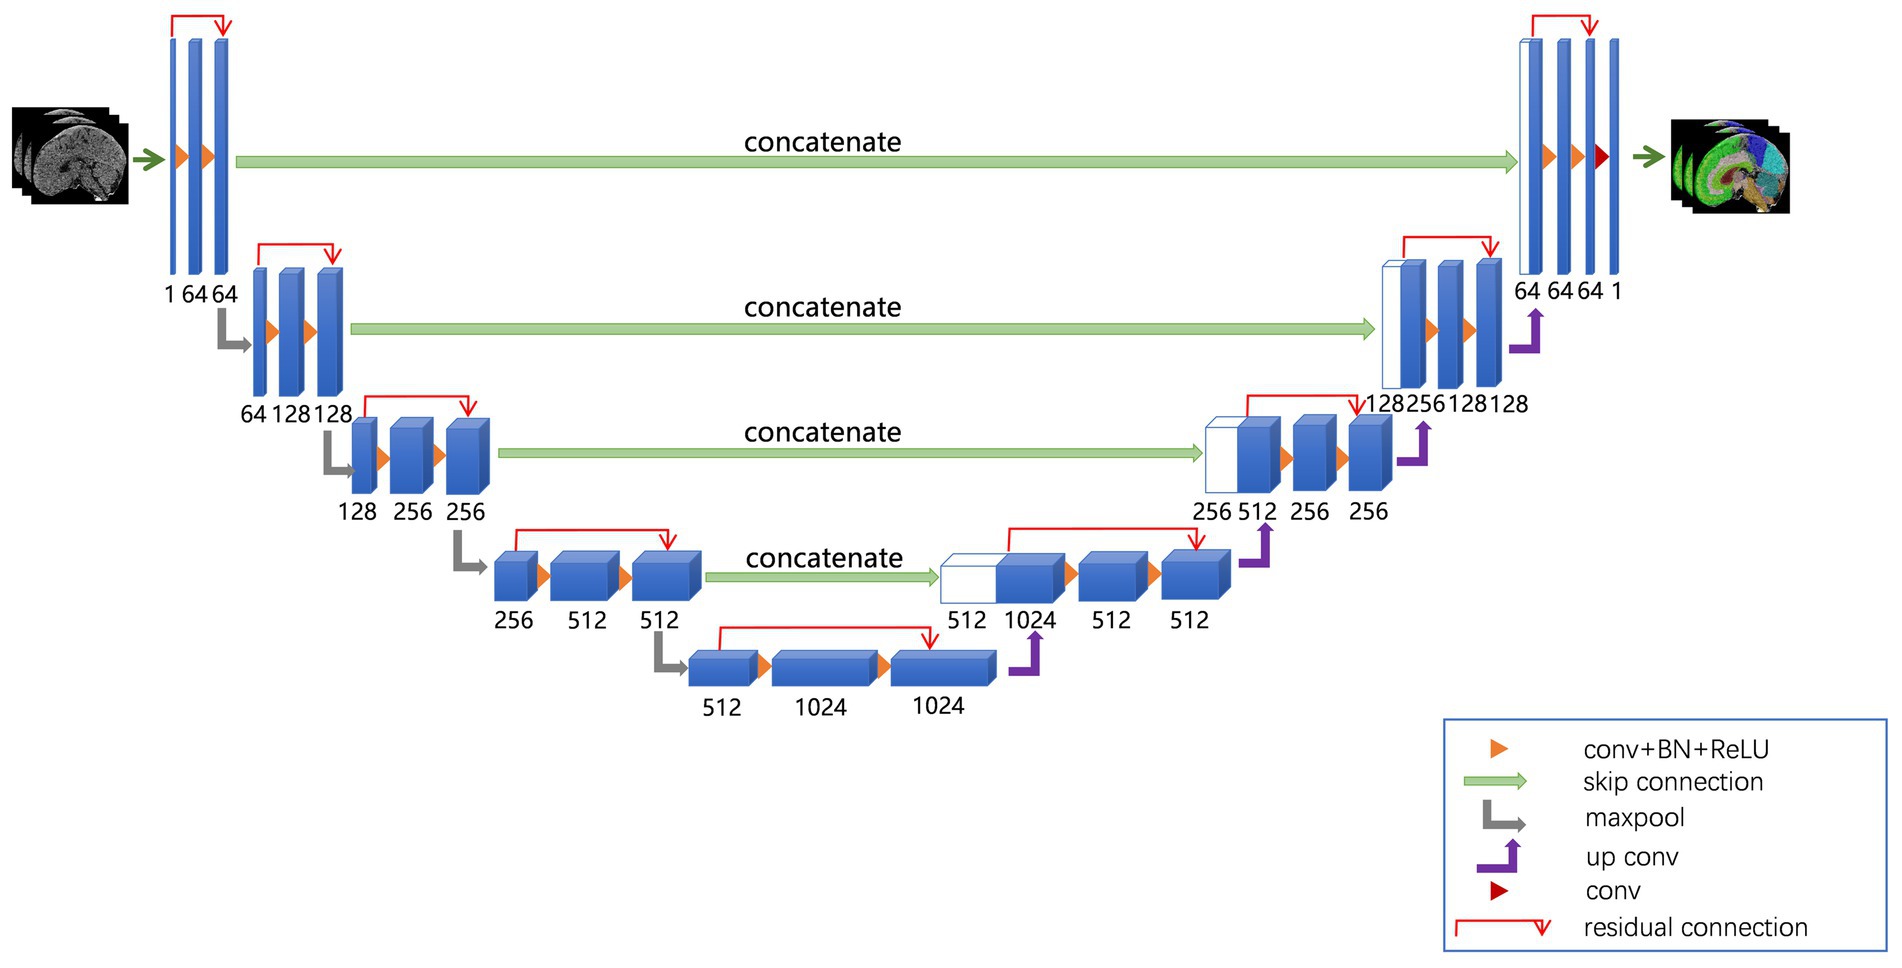
Figure 1. ResU-Net used in this study. The ResU-Net network processed 3D CT images through a combination of residual connections, U-Net skip connections, sub-sampling, and up-sampling operations.
We employed the ResU-Net model to segment brain structures. To enhance the robustness of the model, we selected data augmentation methods, including random flips and rotations, for the training data, while no augmentation was applied to the testing data to ensure a fair evaluation of the model’s performance. Next, we built the deep learning model in PyTorch and trained it with five-fold cross-validation. Model parameters were updated using a multi-class cross-entropy loss function and the Adam optimizer, with a learning rate of 1 × 10⁻⁵. Training was conducted over 200 epochs with a batch size of 4. Finally, the model’s performance was evaluated using the Dice similarity score (22).
2.2.4 Comparison of ResU-Net configurations
In this study, we compared the performance of ResU-Net network with different kernel sizes by evaluating three configurations: ResU-Net model with a 3 × 3 × 3 convolution kernel, ResU-Net model with a 1 × 3 × 3 convolution kernel, and the baseline model, which was the standard 3D U-Net model. To assess segmentation accuracy, we calculated the average Dice coefficient over 10 training sessions to compare the performance of the different models. These results were analyzed to evaluate the impact of varying kernel sizes on model performance, with the baseline 3D U-Net serving as a reference for comparing the improvements or trade-offs introduced by modifying the kernel size in ResU-Net network.
2.3 Statistical analysis
All statistical analyses were performed on SPSS 26.0 software. Descriptive statistics are reported as mean ± standard deviation. We conducted one-sample t-tests and analysis of variance (ANOVA) to examine the age and sex distributions of the samples in both the training and testing sets, ensuring that no bias was introduced in the group assignments. Next, we assessed the effects of sex and age on brain structure volumes using multiple linear regression analyses. Specifically, sex was included as a categorical variable (coded as 1 for males and 2 for females) in the regression models to isolate its impact on brain volume, while also adjusting for age. Additionally, a paired t-test was used to compare the left and right hemispheres, with the corresponding p-value calculated to evaluate the statistical significance of the difference. A p value of < 0.05 was considered statistically significant.
3 Results
3.1 Performance of ResU-Net model during training and testing
Overall, the ResU-Net model demonstrated strong performance in segmenting intracranial brain tissue, achieving an average Dice coefficient of 0.94 on the training set and 0.96 on the test set. Figure 2 presents representative segmentation results for 10 brain anatomical regions from a sample in the testing set. Figures 2a–c display axial, sagittal, and coronal sections with ground truth segmentation labels, while Figures 2d–f show the corresponding sections with ResU-Net model generated labels. Overall, our model results aligned closely with the ground truth, although some minor missed and extra labels appear at the edges in Figures 2d,e.

Figure 2. Segmentation results for a sample subject from the testing set. Panels (a–c) show axial, sagittal, and coronal CT sections with ground truth labels, while panels (d–f) display the corresponding sections with labels generated by the ResU-Net model. Ten brain regions—right and left frontal lobes, right and left parietal lobes, right and left occipital lobes, right and left temporal lobes, cerebellum, and brainstem—are color-coded and labeled on the right.
3.2 Comparison of model performance
In the training set, the Dice coefficients for the Baseline model, ResU-Net (1,3,3) model, and ResU-Net (3,3,3) models were 0.94, 0.93, and 0.92, respectively. These values indicate similar performance in segmentation accuracy, with the Baseline model slightly outperforming the ResU-Net configurations. The small differences in training Dice coefficients suggest that all models effectively learned to segment brain regions.
However, in the test set, the ResU-Net (1,3,3) models and ResU-Net (3,3,3) models showed substantial improvements, achieving Dice coefficients of 0.92 and 0.96, respectively, while the Baseline model dropped to 0.88. This indicates that the ResU-Net models, particularly the ResU-Net (3,3,3) model, generalize better to unseen data. This is likely due to their ability to capture more robust features and adapt to variations in test images more effectively than the Baseline model.
The decline in the Baseline model’s performance from training (0.94) to testing (0.88) suggests overfitting to the training data. This reinforces the advantages of using ResU-Net network with residual connections, as these models maintained consistent performance across both training and testing, thereby reducing the risk of overfitting and improving the model’s generalization ability.
3.3 Sample demographics
The cohort included 826 males and 661 females, totaling 1,487 participants. The ages of the participants ranged from 1.5 to 2.5 years, with a mean age of 1.98 ± 0.28 years. There were no statistically significant differences in age or gender distribution between the training and test sets (p > 0.05). Further details are provided in Table 1.
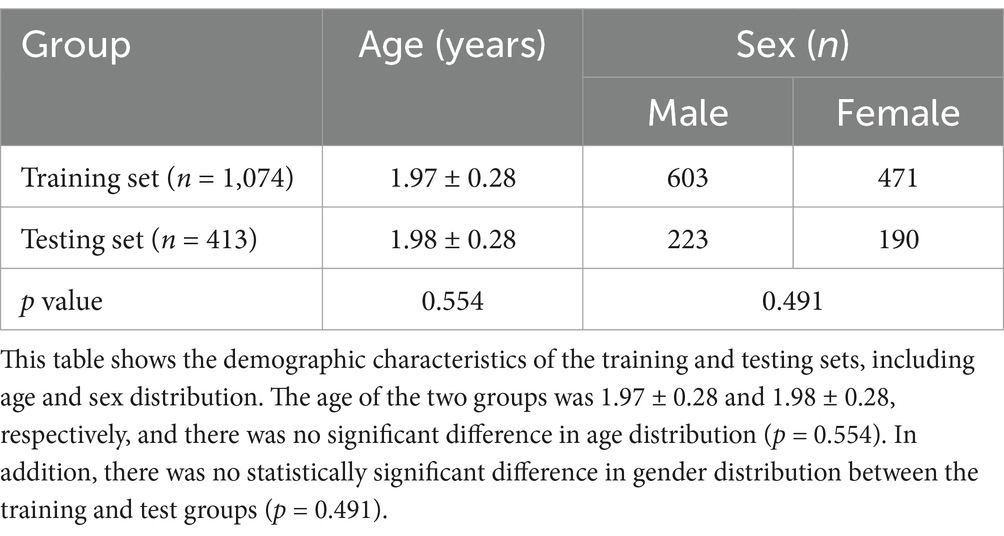
Table 1. Demographics characteristics between training and testing set.
3.4 Influence of sex and age on brain volume
The average brain region volumes in healthy 2-year-old children were as follows: right frontal lobe (200.64 ± 19.15 cm3), left frontal lobe (204.51 ± 19.61 cm3), right parietal lobe (81.52 ± 7.91 cm3), left parietal lobe (79.42 ± 7.65 cm3), right occipital lobe (53.76 ± 5.21 cm3), left occipital lobe (52.82 ± 5.33 cm3), right temporal lobe (91.92 ± 9.07 cm3), left temporal lobe (94.08 ± 9.27 cm3). Additionally, the cerebellum volume was 127.97 ± 11.85 cm3, and the brainstem volume was 15.47 ± 1.50 cm3. A more detailed description is provided in Table 2, which includes the distribution of brain volumes by sex.
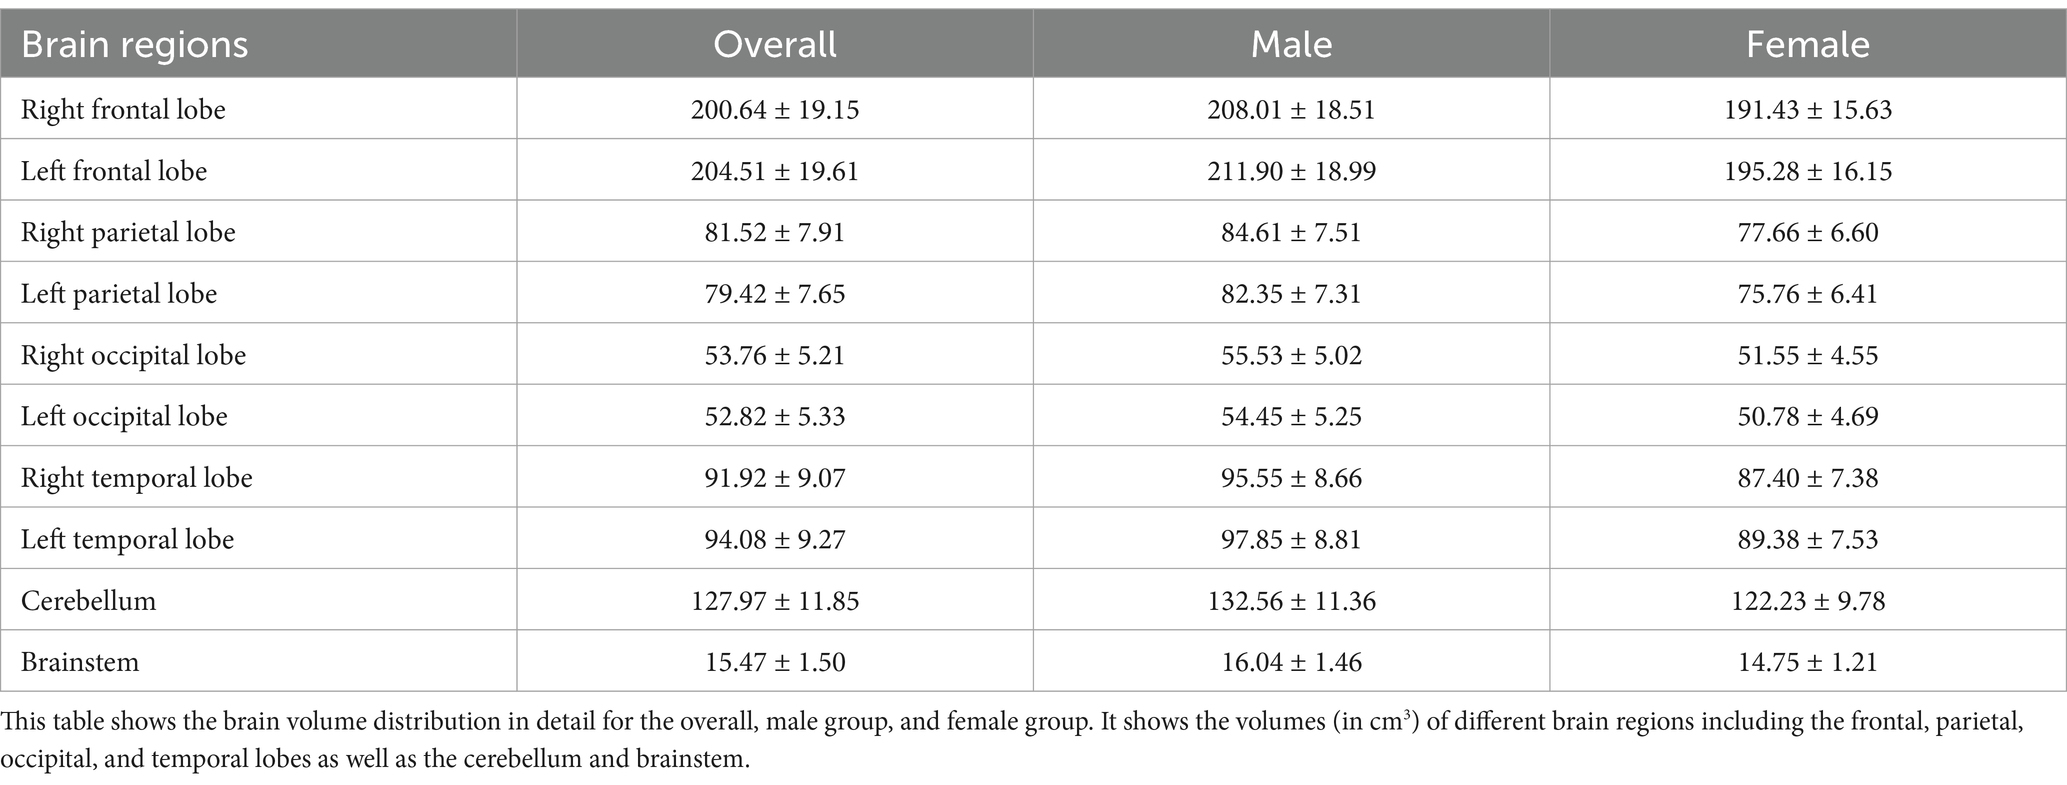
Table 2. Distribution of brain structure volumes (cm3).
We analyzed the effect of age and sex on brain volume using multiple regression analysis. The results in Table 3 demonstrate the effect of gender on volume. Statistical analysis showed that the brain volume of males was generally larger than that of females at the same age, and the results were statistically significant (p < 0.001).
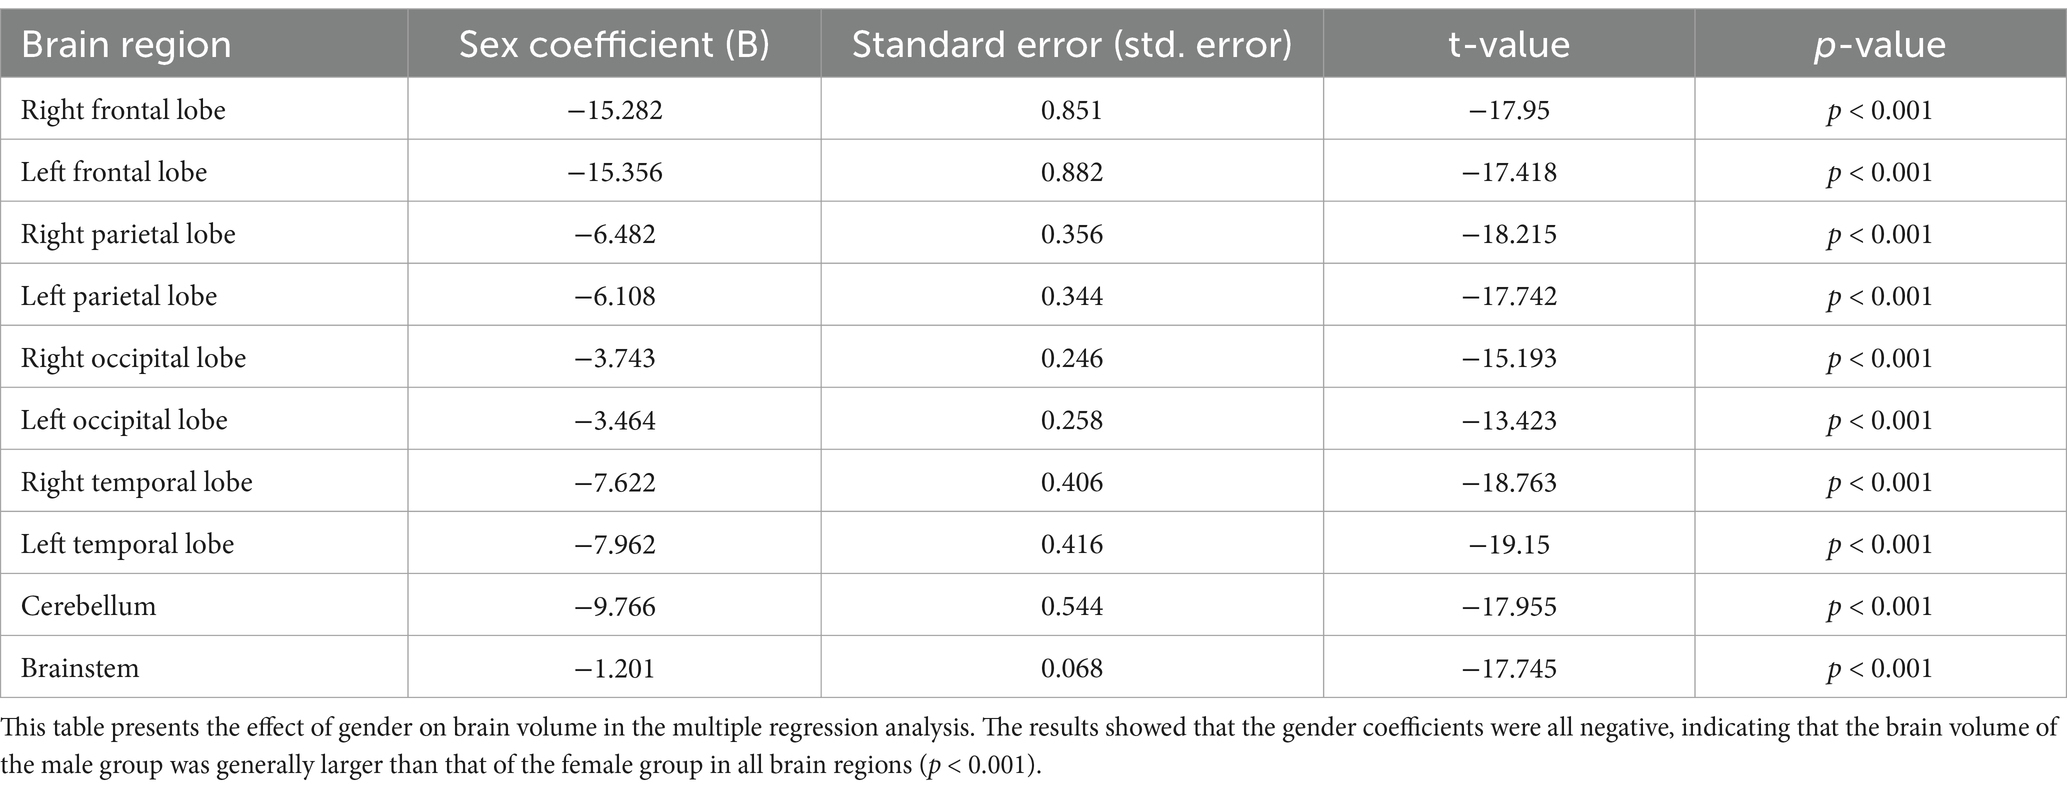
Table 3. Effect of sex on brain volume.
The results in Table 4 present the effect of age on brain volume. Statistical results showed that age had a significant effect on each brain volume (p < 0.001). Brain volume increases with age in all brain regions. However, brain volumes in different regions grew at different rates because they had different regression coefficients. Figure 3 visualizes the relationship between age and brain volumes, showing how the volumes of these regions increase with age.
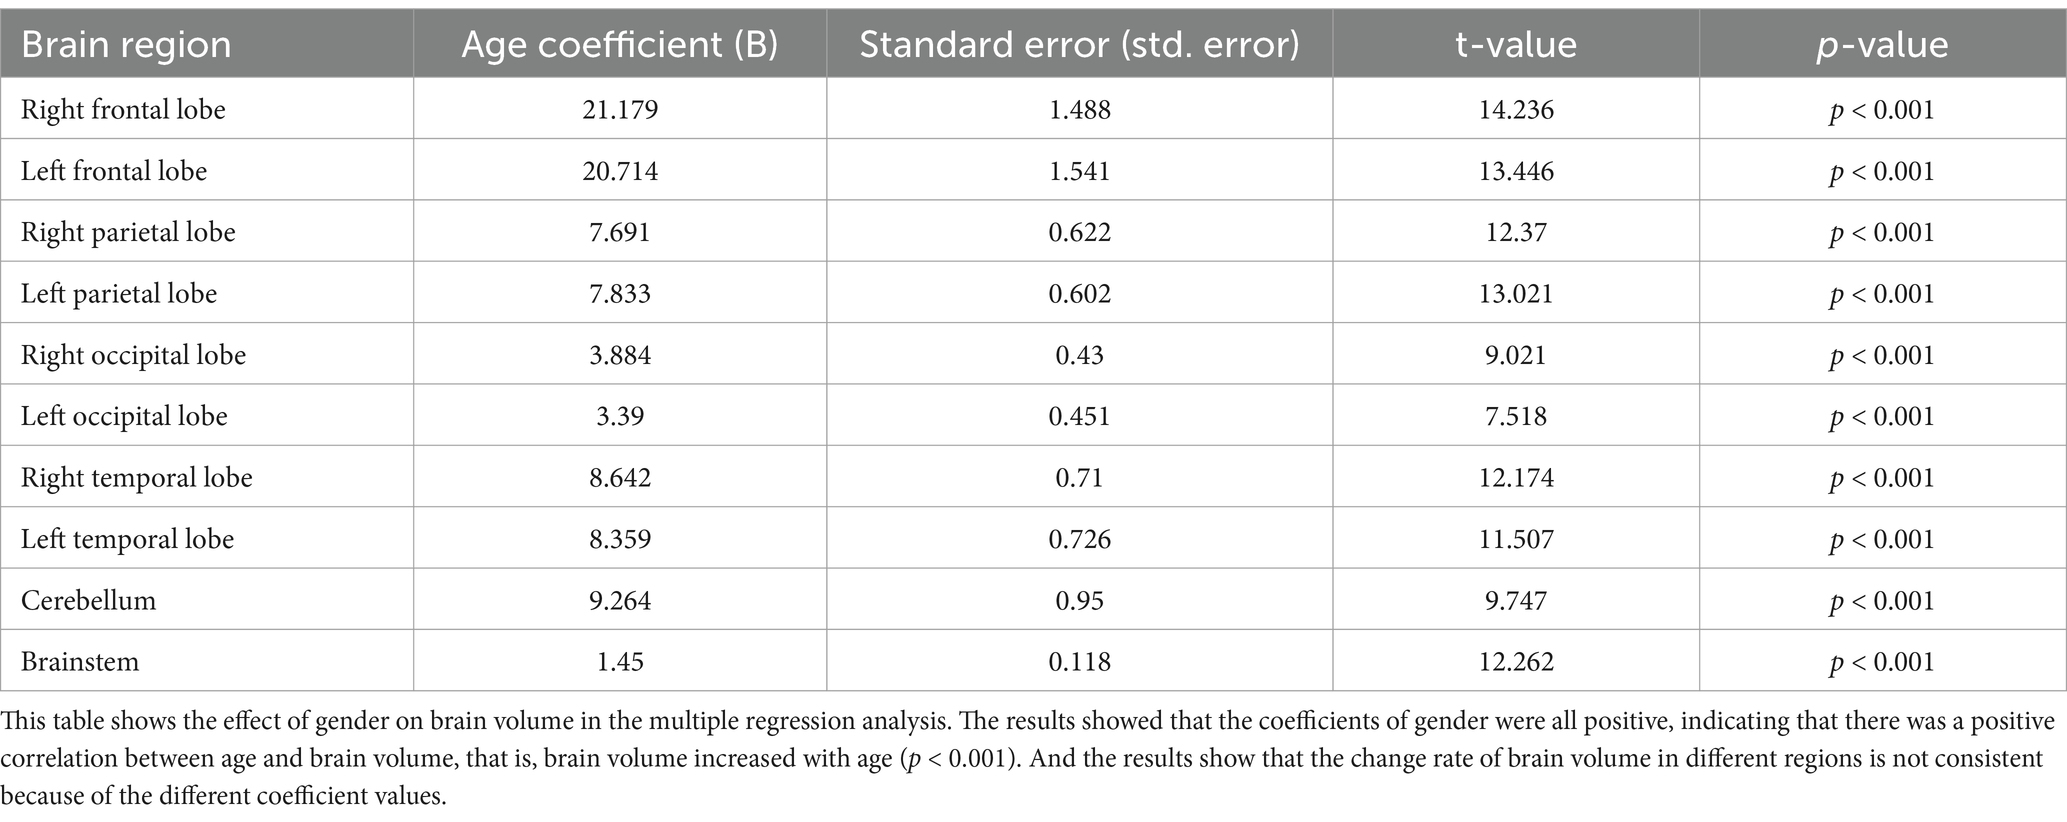
Table 4. Effect of age on brain volume.
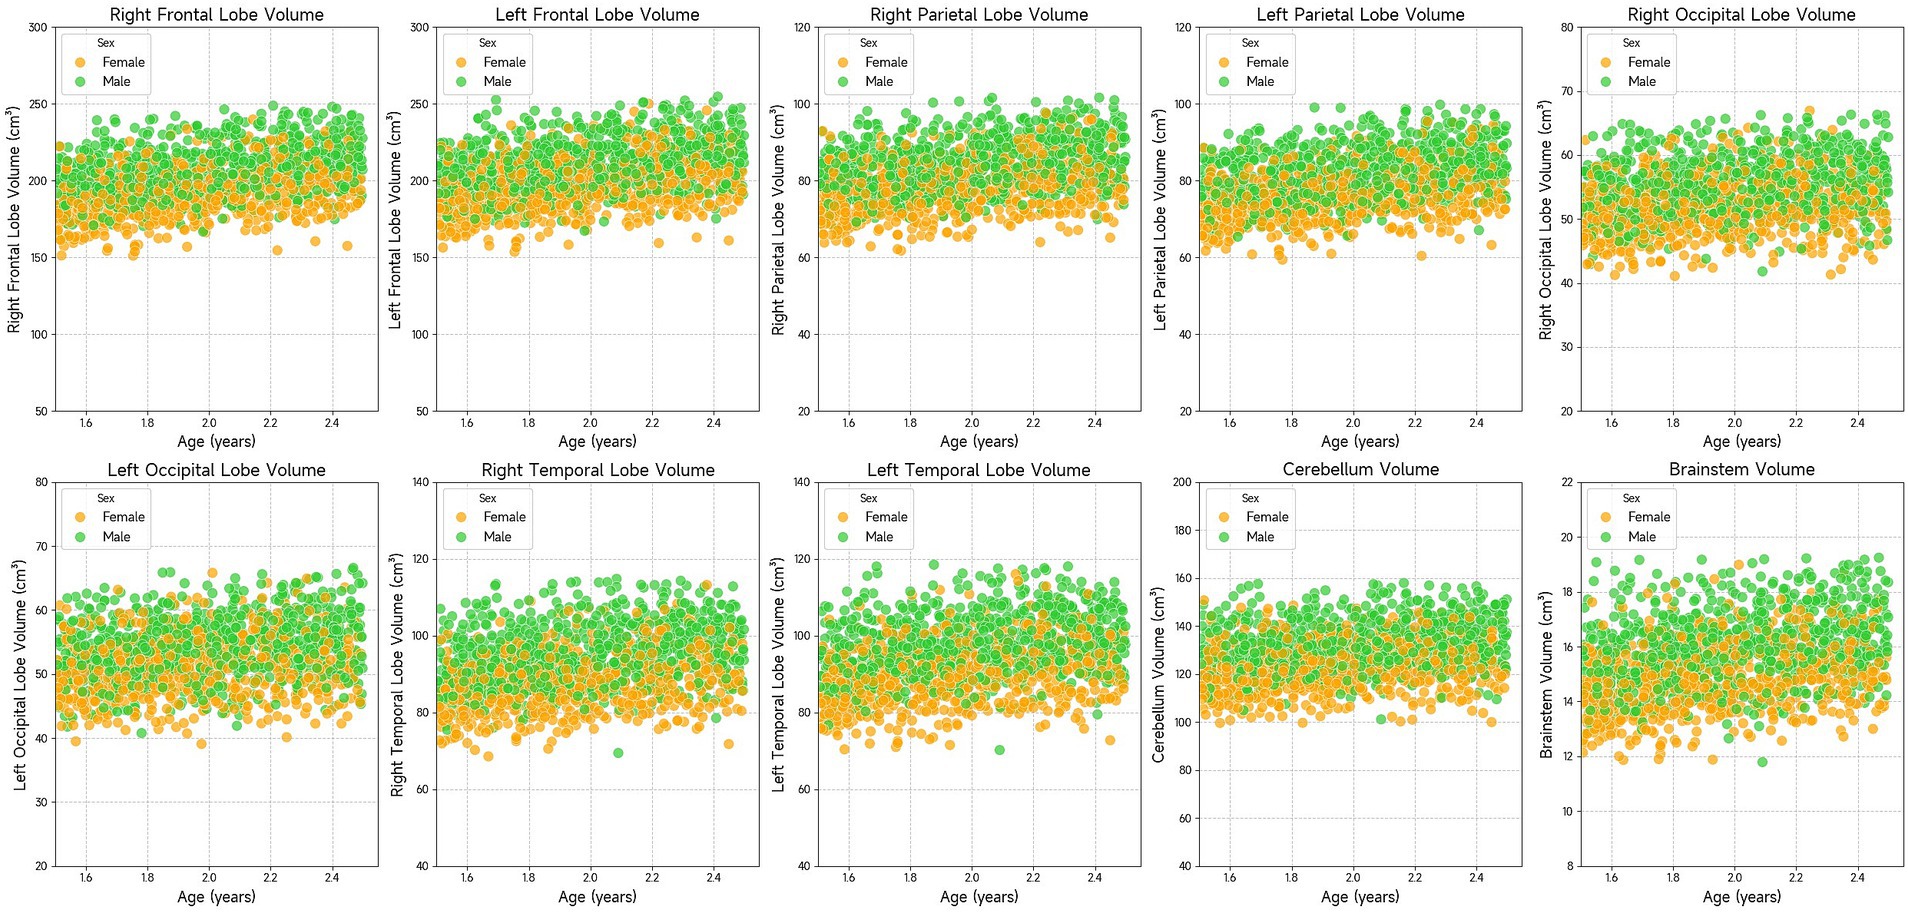
Figure 3. Scatter plots showing the volume of various brain regions (right frontal lobe, left frontal lobe, right parietal lobe, left parietal lobe, right occipital lobe, left occipital lobe, right temporal lobe, left temporal lobe, cerebellum, and brainstem) in relation to age. The data suggests that brain region volumes generally increase with age. Males and females are represented with green and orange dots, respectively.
3.5 Comparison of brain volumes by hemisphere
We performed paired comparisons between the left and right sides of symmetrical structures in the brain, including frontal, parietal, occipital, and temporal lobes. The statistical results in Table 5 show that there are statistical differences in the left and right brain volumes of each lobe (p < 0.001), which indicates the asymmetry of the left and right sides.
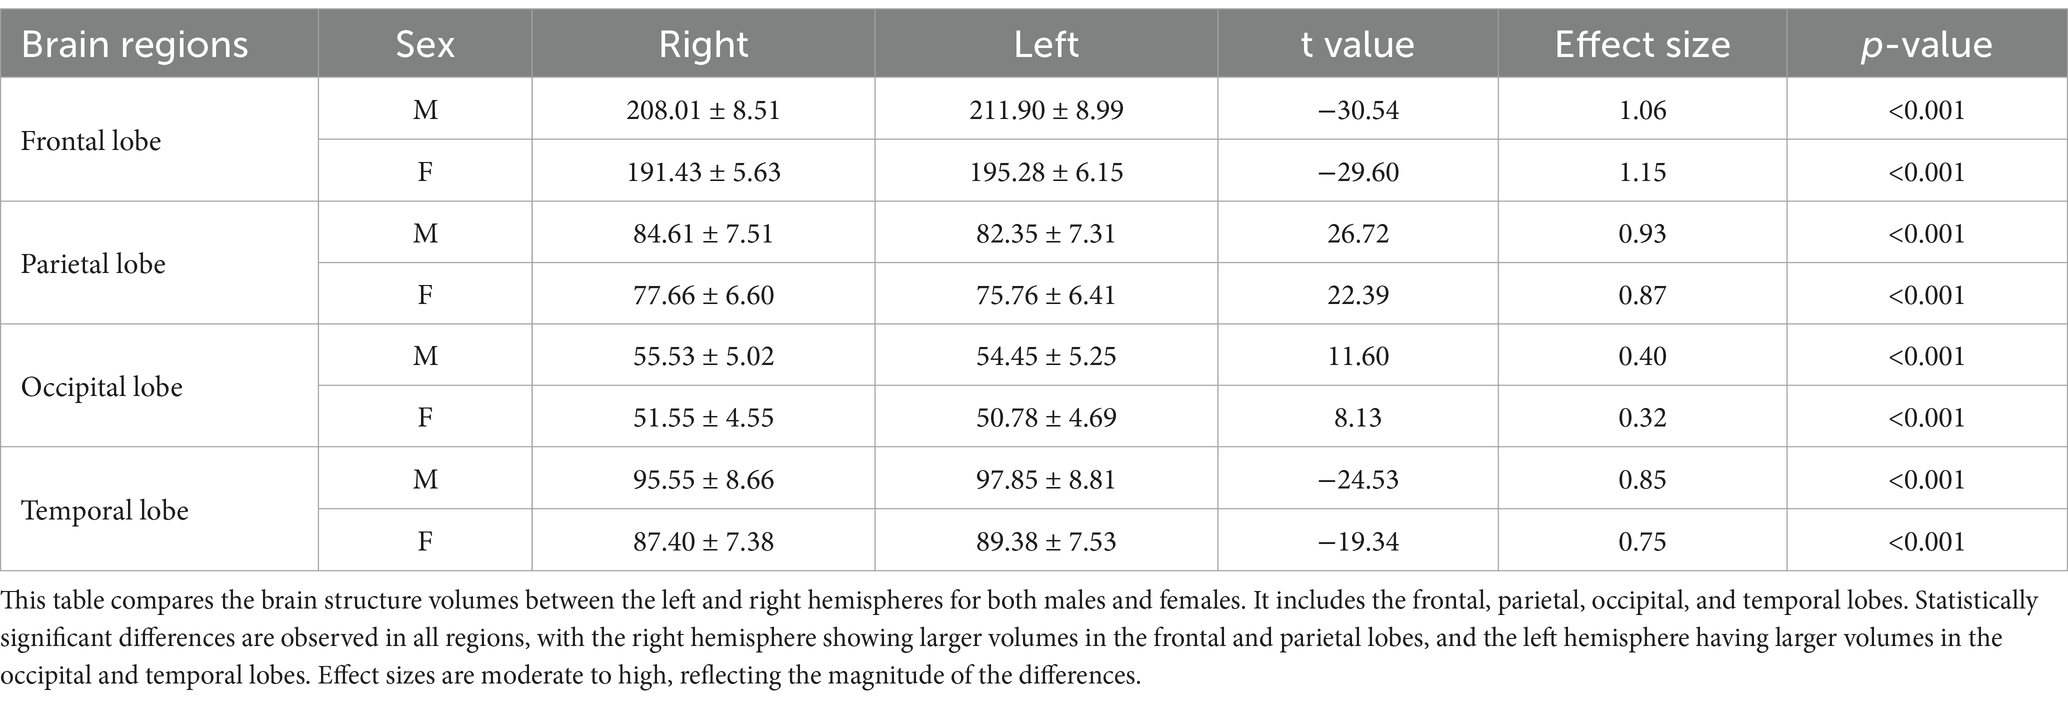
Table 5. Comparison of left and right brain structure volumes.
4 Discussion
Childhood is a critical period for brain development, particularly in the first few years of life when the brain undergoes rapid growth and completes many developmental stages (6, 23). Brain development is influenced by various internal and environmental factors (24), and diseases during this period can significantly impact development (3, 7, 24–26). Brain volume is a key measure of brain development, obtained through non-invasive neuroimaging techniques such as high-resolution MRI, and is an important indicator of health and disease status in children. Quantitative assessments of brain volume are increasingly used in studies of neurological disorders (25, 27, 28). However, the lack of population-based reference standards for healthy brain volume complicates the clinical assessment of individual diseases (29, 30). Due to the limited availability of high-resolution MRI data in children and the small sample sizes in related studies, establishing a normative reference standard for brain volume remains challenging (4, 5, 31, 32). In addition, MRI may not be feasible in certain clinical scenarios, such as emergency situations or with patients who have medical devices that cause significant artifacts (e.g., endotracheal tubes or other hardware). These limitations can restrict the ability to obtain reliable brain volume measurements in diverse pediatric populations.
CT imaging, with its faster acquisition time and wider clinical application, offers an opportunity to accumulate large datasets, making it feasible for studies involving larger and more diverse populations. In this study, CT data were used to measure brain volumes, with the expectation that these findings will complement and extend results from MRI studies. By leveraging the strengths of CT imaging, we aim to address some of the limitations associated with MRI and provide a more comprehensive understanding of brain development and disease in children.
This study utilized the ResU-Net deep learning model for brain tissue segmentation. In recent years, deep learning has become increasingly prevalent in medical image processing, particularly in segmentation tasks, due to its speed and robustness (33–39). Previous research has shown that deep learning algorithms perform well in brain tissue segmentation, with results comparable to those from MRI (14, 16). The Dice coefficient of 0.96 obtained in this study demonstrates that the ResU-Net algorithm achieved good segmentation efficiency. Furthermore, the use of residual connections in ResU-Net model enhances feature propagation and helps mitigate the risk of overfitting, which is particularly crucial when working with complex and noisy medical imaging data. This advantage is supported by other studies, which have demonstrated that incorporating residual connections into network architectures leads to improvements in segmentation accuracy (40).
Our findings indicate that brain volume in males is generally larger than in females, which is consistent with previous studies (5, 7, 41, 42). Research suggests that male brain volume is larger than that of females across all ages (41, 43). This difference may be influenced by several factors, including gonadal hormones, neurosteroids, and epigenetic and environmental factors (44–47). These influences contribute to significant sex-based differences in brain development, which may also affect the manifestation of neuropsychiatric disorders, neurodegenerative diseases, and trauma-related conditions (44).
Brain volume development varies across regions and ages during childhood, which is essential for understanding cognitive and neurological development. The brain grows rapidly during childhood, with different regions maturing at different rates (6, 48, 49). Gray matter volume peaks around age 6 before gradually decreasing, whereas white matter continues to develop until approximately age 28. The growth trajectories of different regions are heterogeneous, with regions associated with sensory and motor control reaching developmental peaks earlier, while prefrontal regions related to higher cognitive functions develop more slowly. Although this study focused on 2-year-olds, we observed a positive correlation between brain region volume and age, confirming the rapid brain development occurring at this age.
Moreover, the study also revealed structural asymmetry in the brain: the left frontal and temporal lobes were larger than their right counterparts, while the right parietal and occipital lobes were larger than the left. Although the brain exhibits a high degree of left–right symmetry at a macroscopic anatomical and functional level, subtle structural differences exist between hemispheres (50). This asymmetry is closely linked to higher cognitive functions such as language processing, spatial cognition, facial recognition, and emotional response (51). For example, the left hemisphere is more involved in language production and comprehension, while the right hemisphere plays a key role in processing non-verbal information. Brain asymmetry is influenced by factors such as genetics, environment, and hormones (50). The study of brain lateralization is crucial for understanding brain mechanisms and identifying specific diseases. Previous studies have shown that changes in brain asymmetry are associated with neurodegenerative diseases and neuropsychiatric disorders (52, 53). These findings may provide useful biomarkers or clinical predictors of disease, offering insights into the neurobiology of these conditions.
Several factors should be considered when interpreting these results. One challenge is the reliance on a single manual segmentation template for brain CT data, particularly due to the lack of standardized templates for children. This reliance may affect the accuracy and generalizability of the findings. Therefore, future research should focus on developing multiple segmentation templates to enhance both accuracy and model robustness. Another limitation is that the data in this study were obtained from a single center and a single device, with no validation from multi-center or multi-device datasets. This could impact the model’s adaptability to different scanning devices, scanning parameters, and image qualities. For instance, in real clinical settings, imaging data may be affected by noise, artifacts, or inadequate resolution. The robustness of the model in this study to such low-quality data has not been thoroughly tested, which could impact its reliability in practical applications. To address this issue, future studies will aim to expand data sources through multi-center collaborations and establish standardized data-sharing platforms to foster data exchange and promote collaborative research across various studies. Moreover, while this study focused on a “normal” population, the sample primarily consisted of trauma patients. Although efforts were made to exclude abnormal cases, minor trauma that was not identified by CT scans may have been overlooked, potentially affecting brain volume measurements. To improve detection of minor trauma, future research will develop deep learning-based detection techniques. Furthermore, collecting more detailed clinical information in subsequent studies will help to exclude such cases, ensuring that the findings are both accurate and comparable across different cohorts.
In conclusion, this study highlights the potential of deep learning for automatic brain tissue segmentation. Using existing clinical head CT data, our approach lays the groundwork for future clinical applications in diagnosis, treatment, and research.
Data availability statement
The original contributions presented in the study are included in the article, further inquiries can be directed to the corresponding authors.
Ethics statement
The studies involving humans were approved by Institutional Review Board of Beijing Children’s Hospital. The studies were conducted in accordance with the local legislation and institutional requirements. Written informed consent for participation was not required from the participants or the participants’ legal guardians/next of kin in accordance with the national legislation and institutional requirements.
Author contributions
FX: Data curation, Writing – original draft, Formal analysis, Methodology, Visualization. LT: Writing – review & editing, Methodology, Software, Supervision. FZ: Writing – original draft, Methodology, Software, Visualization. YZ: Writing – original draft, Methodology, Software, Visualization. JM: Writing – review & editing, Investigation, Supervision. YP: Writing – review & editing, Conceptualization, Funding acquisition, Investigation, Supervision.
Funding
The author(s) declare that financial support was received for the research and/or publication of this article. This work was supported by the National Natural Science Foundation of China (Grant No. 12171330), the STI 2030—Major Projects (Grant No. 2021ZD0200508), and Beijing Hospitals Authority’s Ascent Plan (Grant No.DFL20221002). The funders had no role in the study design, data collection and analysis, decision to publish, or preparation of the manuscript.
Acknowledgments
The authors would like to express their sincere gratitude to all participants who took part in this study.
Conflict of interest
The authors declare that the research was conducted in the absence of any commercial or financial relationships that could be construed as a potential conflict of interest.
Generative AI statement
The authors declare that no Gen AI was used in the creation of this manuscript.
Publisher’s note
All claims expressed in this article are solely those of the authors and do not necessarily represent those of their affiliated organizations, or those of the publisher, the editors and the reviewers. Any product that may be evaluated in this article, or claim that may be made by its manufacturer, is not guaranteed or endorsed by the publisher.
References
1. Goo, HW. Hydrocephalus: ventricular volume quantification using three-dimensional brain CT data and semiautomatic three-dimensional threshold-based segmentation approach. Korean J Radiol. (2021) 22:435–41. doi: 10.3348/kjr.2020.0671
2. Bigler, ED, and Volumetric, MRI. Findings in mild traumatic brain injury (mTBI) and neuropsychological outcome. Neuropsychol Rev. (2023) 33:5–41. doi: 10.1007/s11065-020-09474-0
3. Boedhoe, PSW, van Rooij, D, Hoogman, M, Twisk, JWR, Schmaal, L, Abe, Y, et al. Subcortical brain volume, regional cortical thickness, and cortical surface area across disorders: findings from the ENIGMA ADHD, ASD, and OCD working groups. AJP. (2020) 177:834–43. doi: 10.1176/appi.ajp.2020.19030331
4. Schabdach, JM, Schmitt, JE, Sotardi, S, Vossough, A, Andronikou, S, Roberts, TP, et al. Brain growth charts for quantitative analysis of pediatric clinical brain MRI scans with limited imaging pathology. Radiology. (2023) 309:e230096. doi: 10.1148/radiol.230096
5. Zhang, H, Li, J, Su, X, Hu, Y, Liu, T, Ni, S, et al. Growth charts of brain morphometry for preschool children. Neuroimage. (2022) 255:119178. doi: 10.1016/j.neuroimage.2022.119178
6. Bethlehem, RA I, Seidlitz, J, White, SR, Vogel, JW, Anderson, KM, Adamson, C, et al. Brain charts for the human lifespan. Nature. (2022) 604:525–33. doi: 10.1038/s41586-022-04554-y
7. Alex, AM, Aguate, F, Botteron, K, Buss, C, Chong, Y-S, Dager, SR, et al. A global multicohort study to map subcortical brain development and cognition in infancy and early childhood. Nat Neurosci. (2024) 27:176–86. doi: 10.1038/s41593-023-01501-6
8. Raschle, N, Zuk, J, Ortiz-Mantilla, S, Sliva, DD, Franceschi, A, Grant, PE, et al. Pediatric neuroimaging in early childhood and infancy: challenges and practical guidelines. Ann N Y Acad Sci. (2012) 1252:43–50. doi: 10.1111/j.1749-6632.2012.06457.x
9. Cauley, KA, Hu, Y, Och, J, Yorks, PJ, and Fielden, SW. Modeling early postnatal brain growth and development with CT: changes in the brain Radiodensity histogram from birth to 2 years. AJNR Am J Neuroradiol. (2018) 39:775–81. doi: 10.3174/ajnr.A5559
10. Marin, JR, Rodean, J, Hall, M, Alpern, ER, Aronson, PL, Chaudhari, PP, et al. Trends in use of advanced imaging in pediatric emergency departments, 2009-2018. JAMA Pediatr. (2020) 174:e202209. doi: 10.1001/jamapediatrics.2020.2209
11. Adduru, V, Baum, SA, Zhang, C, Helguera, M, Zand, R, Lichtenstein, M, et al. A method to estimate brain volume from head CT images and application to detect brain atrophy in Alzheimer disease. AJNR Am J Neuroradiol. (2020) 41:224–30. doi: 10.3174/ajnr.A6402
12. Jaroenngarmsamer, T, Benali, F, Fladt, J, Singh, N, Bala, F, Tymianski, M, et al. Cortical and subcortical brain atrophy assessment using simple measures on NCCT compared with MRI in acute stroke. AJNR Am J Neuroradiol. (2023) 44:1144–9. doi: 10.3174/ajnr.A7981
13. Srikrishna, M, Ashton, NJ, Moscoso, A, Pereira, JB, Heckemann, RA, van Westen, D, et al. CT-based volumetric measures obtained through deep learning: association with biomarkers of neurodegeneration. Alzheimers Dement. (2024) 20:629–40. doi: 10.1002/alz.13445
14. Srikrishna, M, Pereira, JB, Heckemann, RA, Volpe, G, van Westen, D, Zettergren, A, et al. Deep learning from MRI-derived labels enables automatic brain tissue classification on human brain CT. NeuroImage. (2021) 244:118606. doi: 10.1016/j.neuroimage.2021.118606
15. Cai, JC, Akkus, Z, Philbrick, KA, Boonrod, A, Hoodeshenas, S, Weston, AD, et al. Fully automated segmentation of head CT neuroanatomy using deep learning. Radiology. (2020) 2:e190183. doi: 10.1148/ryai.2020190183
16. Wang, T, Xing, H, Li, Y, Wang, S, Liu, L, Li, F, et al. Deep learning-based automated segmentation of eight brain anatomical regions using head CT images in PET/CT. BMC Med Imaging. (2022) 22:99. doi: 10.1186/s12880-022-00807-4
17. IEEE Xplore. Deep Residual Learning for Image Recognition. (2016) IEEE Conference Publication|. Available online at: https://ieeexplore.ieee.org/document/7780459 (Accessed November 13, 2024).
18. Oishi, K, Mori, S, Donohue, PK, Ernst, T, Anderson, L, Buchthal, S, et al. Multi-contrast human neonatal brain atlas: application to Normal neonate development analysis. NeuroImage. (2011) 56:8–20. doi: 10.1016/j.neuroimage.2011.01.051
19. Lancaster, JL, Woldorff, MG, Parsons, LM, Liotti, M, Freitas, CS, Rainey, L, et al. Automated Talairach atlas labels for functional brain mapping. Hum Brain Mapp. (2000) 10:120–31. doi: 10.1002/1097-0193(200007)10:3<120::AID-HBM30>3.0.CO;2-8
20. NITRC. WFU_PickAtlas: Tool/Resource Info. (2015) Available online at: https://www.nitrc.org/projects/wfu_pickatlas/ (Accessed September 18, 2024).
21. Lin, C-M, Tseng, Y-C, Hsu, H-L, Chen, C-J, Chen, DY-T, Yan, F-X, et al. Arterial spin labeling perfusion study in the patients with subacute mild traumatic brain injury. PLoS One. (2016) 11:e0149109. doi: 10.1371/journal.pone.0149109
22. Jaskiewicz, L, and Filipowicz, W. Role of dicer in posttranscriptional RNA silencing. Curr Top Microbiol Immunol. (2008) 320:77–97. doi: 10.1007/978-3-540-75157-1_4
23. Gilmore, JH, Knickmeyer, RC, and Gao, W. Imaging structural and functional brain development in early childhood. Nat Rev Neurosci. (2018) 19:123–37. doi: 10.1038/nrn.2018.1
24. Anderson, V, Spencer-Smith, M, and Wood, A. Do children really recover better? Neurobehavioural plasticity after early brain insult. Brain. (2011) 134:2197–221. doi: 10.1093/brain/awr103
25. Bourke, NJ, Demarchi, C, De Simoni, S, Samra, R, Patel, MC, Kuczynski, A, et al. Brain volume abnormalities and clinical outcomes following paediatric traumatic brain injury. Brain. (2022) 145:2920–34. doi: 10.1093/brain/awac130
26. Galler, JR, Bringas-Vega, ML, Tang, Q, Rabinowitz, AG, Musa, KI, Chai, WJ, et al. Neurodevelopmental effects of childhood malnutrition: a neuroimaging perspective. Neuroimage. (2021) 231:117828. doi: 10.1016/j.neuroimage.2021.117828
27. Giorgio, A, and De Stefano, N. Clinical use of brain volumetry. Magn Reson Imaging. (2013) 37:1–14. doi: 10.1002/jmri.23671
28. Castellanos, FX, Lee, PP, Sharp, W, Jeffries, NO, Greenstein, DK, Clasen, LS, et al. Developmental trajectories of brain volume abnormalities in children and adolescents with attention-deficit/hyperactivity disorder. JAMA. (2002) 288:1740–8. doi: 10.1001/jama.288.14.1740
29. Marquand, AF, Rezek, I, Buitelaar, J, and Beckmann, CF. Understanding heterogeneity in clinical cohorts using normative models: beyond case-control studies. Biol Psychiatry. (2016) 80:552–61. doi: 10.1016/j.biopsych.2015.12.023
30. Marquand, AF, Kia, SM, Zabihi, M, Wolfers, T, Buitelaar, JK, and Beckmann, CF. Conceptualizing mental disorders as deviations from normative functioning. Mol Psychiatry. (2019) 24:1415–24. doi: 10.1038/s41380-019-0441-1
31. Howell, BR, Styner, MA, Gao, W, Yap, P-T, Wang, L, Baluyot, K, et al. The UNC/UMN baby connectome project (BCP): an overview of the study design and protocol development. Neuroimage. (2019) 185:891–905. doi: 10.1016/j.neuroimage.2018.03.049
32. Almli, CR, Rivkin, MJ, and McKinstry, RC. The NIH MRI study of normal brain development (Objective-2): newborns, infants, toddlers, and preschoolers. Neuroimage. (2007) 35:308–25. doi: 10.1016/j.neuroimage.2006.08.058
33. Chen, X, Wang, X, Zhang, K, Fung, K-M, Thai, TC, Moore, K, et al. Recent advances and clinical applications of deep learning in medical image analysis. Med Image Anal. (2022) 79:102444. doi: 10.1016/j.media.2022.102444
34. Wang, L, Wang, H, Huang, Y, Yan, B, Chang, Z, Liu, Z, et al. Trends in the application of deep learning networks in medical image analysis: evolution between 2012 and 2020. Eur J Radiol. (2022) 146:110069. doi: 10.1016/j.ejrad.2021.110069
35. Billot, B, Magdamo, C, Cheng, Y, Arnold, SE, Das, S, and Iglesias, JE. Robust machine learning segmentation for large-scale analysis of heterogeneous clinical brain MRI datasets. Proc Natl Acad Sci USA. (2023) 120:e2216399120. doi: 10.1073/pnas.2216399120
36. Zhang, Z, Keles, E, Durak, G, Taktak, Y, Susladkar, O, Gorade, V, et al. Large-scale multi-center CT and MRI segmentation of pancreas with deep learning. Med Image Anal. (2025) 99:103382. doi: 10.1016/j.media.2024.103382
37. Sherifa, CA, and Kanisha, B. A review on medical image segmentation using deep learning In: SM Basha, H Taherdoost, and C Zanchettin, editors. Innovations in cybersecurity and data science. Singapore: Springer Nature (2024). 65–77.
38. Yoo, H, Moon, HE, Kim, S, Kim, DH, Choi, YH, Cheon, J-E, et al. Evaluation of image quality and scan time efficiency in accelerated 3D T1-weighted pediatric brain MRI using deep learning-based reconstruction. Korean J Radiol. (2025) 26:180–92. doi: 10.3348/kjr.2024.0701
39. Mahootiha, M, Tak, D, Ye, Z, Zapaishchykova, A, Likitlersuang, J, Climent Pardo, JC, et al. Multimodal deep learning improves recurrence risk prediction in pediatric low-grade gliomas. Neuro Oncol. (2025) 27:277–90. doi: 10.1093/neuonc/noae173
40. Yu, L, Chen, H, Dou, Q, Qin, J, and Heng, P-A. Automated melanoma recognition in Dermoscopy images via very deep residual networks. IEEE Trans Med Imaging. (2017) 36:994–1004. doi: 10.1109/TMI.2016.2642839
41. Kaczkurkin, AN, Raznahan, A, and Satterthwaite, TD. Sex differences in the developing brain: insights from multimodal neuroimaging. Neuropsychopharmacology. (2019) 44:71–85. doi: 10.1038/s41386-018-0111-z
42. Namburete, AIL, Papież, BW, Fernandes, M, Wyburd, MK, Hesse, LS, Moser, FA, et al. Normative spatiotemporal fetal brain maturation with satisfactory development at 2 years. Nature. (2023) 623:106–14. doi: 10.1038/s41586-023-06630-3
43. Kelly, CE, Thompson, DK, Adamson, CL, Ball, G, Dhollander, T, Beare, R, et al. Cortical growth from infancy to adolescence in preterm and term-born children. Brain. (2023) 147:1526–38. doi: 10.1093/brain/awad348
44. Panzica, G, and Melcangi, RC. Structural and molecular brain sexual differences: a tool to understand sex differences in health and disease. Neurosci Biobehav Rev. (2016) 67:2–8. doi: 10.1016/j.neubiorev.2016.04.017
45. McCarthy, MM, and Arnold, AP. Reframing sexual differentiation of the brain. Nat Neurosci. (2011) 14:677–83. doi: 10.1038/nn.2834
46. Jiang, Z, Sullivan, PF, Li, T, Zhao, B, Wang, X, Luo, T, et al. The X chromosome’s influences on the human brain. Sci Adv. (2025) 11:eadq5360. doi: 10.1126/sciadv.adq5360
47. Mauvais-Jarvis, F, Bairey Merz, N, Barnes, PJ, Brinton, RD, Carrero, J-J, DeMeo, DL, et al. Sex and gender: modifiers of health, disease, and medicine. Lancet. (2020) 396:565–82. doi: 10.1016/S0140-6736(20)31561-0
48. Frangou, S, Modabbernia, A, Williams, SCR, Papachristou, E, Doucet, GE, Agartz, I, et al. Cortical thickness across the lifespan: data from 17, 075 healthy individuals aged 3–90 years. Hum Brain Mapp. (2022) 43:431–51. doi: 10.1002/hbm.25364
49. Dima, D, Modabbernia, A, Papachristou, E, Doucet, GE, Agartz, I, Aghajani, M, et al. Subcortical volumes across the lifespan: data from 18, 605 healthy individuals aged 3–90 years. Hum Brain Mapp. (2022) 43:452–69. doi: 10.1002/hbm.25320
50. Duboc, V, Dufourcq, P, Blader, P, and Roussigné, M. Asymmetry of the brain: development and implications. Annu Rev Genet. (2015) 49:647–72. doi: 10.1146/annurev-genet-112414-055322
51. Wu, X, Kong, X, Vatansever, D, Liu, Z, Zhang, K, Sahakian, BJ, et al. Dynamic changes in brain lateralization correlate with human cognitive performance. PLoS Biol. (2022) 20:e3001560. doi: 10.1371/journal.pbio.3001560
52. Kong, X, Postema, MC, Guadalupe, T, de Kovel, C, Boedhoe, PSW, Hoogman, M, et al. Mapping brain asymmetry in health and disease through the ENIGMA consortium. Hum Brain Mapp. (2020) 43:167–81. doi: 10.1002/hbm.25033
Keywords: brain volume, deep learning, segmentation, CT, children
Citation: Xi F, Tu L, Zhou F, Zhou Y, Ma J and Peng Y (2025) Automatic segmentation and quantitative analysis of brain CT volume in 2-year-olds using deep learning model. Front. Neurol. 16:1573060. doi: 10.3389/fneur.2025.1573060
Edited by:
Ye Wu, Nanjing University of Science and Technology, ChinaReviewed by:
Jiquan Ma, Heilongjiang University, ChinaLifang Wei, Fujian Agriculture and Forestry University, China
Jiahao Huang, Zhejiang University of Technology, China
Copyright © 2025 Xi, Tu, Zhou, Zhou, Ma and Peng. This is an open-access article distributed under the terms of the Creative Commons Attribution License (CC BY). The use, distribution or reproduction in other forums is permitted, provided the original author(s) and the copyright owner(s) are credited and that the original publication in this journal is cited, in accordance with accepted academic practice. No use, distribution or reproduction is permitted which does not comply with these terms.
*Correspondence: Jun Ma, ZHJfbWFAc2luYS5jb20=; Yun Peng, cHBlbmd5dW5AaG90bWFpbC5jb20=