
94% of researchers rate our articles as excellent or good
Learn more about the work of our research integrity team to safeguard the quality of each article we publish.
Find out more
ORIGINAL RESEARCH article
Front. Neurol., 07 March 2025
Sec. Neurorehabilitation
Volume 16 - 2025 | https://doi.org/10.3389/fneur.2025.1515432
This article is part of the Research TopicCognitive Strategies in motor learning and RehabilitationView all 8 articles
 Ophélie Martinie1,2
 Philippe Karan3
 Martin Simoneau1,4
 Maxime Descoteaux3
 Catherine Mercier1,2
 Maxime T. Robert1,2*
Background: Precise upper limb movements required for daily activities rely on feedback and feedforward control mechanisms. In children with cerebral palsy (CP), damage to white matter tracts impairs motor execution and sensorimotor control. Most studies in CP have focused on motor execution deficits, whereas the relationship between feedforward control alterations and white matter microstructure features has received less attention.
Method: This study compared feedforward control during a grasp and lift task in 9 children with CP (diagnosis of hemiplegic CP with mild to moderate upper limb deficits) to 40 typically developing (TD) children aged 8 to 17 years. A secondary objective was to examine associations between feedforward control and the microstructural measures of corticocerebellar and other motor-planning related tracts. All participants completed 13 trials of the grasp and lift task. The CP group also underwent diffusion magnetic resonance imaging (MRI) using a 3-Tesla system to acquire anatomical and diffusion MRI.
Results: Results showed feedforward control deficits in the non-dominant hand of children with CP, reflected by reduced peak force rates before sensory feedback was available and a lack of adaptation across trials. Strong correlations were observed between feedforward control and microstructural measures of the corticospinal tract and superior longitudinal fasciculus, but not with the corticocerebellar tracts.
Conclusion: These findings suggest that broader sensorimotor processes, beyond feedforward control alone, contribute to force control deficits observed in children with CP.
Most daily activities require coordinated use of the upper limb and digits (1). Even trivial tasks such as grasping a glass involve prior knowledge of object’s properties and integration of sensory information from the environment (e.g., texture, gravity) for optimal manipulation (2). This coordination relies on the feedback and the feedforward control [for a recent review on this topic, (see 3)], which, respectively, allow online movement correction based on sensory information and supports the planning of force control, enabling the selection of movement parameters based on the task goal (4, 5). Feedforward control builds motor representation (6) by refining internal models that associate movement with sensory outcomes, adapting forces along trials in grasp and lift tasks (7, 8). Deficits in feedforward control may lead to sensorimotor deficits or exacerbate them in neurological disorders, for instance, children with cerebral palsy (CP) (2, 9).
CP is characterized by a group of sensorimotor symptoms affecting posture and movement due to alterations of the developing brain in the fetus or up to one to two years after birth (10). The lesions affect a vast distributed network, leading to impairments in motor control at both planning and execution levels (9, 11, 12). Children with CP show feedforward control deficits compared to their typically developing (TD) aged-matched peers, particularly in force control [for a review, see Martinie et al. (13)]. In grasp and lift tasks, children with CP show a sequential increase in load and grip forces [LF and GF; Eliasson et al. (14)] and fail to adapt to object weight and texture (15), resulting in a multi-peak force profile instead of a smooth, coordinated grasp force (16). They also exhibit inter-trial variability in their force profiles, while TD children stabilize their force after two trials (17). The feedforward force control deficits are only present in the more affected hand in hemiplegic CP suggesting asymmetrical abilities (18). Those asymmetrical deficits are specific to this sensorimotor task in which the less affected hand of children with unilateral CP behaves like the dominant hand of TD children (13, 19, 20).
Diffusion magnetic resonance imaging (dMRI) allows the quantification of water molecules’ movement along physical barriers (e.g., myelin sheath) to reconstruct white matter pathways (21, 22). DMRI studies in children with CP have emphasized the role of corticomotor tracts in their feedforward control deficits (23, 24). However, studies in healthy participants suggest that beyond corticomotor tracts (25), other brain regions are involved in feedforward force control, including the parietal cortex (26) and cerebellum (27–29). These findings point to a widely distributed network that connects motor areas, parietal regions, and the cerebellum, which are engaged in different aspects of force planning. Parieto-frontal pathways play a role in sensorimotor control, involving the internal representation of the body and grasping parameters (30–33). Additionally, these pathways monitor discrepancies between predicted and actual sensory feedback without correcting motor commands directly (34). Such corrections rely on feedforward control mechanisms facilitated by cerebellar afferent connections [e.g., fronto-ponto-cerebellar tracts; Ramnani (35) and Ugolini and Kuypers (36)] and efferent pathways [e.g., cerebello-thalamo-frontal tracts; Ramnani (35) and Ito (37)]. Although corticocerebellar tracts alterations have been linked to poorer manual dexterity in children with CP (38, 39), there is limited understanding of their involvement in feedforward control in CP.
The first objective of this study is to compare feedforward control between children with CP and TD children in a grasp and lift task. The second objective is to assess whether feedforward control is associated with cortico-cerebellar tracts and other motor-planning-related tracts in children with CP. We anticipate that children with CP will exhibit impaired feedforward control with their non-dominant hand (i.e., more affected hand) compared to TD children, but not with their dominant hand. We expect to observe differences in force variables and reduced adaptation (i.e., changes throughout the task). We predict that these differences will be increased for children aged 8 to 11 years, as TD children already have mature adult-like forces peak rate at eight years of age whereas 6 to 8 years old children with CP usually behave like two years old TD children (14) and mature until early adulthood (40, 41). Additionally, we expect to observe less adaptation between pairs of trials as an indication of this lack of adaptation. We also hypothesize that asymmetry in feedforward control between hands will correlate with the asymmetry in the microstructural features of cortico-cerebellar tracts (i.e., fronto-ponto-cerebellar, FPC; cerebello-thalamo cortical, CTF) and with other motor-planning-related tracts, such as the corticospinal tracts (CST) and motor-parietal tracts (e.g., the superior longitudinal fasciculus, SLF), which are involved in the control of grasping and lifting.
TD children and children with CP were recruited. Inclusion criteria included: (1) aged between 8 and 17 years old and (2) able to understand verbal instructions. In addition, children with CP were included if: (1) diagnosed with unilateral spastic CP; (2) had a Manual Ability Classification System [MACS, Eliasson et al. (40, 41)] of level I-III (i.e., mild to moderate deficits). Exclusion criteria were: (1) surgery in the upper limb in the past six months, (2) MRI non-compatibility for children with CP (criteria applied for participation in the MRI session only, i.e., the inability to perform the MRI scan did not exclude the participant from the grasp and lift task). The presence of tactile deficits was measured based on the last clinical assessment of the two-point discrimination task (42) available in their medical record. All children and their caregivers signed permission and consent. The study was approved by the CIUSSS-CN Committee (RIS_2024–2031).
Our experiment was divided into two sessions: (1) behavioral assessment and (2) MRI scan. Both TD and CP children participated in the behavioral session, which consisted of a grasp and lift task. The task consisted of grasping and lifting a 700 g object with sandpaper on the handling loadcell and two force loadcells (6 degrees of freedom, model Nano-17, ATI Instrumentation, Apex, NC, USA) measuring forces in x, y and z axis. The participants were asked to start the task with their non-dominant hand determined with a short child-friendly adapted version of the Edinburgh Handedness Inventory (43). Comfortably seated at arm’s distance from the object, children had to perform a maximum voluntary contraction by grasping the object three times without lifting it, for 5 s. The average of the three trials allowed us to compute the maximum grip force for each hand (Fmax), which was used in a ratio using Fmax non-dominant hand/Fmax dominant hand. Participants were then asked to grasp and lift the object at a comfortable speed. Following light-emitting diode (LED) activation, the participants grasped and lifted the object 13 times. After keeping the object 20 centimeters above the tabletop (i.e., in front of the LED line fixed into a wooden panel behind the object), they moved the object back to its initial position when the LED turned off (i.e., after 6 s).
Only children with CP performed the MRI session in which both structural and diffusion images were acquired. The participants underwent the scan without any sedation. Language-friendly explanation for children was provided about the procedure. To reduce stress, they also could watch a cartoon during the scan. The MRI data were acquired with a 3 T Siemens scanner (Magnetom Prisma, Siemens Healthineers) with a 32-channel head coil. The total time of data acquisition was between 15 to 21 min. The scan session took place at the MRI platform of the CERVO research center (Quebec City, Canada).
For the grasp and lift experiment, data were acquired and processed using a custom-made MATLAB script (R2021b version, MathWorks, Massachusetts, USA). The GF signal was calculated by summing each loadcell signal along the z-axis, while the LF was calculated by summing each loadcell signal along the y-axis.
For the MRI data, we adhered to the detailed procedure outlined in Martinie et al. (44). However, we have summarized the key steps here. Both structural T1 weighted image (turbo field echo multishot protocol in axial plane, voxel size = 1 mm isotropic, 180 slices, TR = 7.3 ms, TE = 3.3 ms, inversion time = 940 ms, flip angle = 9°) and diffusion images (echo-planar single shot, 60 slices, HARDI sequence detailed in https://zenodo.org/record/2602049, slice thickness = 2 mm, matrix 112 × 112, in-plane resolution = 2 × 2 mm, flip angle = 90°, FOV = 224 × 224 mm, 84 directions, b-values = 300 s/mm2, 1,000 s/mm2 and 2000 s/mm2, 6 b = 0 volumes, TR = 7,650 ms, TE = 89.5 ms) were acquired. The preprocessing and processing steps were performed on Beluga, a computational platform offered by Calcul Quebec (provincial partner of the Digital Research Alliance of Canada, Quebec, Canada, https://alliancecan.ca/en). Each step of preprocessing, signal reconstruction, and tract extraction was meticulously inspected by two authors. In cases of abnormalities or disagreements, a third author with expertise in neuroimaging was consulted for their opinion.
Tractoflow version 2.3.0 pipeline, showing between 98 to 100% reproducibility, [code available at https://github.com/scilus/tractoflow.git, Theaud et al. (45)] was used to correct the data and extract the diffusion metrics (i.e., diffusion tensor imaging, DTI; constrained spherical deconvolution, CSD). In addition, the pipeline contained also a probabilistic whole brain tractography using Particle Filter Tracking parameter based on fiber orientation density function in T1-based white matter map (FA threshold = 0.1, step size = 0.5 mm, maximum angle between 2 steps = 20°, number of seeds per voxel = 10, and stopping criteria = gray matter mask) (44). To evaluate white matter microstructure, dMRI metrics based on DTI and CSD were extracted from the tractoflow output using tractometry_flow (code available at https://github.com/scilus/tractometry_flow.git, Cousineau (46)). In addition, neurite orientation dispersion and density imaging (NODDI) metrics, based on a multi-compartment model (47), were computed using the resampled DWI, the resampled b0, and the bval and the corrected bvec files from preprocessing pipeline, with noddi_flow [code available at https://github.com/scilus/noddi_flow.git, Daducci et al. (48)].
The extraction of cortico-cerebellar tracts was performed using a strategy of tractography based on regions of interest (ROIs) which successfully identified those tracts in CP (44) from the atlas JHU ICBM DWI 1 mm [available at https://neurovault.org/media/images/264/JHU-ICBM-DWI-1mm.nii.gz, Mori et al. (49)], Talairach atlas [available at http://www.talairach.org/, Lancaster et al. (50) and Brainnetome atlas (available at http://www.brainnetome.org/resource/)]. The ROIs were registered to our participants’ space using ANTs (51), and the tractograms were extracted using the Scilpy toolbox (available at https://github.com/scilus/scilpy.git). For the FPC, the included ROIs were premotor cortices, internal capsule, and contralateral middle cerebellar peduncles [for the precise description of the regions of interest, see Palesi et al. (52, 53)]. For the CTF, the included ROIs were superior cerebellar peduncles, ventral and lateral nuclei of the contralateral thalamus and contralateral premotor cortex. For both tracts, the excluded ROIs were corpus callosum and adjacent cortices to avoid errors. Tracts over a length threshold of 120 mm were excluded to avoid spurious streamlines (51).
Other tracts involved in motor planning were extracted using a multi-atlas virtual dissection method called Recobundle X, which allows automatic extraction of white matter bundles based on their shape [available at https://github.com/scilus/rbx_flow.git, Garyfallidis et al. (54) and Rheault (55)], with greater validity and less heterogeneity than classic tract extraction method (56). The chosen tracts were the CST, and an associative frontoparietal tract called the SLF, both known to be involved in motor control (25, 57, 58).
To characterize brain lesions of the CP participants, the lesion volume was computed using the tissue volume ratio in each hemisphere with the following formula: (gray + white matter) left/(gray + white matter) right (59). An important difference in tissue volume between hemispheres was shown with a ratio close to 0. Tissues segmentations were performed using Freesurfer method [code freely available at http://surfer.nmr.mgh.harvard.edu/; Fischl (60)] with a freesurfer_flow (code available at https://github.com/scilus/freesurfer_flow) on registered T1 outputted from Tractoflow.
The analyses included two measures of feedforward control (i.e., GF peak rate and LF peak rate) and four measures of white matter tracts microstructure (i.e., fractional anisotropy, FA; apparent fiber density, AFD; orientation dispersion, OD) and macrostructure (i.e., volume) for the FPC, CTF, CST, and SLF.
To assess feedforward control, the forces peak rates were used as the peaks of both GF and LF rates occur before sensory feedback about the object’s weight is available Johansson and Westling (17) and Wolpert and Flanagan (61). These variables have been widely employed as measures of feedforward control, especially for children with CP [for review, see Martinie et al. (13) and Bleyenheuft and Gordon (62)]. GF and LF peak rates were computed by taking the maxima of differences between consecutive force values and dividing by the time interval, following the formula F/∆t, where ∆t represents the time interval between two force measurements (17, 63, 64). This procedure was performed using the diff function in MATLAB, representing the amplitude and maximum variation of GF and LF forces.
The dMRI metrics used were selected prior to analysis based on their prevalence in the neuroimaging literature on CP (65) and their similarity, despite originating from different models. The. selected DTI-based metric, FA, measures the degree of tissue anisotropy, with the highest values in uniformly oriented tissue, such as white matter. FA is widely used in clinical populations, particularly in CP (65), where it has demonstrated strong reliability (66). FA is sensitive to myelination and membrane permeability (67). However, its sensitivity is limited in the presence of crossing fibers, so complementary metrics are recommended (68). Consequently, from CSD, the total AFD was computed from the fiber orientation distribution function. AFD shares FA’s sensitivity but offers greater specificity, particularly in regions with crossing fibers (67, 69). Given the higher sensitivity of NODDI metrics compared to FA (70) and their increasing use in clinical research (71), the OD was included in this study. The OD reflects the dispersion of fibers within a voxel and is associated with neural reorganization, axonal dispersion, and neuroinflammation (72). Lastly, tract volume was considered as a macrostructural metric (73). These diffusion and volume measures were assigned to the entire tracts by averaging the metrics of all voxels within the white matter pathways, a process automatically performed by the tractometry_flow script used.
The main independent variables in the analysis were three factors with two levels: group (CP vs. TD), hand (non-dominant vs. dominant), and age (younger vs. older). The younger age refers to participants ≤11 years of age, and the older group comprises participants >11 years.
Statistical analyses were conducted using RStudio 2023.12.1.402 version (Posit team, 2024). The analyses were divided into feedforward force control in both TD and CP children and the association between feedforward control and white matter microstructural measures in children with CP only. As the assumptions of normality and homoscedasticity were not met, non-parametric tests were employed.
Objective 1: Comparison of feedforward control between children with CP and TD children.
The analyses were performed separately for the GF and LF peak rates. Each force variable was tested following four steps: (1) difference of group × age for each hand; (2) tendency of adaptation along trials; (3) amount of change between pairs of consecutive trials; (4) main effect of trials. Due to the limitations of non-parametric tests in assessing interactions among three factors, two-factor analyses were conducted separately for each hand to compare the CP and TD groups while accounting for the potential effect of age. Only the fourth section of the analyses included the factor trial (1 to 13).
(1) Difference between group × age by hand.
To determine whether a global effect of group and age was present for GF and LF peak rates for each hand, the Scheirer-Ray-Hare test, a non-parametric equivalent of the two-way ANOVA, was used. Bonferroni correction was applied to adjust for multiple comparisons. For significant interactions, pairwise post-hoc comparisons were conducted using the Wilcoxon signed-rank test, with Bonferroni correction applied to control for multiple testing.
(2) Tendency of adaptation along trials.
A linear regression slope was computed for each participant to assess whether variables adapt (i.e., change) across trials according to group and age. The slope represents the linear trend and rate of change across trials, indicating the general tendency for adaptation. The slopes were compared between the groups (CP vs. TD) and ages (youngest vs. oldest) using the Scheirer-Ray-Hare test and Bonferonni correction, separately for each hand. If significant interactions were found, Wilcoxon signed-rank post-hoc tests were performed to further investigate specific pairwise differences. Additionally, each slope was tested against zero to determine if a significant change over trials was present.
(3) Amount of change between consecutive pair of trials.
To determine if local trial-to-trial force variations occurred and whether these variations were equally distributed or if the force stabilized (i.e., absence of variation), the relative change between pairs of consecutive trials was computed using the formula: (|trial_2 – trial_1|)/(trial_1) for each pair until the last trial. The relative change of force peak rates was analyzed separately for each hand, incorporating the factors group (CP vs. TD) and age (youngest vs. oldest) using the Scheirer-Ray-Hare test. Significant interactions were further examined using Wilcoxon signed-rank post-hoc tests if necessary. Additionally, the slope of GF peak rate across trials was tested against zero to verify if a significant change over trials existed.
(4) Main effect of trials.
To identify specific differences between trials and assess the main effect of trials, a repeated measures Friedman test was performed for each condition due to the test’s limitation in including all factors simultaneously. Multiple testing corrections were applied. If a main effect of trials was observed, post-hoc pairwise comparisons were conducted using Conover’s test with Holm correction to account for multiple comparisons.
Objective 2: Association between feedforward control and white matter tracts.
The association between white matter microstructure features and force control was assessed using Spearman correlations between the FPC, CTF, CST, and SLF. Given the exploratory nature of the analysis and the small sample size, the p-value was not corrected, and the results should be interpreted as hypothesis-generating, requiring validation in larger. To account for hand and lesioned side while minimizing multiple testing, asymmetry indices were calculated for hand GF and LF peak rates and hemisphere microstructural measures using the formulas (dominant side – non-dominant side)/(dominant side + non-dominant side) and (contralesional side – ipsilesional side)/(contralesional side + ipsilesional side). The asymmetry indices of each variable were tested against zero using a Wilcoxon signed-rank test.
Forty TD children (22 girls and 18 boys, M = 12.12, SD = 2.63, from 8.1 to 16.9 years old) and nine children with CP (6 girls and 3 boys, M = 11.06, SD = 2.01, from 8.38 to 14 years old) were recruited. One participant with CP could not perform the MRI because of the presence of a ventricular shunt. Among the children with CP, 7 had a pre-or peri-natal stroke. Clinical data of children with CP are described in Table 1. TD children had a higher non-dominant/dominant Fmax ratio (M = 1.02, SD = 0.2) than children with CP (M = 0.54, SD = 0.21).
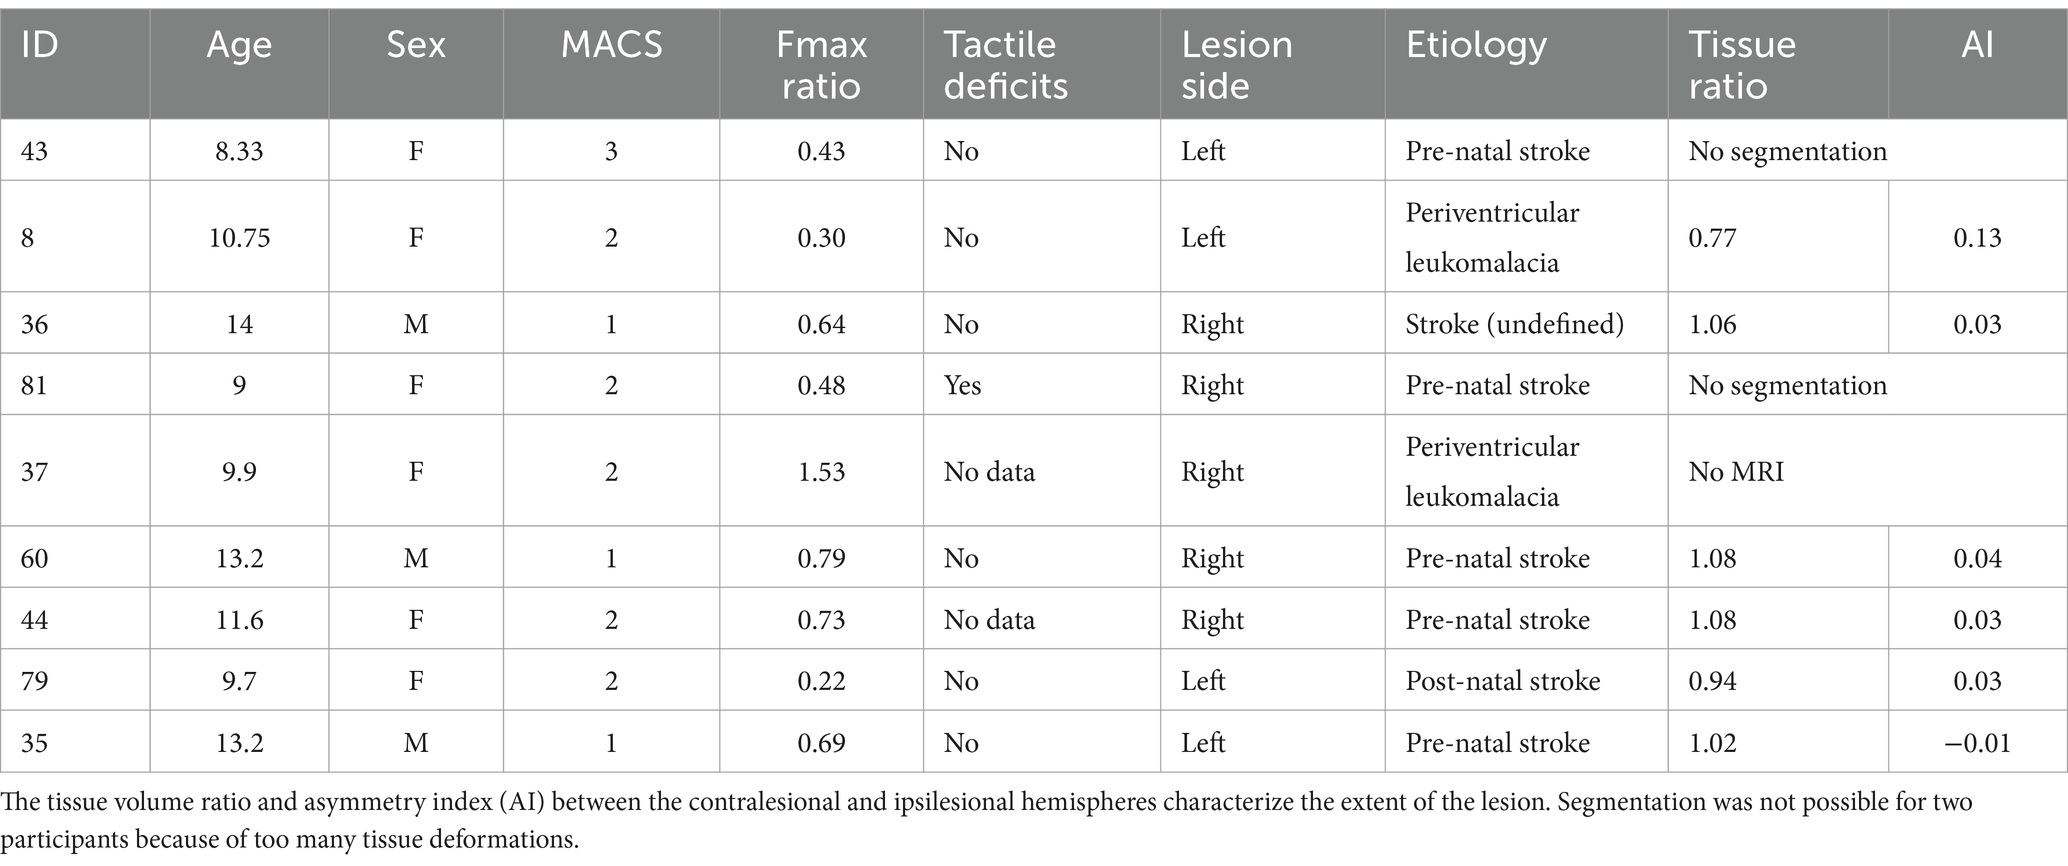
Table 1. Clinical data for children with CP, including age, sex (F, female; M, male), Fmax hand ratio and tactile deficits for the non-dominant hand.
The difference for the GF peak rate was tested for each hand. No significant effects of group or age were observed for the dominant hand. For the non-dominant hand, there were significant effects of both groups (H = 75.83, adjusted p-value <0.001) and age (H = 5.10, adjusted p-value = 0.04), as well as an interaction between these factors (H = 9.67, adjusted p-value = 0.004). Pairwise post-hoc comparisons, therefore, examined the effect of groups within each age separately. The GF peak rate was found to significantly differ between groups both in the younger (W = 2,407, adjusted p-value <0.001) and older groups (W = 5,557, adjusted p-value = 0.0006). The Figure 1 illustrates the differences in GF peak rate. A posteriori analyses were conducted to investigate whether the differences in the GF peak rate occurred because of differences in the maximum raw GF during the task or the time to reach the maximum raw GF. Maximum raw GF was not significantly different between CP and TD children (p-value = 0.8), but the time to peak was different (p-value <0.001), with a longer time to peak for CP (M = 2 ms, SD =1.6) compared to TD children (M = 1.1 ms, SD = 1.4).
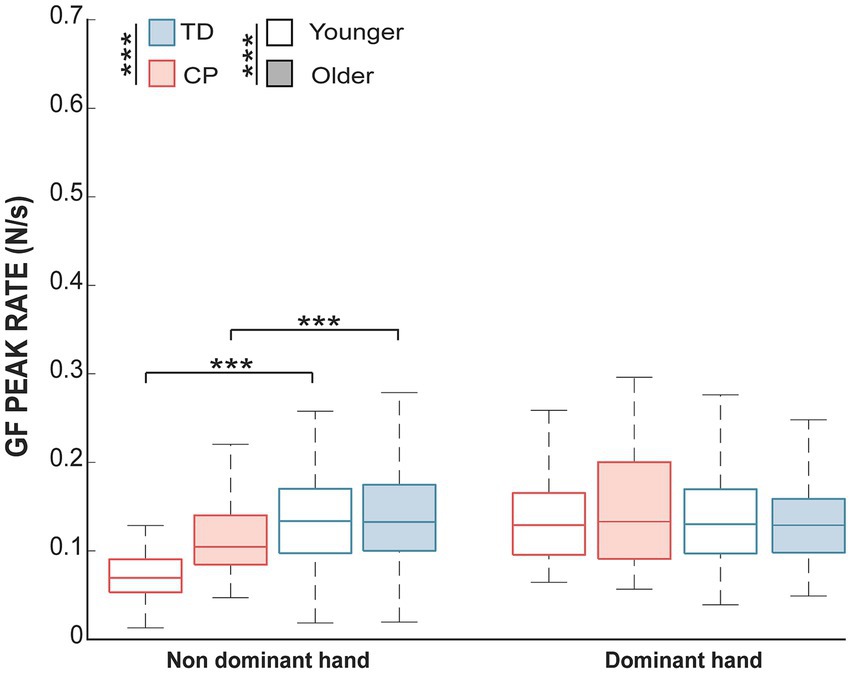
Figure 1. The median and interquartile range of the GF peak rate in each group and each age range. Significant differences for the non-dominant hand for both age groups of the children with CP compared to TD children (adjusted p-value <0.001; ***). No effect was found for the dominant hand. A white shade represents children aged between 8 and 11, whereas blue or red shade represents older children.
The adaptation along trials testing the slope of the GF peak rate for each hand revealed no significant differences between groups or age. Additionally, when the slopes were tested against zero, none of the conditions exhibited a slope significantly different from zero. This observation indicates a general tendency for constancy throughout the task, irrespective of the group, hand, or age.
The amount of change between pairs of trials of the dominant hand did not show any significant effects. Significant differences in the GF peak rate relative change were observed for the non-dominant hand, with a main effect of group (H = 6.06, adjusted p-value = 0.02) and an interaction between group and age (H = 9, adjusted p-value = 0.003). Post-hoc pairwise comparisons of the effect of the group for each age indicated a significant effect of the group only for the younger participants (W = 8,172, adjusted p-value <0.001). These results suggest that the relative change is influenced by group and age for the non-dominant hand. Additionally, the slopes of the relative change did not differ from zero for any condition, suggesting no overall trend or significant change in force across trials for any of the conditions.
The trial factor did not show any significant effects.
The difference for the LF peak rate was tested for each hand. It revealed a main effect of age (H = 11.09, adjusted p-value = 0.004) for the dominant hand, irrespective of the group, as well as a main effect of group for the non-dominant hand (H = 41.69, adjusted p-value <0.001). This result indicates that the non-dominant hand’s LF peak rate varied between groups. Figure 2 illustrates the group effect for the non-dominant hand and the age effect for the dominant hand. A posteriori analyses were conducted to test whether the differences in the LF peak rate resulted from differences in maximum LF during the task or in time to reach the maximum LF. Both maximum LF and time to LF peak were significantly different between CP and TD children (p-value <0.001), with higher LF for children with CP (M = 10 N, SD = 4.7) compared to TD children (M = 8.8 N, SD = 1.1) and increased time to reach LF maximum value for children with CP (M = 1.9 ms, SD = 1.8) compared to TD children (M = 0.9 ms, SD = 1.5).

Figure 2. The median and interquartile range of the LF peak rate in each group and each age range. Significant effects of group for the non-dominant hand and age for the dominant hand were found (adjusted p-value <0.001, ***; p < 0.01, **). A white shade represents children aged between 8 and 11, whereas blue or red shade represents older children.
The adaptation along trials of the LF peak rate did not differ between groups or ages for either the dominant or non-dominant hand. A significant difference from zero was only found for the non-dominant hand in the younger TD group (adjusted p-value <0.001). This observation suggests a general tendency for constancy throughout the task, except for the younger TD children using their non-dominant hand, which modulates their LF peak rate.
The amount of change between pairs of trials using the relative change in the LF peak rate differed between groups for both the dominant hand (H = 7.08, adjusted p-value <0.01) and the non-dominant hand (H = 13.74, adjusted p-value <0.001). This observation suggests that the amount of change between pairs of trials varied according to the group, irrespective of the hand. A slope significantly different from zero was observed only for the non-dominant hand in older TD children (adjusted p-value = 0.002). This result indicates that the relative change in the LF peak rate differed explicitly for this group and condition.
The effect of trial for every condition showed significant differences between trials only for the non-dominant hand in the TD group for both the younger (χ2 = 46.31, adjusted p-value <0.001) and the older group (χ2 = 36.03, adjusted p-value = 0.001). Post-hoc pairwise comparisons between each pair of trials are depicted in Figure 3, indicating that both younger and older TD children using their non-dominant hand showed adaptation to the task after a few trials. The younger TD children could adapt from the 6th trial since no effect of trials is observed after the 6th trial, whereas the older TD children adapt from the 2nd trial since no effect of trials is observed after the 2nd trial.
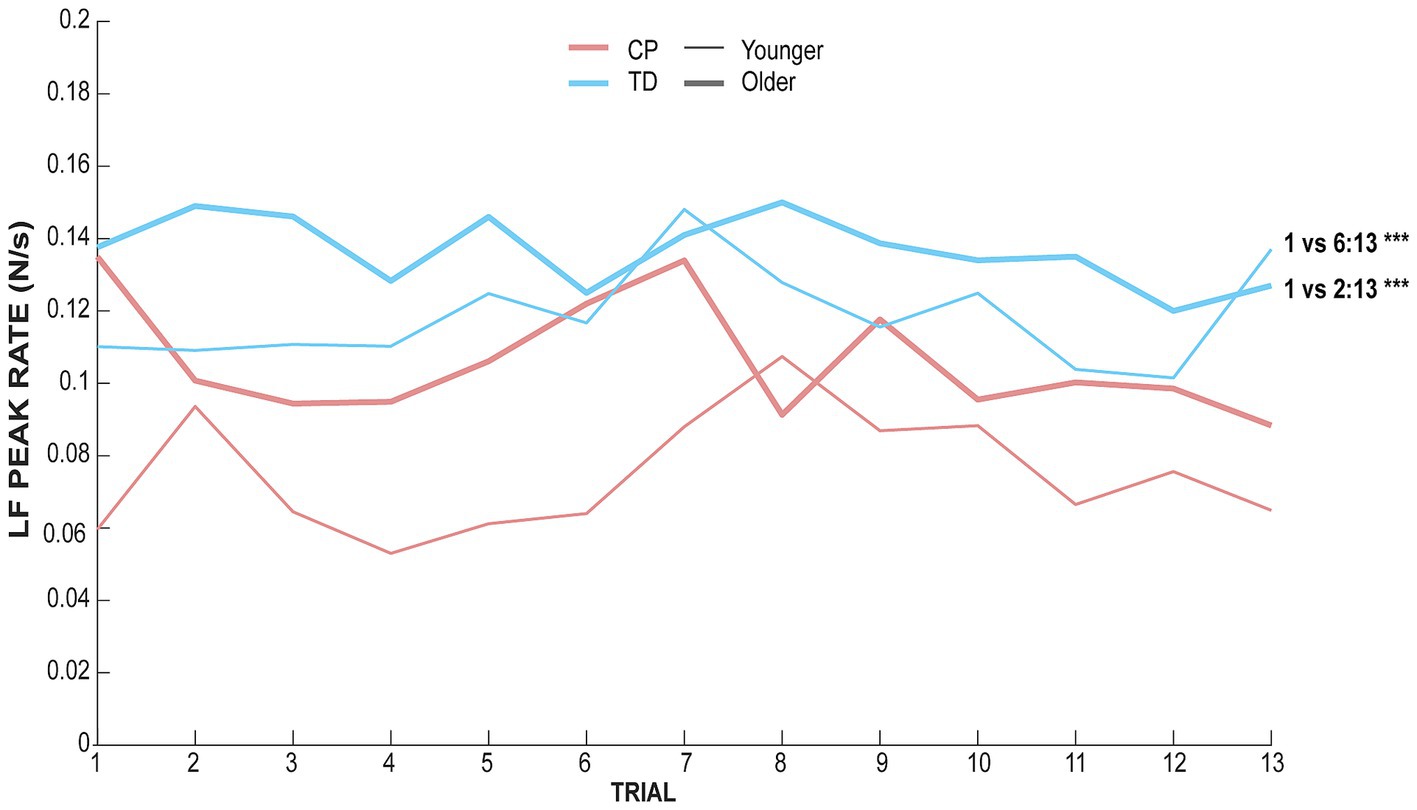
Figure 3. LF peak rate of each group and each age range along trials for the non-dominant hand. The red ink line represents data for children with CP whereas blue ink line represents TD children data. The thick line represents data for children aged between 11 and 17 whereas the thin line represents data for children aged between 8 and 11.
It was possible to reconstruct all tracts on both sides in all participants, except for the FPC and CFT tracts on the lesioned hemisphere for one participant (S43) and of SLF in the lesioned hemisphere for two participants (S8 and S81). The tracts and the metrics are illustrated in Figure 4. Asymmetry of the FPC and CTF metrics and GF and LF peak rates asymmetry indices are displayed in Figure 5.
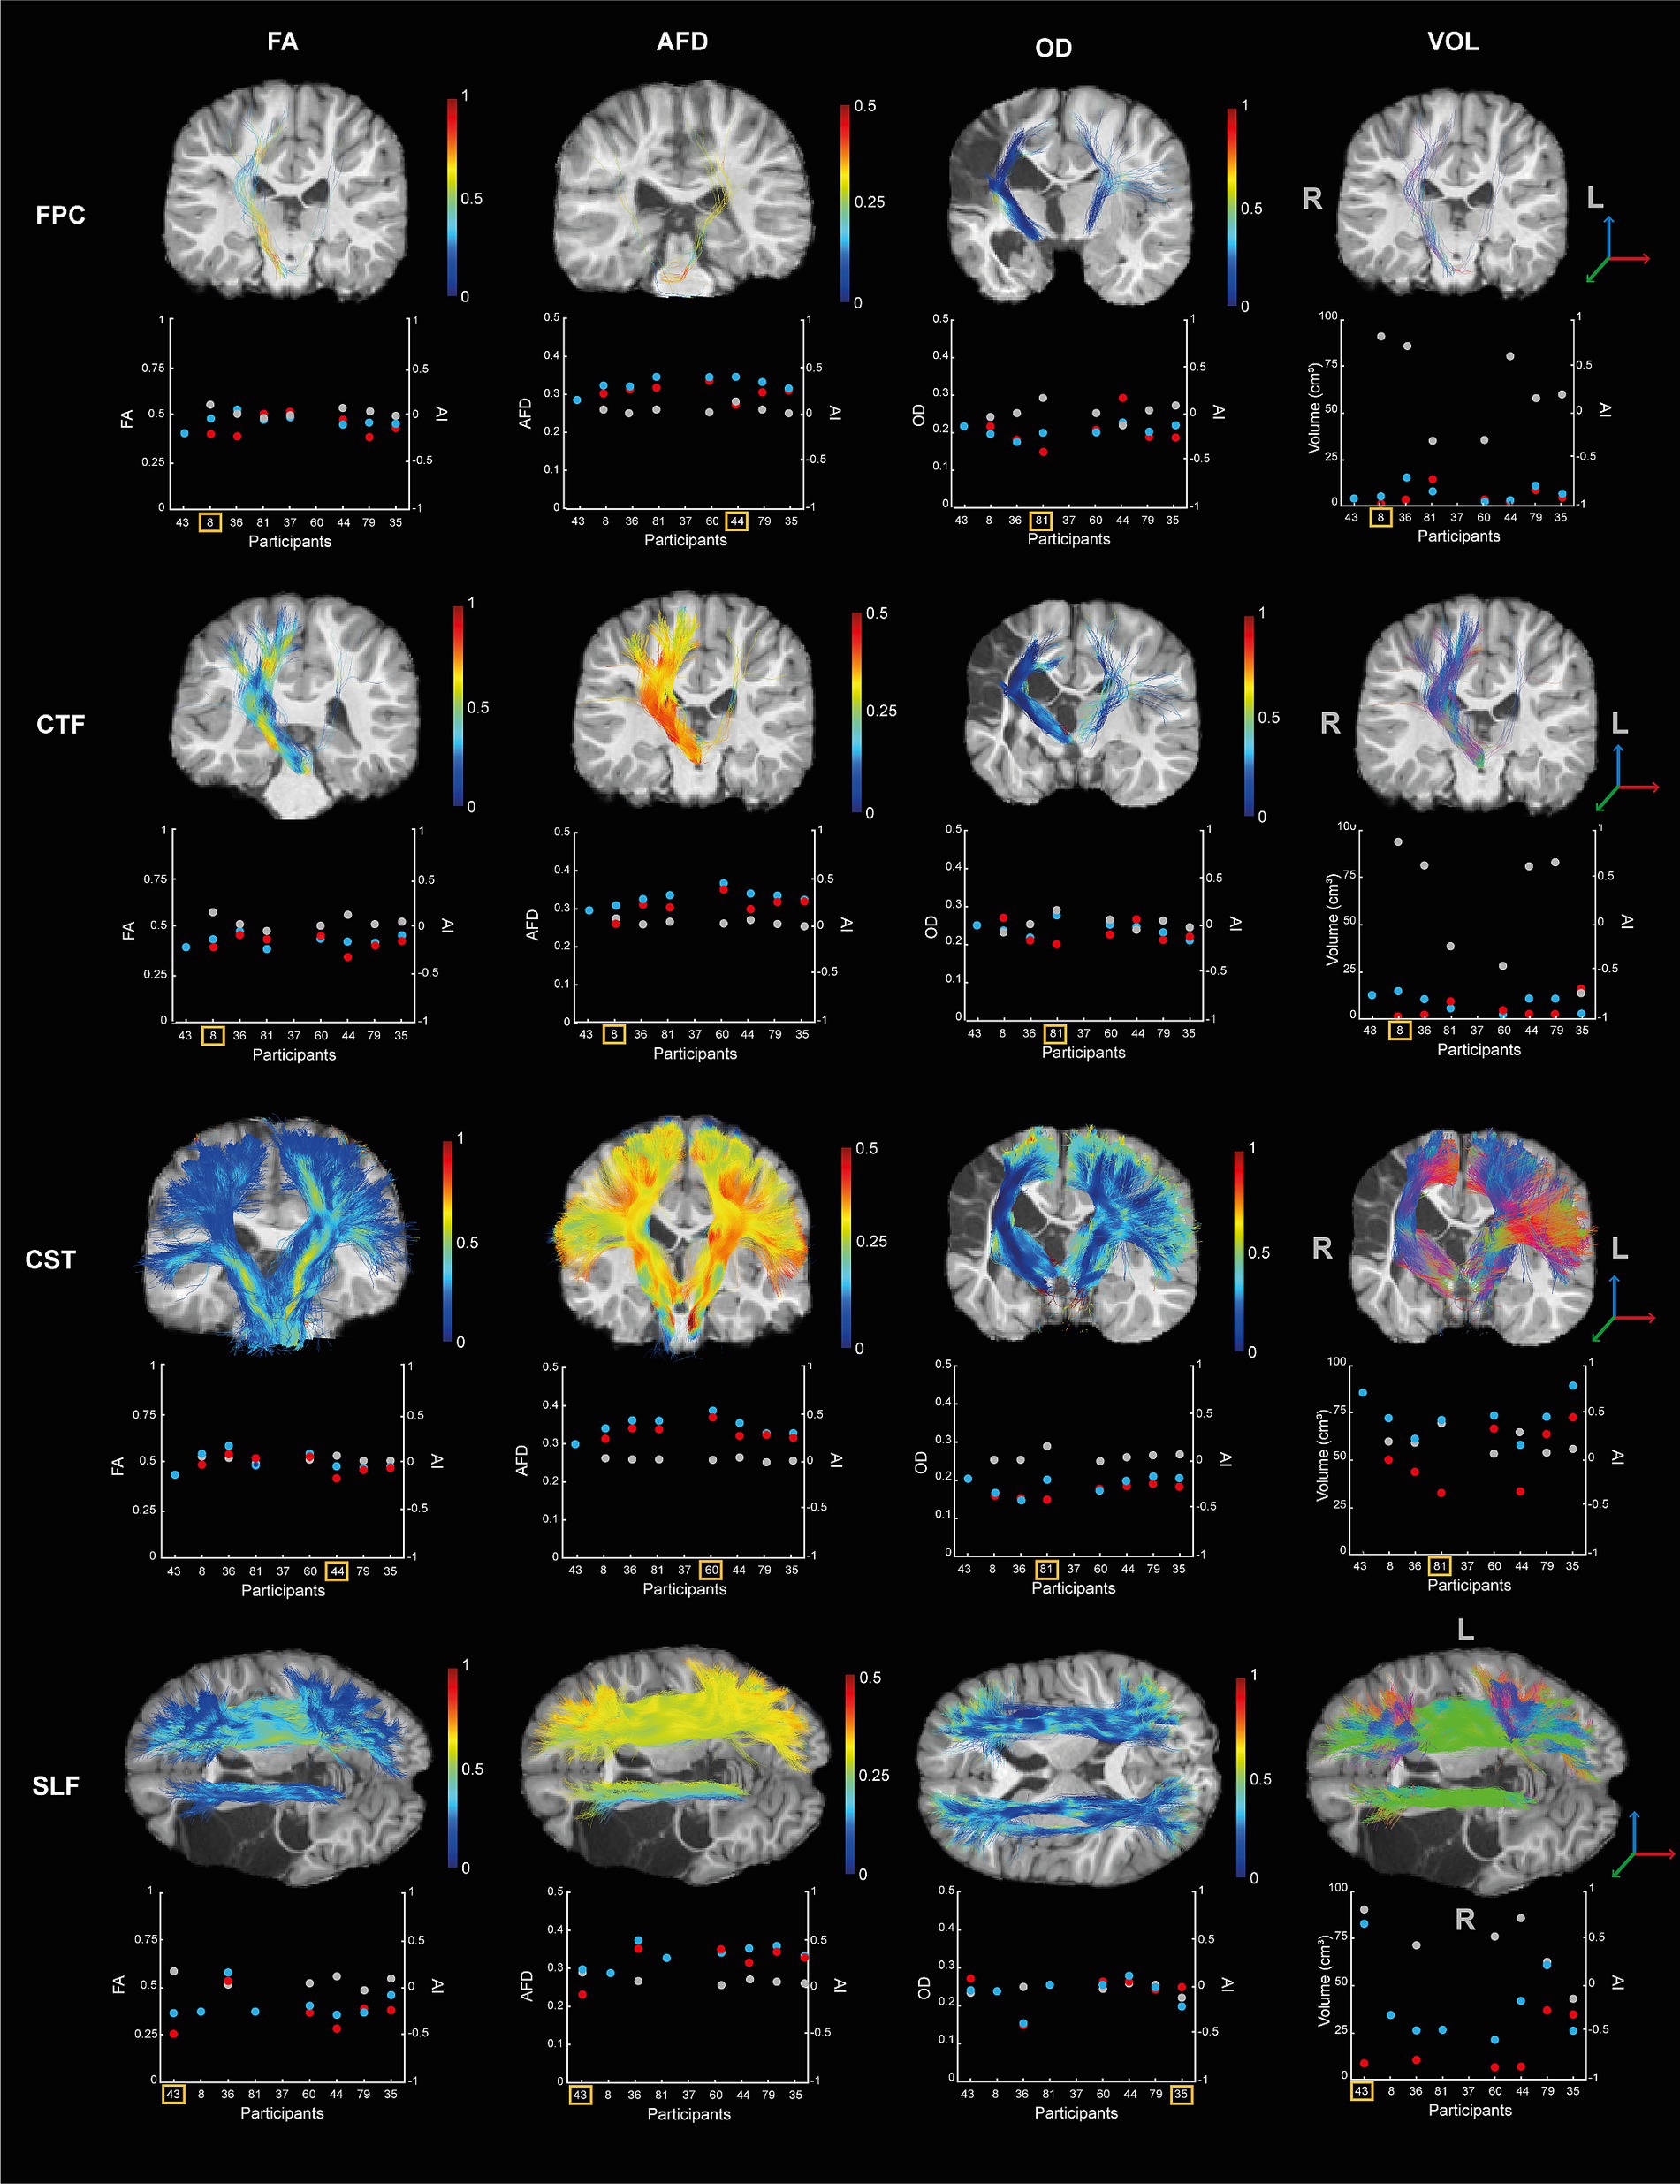
Figure 4. Diffusion metrics (i.e., FA, AFD, OD, and volume) for the four tracts (i.e., FPC, CTF, CST, SLF) by participants. Each scatterplot represents the data for the lesioned hemisphere (i.e., red dot) and the controlesional hemisphere (i.e., blue dot). The asymmetry indices are indicated in gray (i., right axis). The tracts of the participant showing higher asymmetry between hemisphere is displayed on their T1 image and indicated by the yellow square on the scatterplot. The colors of the tracts represent the metric variation along the tract.
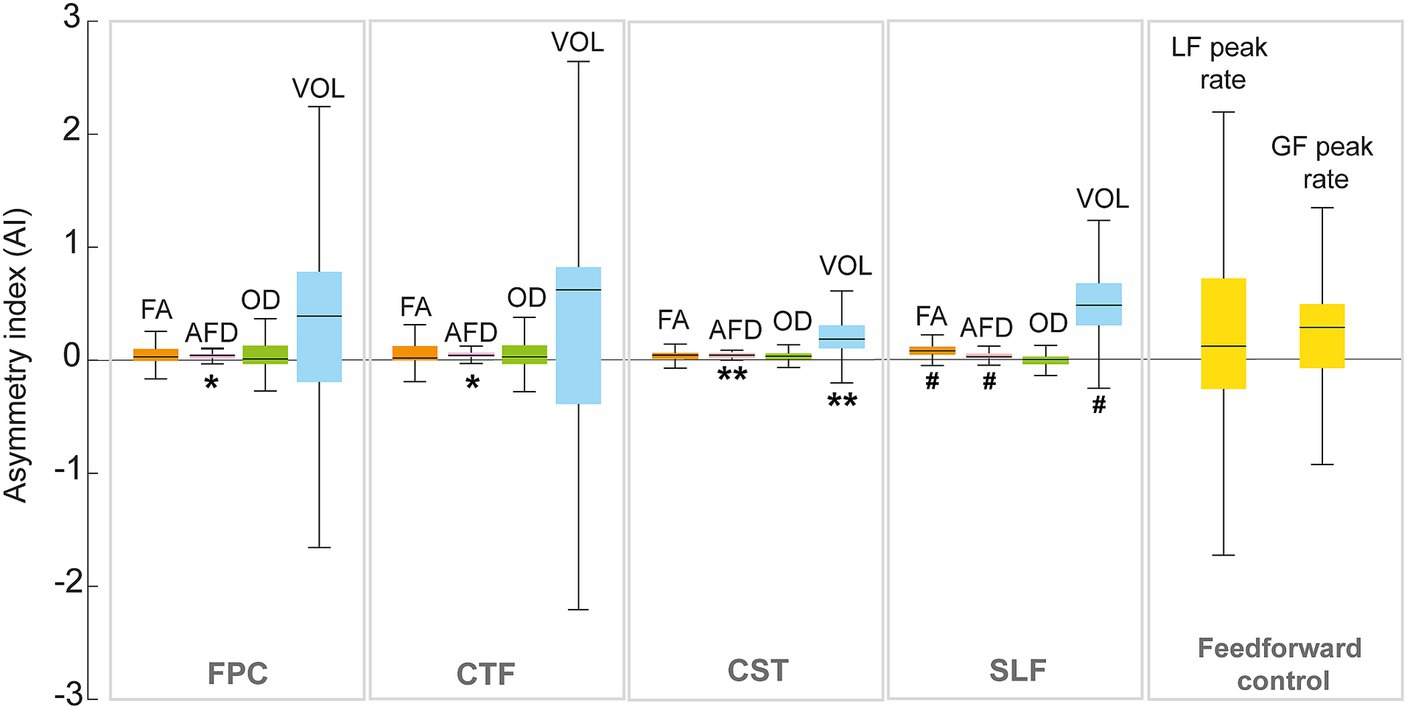
Figure 5. Median and interquartile range of the asymmetry index (AI) of the fronto-ponto-cerebellar (FPC), cerebello-thalamo-frontal (CTF), corticospinal (CST) tracts and superior longitudinal fasciculus (SLF) for the dMRI metrics (FA; fractional anisotropy, AFD; apparent fiber density, OD; orientation dispersion index). The y-axis represents the asymmetry index (AI). Significant differences from zero are indicated with ** (p < 0.01) and trend (i.e., p-value between 0.05 and 0.1) are shown with #.
No correlations were found between feedforward control and FPC or CTF tracts. Significant strong negative correlations were found between GF peak rate asymmetry and SLF volume asymmetry (r = −0.94, p = 0.02). For the asymmetry of the LF peak rate, a positive strong correlation was observed with asymmetry of FA of the SLF (r = 0.94, p = 0.02) and the CST volume asymmetry (r = 0.88, p = 0.007). Figure 6 shows the correlation matrix with p-value.
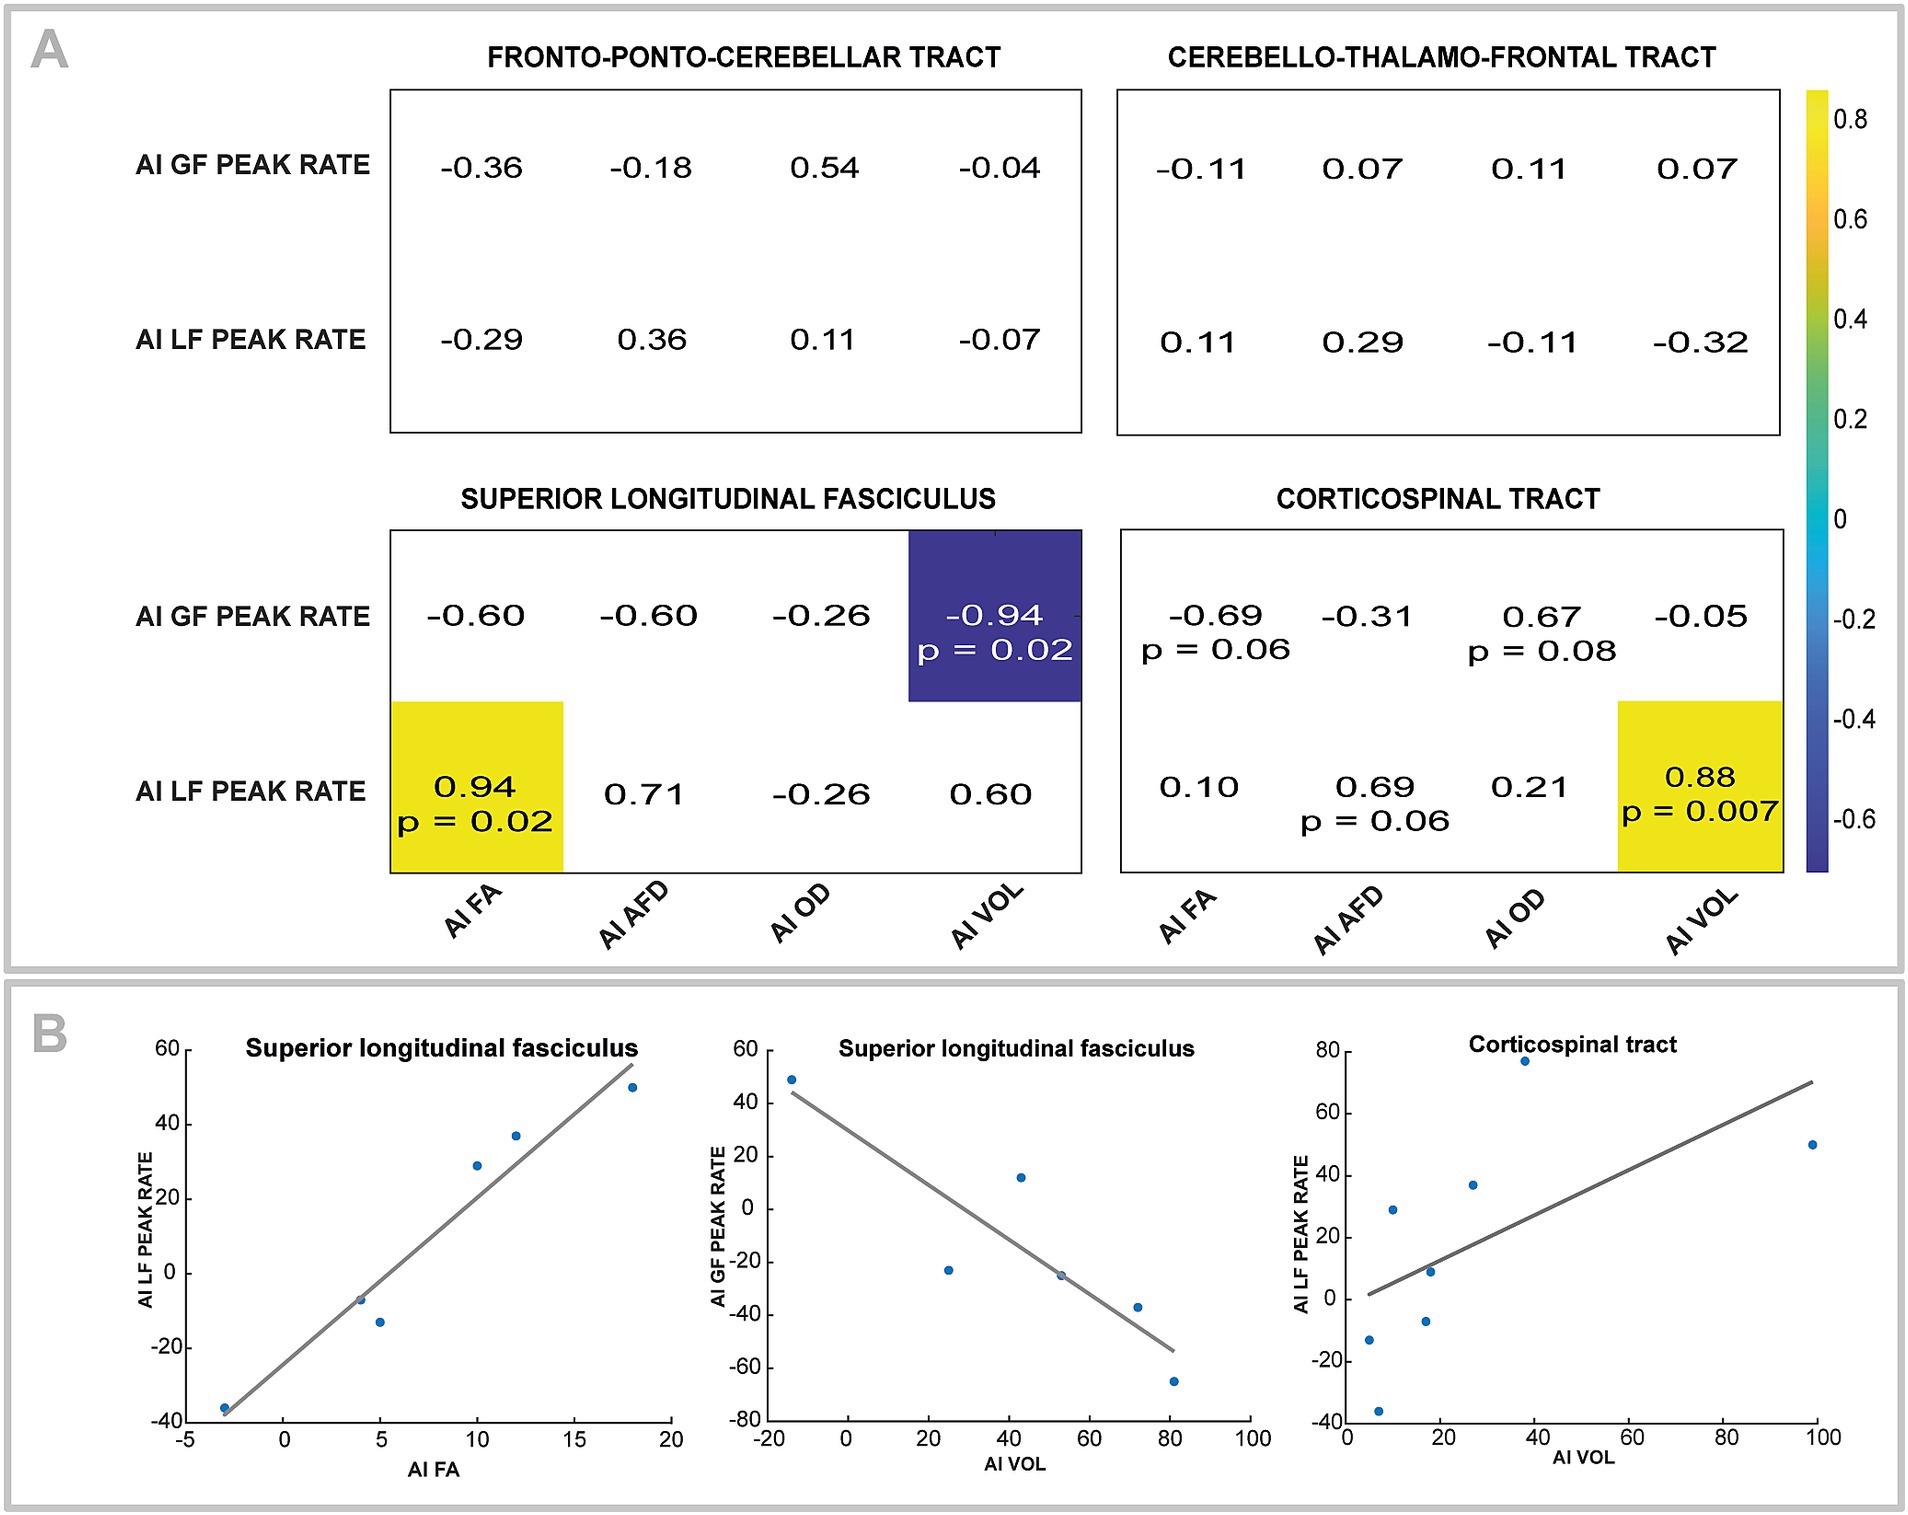
Figure 6. (A) Correlation matrix for asymmetry index (AI) of GF peak rate and LF peak rate with fractional anisotropy (FA), apparent fiber density (AFD), orientation dispersion index (ODI), and volume (VOL) for fronto-ponto-cerebellar and cerebello-thalamo-frontal tracts. All correlation coefficients are indicated, but only significant ones are colored. Trends (i.e., p-value between 0.05 and 0.1) are also noted. (B) Scatterplots and regressions line corresponding to the significant correlation in the A section.
The present findings demonstrated that children with CP exhibited the expected lateralized differences of force control compared to TD children, as indicated by lower GF and LF peak rates, this deficit being more pronounced in the younger group for the GF peak rate. The adaptation results were mixed. While no significant adaptation in GF peak rate was observed in either group, the LF peak rate adaptation was present only in TD children, specifically when using their non-dominant hand. Younger TD children adapted after the 6th trial, while older children adapted earlier, starting from the 2nd trial. Although feedforward control variables were associated with CST and SLF microstructural measures, no correlations were found with the corticocerebellar tracts, contrary to our expectations. This lack of association could suggest that corticocerebellar pathways may play a less critical role in feedforward control in children with CP.
The differences in the forces (i.e., GF and LF) peak rates for the non-dominant hand in children with CP can be attributed to either applying lower force or taking longer to apply the force. This effect is more pronounced in younger children with CP, likely due to motor developmental delays (74), while older children with CP show less pronounced feedforward control deficits that improve with maturation over late childhood (40, 41). Children with CP often take longer to apply forces, as reflected by an extended longer time to reach maximum raw force, likely compensating for sensory deficits by stimulating more mechanoreceptors (75–77). These differences may reflect feedforward control deficits as peak force occurs before sensory feedback is available (78, 79). However, it has been suggested that reduced forces peak rate in children with CP are indicators of their reliance on sensory input to adjust their grip and then initiate lifting (79, 80), controlling their movement through feedback control (81–83). Peripherical factors may also contribute since reduced forces peak rates are only present in the hemiplegic hand. The GF is associated with sensory and motor impairments in stroke patients (84), and the GF peak rate is linked to pinch strength and tactile discrimination in CP (15). The LF is influenced by muscle and joint function (25), and children with CP generally show reduced muscle activation in the hemiplegic arm (85). These findings likely indicate broader sensorimotor impairments and a combination of different factors rather than relying purely on feedforward control deficits (86).
This observation is further supported by the lack of correlations with corticocerebellar tracts (i.e., FPC and CTF), suggesting that the deficits in children with CP are more related to motor command and sensory integration in their deficits (i.e., CST and SLF). The correlations found for the SLF, involved in selecting grasp parameters based on object properties (58), underscores the role of sensorimotor tracts in refining the internal model, highlighting the importance of sensory feedback in updating the internal model (19). Adaptation across trials was only observed for the non-dominant hand of TD children confirming that they adjust their LF by the second lift (87). The absence of adaptation in children with CP may explain the lack of associations with corticocerebellar tracts. Adaptation involves forming internal representations based on sensory feedback from each lift, which guides future actions under similar conditions (16, 17, 79). In TD children, adaptation may be less pronounced in the dominant hand because internal models of object properties can transfer between hands (88). In the current study, TD children always first grasped and lifted the object using their non-dominant hand. Thus, forming the internal model is allowed by the first hand used in the task, but it requires proper integration of sensory information. Even children with CP can apply appropriate force with their non-dominant hand after initially grasping with their dominant hand, demonstrating that internal models can be shared between hands and is possible in CP when the dominant hand is used first, which allows sufficient sensory input for updates (89). Thus, the lack of adaptation in children with CP may be due to altered sensory integration related to object characteristics when starting with their non-dominant hand. This could lead to insufficient sensory input and/or altered processing, hindering the proper formation of internal models. These findings underscore the need for further investigation into sensory function in grasp and lift tasks.
The lack of adaptation in the GF peak rate for both groups was unexpected. GF is typically more closely related to object texture (90), while LF is influenced by object weight (91). The adaptation mechanisms and the potential for transferring internal models between hands, particularly in relation to texture, have not yet been studied (19). The GF peak rate showed less retention over days compared to the LF peak rate and is less critical for task success (88). Additionally, GF peak rate adaptation has only been observed in participants with normal wrist angulation; those with hyperflexion did not show adaptation (92). In our task, participants could either use a precision grip with the wrist aligned at finger level or a downward pinch with a flexed wrist. These different grip strategies have been shown to influence the feedforward control of GF (93). Standardizing wrist position might have allowed us to observe adaptation or at least account for its effects.
A surprising result concerns the strong negative correlation between SLF volume and the GF peak rate, indicating that lower volume asymmetry (i.e., more similar volume between hemispheres) is associated to greater asymmetry of the GF peak rate between hands. We expected the opposite correlation, as volume loss on the ipsilesional side is typically associated with more deficits (94). However, higher white matter tract volume does not always indicate better motor function. For instance, reduced white matter volume in children with autism is correlated with poorer motor function compared to TD children (95). This observation is especially pronounced in later myelinated white matter regions (96), and it has been shown that SLF volume matures later than most white matter tracts (97). In children with autism, the non-functional increase in white matter arises from global brain abnormalities that impair functionality, driven by microscopic abnormalities in cortical column organization that favor shorter connecting fibers over longer ones (95, 98). Similarly, children with CP have reduced long-range connections (94), suggesting that the increased volume may result from a reduced long-distance connection, such as those from the parietal and premotor cortices, but instead have higher local connections.
This study has a few limitations, the most notable being the small sample size of the CP group. Future research with larger sample sizes is needed to validate these findings, minimize errors, and increase statistical power (99). These preliminary results should therefore be interpreted with caution and serve as a foundation for future studies. Additionally, the limited clinical characterization in our study constrains the scope of our conclusions. Hence, the results may not be applicable to children with other types of CP or with more severe impairments. Given the potential relationship between sensorimotor deficits and feedforward control, a more detailed assessment of sensory deficits in children with CP is necessary (19). Testing these hypotheses in children with CP across a broader range of clinical and neurological profiles would strengthen the reliability of our conclusions. Regarding the MRI data, averaging the metrics along tracts may miss some variation. Future studies should consider segmenting tracts at multiple points (100). Finally, a last limitation of this study is the absence of imaging data for the TD group, which prevents us from determining whether the observed correlations are unique to the CP group or reflect broader developmental patterns. Future studies should include imaging data from typically developing children to better contextualize these findings.
In conclusion, this study reveals significant force control deficits in the non-dominant hand of children with CP, which may be attributed to impairments in feedforward control. The associations observed with the CST and the SLF, both essential for grip and lift force modulation, and the absence of correlations with corticocerebellar tracts suggest that broader sensorimotor processes, beyond pure feedforward control, may contribute to these deficits. Nonetheless, there is a need for future studies with larger and more diverse cohorts to understand better feedforward mechanisms both at the behavioral and neurological levels in children with CP.
The raw data supporting the conclusions of this article will be made available by the authors, without undue reservation.
The studies involving humans were approved by CIUSSS-CN Committee (RIS_2024–2031). The studies were conducted in accordance with the local legislation and institutional requirements. Written informed consent for participation in this study was provided by the participants’ legal guardians/next of kin.
OM: Conceptualization, Data curation, Formal analysis, Investigation, Methodology, Visualization, Writing – original draft. PK: Data curation, Formal analysis, Methodology, Software, Writing – review & editing. MS: Conceptualization, Funding acquisition, Methodology, Project administration, Writing – review & editing. MD: Data curation, Formal analysis, Investigation, Methodology, Resources, Software, Writing – review & editing. CM: Funding acquisition, Project administration, Supervision, Writing – review & editing. MR: Funding acquisition, Project administration, Supervision, Writing – review & editing.
The author(s) declare that financial support was received for the research, authorship, and/or publication of this article. OM received doctoral scholarships from the University Laval Research Chair in Cerebral Palsy, the Réseau provincial de recherche en adaptation-réadaptation (REPAR) and the Fonds de recherche Québec Santé (FRQS; 314348). PK received a doctoral scholarship from the NSERC (ES D3-559650–2021). MD was funded by the NSERC Discovery Grant (RGPIN-2020-04818) and the USherbrooke Institutional Research Chair in Neuroinformatics. MS was supported by the Natural Sciences and Engineering Research Council of Canada Discovery grant (RGPIN-2020-06210). CM was the Holder of the University Laval Research Chair in Cerebral Palsy and of the Canada Research Chair in Pain and Sensorimotor Rehabilitation. MR was supported by a grant from the Réseau de Bio-Imagerie du Québec (RBIQ), the University Laval Research Chair in Cerebral Palsy and is a research scholar from the FRQS (331149).
The authors would like to acknowledge Arnaud Boré for his help in launching the script of the dMRI analyses.
The authors declare that the research was conducted in the absence of any commercial or financial relationships that could be construed as a potential conflict of interest.
The authors declare that no Generative AI was used in the creation of this manuscript.
All claims expressed in this article are solely those of the authors and do not necessarily represent those of their affiliated organizations, or those of the publisher, the editors and the reviewers. Any product that may be evaluated in this article, or claim that may be made by its manufacturer, is not guaranteed or endorsed by the publisher.
1. Johansson, RS, and Flanagan, JR. Coding and use of tactile signals from the fingertips in object manipulation tasks. Nat Rev Neurosci. (2009) 10:345–59. doi: 10.1038/nrn2621
2. Steenbergen, B, Verrel, J, and Gordon, AM. Motor planning in congenital hemiplegia. Disabil. Rehabil. (2007) 29:13–23. doi: 10.1080/09638280600947591
3. Levin, MF, and Piscitelli, D. Motor control: a conceptual framework for rehabilitation. Mot Control. (2022) 26:497–517. doi: 10.1123/mc.2022-0026
4. Wolpert, DM. Computational approaches to motor control. Trends Cogn Sci. (1997) 1:209–16. doi: 10.1016/S1364-6613(97)01070-X
5. Wong, AL, Haith, AM, and Krakauer, JW. Motor planning. Neuroscientist. (2015) 21:385–98. doi: 10.1177/1073858414541484
6. Serrien, DJ, and O’Regan, L. The development of motor planning strategies in children. Eur J Dev Psychol. (2021) 18:1–17. doi: 10.1080/17405629.2020.1736029
7. Flanagan, JR, and Wing, AM. The role of internal models in motion planning and control: evidence from grip force adjustments during movements of hand-held loads. J Neurosci. (1997) 17:1519–28. doi: 10.1523/JNEUROSCI.17-04-01519.1997
8. Ingram, JN, Howard, IS, Randall Flanagan, J, and Wolpert, DM. Report multiple grasp-specific representations of tool dynamics mediate skillful manipulation. Curr Biol. (2010) 20:618–23. doi: 10.1016/j.cub.2010.01.054
9. Ferrari, A. From movement to action: a new framework for cerebral palsy. Eur J Phys Rehabil Med. (2019) 55:852–61. doi: 10.23736/S1973-9087.19.05845-3
10. Rosenbaum, P, Paneth, N, Leviton, A, Goldstein, M, Damiano, D, Dan, B, et al. A report: the definition and classification of cerebral palsy. Dev Med Child Neurol. (2006) 109:8–14.
11. Bleyenheuft, Y, Dricot, L, Gilis, N, Kuo, H-c, Bleyenheuft, C, Gordon, AM, et al. Research in developmental disabilities capturing Neuroplastic changes after bimanual intensive rehabilitation in children with unilateral spastic cerebral palsy: a combined DTI, TMS and FMRI Pilot Study. Res Dev Disabil. (2015) 43:136–49. doi: 10.1016/j.ridd.2015.06.014
12. Hung, YC, Robert, MT, Friel, KM, and Gordon, AM. Relationship between integrity of the Corpus callosum and bimanual coordination in children with unilateral spastic cerebral palsy. Front Hum Neurosci. (2019) 13:334. doi: 10.3389/FNHUM.2019.00334/BIBTEX
13. Martinie, O, Mercier, C, Gordon, AM, and Robert, MT. Upper limb motor planning in individuals with cerebral palsy aged between 3 and 21 years old: a systematic review. Brain Sci. (2021) 11:920. doi: 10.3390/brainsci11070920
14. Eliasson, AC, Gordon, AM, and Forssberg, H. Impaired anticipatory control of isometric forces during grasping by children with cerebral palsy. Develop Med Child Neurol. (1992) 34:216–25. doi: 10.1111/j.1469-8749.1992.tb14994.x
15. Gordon, AM, and Duff, SV. Relation between clinical measures and fine manipulative control in children with hemiplegic cerebral palsy. Develop Med Child Neurol. (1999a) 41:586–91. doi: 10.1111/j.1469-8749.1999.tb00661.x
16. Westling, G, and Johansson, RS. Factors influencing the force control during precision grip. Exp Brain Res. (1984) 53:277–84. doi: 10.1007/BF00238156
17. Johansson, RS, and Westling, G. Coordinated isometric muscle commands adequately and erroneously programmed for the weight during lifting task with precision grip. Exp Brain Res. (1988) 71:59–71. doi: 10.1007/BF00247522
18. Duff, SV, and Gordon, AM. Learning of grasp control in children with hemiplegic cerebral palsy. Dev Med Child Neurol. (2003) 45:746–57. doi: 10.1111/j.1469-8749.2003.tb00884.x
19. Gutterman, J, and Gordon, AM. Neural correlates of impaired grasp function in children with unilateral spastic cerebral palsy. Brain Sci. (2023) 13:1102. doi: 10.3390/BRAINSCI13071102
20. Steenbergen, B, and Gordon, AM. Activity limitation in hemiplegic cerebral palsy: evidence for disorders in motor planning. Dev Med Child Neurol. (2006) 48:780–783. doi: 10.1017/S0012162206001666
21. Beaulieu, C. The basis of anisotropic water diffusion in the nervous system: A Technical Review. NMR Biomed. (2002) 15:435–55. doi: 10.1002/nbm.782
22. Mori, S, and Zhang, J. Principles of diffusion tensor imaging and its applications to basic neuroscience research. Neuron. (2006) 51:527–39. doi: 10.1016/j.neuron.2006.08.012
23. Bleyenheuft, Y, and Thonnard, J-l. Predictive and reactive control of precision grip in children with congenital hemiplegia. Neurorehabil Neural Repair. (2010) 24:318–27. doi: 10.1177/1545968309353327
24. Gordon, AM, Bleyenheuft, Y, and Steenbergen, B. Pathophysiology of impaired hand function in children with unilateral cerebral palsy. Develop Med Child Neurol. (2013) 55:32–7. doi: 10.1111/dmcn.12304
25. Lemon, RN, Johansson, RS, and Westling, G. Corticospinal control during reach, grasp, and precision lift in man. J Neurosci. (1995a) 15:6145–56. doi: 10.1523/JNEUROSCI.15-09-06145.1995
26. Ehrsson, HH, Fagergren, A, Johansson, RS, Hans Forssberg, H, Henrik, AF, and Johansson, RS. Evidence for the involvement of the posterior parietal cortex in coordination of fingertip forces for grasp stability in manipulation. J Neurophysiol. (2003) 90:2978–86. doi: 10.1152/jn.00958.2002
27. Kawato, M, Kuroda, T, Imamizu, H, Nakano, E, Miyauchi, S, and Yoshioka, T. Internal forward models in the cerebellum: FMRI study on grip force and load force coupling. Prog Brain Res. (2003) 142:171–88. doi: 10.1016/S0079-6123(03)42013-X
28. Marneweck, M, Barany, DA, Santello, M, and Grafton, ST. Neural representations of sensorimotor memory-and digit position-based load force adjustments before the onset of dexterous object manipulation. J Neurosci. (2018) 38:4724–37. doi: 10.1523/JNEUROSCI.2588-17.2018
29. Marneweck, M, and Grafton, ST. Representational neural mapping of dexterous grasping before lifting in humans. J Neurosci. (2020) 40:2708–16. doi: 10.1523/JNEUROSCI.2791-19.2020
30. Bhoyroo, R, Hands, B, Cayenberghs, K, de Luca, A, Leemans, A, Wigley, A, et al. Association between motor planning and the Frontoparietal network in children: an exploratory multimodal study. J Int Neuropsychol Soc. (2022) 28:926–36. doi: 10.1017/S1355617721001168
31. Koch, G, Cercignani, M, Pecchioli, C, Versace, V, Oliveri, M, Caltagirone, C, et al. In vivo definition of parieto-motor connections involved in planning of grasping movements. NeuroImage. (2010) 51:300–12. doi: 10.1016/j.neuroimage.2010.02.022
32. Murata, A, Wen, W, and Asama, H. The body and objects represented in the ventral stream of the parieto-premotor network. Neurosci Res. (2016) 104:4–15. doi: 10.1016/j.neures.2015.10.010
33. Richard, N, Desmurget, M, Teillac, A, Beuriat, P-A, Bardi, L, Coudé, G, et al. Anatomical bases of fast parietal grasp control in humans: a diffusion-MRI tractography study. NeuroImage. (2021) 235:118002. doi: 10.1016/j.neuroimage.2021.118002
34. Jenmalm, P, Schmitz, C, Forssberg, H, and Henrik Ehrsson, H. Lighter or heavier than predicted: neural correlates of corrective mechanisms during erroneously programmed lifts. J Neurosci. (2006) 26:9015–21. doi: 10.1523/JNEUROSCI.5045-05.2006
35. Ramnani, N. The primate cortico-cerebellar system: anatomy and function. Nat Rev Neurosci. (2006) 7:511–22. doi: 10.1038/nrn1953
36. Ugolini, G, and Kuypers, HGJM. Collaterals of corticospinal and pyramidal fibres to the pontine grey demonstrated by a new application of the fluorescent fibre labelling technique. Brain Res. (1986) 365:211–27. doi: 10.1016/0006-8993(86)91632-X
37. Ito, M. Bases and implications of learning in the cerebellum — adaptive control and internal model mechanism. Prog Brain Res. (2005) 148:95–109. doi: 10.1016/S0079-6123(04)48009-1
38. Fiori, S, Pannek, K, Pasquariello, R, Ware, RS, Cioni, G, Rose, SE, et al. Corticopontocerebellar connectivity disruption in congenital hemiplegia. Neurorehabil Neural Repair. (2015) 29:858–66. doi: 10.1177/1545968314568726
39. Tsao, H, Pannek, K, Boyd, RN, and Rose, SE. Changes in the integrity of thalamocortical connections are associated with sensorimotor deficits in children with congenital hemiplegia. Brain Struct Funct. (2015) 220:307–18. doi: 10.1007/s00429-013-0656-x
40. Eliasson, AC, Forssberg, H, Hung, YC, and Gordon, AM. Development of hand function and precision grip control in individuals with cerebral palsy: a 13-year follow-up study. Pediatrics. (2006) 118:e1226–36. doi: 10.1542/peds.2005-2768
41. Eliasson, AC, Krumlinde-Sundholm, L, Rösblad, B, Beckung, E, Arner, M, Öhrvall, AM, et al. The manual ability classification system (MACS) for children with cerebral palsy: scale development and evidence of validity and reliability. Dev Med Child Neurol. (2006) 48:549–54. doi: 10.1017/S0012162206001162
42. Klingels, K, De Cock, P, Molenaers, G, Desloovere, K, Huenaerts, C, Jaspers, E, et al. Upper limb motor and sensory impairments in children with hemiplegic cerebral palsy: can they be measured reliably? Disabil Rehabil. (2010) 32:409–16. doi: 10.3109/09638280903171469
43. Oldfield, RC. The assessment and analysis of handedness: the Edinburgh inventory. Neuropsychologia. (1971) 9:97–113. doi: 10.1016/0028-3932(71)90067-4
44. Martinie, O, Karan, P, Traverse, E, Mercier, C, Descoteaux, M, and Robert, MT. The challenge of diffusion magnetic resonance imaging in cerebral palsy: a proposed method to identify white matter pathways. Brain Sci. (2023) 13:1386. doi: 10.3390/brainsci13101386
45. Theaud, G, Houde, JC, Boré, A, Rheault, F, Morency, F, and Descoteaux, M. TractoFlow: a robust, efficient and reproducible diffusion MRI pipeline leveraging Nextflow & Singularity. NeuroImage. (2020) 218:116889. doi: 10.1016/j.neuroimage.2020.116889
46. Cousineau, M. Analyse de Populations Neurodégénératives et Assurance Qualité de la Tractographie de la Matière Blanche Université de Sherbrooke (2017).
47. Zhang, H, Schneider, T, Wheeler-Kingshott, CA, and Alexander, DC. NODDI: practical in vivo neurite orientation dispersion and density imaging of the human brain. NeuroImage. (2012) 61:1000–16. doi: 10.1016/j.neuroimage.2012.03.072
48. Daducci, A, Canales-Rodríguez, EJ, Zhang, H, Dyrby, TB, Alexander, DC, and Thiran, JP. Accelerated microstructure imaging via convex optimization (AMICO) from diffusion MRI data. NeuroImage. (2015) 105:32–44. doi: 10.1016/J.NEUROIMAGE.2014.10.026
49. Mori, S, Wakana, S, Van Zijl, PC, and Nagae-Poetscher, LM. MRI atlas of human white matter. New York: Elsevier (2005).
50. Lancaster, JL, Woldorff, MG, Parsons, LM, Liotti, M, Freitas, CS, Rainey, L, et al. Automated Talairach atlas labels for functional brain mapping. Hum Brain Mapp. (2000) 10:120–31. doi: 10.1002/1097-0193(200007)10:3<120::AID-HBM30>3.0.CO;2-8
51. Avants, Brian B, Tustison, Nick, and Johnson, Hans. (2014). Advanced normalization tools (ANTS) release 2.X. 2, 1–35. Available online at: https://brianavants.wordpress.com/2012/04/13/updated-ants-compile-instructions-april-12-2012/.
52. Palesi, F, De Rinaldis, A, Castellazzi, G, Calamante, F, Muhlert, N, Chard, D, et al. Contralateral cortico-ponto-cerebellar pathways reconstruction in humans in vivo: implications for reciprocal cerebro-cerebellar structural connectivity in motor and non-motor areas. Sci Rep. (2017) 7:1–13. doi: 10.1038/s41598-017-13079-8
53. Palesi, F, Tournier, JD, Calamante, F, Muhlert, N, Castellazzi, G, Chard, D, et al. Reconstructing contralateral fiber tracts: methodological aspects of cerebello-thalamo-cortical pathway reconstruction. Funct Neurol. (2016) 31:229–38. doi: 10.11138/FNEUR/2016.31.4.229
54. Garyfallidis, E, Côté, MA, Rheault, F, Sidhu, J, Hau, J, Petit, L, et al. Recognition of white matter bundles using local and global streamline-based registration and clustering. NeuroImage. (2018) 170:283–95. doi: 10.1016/J.NEUROIMAGE.2017.07.015
55. Rheault, F. Analyse et reconstruction de faisceaux de la matière blanche Doctoral dissertation, Université de Sherbrooke. (2020).
56. Schilling, KG, Rheault, F, Petit, L, Hansen, CB, Nath, V, Yeh, FC, et al. Tractography dissection variability: what happens when 42 groups dissect 14 white matter bundles on the same dataset? NeuroImage. (2021) 243:118502. doi: 10.1016/J.NEUROIMAGE.2021.118502
57. Mukherjee, M, Hyde, C, Barhoun, P, Bianco, KM, Singh, M, Waugh, J, et al. White matter organisation of sensorimotor tracts is associated with motor imagery in childhood. Brain Struct Funct. (2024) 229:1591–603. doi: 10.1007/s00429-024-02813-4
58. Rodríguez-Herreros, B, Amengual, JL, Gurtubay-Antolín, A, Richter, L, Jauer, P, Erdmann, C, et al. Microstructure of the superior longitudinal fasciculus predicts stimulation-induced interference with on-line motor control. NeuroImage. (2015) 120:254–65. doi: 10.1016/J.NEUROIMAGE.2015.06.070
59. Lidzba, K, Staudt, M, Wilke, M, Grodd, W, and Krägeloh-Mann, I. Lesion-induced right-hemispheric language and organization of nonverbal functions. Neuroreport. (2006) 17:929–33. doi: 10.1097/01.WNR.0000221841.12632.D6
61. Wolpert, DM, and Flanagan, JR. Motor prediction. Curr Biol. (2001) 11:729–32. doi: 10.1016/s0960-9822(01)00432-8
62. Bleyenheuft, Y, and Gordon, AM. Precision grip control, sensory impairments and their interactions in children with hemiplegic cerebral palsy: a systematic review. Res Dev Disabil. (2013) 34:3014–28. doi: 10.1016/j.ridd.2013.05.047
63. Eliasson, AC, and Gordon, AM. Impaired force coordination during object release in children with hemiplegic cerebral palsy. Dev Med Child Neurol. (2000) 42:228–34. doi: 10.1111/j.1469-8749.2000.tb00077.x
64. Wing, AM, Flanagan, JR, and Richardson, J. Anticipatory postural adjustments in stance and grip. Exp Brain Res. (1997) 116:122–30. doi: 10.1007/pl00005732
65. Mailleux, L, Franki, I, Emsell, L, Peedima, ML, Fehrenbach, A, Feys, H, et al. The relationship between neuroimaging and motor outcome in children with cerebral palsy: a systematic review—part B diffusion imaging and tractography. Res Dev Disabil. (2020) 97:103569. doi: 10.1016/j.ridd.2019.103569
66. Min, K, Yu, SJ, Lee, JH, Song, J, Shim, JS, Lee, HS, et al. Reliability of fractional anisotropy measurement for children with cerebral palsy. Neuropediatrics. (2014) 45:84–92. doi: 10.1055/s-0033-1357480/id/jr130958oa-12/bib
67. Curran, KM, Emsell, L, and Leemans, A. Quantitative DTI Measures. In: Van Hecke W, Emsell L, and Sunaert S, editors. Diffusion Tensor Imaging. New York, NY: Springer. (2016).
68. Figley, CR, Uddin, MN, Wong, K, Kornelsen, J, Puig, J, and Figley, TD. Potential pitfalls of using fractional anisotropy, axial diffusivity, and radial diffusivity as biomarkers of cerebral white matter microstructure. Front Neurosci. (2022) 15:799576. doi: 10.3389/fnins.2021.799576
69. Riffert, TW, Schreiber, J, Anwander, A, and Knösche, TR. Beyond fractional anisotropy: extraction of bundle-specific structural metrics from crossing fiber models. NeuroImage. (2014) 100:176–91. doi: 10.1016/J.NEUROIMAGE.2014.06.015
70. Timmers, I, Roebroeck, A, Bastiani, M, Jansma, B, Rubio-Gozalbo, E, and Zhang, H. Assessing microstructural substrates of white matter abnormalities: a comparative study using DTI and NODDI. PLoS One. (2016) 11:e0167884. doi: 10.1371/journal.pone.0167884
71. Henriksen, OM, del Mar, M, Álvarez-Torres, PF, Hangel, G, Keil, VC, Nechifor, RE, et al. High-grade glioma treatment response monitoring biomarkers: a position statement on the evidence supporting the use of advanced MRI techniques in the clinic, and the latest bench-to-bedside developments. Part 1: perfusion and diffusion techniques. Frontiers. Oncology. (2022) 12:810263. doi: 10.3389/FONC.2022.810263/BIBTEX
72. Kamiya, K, Hori, M, and Aoki, S. NODDI in clinical research. J Neurosci Methods. (2020) 346:108908. doi: 10.1016/J.JNEUMETH.2020.108908
73. Schilling, KG, Archer, D, Rheault, F, Lyu, I, Huo, Y, Cai, LY, et al. Superficial white matter across development, young adulthood, and aging: volume, thickness, and relationship with cortical features. Brain Struct Funct. (2023) 228:1019–31. doi: 10.1007/s00429-023-02642-x
74. Garfinkle, J, and Shevell, MI. Cerebral palsy, developmental delay, and epilepsy after neonatal seizures. Pediatr Neurol. (2011) 44:88–96. doi: 10.1016/J.PEDIATRNEUROL.2010.09.001
75. Auld, ML, Boyd, RN, Lorimer Moseley, G, Ware, RS, and Johnston, LM. Impact of tactile dysfunction on upper-limb motor performance in children with unilateral cerebral palsy. Arch Phys Med Rehabil. (2012) 93:696–702. doi: 10.1016/J.APMR.2011.10.025
76. Eliasson, AC, Gordon, AM, and Forssberg, H. Tactile control of isometric fingertip forces during grasping in children with cerebral palsy. Develop Med Child Neurol. (1995) 37:72–84. doi: 10.1111/j.1469-8749.1995.tb11933.x
77. Robert, MT, Guberek, R, Sveistrup, H, and Levin, MF. Motor learning in children with hemiplegic cerebral palsy and the role of sensation in short-term motor training of goal-directed reaching. Develop Med Child Neurol. (2013) 55:1121–8. doi: 10.1111/DMCN.12219
78. Flanagan, JR, King, S, Wolpert, DM, and Johansson, RS. Sensorimotor prediction and memory in object manipulation. Can J Exp Psychol. (2001) 55:87–95. doi: 10.1037/H0087355
79. Westling, G, and Johansson, RS. Responses in glabrous skin mechanoreceptors during precision grip in humans. Exp Brain Res. (1987) 66:128–40. doi: 10.1007/bf00236209
80. Eliasson, AC, Gordon, AM, and Forssberg, H. Basic co-ordination of manipulative forces of children with cerebral palsy. Develop Med Child Neurol. (1991) 33:661–70. doi: 10.1111/j.1469-8749.1991.tb14943.x
81. Mutsaarts, M, Steenbergen, B, and Bekkering, H. Anticipatory planning of movement sequences in hemiparetic cerebral palsy. Mot Control. (2005) 9:439–58. doi: 10.1123/MCJ.9.4.439
82. Rigoldi, C, Molteni, E, Rozbaczylo, C, Morante, M, Albertini, G, Bianchi, AM, et al. Movement analysis and EEG recordings in children with hemiplegic cerebral palsy. Exp Brain Res. (2012) 223:517–24. doi: 10.1007/s00221-012-3278-2
83. Verrel, J, Bekkering, H, and Steenbergen, B. Eye-hand coordination during manual object transport with the affected and less affected hand in adolescents with hemiparetic cerebral palsy. Exp Brain Res. (2008) 187:107–16. doi: 10.1007/s00221-008-1287-y
84. Akaguchi, R, Takamura, Y, Okuno, H, Morioka, S, and Kawashima, N. Relative contribution of sensory and motor deficits on grip force control in patients with chronic stroke. Clin Neurophysiol. (2024) 161:231–41. doi: 10.1016/J.CLINPH.2024.02.033
85. Carr, LJ, Harrison, LM, Evans, AL, and Stephens, JA. Patterns of central motor reorganization in hemiplegic cerebral palsy. Brain. (1993) 116:1223–47. doi: 10.1093/BRAIN/116.5.1223
86. Raghavan, P, Krakauer, JW, and Gordon, AM. Impaired anticipatory control of fingertip forces in patients with a pure motor or sensorimotor lacunar syndrome. Brain. (2006) 129:1415–25. doi: 10.1093/BRAIN/AWL070
87. Forssberg, H, Eliasson, AC, Kinoshita, H, Westling, G, and Johansson, RS. Development of human precision grip - IV.Tactile adaptation of isometric finger forces to the frictional condition. Exp Brain Res. (1995) 104:323–30. doi: 10.1007/BF00242017/METRICS
88. Green, S, Grierson, LEM, Dubrowski, A, and Carnahan, H. Motor adaptation and manual transfer: insight into the persistent nature of sensorimotor representations. Brain Cogn. (2010) 72:385–93. doi: 10.1016/J.BANDC.2009.11.006
89. Gordon, AM, Charles, J, and Steenbergen, B. Fingertip force planning during grasp is disrupted by impaired sensorimotor integration in children with hemiplegic cerebral palsy. Pediatr Res. (2006) 60:587–91. doi: 10.1203/01.pdr.0000242370.41469.74
90. Cadoret, G, and Smith, AM. Friction, not texture, dictates grip forces used during object manipulation. J Neurophysiol. (1996) 75:1963–9. doi: 10.1152/JN.1996.75.5.1963
91. Flanagan, JR, Wing, AM, Allison, S, and Spenceley, A. Effects of surface texture on weight perception when lifting objects with a precision grip. Percept Psychophys. (1995) 57:282–90. doi: 10.3758/BF03213054
92. Bensmail, D, Sarfeld, AS, Fink, GR, and Nowak, DA. Intermanual transfer of sensorimotor memory for grip force when lifting objects: the role of wrist angulation. Clin Neurophysiol. (2010) 121:402–7. doi: 10.1016/J.CLINPH.2009.11.010
93. McDonnell, MN, Ridding, MC, Flavel, SC, and Miles, TS. Effect of human grip strategy on force control in precision tasks. Exp Brain Res. (2005) 161:368–73. doi: 10.1007/s00221-004-2081-0
94. Englander, ZA, Pizoli, CE, Batrachenko, A, Sun, J, Worley, G, Mikati, MA, et al. Diffuse reduction of white matter connectivity in cerebral palsy with specific vulnerability of long range Fiber tracts. NeuroImage. (2013) 2:440–7. doi: 10.1016/J.NICL.2013.03.006
95. Mostofsky, SH, Burgess, MP, and Gidley Larson, JC. Increased motor cortex white matter volume predicts motor impairment in autism. Brain. (2007) 130:2117–22. doi: 10.1093/brain/awm129
96. Herbert, MR, Ziegler, DA, Makris, N, Filipek, PA, Kemper, TL, Normandin, JJ, et al. Localization of white matter volume increase in autism and developmental language disorder. Ann Neurol. (2004) 55:530–40. doi: 10.1002/ANA.20032
97. Lebel, C, and Beaulieu, C. Longitudinal development of human brain wiring continues from childhood into adulthood. J Neurosci. (2011) 31:10937–47. doi: 10.1523/JNEUROSCI.5302-10.2011
98. Casanova, MF, van Kooten, IAJ, Switala, AE, van Engeland, H, Heinsen, H, Steinbusch, HWM, et al. Minicolumnar abnormalities in autism. Acta Neuropathol. (2006) 112:287–303. doi: 10.1007/s00401-006-0085-5
99. Nayak, BK. Understanding the relevance of sample size calculation. Indian J Ophthalmol. (2010) 58:469–70. doi: 10.4103/0301-4738.71673
Keywords: tractography, diffusion neuroimaging, precision grip, anticipatory control, motor planning
Citation: Martinie O, Karan P, Simoneau M, Descoteaux M, Mercier C and Robert MT (2025) Feedforward control in children with cerebral palsy and association with white matter integrity. Front. Neurol. 16:1515432. doi: 10.3389/fneur.2025.1515432
Edited by:
Giovanni Buccino, San Raffaele Hospital (IRCCS), ItalyReviewed by:
Alexander Drobyshevsky, NorthShore University HealthSystem, United StatesCopyright © 2025 Martinie, Karan, Simoneau, Descoteaux, Mercier and Robert. This is an open-access article distributed under the terms of the Creative Commons Attribution License (CC BY). The use, distribution or reproduction in other forums is permitted, provided the original author(s) and the copyright owner(s) are credited and that the original publication in this journal is cited, in accordance with accepted academic practice. No use, distribution or reproduction is permitted which does not comply with these terms.
*Correspondence: Maxime T. Robert, bWF4aW1lLnJvYmVydEBmbWVkLnVsYXZhbC5jYQ==
Disclaimer: All claims expressed in this article are solely those of the authors and do not necessarily represent those of their affiliated organizations, or those of the publisher, the editors and the reviewers. Any product that may be evaluated in this article or claim that may be made by its manufacturer is not guaranteed or endorsed by the publisher.
Research integrity at Frontiers
Learn more about the work of our research integrity team to safeguard the quality of each article we publish.