 Daniel M. Markowitz
 Elizabeth Affel
 György Hajnóczky
 Robert C. Sergott
94% of researchers rate our articles as excellent or good
Learn more about the work of our research integrity team to safeguard the quality of each article we publish.
Find out more
REVIEW article
Front. Neurol., 07 March 2025
Sec. Neuro-Ophthalmology
Volume 16 - 2025 | https://doi.org/10.3389/fneur.2025.1493876
This article is part of the Research TopicRetina imaging in neurodegenerative disordersView all 5 articles
Fluorescence lifetime imaging ophthalmoscopy (FLIO) has emerged as an innovative advancement in retinal imaging, with the potential to provide in vivo non-invasive insights into the mitochondrial metabolism of the retina. Traditional retinal imaging, such as optical coherence tomography (OCT) and fundus autofluorescence (FAF) intensity imaging, focus solely on structural changes to the retina. In contrast, FLIO provides data that may reflect retinal fluorophore activity, some of which may indicate mitochondrial metabolism. This review builds upon the existing literature to describe the principles of FLIO and established uses in retinal diseases while introducing the potential for FLIO in neurodegenerative conditions.
Although fundus photography and intravenous fluorescein angiography were originally developed for retinal diseases, these imaging techniques have provided valuable insights into the diagnosis, treatment, and pathogenesis of neurological and neuro-ophthalmic conditions (1–9). These observations have validated the hypothesis that the retina is as much a part of the central nervous system as the optic nerves, chiasm, and structures merging visual information with memory, depth perception, and other higher cortical functions.
Spectral-domain optical coherence tomography (OCT) and optical coherence tomography angiography (OCT-A), the most widely used retinal imaging technologies in both clinical practice and clinical trials, have revealed previously hidden details of the structure of retinal layers as well as the retinal microvascular circulation (10–14). For some years, fundus autofluorescence (FAF) intensity imaging was used to evaluate the metabolic status of the retina indirectly. However, fundus autofluorescence intensity measurements are prone to media opacities, high image noise, low contrast, and do not allow the assignment of the signal to specific chemical compounds. Furthermore, compounds with bright autofluorescence, such as lipofuscin, might overwhelm the fluorescence signal of other compounds (15). Thus, these methods have significant limitations in evaluating the in vivo metabolism of the healthy retina or the retina afflicted with primary ophthalmic or neurological diseases.
Approximately 10 years ago, peer-reviewed reports described and defined fluorescence lifetime imaging ophthalmoscopy (FLIO), the clinical equivalent of fluorescence lifetime imaging microscopy (FLIM). FLIO offers non-invasive, non-contact, and reproducible insights into the metabolic activity of the retina through fluorophores such as flavin adenine dinucleotide (FAD), lipofuscin, lutein, zeaxanthin, and meso-zeaxanthin. However, further validation is required for its broader clinical applications (15–17). Just as positron emission tomography (PET) scanning adds metabolic dimensions to MRI, we believe that FLIO offers the in vivo physiological counterpart to OCT.
FLIO measures the fluorescence decay over time of metabolically active tissues without fluorescent dyes (16, 18) (Figure 1). Different molecules within each subcellular structure display unique auto-fluorescent signatures depending upon the molecular environment. However, the measured lifetime may represent contributions from multiple fluorophores, and the attribution of fluorescence lifetimes to specific molecules requires further investigation. FLIO can potentially provide valuable insights into mitochondrial oxidative metabolism and lysosomal function. However, isolating specific retinal fluorophores from these organelles in vivo remains challenging due to overlapping emission spectra. Advanced in vitro techniques such as FLIM may aid in validating and isolating specific signals (17, 19). Although standard FLIO currently does not allow for the differentiation of signal sources based on retinal layer dependence, future integration with spectral domain OCT may enable the identification of layer-specific fluorescence lifetime signals, providing greater insight into the localization of fluorophores within the retina. Using FLIO and spectral domain OCT, we expect to fulfill the critical paradigm of merging function with structure.
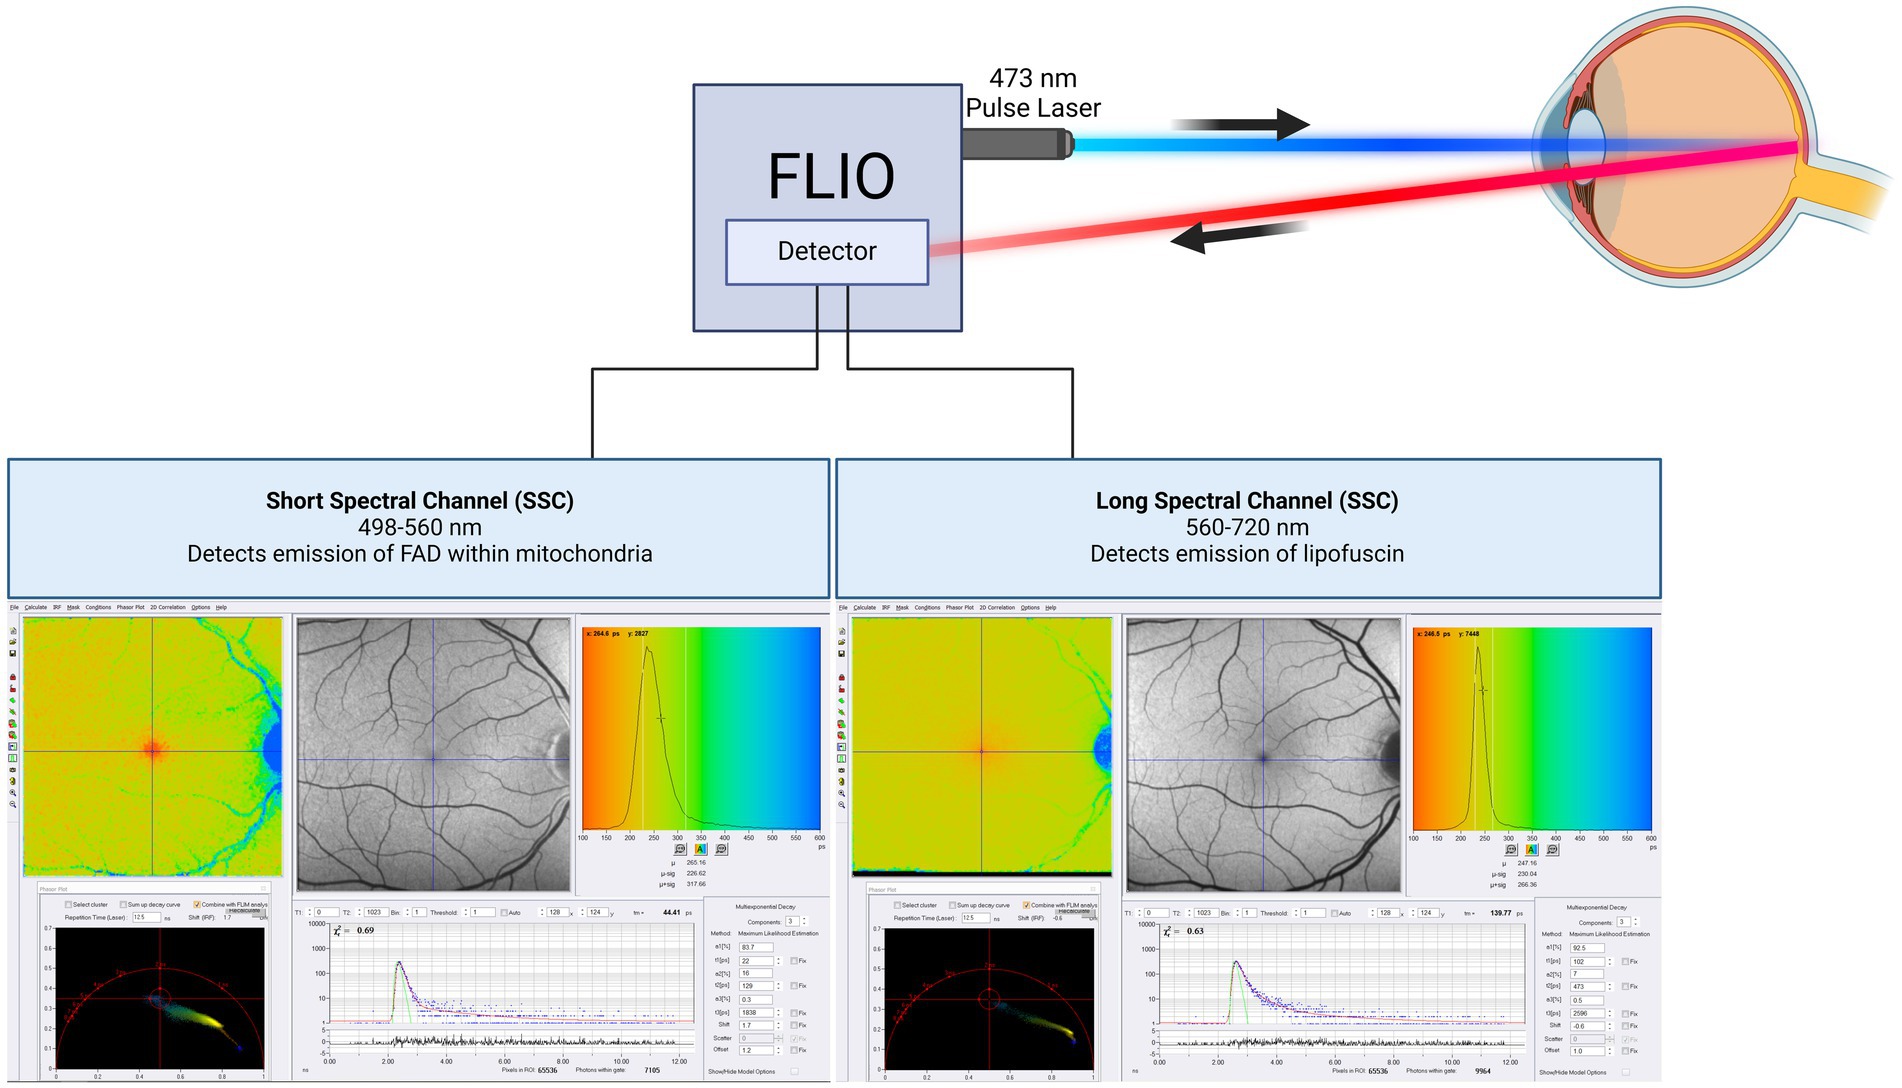
Figure 1. Schematic of FLIO imaging. The technical description of FLIO equipment in this review is on the Heidelberg Spectralis based FLIO instrument. The machine uses two hybrid photon-counting detectors (HPM-100-40, Becker&Hickl GmbH, Berlin, Germany) to record fluorescence photons from each pixel across 1,024 time channels. This design generates two separate photon arrival histograms for each pixel, one for each spectral channel. The photon arrival histograms are then used to calculate fluorescence lifetimes. This equipment was used in almost all cited studies. This figure was created with BioRender.com.
In the early 2000s, FLIO was first investigated by Dietrich Schweitzer and Martin Hammer using a prototype device to image the human retina (20–25). The technology Schweitzer and Hammer developed was advanced by Heidelberg Engineering in Germany and Switzerland in 2012 (16). In dermatology, fluorescence lifetime imaging has already enabled the detection of metabolic changes within basal cell carcinomas and surrounding tissue compared to healthy surrounding tissue (26). In cardiology, fluorescence lifetime imaging has been used to define the heterogeneity of atherosclerotic plaques and identify plaque disruption in coronary heart disease (16, 27–29).
Fluorescence is defined as the emission of visible or invisible electromagnetic radiation by a substance after exposure to external radiation of a shorter wavelength, such as X-rays or ultraviolet light. In other words, fluorophore, a chemical compound or molecule, absorbs light of short wavelengths and emits light of longer wavelengths. When a fluorophore absorbs a photon of one wavelength, it raises the molecule to an excited state for a short period before losing the energy as the emission of a photon, creating fluorescence as the molecule returns to its ground state. An individual “fluorophore lifetime” is the average time a molecule remains excited before emitting a photon and returning to its ground state. Fluorescence can be characterized by its intensity and lifetime. The fluorescence intensity signal is sensitive to several factors, including photobleaching, which do not affect the lifetime measurements.
Fluorescence lifetimes are depicted graphically in a log-linear fashion where shorter lifetimes exhibit a faster decay with a steeper slope, and longer lifetimes exhibit a more gradual slope. Various endogenous molecules contain specific fluorophores that emit fluorescence when excited. The fluorescence lifetime can be measured for individual fluorophores in isolation in vitro. In retinal tissues and the eye, autofluorescence is composed of many fluorophores, each with a different fluorescence lifetime, producing multiexponential decays. A simple measure of the multiexponential decay is the mean fluorescence lifetime, τm.
FLIO has evolved from FLIM, which evaluates biological mechanisms at the molecular level in various tissues or cells on the microscope stage (19). In FLIM studies, both autofluorescence lifetime and the lifetime of fluorescent dyes/fluorescent proteins introduced to the sample to monitor specific parameters such as glucose, ATP, or Ca2+ can be studied (30–35). FLIM can be performed in the time domain and frequency domain. FLIM can record fluorescence lifetimes using the time domain technique, time-correlated single-photon counting (TCSPC) (36, 37). An example of retina autofluorescence FLIM is shown in Figure 2 (38).
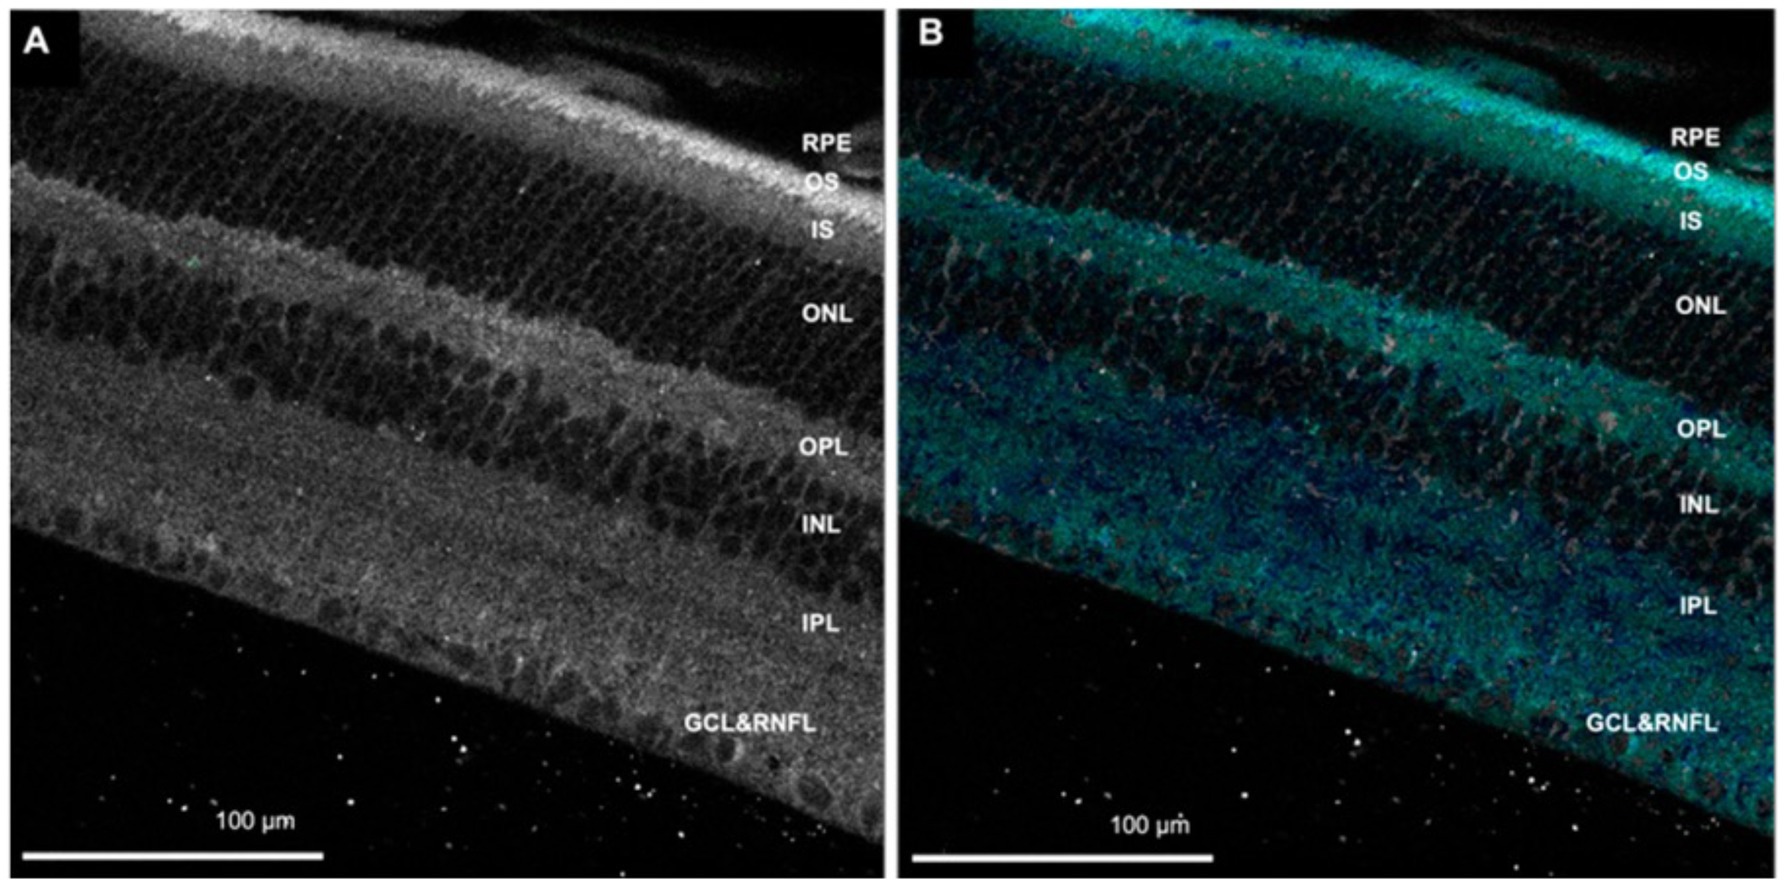
Figure 2. (A) Autofluorescence image of the retina. (B) Fluorescence lifetime image showing cyan/blue color corresponds with flavin adenine dinucleotide (FAD). RNFL, retinal nerve fiber layer; GCL, ganglion cell layer; IPL, inner plexiform layer; INL, inner nuclear layer; OPL, outer plexiform layer; ONL, outer nuclear layer; IS, photoreceptor inner segment; OS, photoreceptor outer segment; RPE, retinal pigment epithelium. Adapted from Kesavamoorthy et al. (38).
Fluorescent substances are excited with a short pulse laser, and the time interval it takes for molecules to excite and emit a photon is captured by a detector, allowing the calculation of the fluorescence lifetime. Multiple pulses of light excite the tissue, with the emission of a photon being recorded. The time interval recorded will not always be the same each time a molecule is hit with a light pulse. Given these differences in photon emission behaviors, the lifetimes from each pulse are recorded and sorted by interval duration, which can be graphically depicted on a histogram showing the time-dependent emission of multiple fluorophores in the tissue.
Combining TCSPC-FLIM and two-photon excitation, the generation of three-dimensional imaging of tissue is accomplished (21). This technique allows for acquiring detailed spatial and molecular information from molecule-specific fluorescent lifetimes. Its use has been illustrated in age-related macular degeneration (AMD) and imaging of the retina and choroid (39, 40). One study using two-photon FLIM measured the fluorescence lifetimes in retinal pigment epithelium (RPE) in the porcine retina, showing that the fluorescence lifetimes were relatively short due to melanin fluorescence (41). While fluorescence lifetimes of specific fluorophores can be measured in vitro using FLIM, these lifetimes are influenced by various environmental factors, such as pH and oxidation state (17, 20, 42–44). The in vivo analysis becomes more challenging due to multiple fluorophores within a tissue sample, complicating the interpretation of fluorescence lifetimes compared to the single-fluorophore analysis possible with in vitro FLIM.
While TCSPC-FLIM techniques plot information on a histogram depicting the time-dependent emission of multiple fluorophores, lifetimes depicted through phasor analysis may be an easier approach for visualizing fluorescence lifetime images of different fluorophores (45, 46). In phasor analysis, fluorescence lifetime data at each pixel can be converted into a coordinate pair known as a phasor (47). Decay data within individual pixels are plotted based on phase and amplitude (47). The phase is defined as the angle of the pointer. While the mathematics of phasor analysis is beyond the scope of this review, the phasor approach uses a rapid Fourier analysis that translates fluorescence lifetime information into a graphical representation called a phasor plot where lifetime differences across various image regions can be distinguished (46). This translation is shown in Figure 3. Phasor plots visualize the representation of the distribution of lifetime values by clustering pixels with similar lifetime properties together in a specific plot area (46). The phasor approach allows for the visual representation of fluorescence lifetimes in entire cells or tissues, providing insight into the state of metabolism or oxidative stress in diseases, as seen in Figure 4 (48). The position of a point on the phasor plot can help differentiate groups of fluorescence lifetimes. For example, lifetimes corresponding to the healthy fovea and macula appear within the semicircle on the shorter-lifetime side (far right side of the phasor plot). In contrast, lifetimes from the optic nerve, which are longer than those from the macula, are located in a distinct cluster on the phasor plot (left of the macula cluster). Phasor plots are currently being incorporated into the analysis of FLIO data.
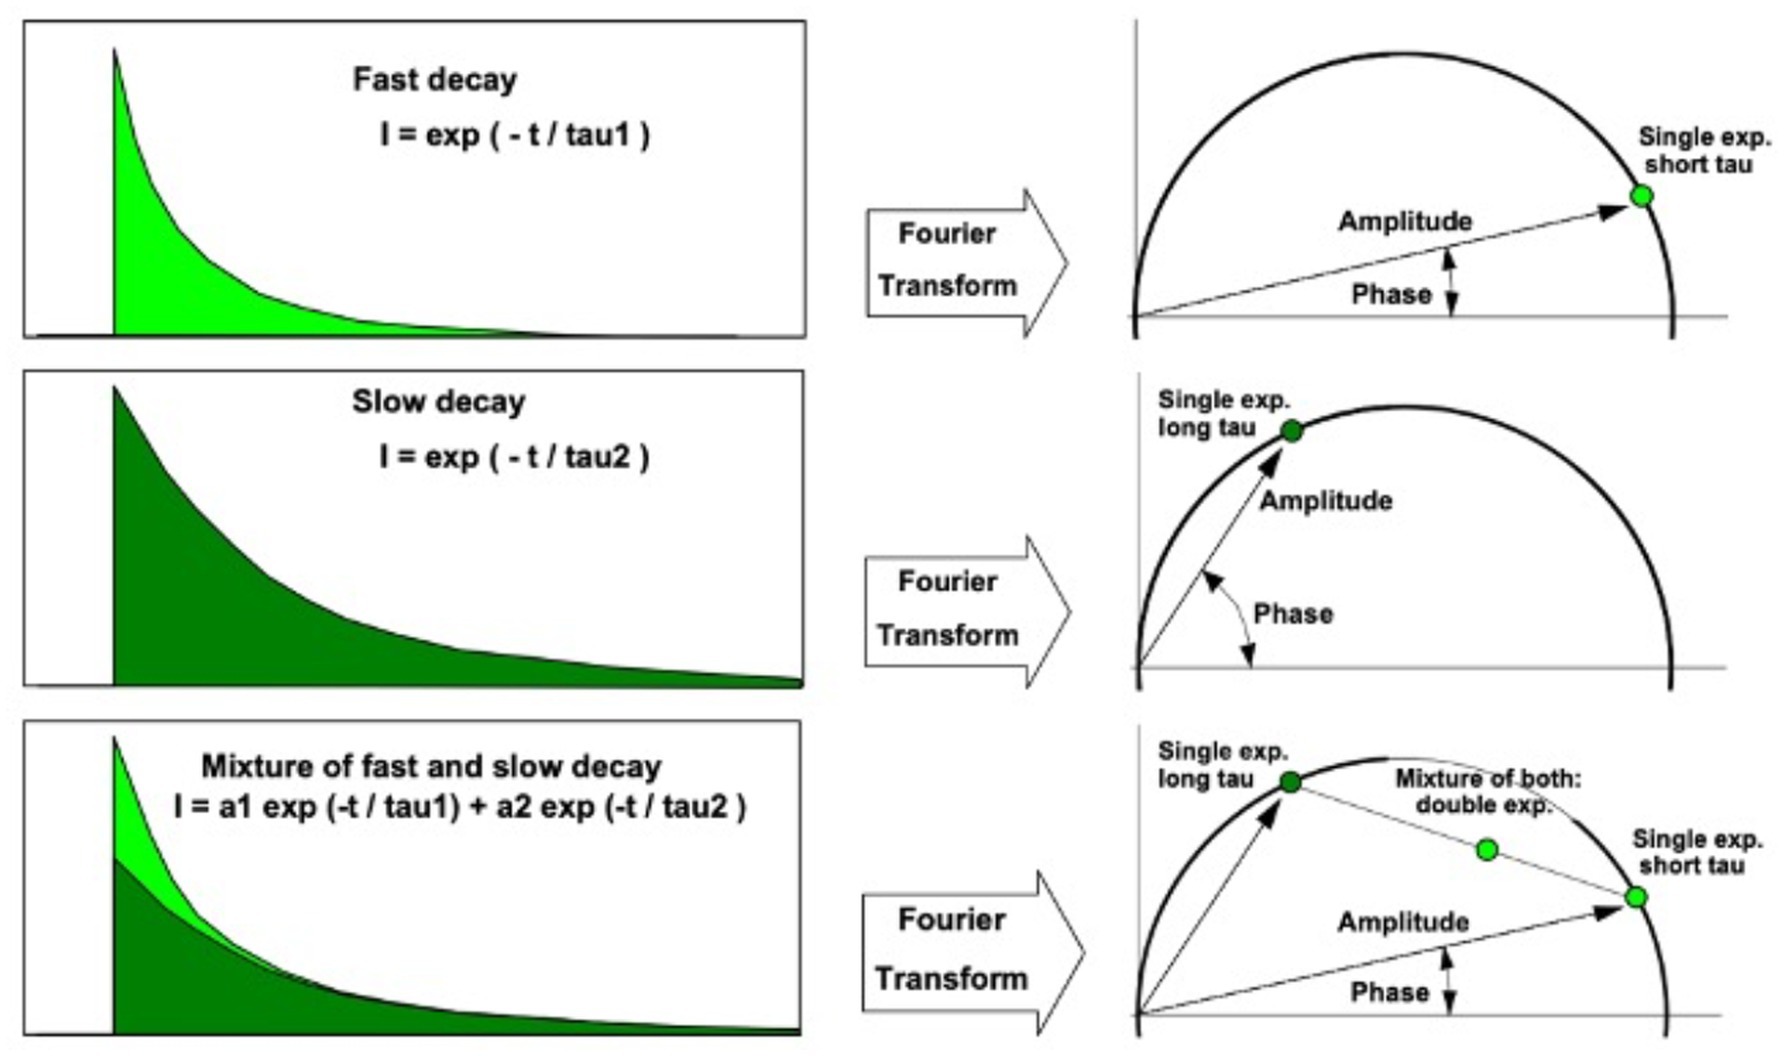
Figure 3. Translation between fluorescence lifetime decay curve (left) and phasor (right). A phasor point directly on the semicircle indicates a single lifetime species. Phasor points of species with multiple fluorescence lifetimes appear inside the semicircle. Adapted from Becker et al. (47).
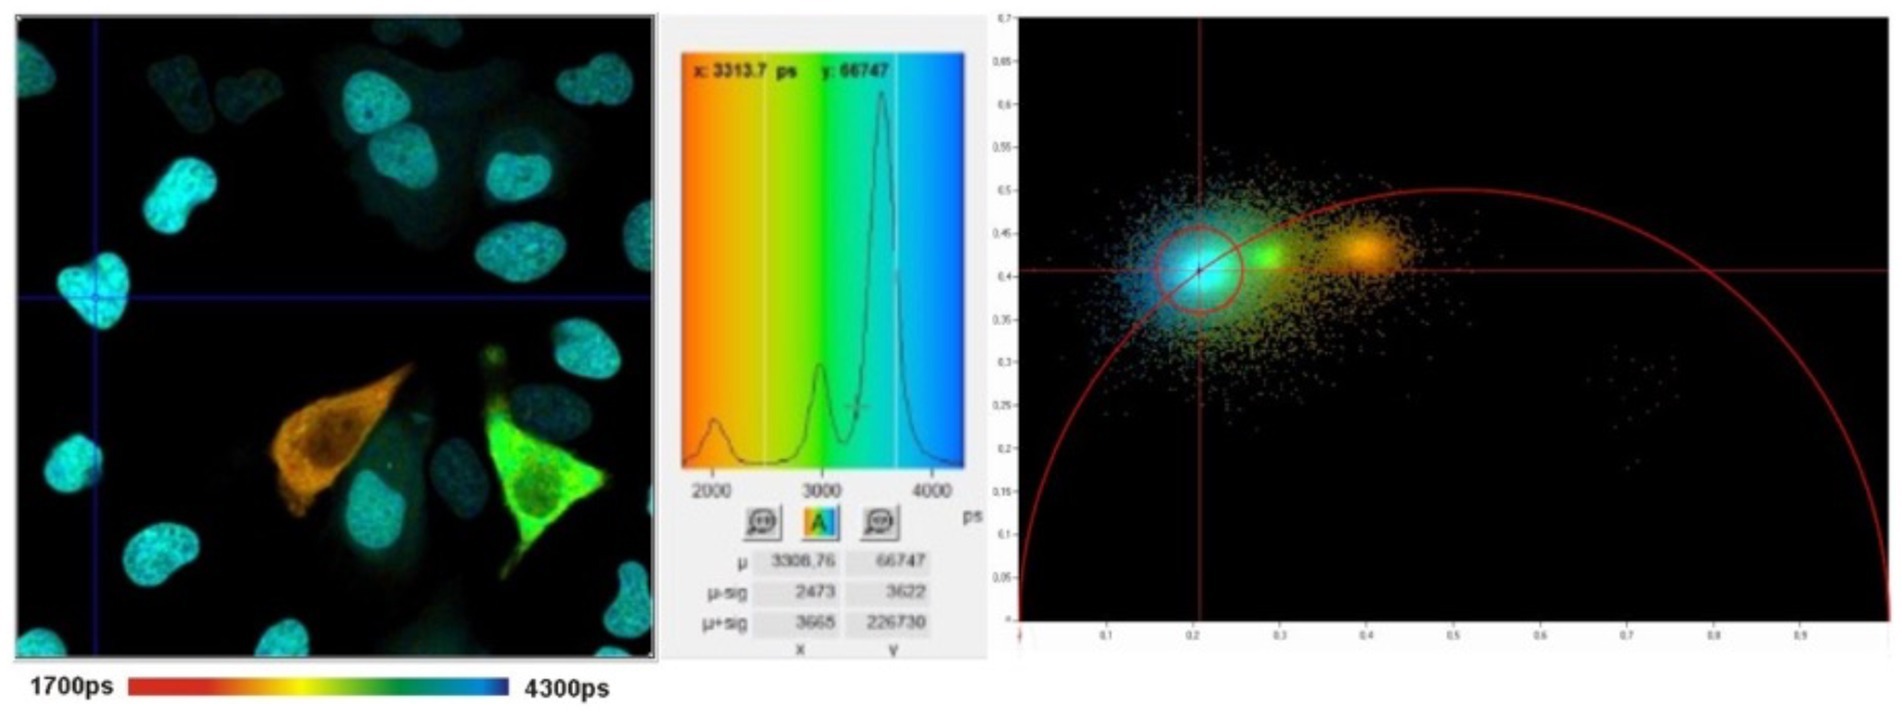
Figure 4. FLIM image (left) with histogram (middle) and corresponding phasor plot (right). The clusters in the phasor plot differentiate pixels of different fluorescence lifetimes in the image. Adapted from Becker et al. (47).
FLIO separates itself from FAF intensity imaging by identifying signals dependent on the properties of each fluorophore since each fluorophore has a unique autofluorescence lifetime. In addition, FLIO is not reliant on fluorescence intensity. The differences between FAF intensity imaging and FLIO are shown in Table 1. Current FLIO uses a 473-nm excitation pulsed diode laser, generating pulses at a frequency of 80 MHz with a full width at half maximum of 89 picoseconds (ps). The fiber-coupled laser has an average power of 200 μW, and its safety has been previously studied, fulfilling all safety regulations for a class 1 laser (49, 50).
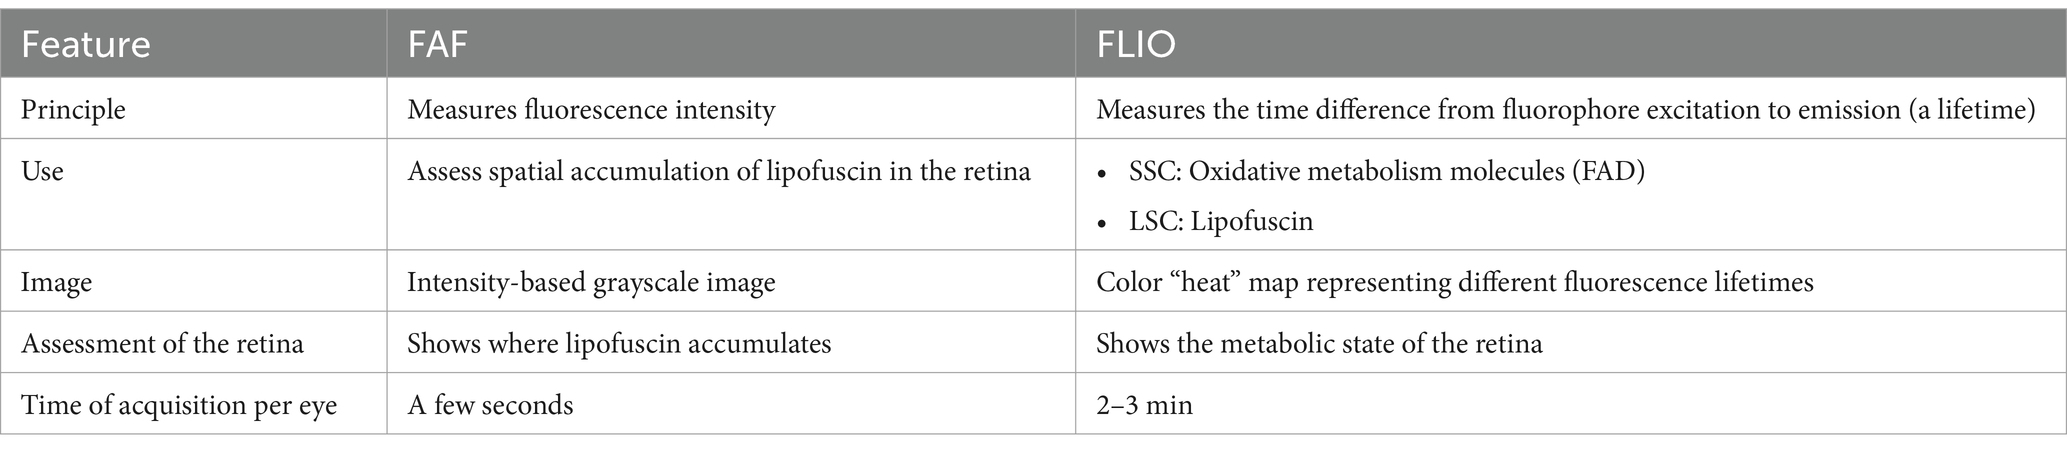
Table 1. Comparison between fundus autofluorescence (FAF) intensity imaging and fluorescence lifetime imaging ophthalmoscopy (FLIO).
The current system of FLIO measures fluorescence decay across two spectral wavelength channels: a short spectral channel (SSC) ranging from 498 to 560 nm, and a long spectral channel (LSC) ranging from 560 to 720 nm. Although it would be beneficial to obtain FLIO images from other wavelength ranges, the current two-channel system may be practical in clinical settings, as diseases can show changes in one or both spectral channels, providing distinct information about the retina. Additionally, the SSC is somewhat influenced by lens fluorescence, whereas the LSC is relatively unaffected (15, 16, 51). Previous studies have suggested that FAD is detectable within the SSC, while lipofuscin contributes predominantly to the LSC (15, 51, 52). However, these attributions may not fully account for the complexity of in vivo fluorescence signals within the retina. Importantly, FAD fluorescence lifetimes are influenced by its role in oxidative metabolism, providing potential insights into mitochondrial activity (21). However, the in vivo fluorescence lifetime may be affected by other endogenous fluorophores or changes in the cellular and subcellular environment that share the same emission spectrum as FAD, highlighting the need for further investigation.
Current FLIO technologies record fluorescence lifetimes using the time domain technique, TCSPC (36, 37). FLIO captures images with a resolution of 256 by 256 pixels, covering a 9 by 9 mm area on the retina (35 μm × 35 μm/pixel), which can be focused on the fovea or any other area of the retina (15, 16). The device compensates for eye movements with a high-contrast confocal infrared reflectance image. This technology ensures that each fluorescence photon is accurately registered at its corresponding spatial location on the retina. A minimum signal threshold of approximately 1,000 photons per pixel is used to achieve good-quality FLIO images with an acquisition time of 2–3 min per eye.
SPCImage (Becker&Hickl GmbH), the most common software for analyzing FLIO data, uses a triexponential approach to fit the fluorescence decay curve at each pixel (15, 20, 53). During data acquisition, thousands of data points are collected for each pixel, representing the decay of fluorescence over time. The triexponential approach simplifies the data collected by fitting it all into three distinct exponential decay components, each with its own lifetime (τ1, τ2, τ3) and corresponding amplitude, which reflects the relative contribution of individual lifetimes to the total fluorescence decay. At least three points are necessary for the mathematical reconstruction of a decay. The final analysis shows an image where each pixel contains three lifetimes and their relative contributions, which can be visualized in color-coded heat maps. Standardized grids such as the Early Treatment Diabetic Retinopathy Study (ETDRS) grid can segment the images to analyze specific regions (16, 51). FLIO can detect the shortest lifetimes of approximately 30 ps (49). Currently, FLIO-reader and FLIMX are common software packages that can enhance the analysis, image processing, and identification of lifetimes over specific areas of interest within the eye (15). The FLIO output of a healthy retina using SPCImage analysis is shown in Figure 5. In the healthy retina shown in Figure 5, the SSC and LSC histograms display uniform, single peaks, with the SSC exhibiting shorter lifetimes than the LSC. This pattern suggests a more homogeneous distribution of fluorophores contributing to the signal. In contrast, in the conditions discussed later, the peaks in both the SSC and LSC shift toward longer lifetimes and broaden, suggesting increased heterogeneity in the contributing fluorophores (Figure 6).
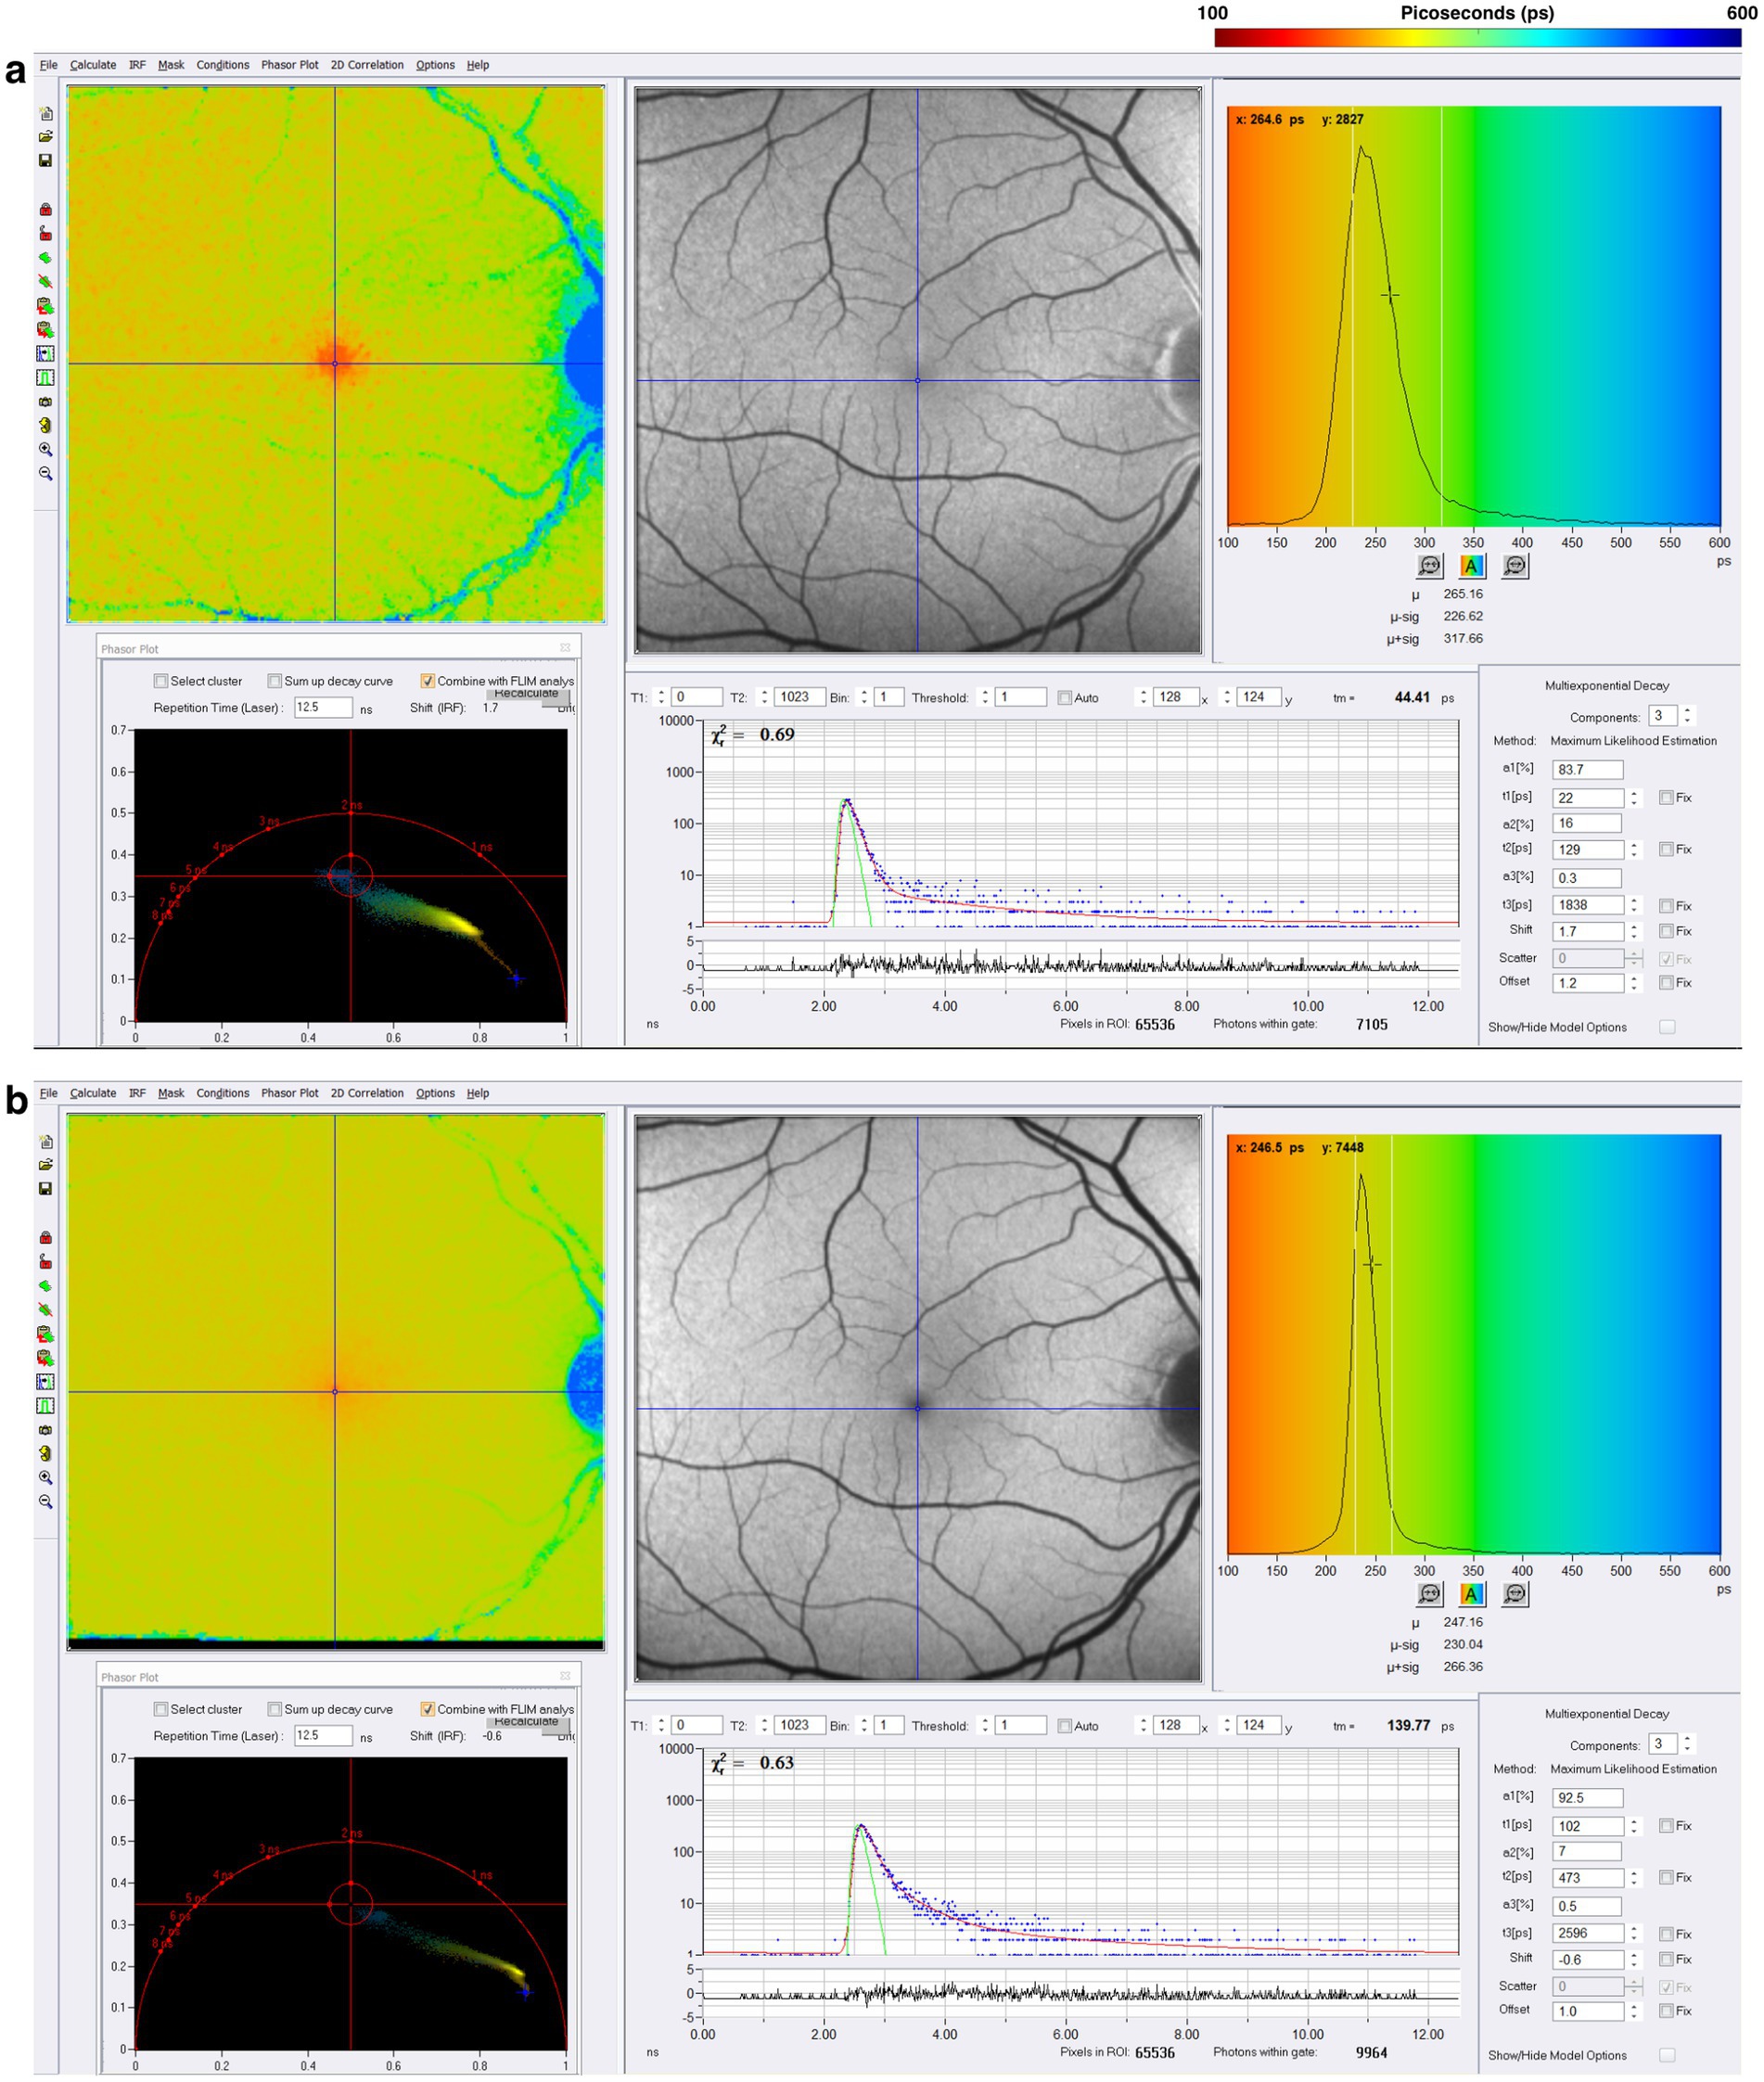
Figure 5. FLIO image of a healthy control after acquisition in the (A) short spectral channel (SSC) and (B) long spectral channel (LSC). The SSC (498–560 nm) detects fluorescence from multiple fluorophores, including FAD, while the LSC (560–720 nm) captures fluorescence from fluorophores such as lipofuscin. These channels provide information about the metabolic status of the retina.
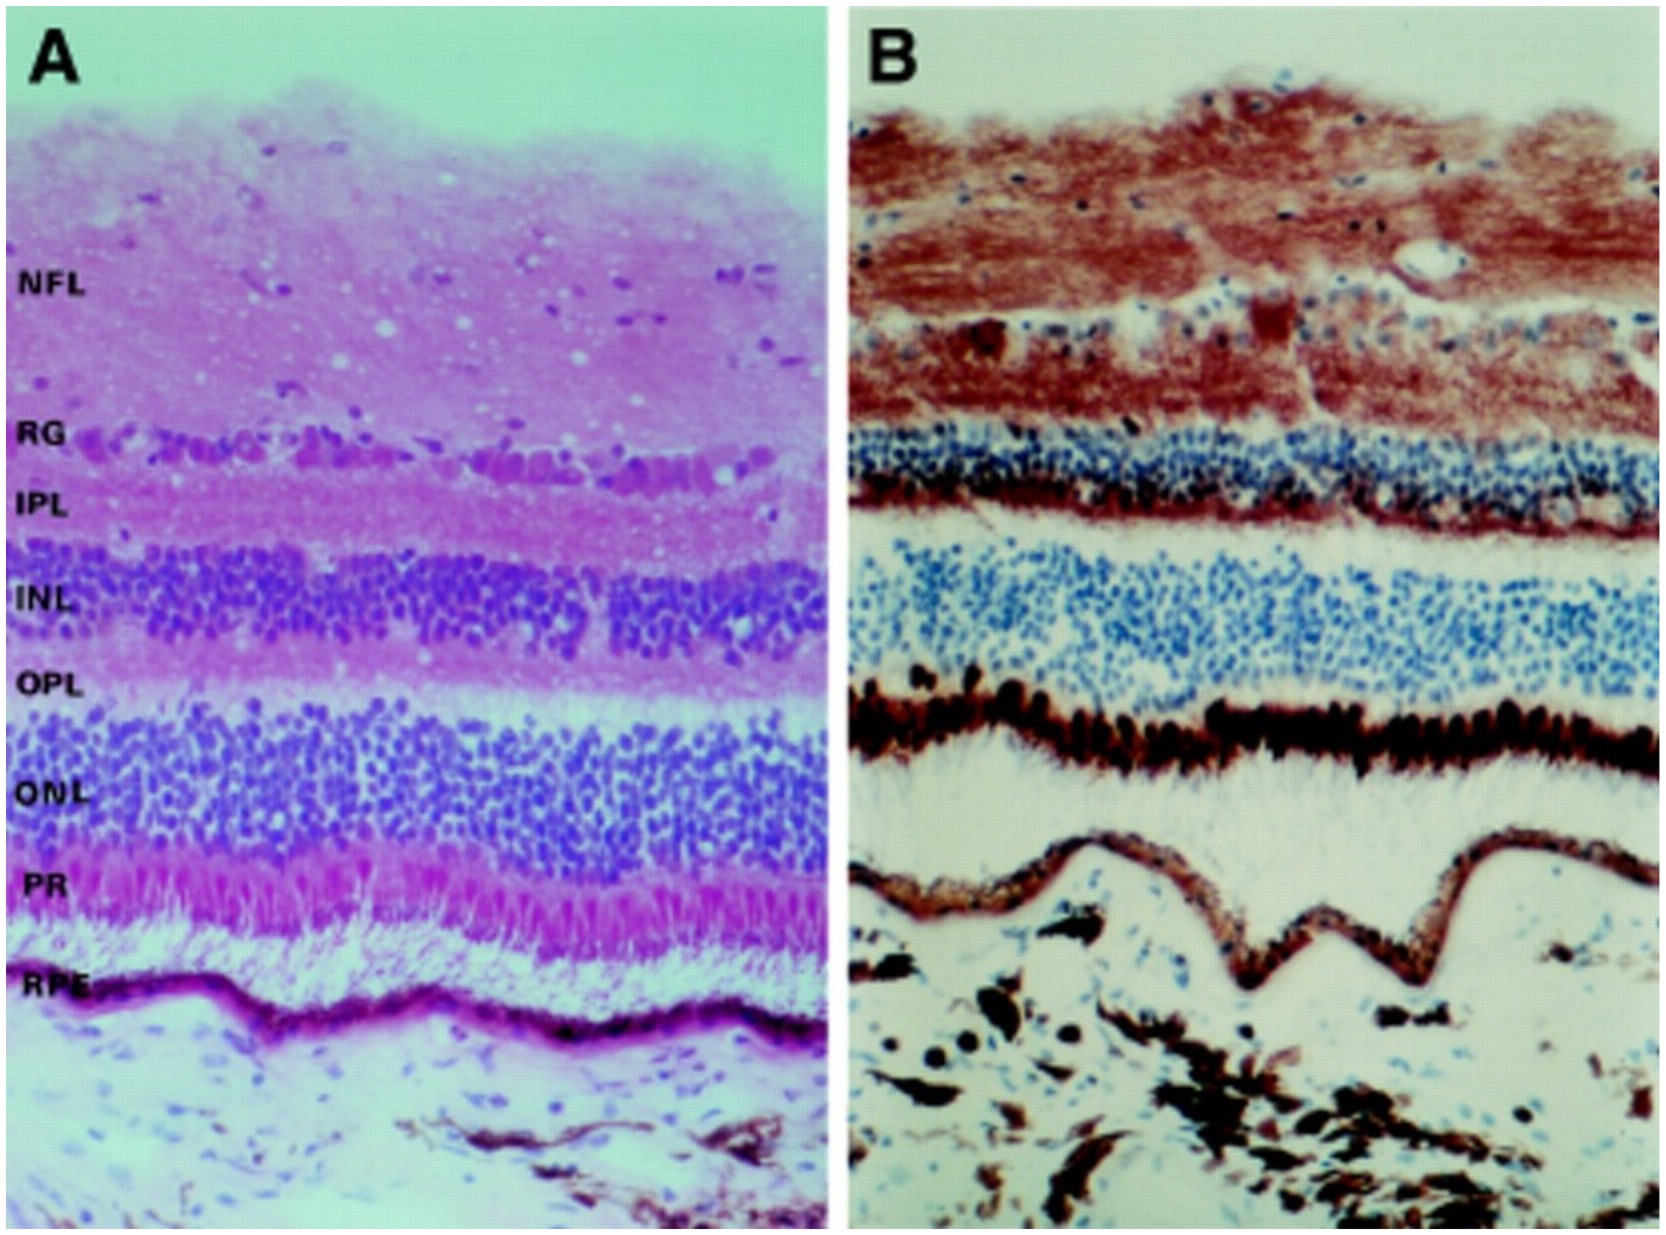
Figure 6. (A) Photomicrographs depicting the different retina layers. (B) Staining for cytochrome C oxidase, showing the distribution of mitochondria throughout the various layers of the retina. NFL, nerve fiber layer; GC, ganglion cells; IPL, inner plexiform layer; INL, inner nuclear layer; OPL, outer plexiform layer; ONL, outer nuclear layer; PR, photoreceptors; RPE, retinal pigment epithelium. Adapted from Andrews et al. (60).
Previous studies have identified multiple retinal fluorophore properties and fluorescence lifetimes in the context of FLIM (15, 17, 20, 24, 38, 49, 54, 55). FLIO captures fluorescence signals from various retinal layers, including the outer retinal layers, retinal pigment epithelium (RPE), and possibly the choroid (50). The following fluorescence lifetime characteristics of different retinal fluorophores are important in understanding the qualitative and quantitative changes in fluorescence that occur in the retina in various disease settings.
Nicotinamide adenine dinucleotide (NADH) and FAD, important electron carriers in mitochondrial respiration, may impact fluorescence lifetimes because their properties change depending on the mitochondrial metabolic activity of a tissue (56–60). A FAD lifetime depends on its bound state versus free state. Protein-bound FAD has a lifetime of approximately 0.1–0.35 ns, while free FAD has a lifetime of approximately 2.3–2.9 ns due to structural differences in protein-bound and free forms (17, 61–63). A decrease in oxidative metabolism results in a shift toward the free form and so increases the FAD lifetime. FAD fluorescence lifetimes may provide insight into the redox state of the tissue. The emission spectrum of FAD overlaps with the wavelength range of the SSC of FLIO (15, 16).
Lipofuscin fluorescence has been characterized in previous studies and is believed to significantly contribute to retinal autofluorescence due to its brightness (43, 50). In the eye, lipofuscin is mainly found within the RPE and is a product of photoreceptor outer segment degradation (64). Lipofuscin accumulates with age; therefore, it is prevalent in higher amounts in older individuals (53, 65). The main component of lipofuscin, bis-retinoid N-retinyl-N-retinylidene ethanolamine (A2E), has an excitation maximum at 446 nm, an emission maximum at 600 nm, and a mean autofluorescence lifetime of approximately 189 ps (15, 18). Lipofuscin emission is effectively detected by the LSC of FLIO (15, 16). However, multiple overlapping fluorophores may contribute to the fluorescence lifetimes observed in the LSC, and further studies are needed to confirm the specific contributions of lipofuscin and other compounds within the LSC.
Carotenoids, such as lutein, zeaxanthin, and meso-zeaxanthin, comprise the macular pigment (MP) (66, 67). These pigments are found in higher concentrations within the Müller cells and Henle fiber layer of the retina (68, 69). Accumulation of MP within a circular area centered around the fovea is attributed to xanthophyll-binding proteins (70–76). The high amounts of MP serve as antioxidants and help protect the macula from damage, especially in the blue-light range (70, 77, 78). It has been proposed that MP acts to quench free radicals and absorb blue light before it can reach photoreceptors, helping to preserve photoreceptors (69, 79–81). Recent studies using FLIO have demonstrated that the retinal carotenoids of the MP produce a detectable fluorescent signal (49, 51, 70). Unlike FAF intensity imaging, FLIO measures the fluorescence lifetime rather than the intensity of fluorescence. As a result, even carotenoids with weaker fluorescence intensity can still produce a measurable fluorescence lifetime signal.
For comprehensive and in-depth studies of retinal conditions, such as AMD, geographic atrophy, diabetic retinopathy, central serous chorioretinopathy, choroideremia, retinitis pigmentosa, macular holes, and other ophthalmic conditions previously investigated with FLIO, we refer the readers to recent literature (55, 82–97). This review assessed the eyes of healthy individuals in different age groups and selected eye-specific diseases, including macular telangiectasia, Stargardt disease, neuromyelitis optica spectrum disorder, and common neurodegenerative diseases, such as Alzheimer’s disease and Parkinson’s disease.
In several studies, Schweitzer et al. evaluated the fluorescence lifetimes in healthy eyes (20, 21, 24). Their first device used an excitation laser of 446 nm and collected fluorescence lifetime information of a 25-year-old healthy adult in two spectral channels: 510–560 nm and 560–700 nm. Their study showed short fluorescence lifetimes at the macula (150 ps) and longest lifetimes near the optic disc (250 ps) (20). A study by Dysli et al. in healthy eyes later identified a similar pattern of fluorescence lifetimes, showing the shortest mean fluorescence lifetimes at the macula (SSC: 208 ps; LSC: 239 ps), with increased lifetimes further away from the center of the retina (53). Their study investigated a group of patients with a mean age of 35 years. Fluorescence lifetimes were obtained within the ETDRS grid. The longest lifetimes were found at the optic disc, consistent with a previous study by Schweitzer et al. Sauer et al. investigated the fluorescence lifetimes of patients with an average age of 24 years, identifying the shortest lifetimes occurring at the fovea (SSC: 82 ps; LSC: 126 ps) (49). The differences in values of fluorescence lifetimes can be attributed to using a biexponential approach in the study by Dysli et al. and a triexponential approach by Sauer et al. (49, 53). In these studies, lifetimes appear to prolong with age in both the SSC and LSC, but especially within the LSC; this pattern is consistent with the accumulation of lipofuscin with age, which prolongs lifetimes recorded in the LSC, where lipofuscin is primarily detectable (20, 49, 53).
Across previously described studies assessing the fluorescence lifetimes of healthy eyes, the shortest lifetimes appear to be at the foveal and macular regions, with the longest lifetimes appearing at the optic disc. Figure 7 displays the lifetime patterns seen in healthy eyes. Studies have suggested that the long lifetimes detected by FLIO within the LSC at the optic disc are primarily due to the higher concentration of connective tissue, such as collagen and elastin, within the optic disc (20). The shortest lifetimes are located at the fovea and central macula, likely due to the influence of macular pigment (MP) and carotenoids (15, 51). As previously mentioned, in the early 2000s, it was hypothesized that MP did not emit fluorescence but could only absorb it. However, subsequent studies showed that MP can emit fluorescence, with later FLIO studies identifying a correlation between MP and short foveal fluorescence lifetimes (51, 82, 98). The contribution of various retinal molecules correlates to different patterns of fluorescence lifetimes across different areas of the retina. These patterns later helped identify changes in fluorescence lifetimes in different ophthalmic and neurologic diseases.
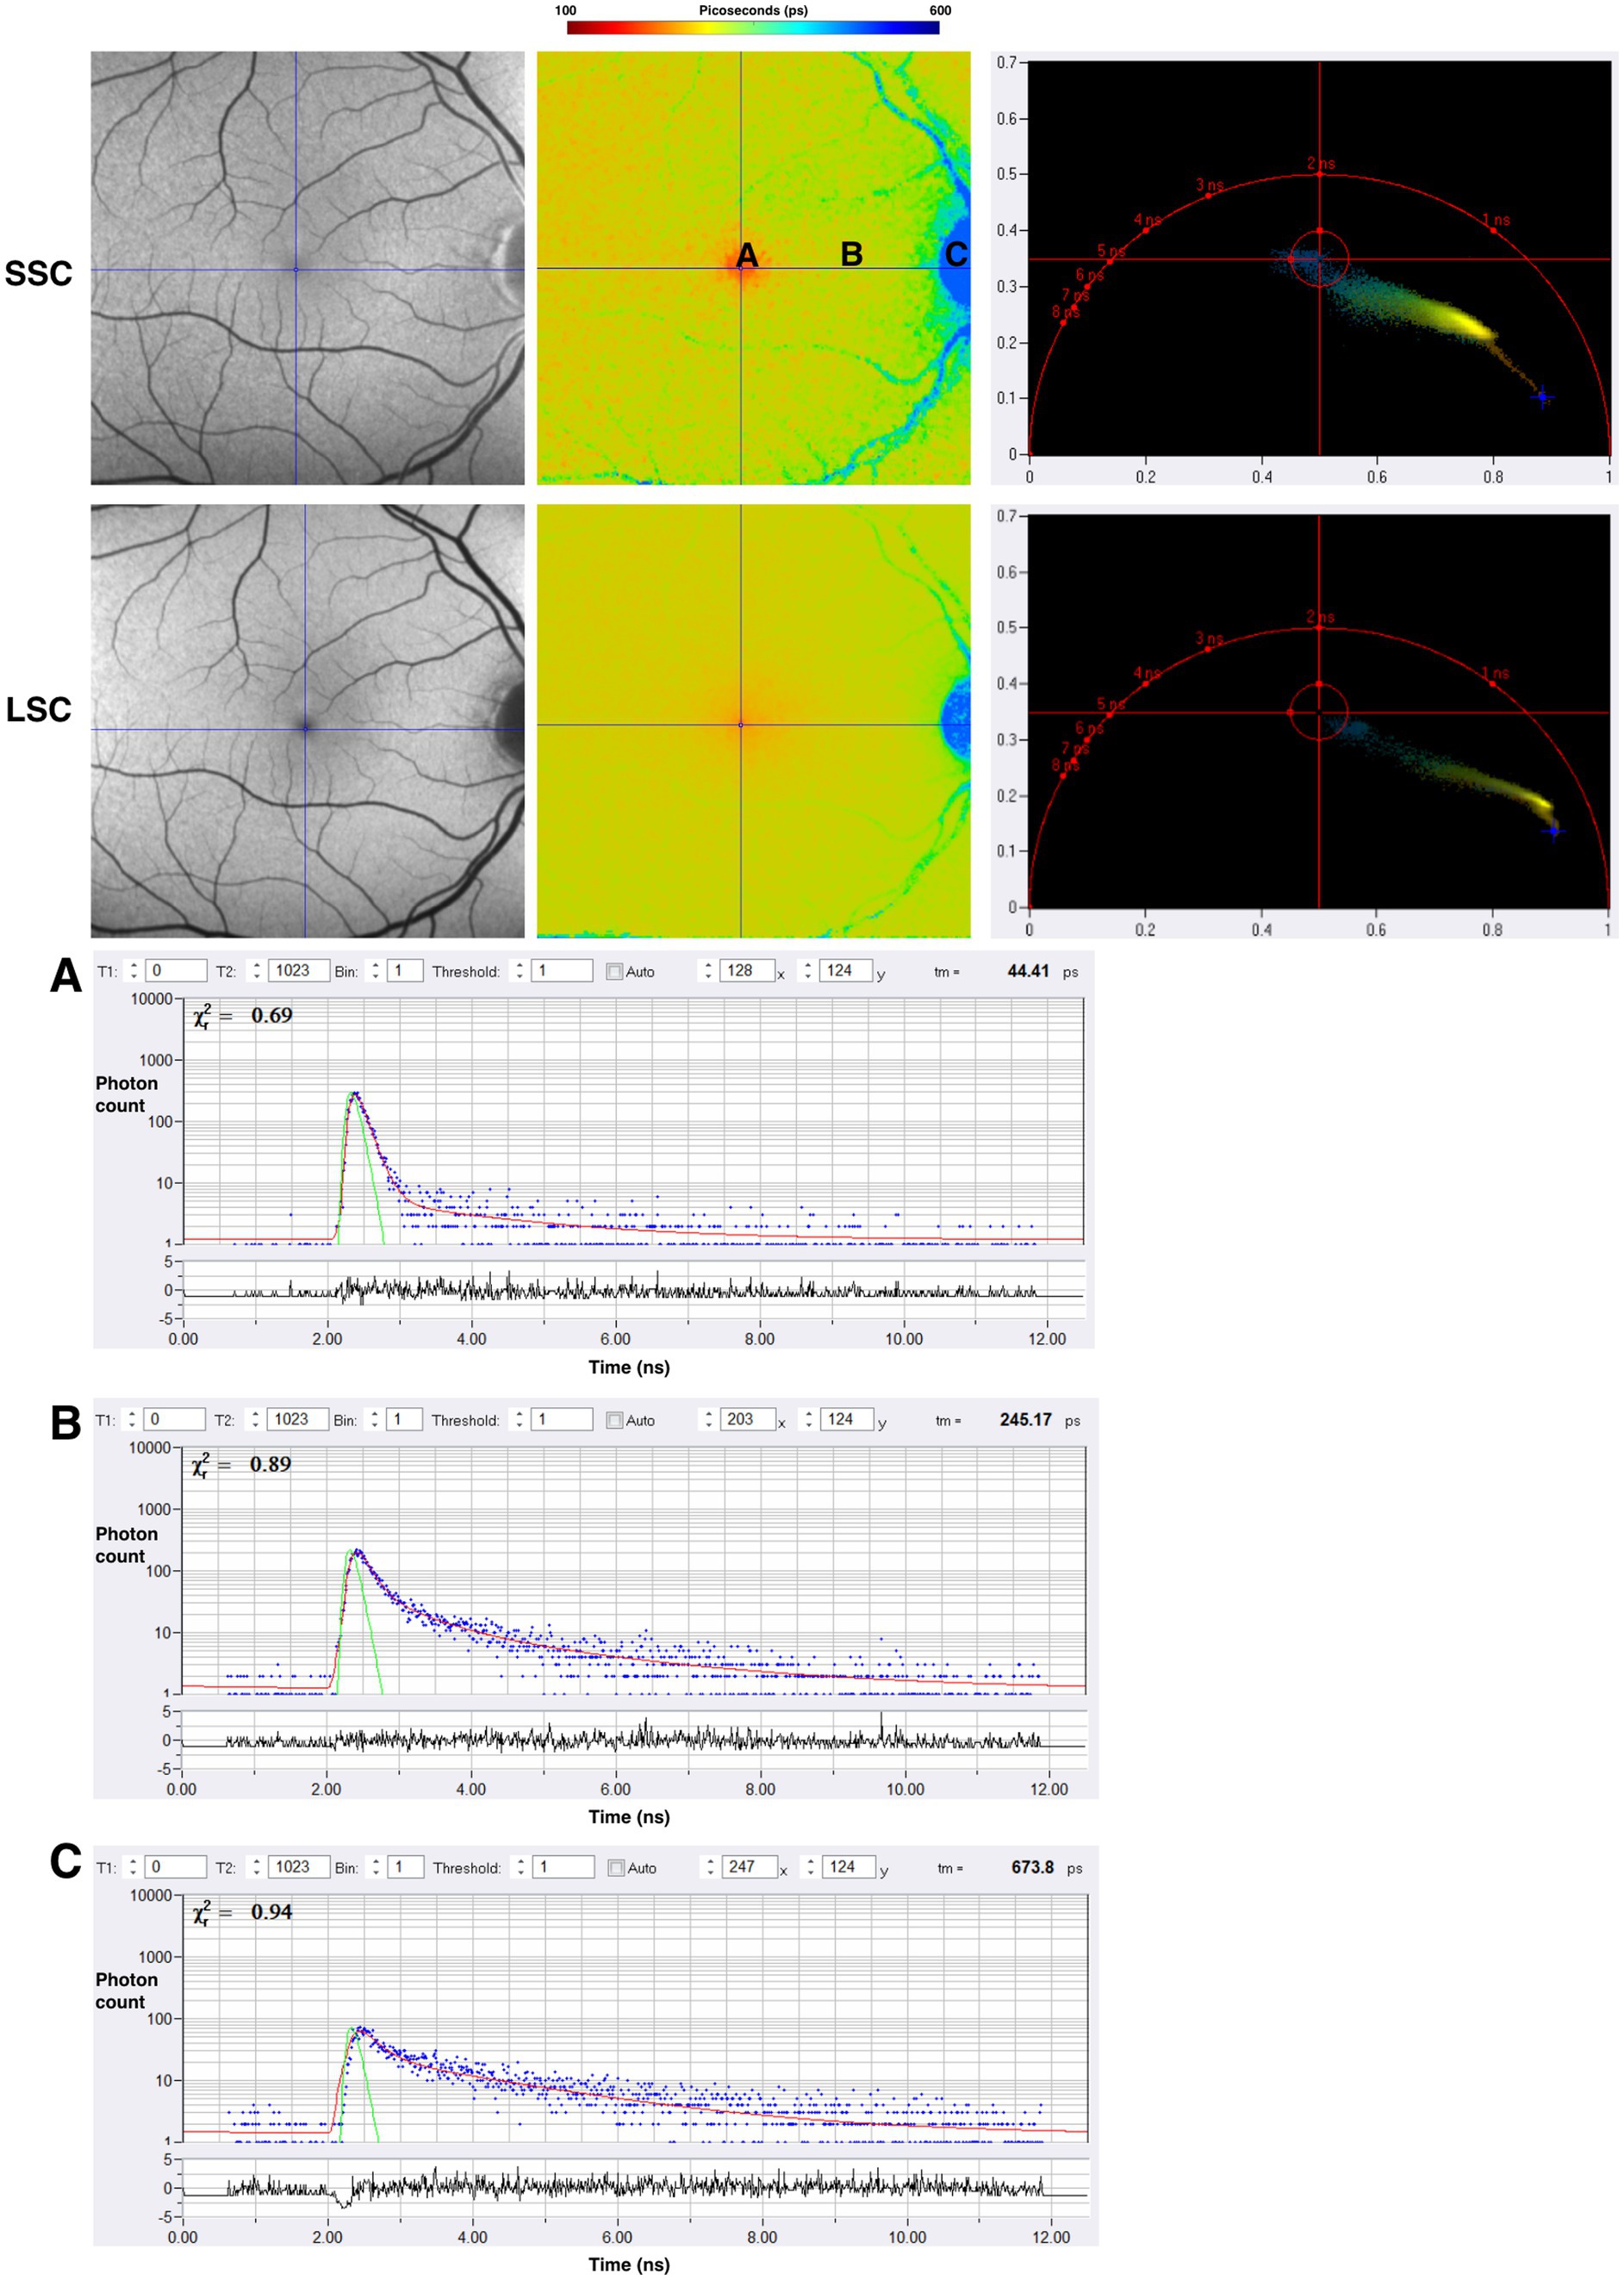
Figure 7. FAF intensity and FLIO images of the healthy eye. Both the SSC (498–560 nm) and LSC (560–720 nm) are shown. (A–C) Are individual pixels with lifetime decay curves shown. Phasor plots for SSC and LSC are shown as well.
Macular Telangiectasia Type 2, an inherited disease, causes bilateral central vision loss, usually between the fourth and sixth decades of life (16, 99). While classically presenting later in life, some case reports have reported patients being diagnosed in their 20s (100). MacTel is primarily a retinal degenerative disease affecting the Müller Cells with secondary vascular changes. Visual loss progresses slowly, with patients frequently reporting problems with reading and experiencing diminished visual acuity (101). Structurally, MacTel has been described as degeneration of the ellipsoid zone (EZ) starting in the temporal parafoveal area (101). Around the fovea, a characteristic pattern is seen in MacTel with FLIO. This pattern is an oval-shaped area, 9 degrees horizontal and 5 degrees vertical, centered at the fovea (100, 101). This area with FLIO shows a ring or crescent shape of prolonged lifetimes (100). In one study investigating the use of FLIO in MacTel, researchers found prolonged lifetimes of the inner temporal area on the ETDRS grid in MacTel patients (SSC: 382 ps) when compared to control, healthy eyes (SSC: 298 ps) (100).
In another study, FLIO was used to investigate early changes in retinal disease in the children of MacTel patients (102). This study found the characteristic temporal parafoveal prolonged lifetimes within the SSC in MacTel patients and in over one-third of unaffected children of these MacTel patients (102). As MacTel is a progressive disease, studies have investigated the speed of progression of the disease as it correlates to FLIO lifetimes. One study found a 22% prolongation of SSC lifetimes over 2.1 years in a group of four patients with MacTel (103). Another study identified 33 patients with MacTel and found an annual progression of 9 ps in the SSC and 8 ps in the LSC lifetimes, compared to controls (101). A more recent study identifying 49 eyes with MacTel confirmed the unique temporal crescent pattern of prolonged fluorescence lifetimes around the fovea, especially in the SSC, while other retinal diseases tend to prolong lifetimes in the LSC (104). In one study investigating cases of MacTel, FLIO demonstrated a sensitivity of 96% and a specificity of 100% (105). The findings from studies investigating MacTel reiterate the benefit of FLIO as an accurate diagnostic tool and a potential screening tool in early disease detection before patients experience visual changes. Early detection may aid in the advancement of future therapies and gene investigation.
Stargardt disease, an inherited retinal dystrophy, usually presents in childhood with bilateral severe vision loss (106–108). Mutations in the ABCA4 gene, which codes for an ATP-binding cassette protein that aids in transporting N-retinylidene-phosphatidylethanolamine from the photoreceptor disk lumen to the cytoplasm, form the genetic basis for this disease (108). Visual cycle molecules such as bis-retinoids and lipofuscin accumulate in this disease (109–111). FAF intensity imaging shows increased signal even in areas with seemingly normal functioning photoreceptors (111). The increase in FAF intensity is attributed to the accumulation of lipofuscin in the RPE rather than direct dysfunction of the photoreceptors themselves (110–113). As the disease progresses, yellow spots appear on the retina, termed retinal “flecks” (113). Retinal flecks are thought to be areas of retinal degeneration (113). In the study of 16 patients with Stargardt disease, Dysli et al. found that the retinal flecks showed both short and prolonged FLIO lifetimes depending on the age of the flecks (112). Retinal flecks with short (242 ps) lifetimes in the LSC were believed to be new onset flecks attributed to compounds of degenerating photoreceptors, while flecks with long (474 ps) lifetimes were presumed to be flecks present for longer periods, influenced by lipofuscin and A2E (112). Throughout the disease, there is a gradual progression from short to long FLIO lifetimes in the LSC (113). In Stargardt disease, FLIO shows potential in monitoring disease progression and may eventually track treatment responses. A representative example of a patient with Stargardt disease is shown in Figure 8.
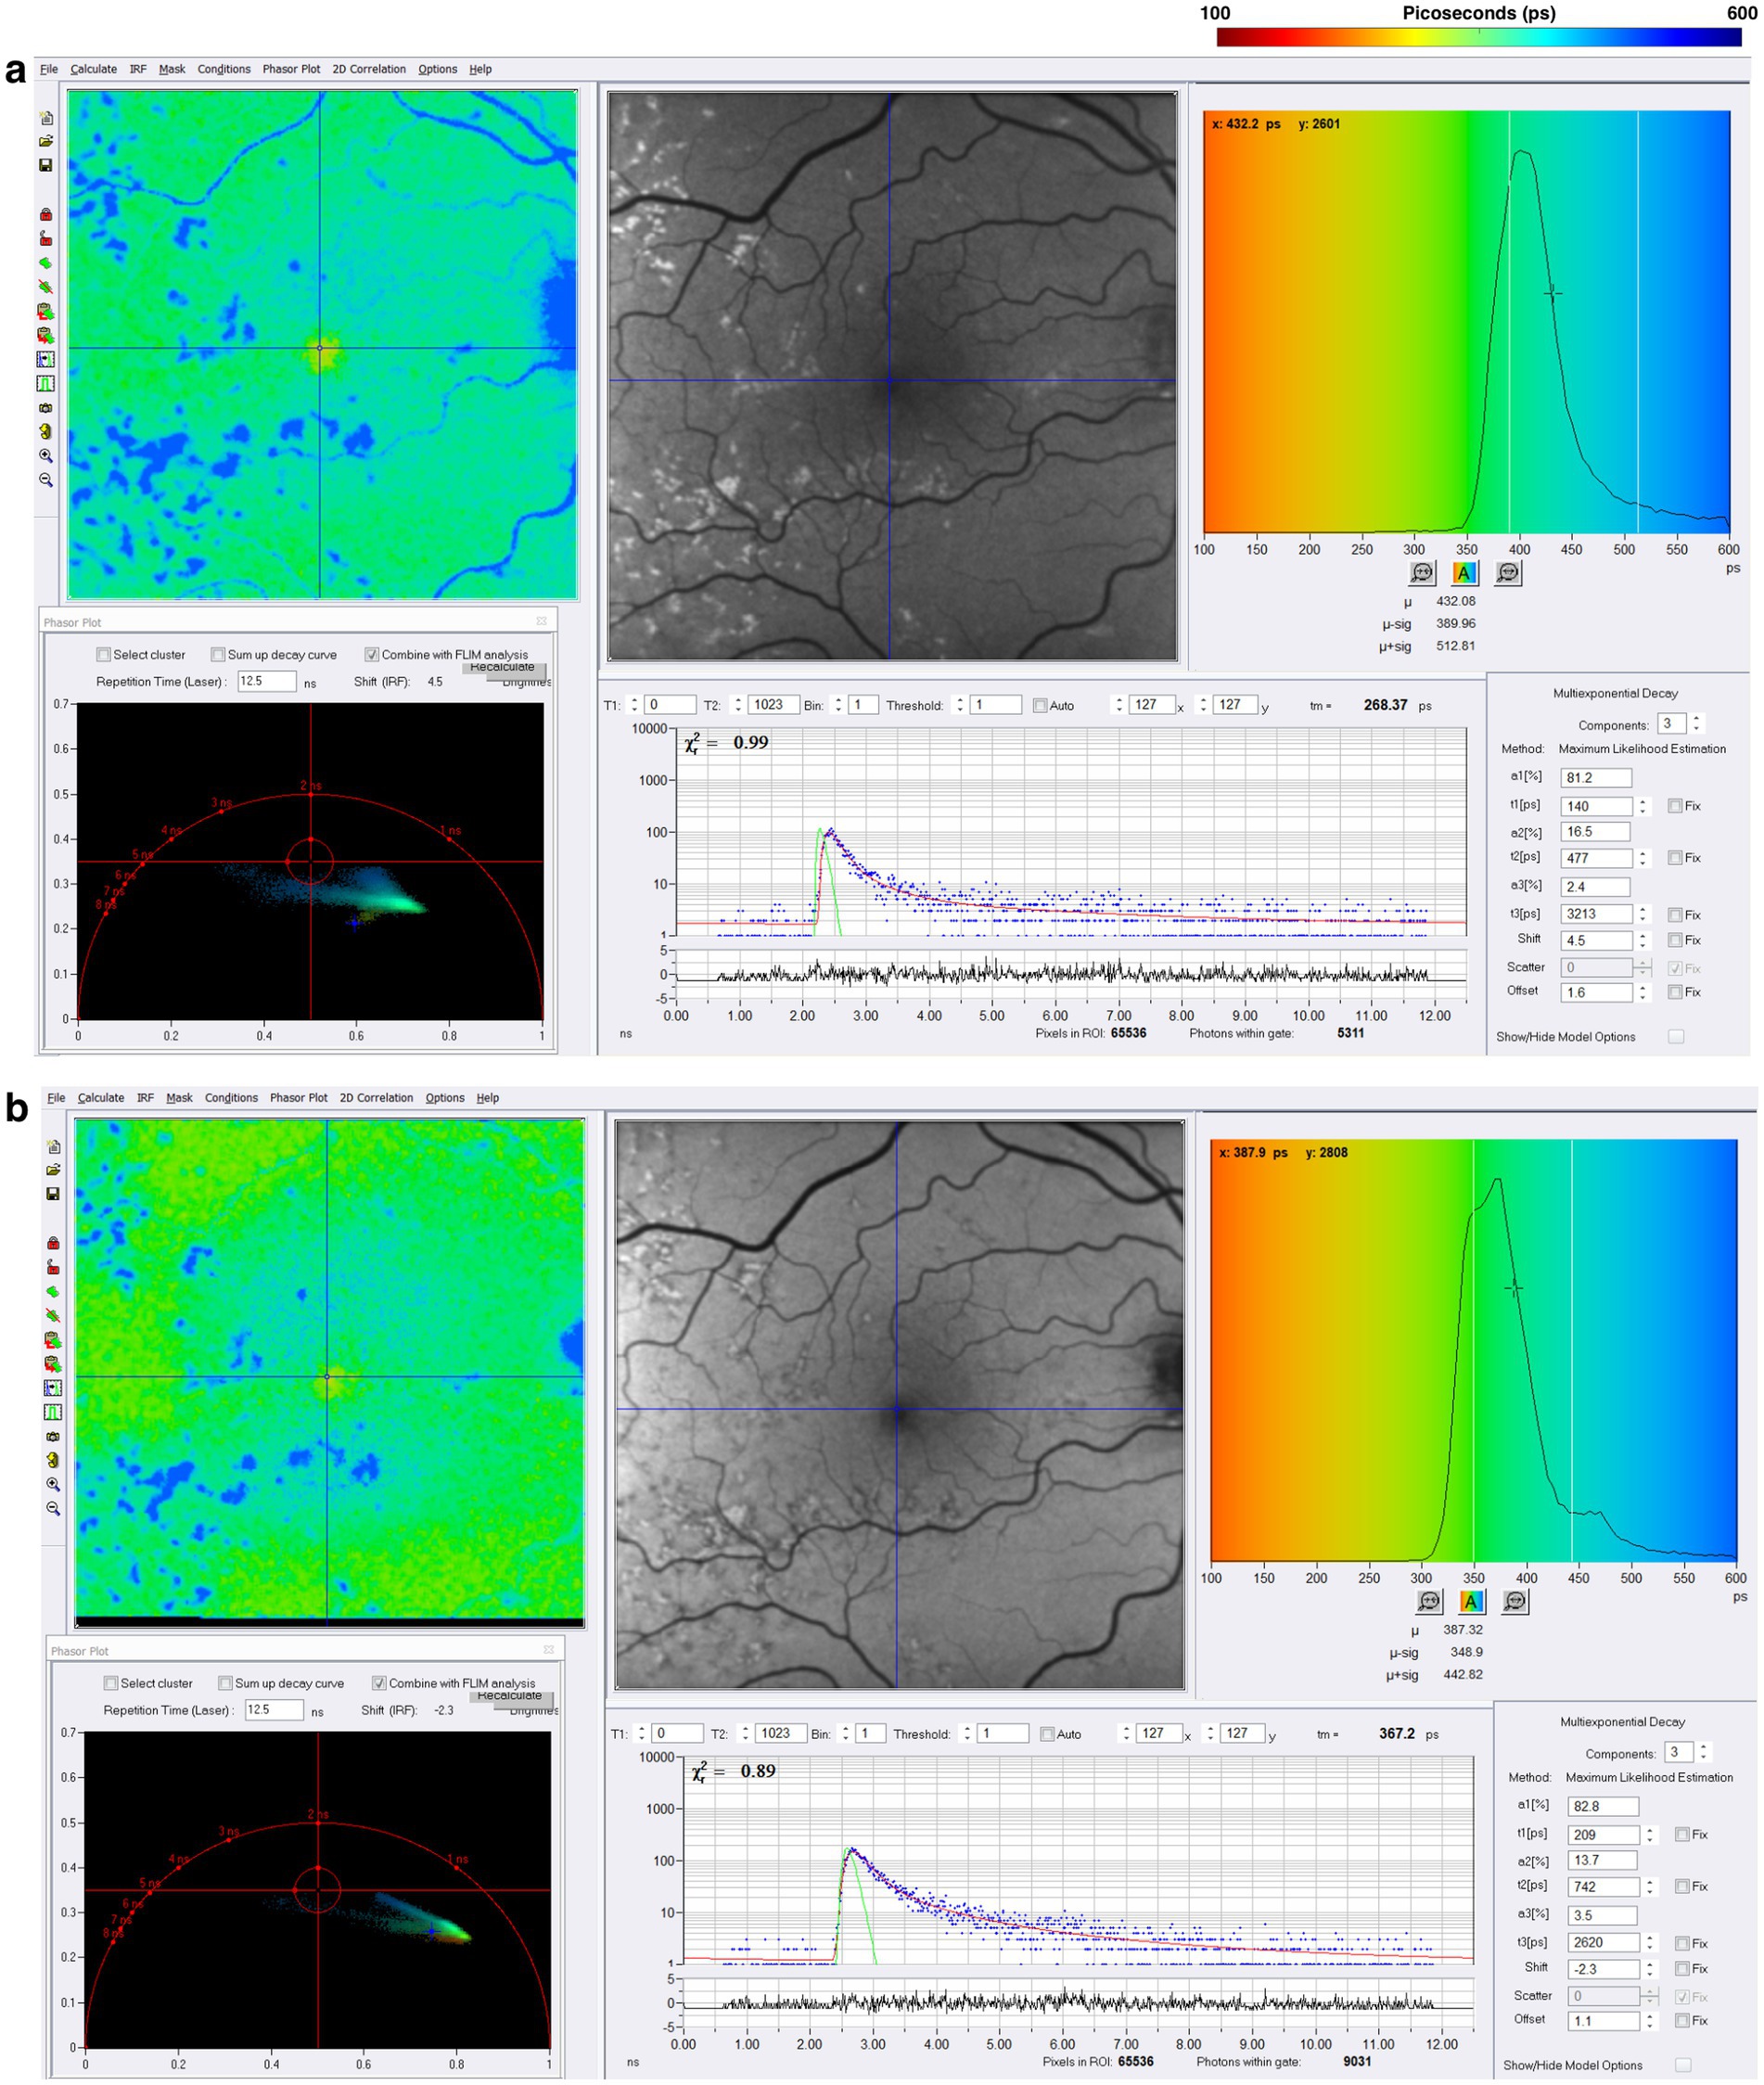
Figure 8. FLIO images from a patient with a long history of Stargardt disease with corresponding phasor plots. Images of both (A) SSC and (B) LSC are shown. The FLIO images show blue “flecks” that have been present for a longer period (113). Yellow “flecks” are not presented here as they are present in the acute phase of Stargardt disease (113).
The rationale to study FLIO in AD evolved from the importance of vision changes and the retina’s role as an extension of the central nervous system, as intriguing OCT and FAF data have shown retinal degeneration and retinal nerve fiber layer thinning (114–117). Jentsch et al. investigated the use of FLIO in 16 patients with AD finding FLIO parameters of amplitudes (α) and relative contributions (Q) within the LSC correlated significantly with the mini-mental status exam score (Q2, R = −0.757, p = 0.007; α2, R = −0.618, p = 0.043), as well as p-tau-181 concentration in CSF (Q2, R = 0.919, p = 0.009; α2, R = 0.881, p = 0.020) (118). While FLIO lifetimes were not necessarily prolonged, the changes identified in this study suggest a potential role for FLIO as a valuable tool in the early diagnosis of AD-associated changes within the retina (118). Another pilot study investigated FLIO in patients with preclinical AD (7 AD, 8 control) (119). In phakic patients, investigators showed that patients with AD, when compared to controls, had significantly prolonged mean fluorescence lifetimes within the SSC (AD: 593.9 ps; control: 475.0 ps; p = 0.036) and LSC (AD: 454.4 ps; control: 394.1 ps; p = 0.024) (119). They also found that amyloid β, tau in CSF, and ganglion cell layer plus inner plexiform layer thickness (as determined by OCT) were correlated with mean fluorescence lifetimes in phakic subjects (r = −0.611–0.562, p < 0.05) (119). A recent study presented at the 2024 Alzheimer’s Association International Conference showed that patients with AD (11 patients) demonstrated prolonged lifetimes in both the SSC and LSC when compared to controls (11 patients) (120). Although these studies had a limited number of patients, the initial findings suggest that FLIO may detect fluorophores linked to mitochondrial metabolic impairments in AD, pending further investigation to accurately identify the source of these signals. Representative examples of patients with AD are shown in Figure 9.
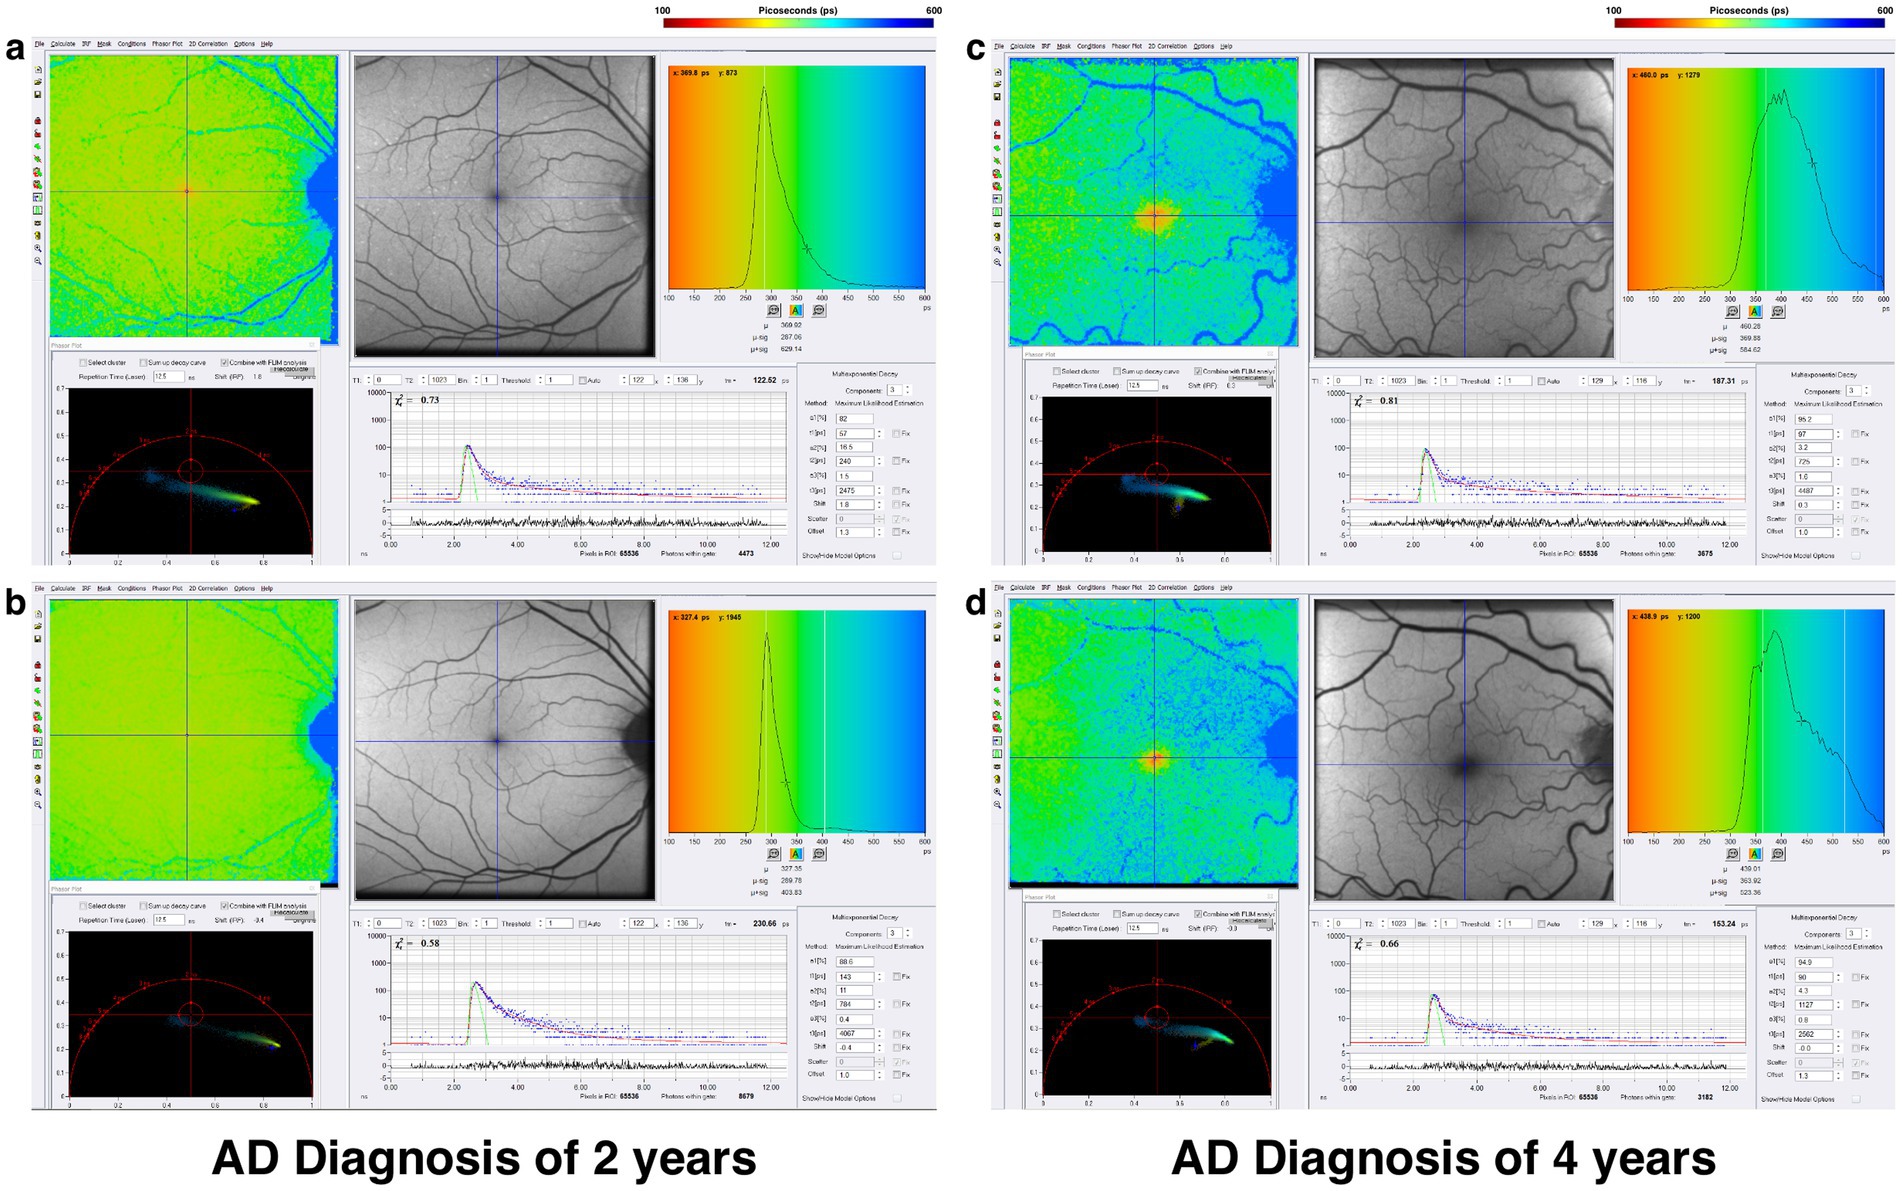
Figure 9. FLIO images and phasor plots of a patient with a 2-year diagnosis of AD showing both the (A) SSC and (B) LSC. Also shown is a patient with a 4-year diagnosis of AD showing both the (C) SSC and (D) LSC.
Parkinson’s disease has many motor and non-motor manifestations, especially in the visual system, including abnormalities in eye movements, visual acuity, color vision, and contrast sensitivity (121–123). Mitochondrial pathogenic factors have also been identified in the initiation and progression of PD. (124–126). Multiple studies investigating OCT in PD have shown retinal nuclear layer thinning, reduced retinal nerve fiber layer, and reduced macular volume (127, 128). While OCT helps to assess structural changes in PD after they have already occurred, understanding early metabolic changes may help identify the disease before the clinical onset of visual changes.
In a pilot study presented at the 2023 International Congress of Parkinson’s Disease and Movement Disorders, Shivok et al. showed nine PD patients experiencing visual disturbances and compared them to nine controls (129). Their data showed that PD patients had prolonged mean fluorescence lifetimes within the SSC in the right eye and both SSC and LSC in the left eye when compared to controls (129). At the 2024 ARVO annual meeting, another study showed that lifetimes were prolonged within the SSC of PD patients (19 patients without apparent retinal disease) when compared to controls (20 patients) (130). At the 2024 International Congress of Parkinson’s Disease and Movement Disorders, investigators showed that 27 PD patients had prolonged mean fluorescence lifetimes in both the SSC and LSC compared to 9 controls (131).
These initial FLIO pilot studies observed prolonged fluorescence lifetimes in PD patients, suggesting complex in vivo metabolic changes in the retina. The longer FLIO lifetimes seen in patients with PD may be influenced by the cumulative impact of neurodegenerative changes, oxidative stress, or other mechanisms. Further studies with FLIO are needed to show that metabolic changes may occur, and these changes may occur before the onset of visual symptoms associated with the disease. A representative example of a patient with PD is shown in Figure 10.
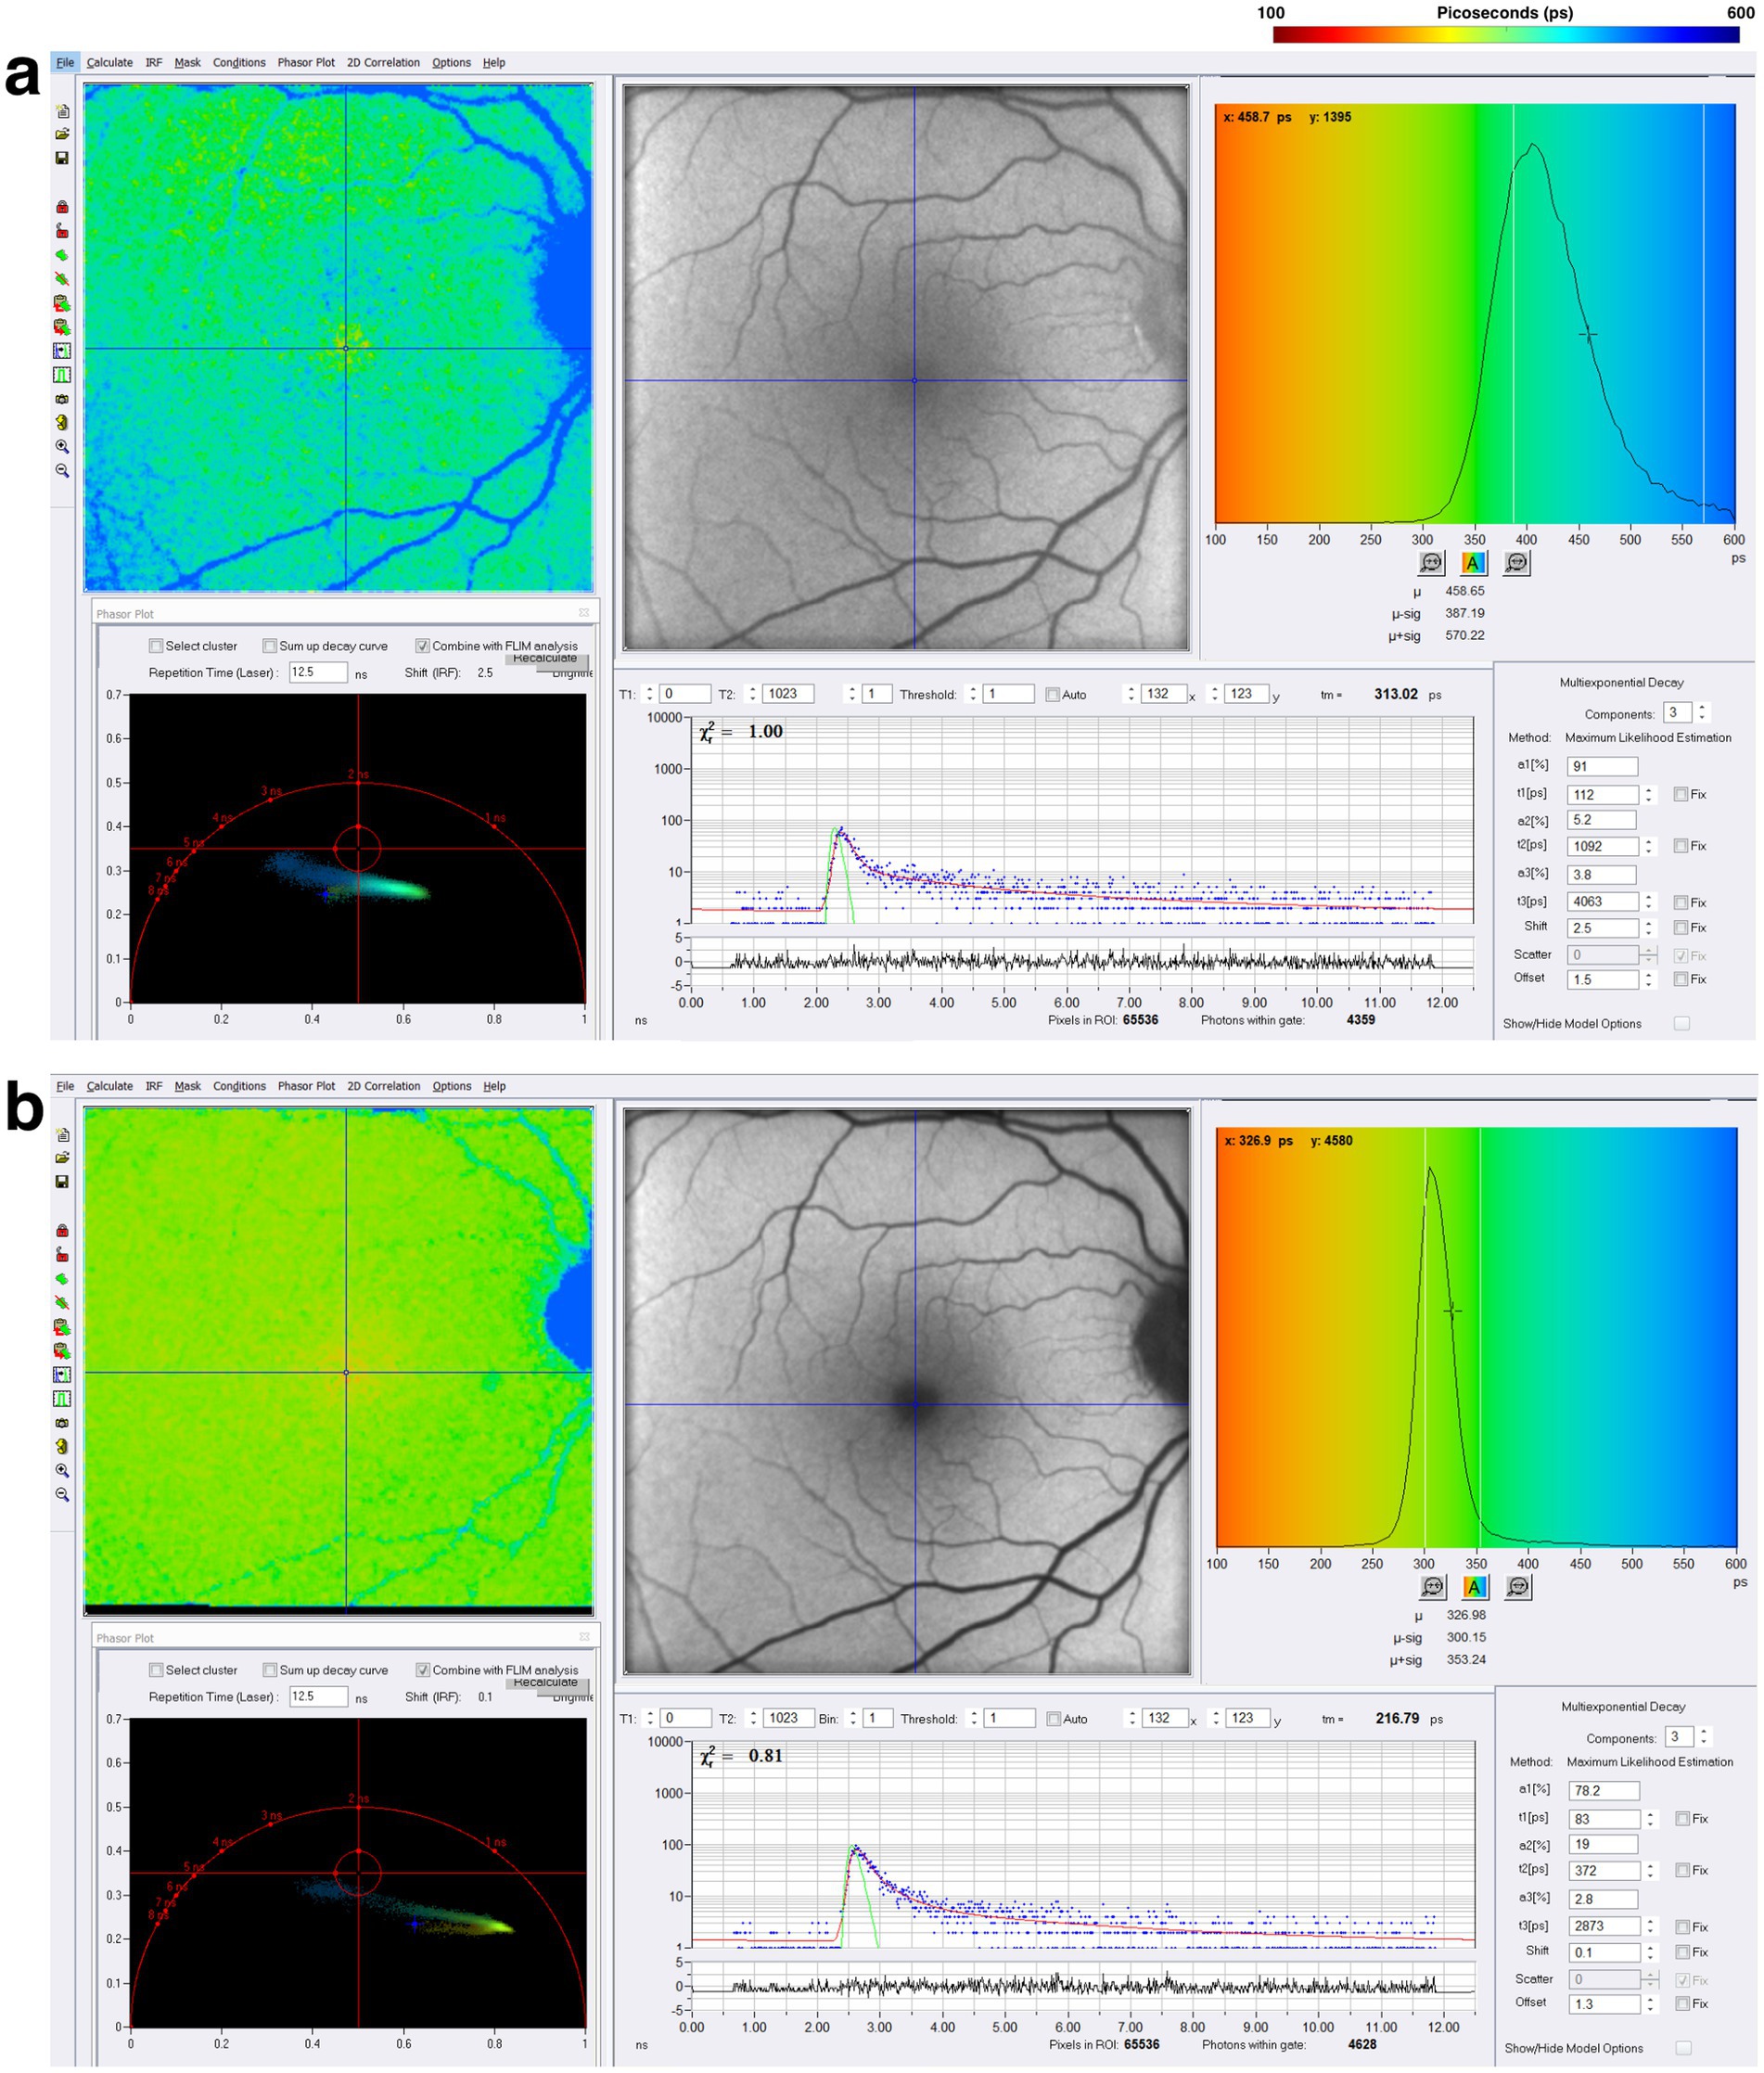
Figure 10. FLIO images and phasor plots of a patient with PD. Both (A) SSC and (B) LSC are shown.
NMOSD, an antibody-mediated inflammatory disease directed against aquaporin 4 (AQP4) water channels, may result in severe vision loss. AQP4 has been shown to co-localize and interact with inwardly rectifying potassium channels within the retina (132). These potassium channels aid in spatial buffering of retinal potassium, a process mediated by retinal astrocytes (Müller cells) (132–134). Müller cells assist in the balance of fluid movement within the retina and span from the inner retina to the inner segments of the photoreceptors. Müller cell footplates have high concentrations of AQP4 channels that co-localize with potassium channels and AQP4 channels scattered on the surface of Müller cells (132). The Müller cell foot processes surround retinal vessels in the superficial and deep vascular layers of the retina (132). In NMOSD, these interactions are disrupted, leading to retinal swelling and edema, potentially resulting in permanent visual loss (135). These structural retinal changes have traditionally been visualized with OCT, but FLIO provides insight into the metabolic changes occurring within the retina in patients with NMOSD.
Recent studies have suggested that mitochondrial dysfunction contributes to the pathophysiology of NMOSD (136, 137). Mitochondrial dysfunction has been implicated in motor and cognitive symptoms of NMOSD (136). In an animal model of NMOSD, researchers showed that etomoxir, a drug that interferes with mitochondrial fatty acid oxidation, can modulate mitochondrial function and ameliorate astrocyte pathology associated with NMOSD (137). While astrocytes with mitochondrial dysfunction can still survive, they lose their neuroprotective functions, a crucial factor in NMOSD (137). Their study suggests that mitochondrial dysfunction in astrocytes and retinal Müller cells may exacerbate retinal swelling and visual damage from disruptions in metabolic activity and oxidative stress.
In a pilot study, Cappellani et al. investigated FLIO in nine patients (18 eyes) with NMOSD and compared them with 12 controls (24 eyes) (138). The study found significantly prolonged mean FLIO lifetimes (τm) in the SSC in patients with NMOSD compared to controls (NMOSD: 181.71 ps, controls: 118.46 ps, p = 0.004) (138). OCT showed significant differences in retinal nerve fiber layer (RNFL) thickness average (NMOSD: 80.5 μm, controls: 96.2 μm, p = 0.046), ganglion cell layer (GCL) volume (NMOSD: 0.86 mm3, controls: 1.07 mm3, p = 0.0009), and GCL thickness at the 3 mm nasal area (NMOSD: 37.1 μm, controls: 53.2 μm, p = 0.000245) (138). The pilot study suggested that both structural and functional changes are seen in NMOSD, with functional changes detected by FLIO and structural changes seen on OCT, specifically in the GCL. Given that the GCL is an area highly concentrated in AQP4 channels at the retinal capillary-Müller cell junction, supplied from the central retinal artery, these findings suggest that central retinal artery ischemic changes to Müller cells contribute to metabolic dysfunction and permanent visual loss in NMOSD (138). A representative example of NMOSD is shown in Figure 11.
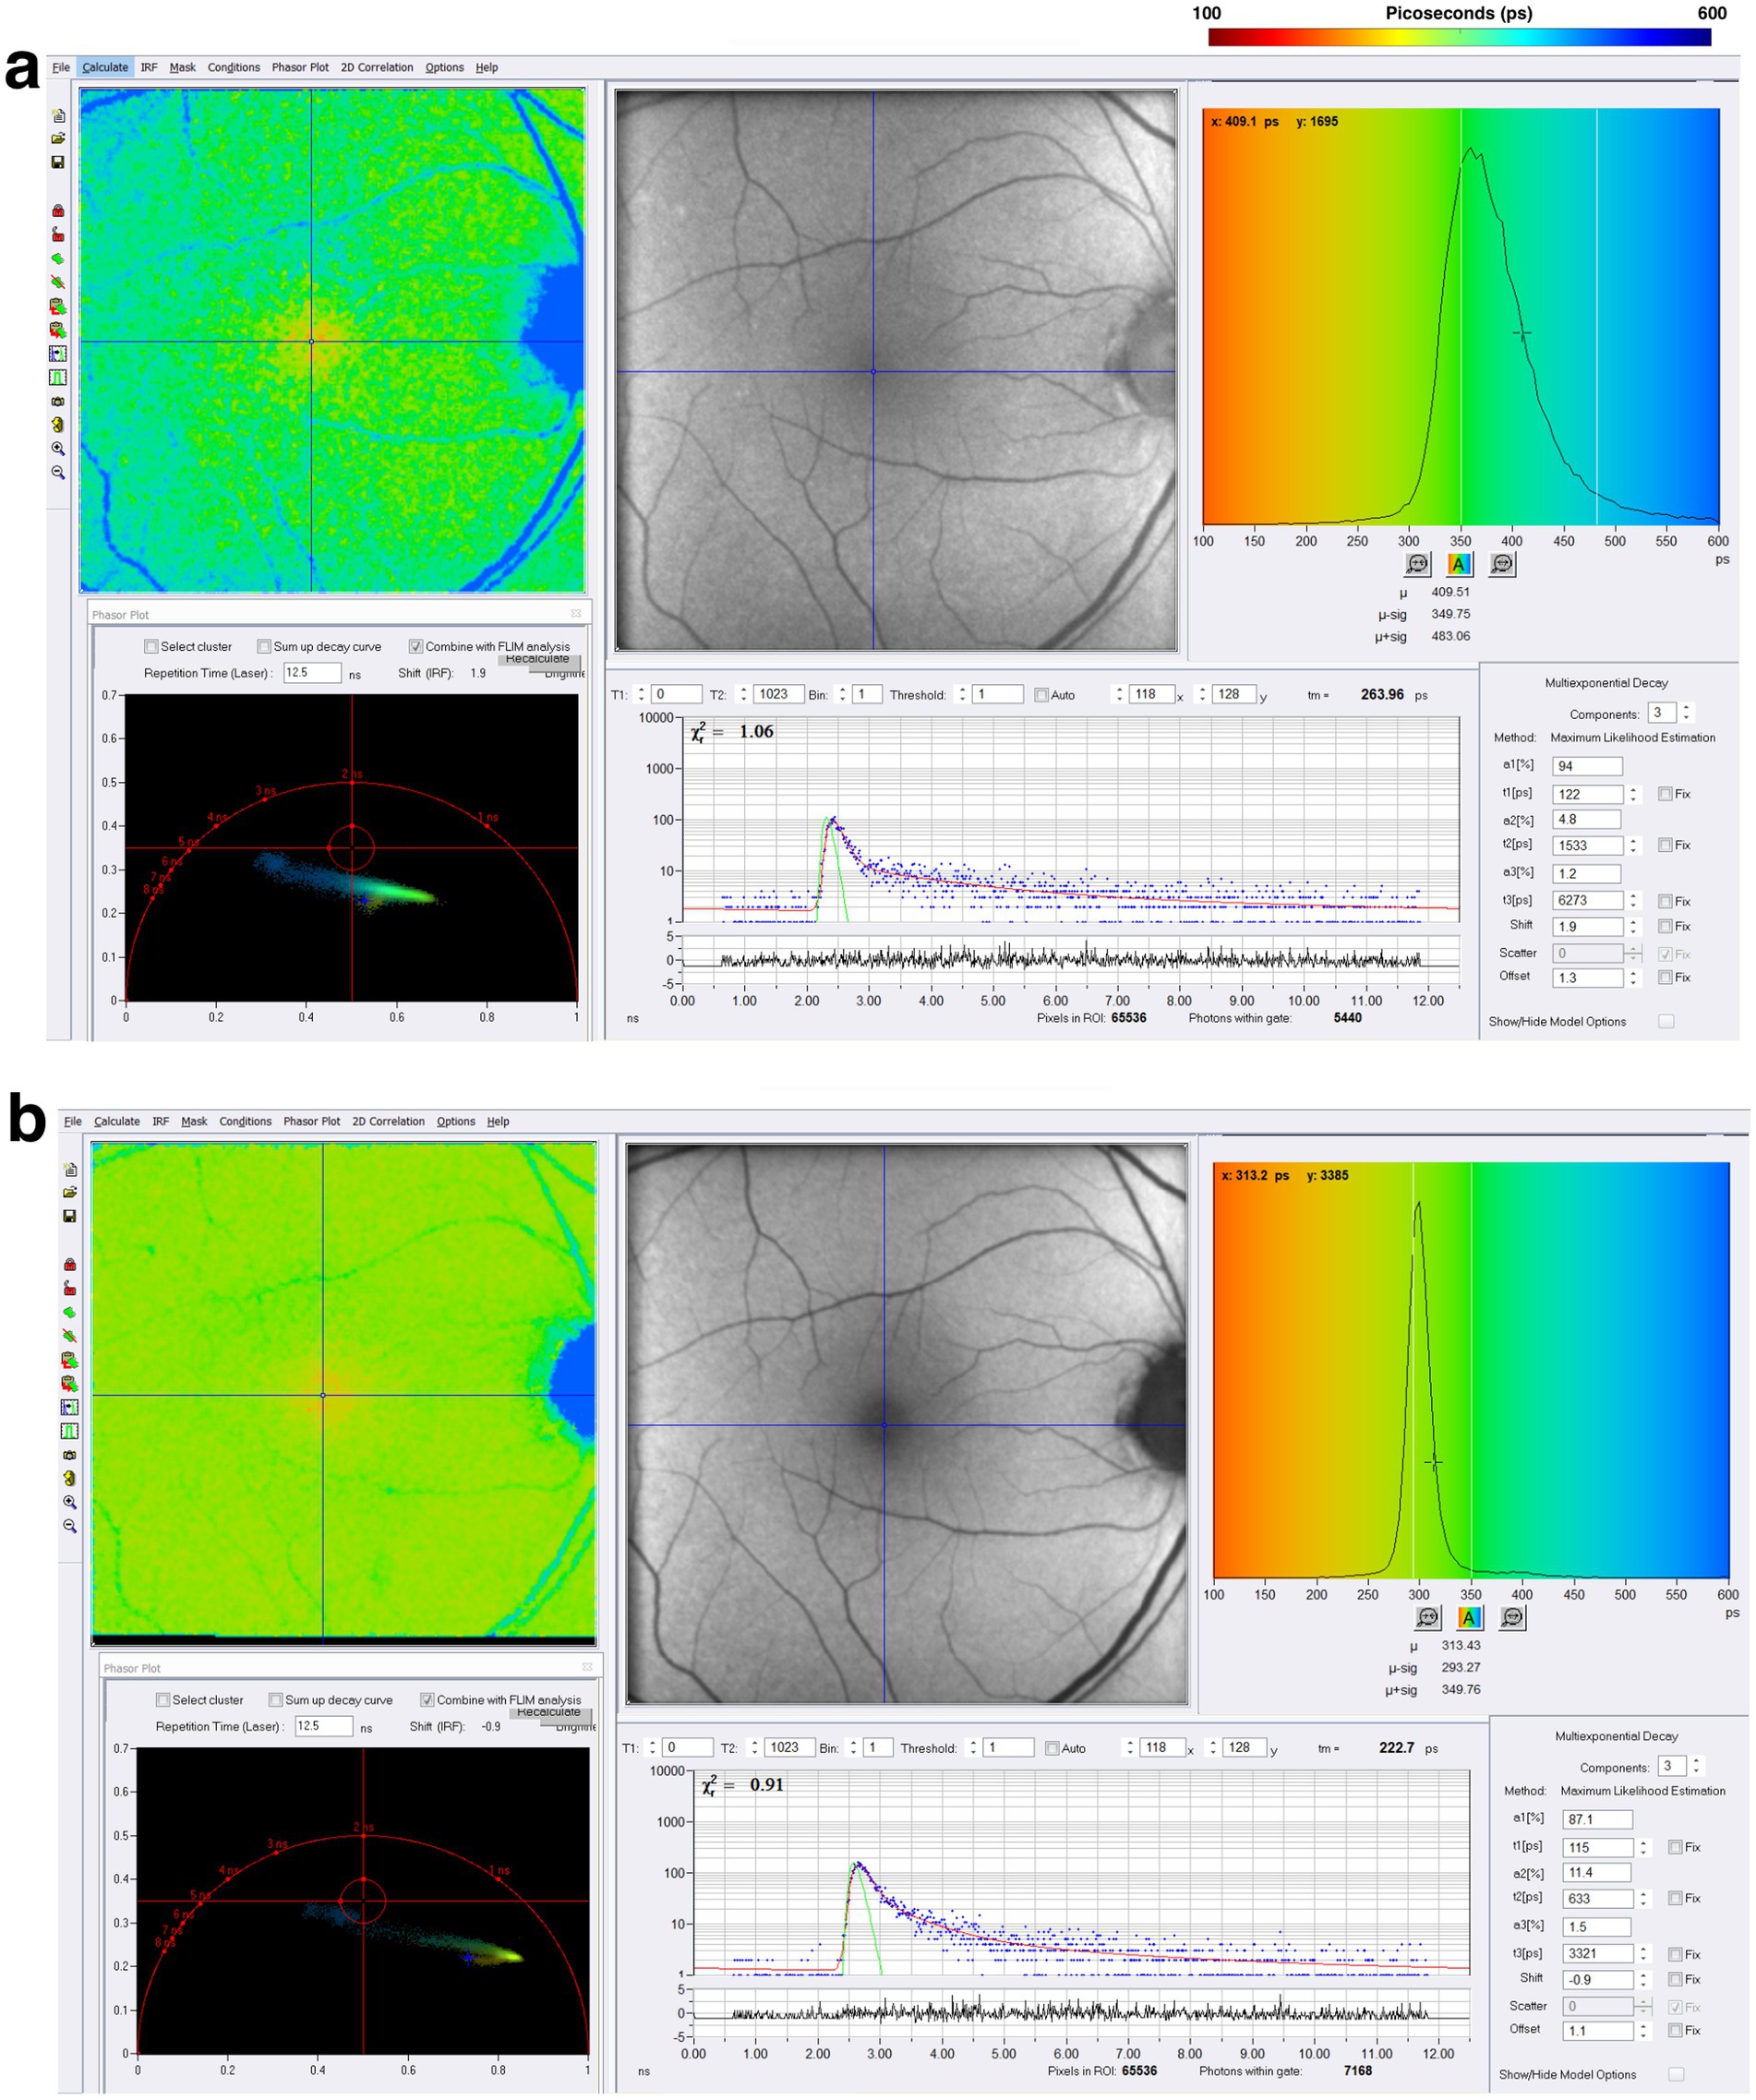
Figure 11. FLIO images and phasor plots of a patient with NMOSD. Both (A) SSC and (B) LSC are shown.
1. FLIO provides a unique, non-invasive method with the potential to monitor fluorescence signals linked to the metabolic state of the retina and to reveal their alterations in various ophthalmic and neurologic conditions. Acquiring data with FLIO is fast and may be effective in a clinical setting.
2. Deciphering FLIO data with phasor plots in the clinical setting may allow for the rapid and more specific interpretation of data, aiding in the diagnosis and assessment of disease. Correlating FLIO findings with OCT might provide qualitative and quantitative data on the structural and metabolic state of the retina in various diseases, potentially improving personalized disease management.
3. Upon validation of the molecular components of FLIO data, which can be achieved by complementing FLIM studies, FLIO could allow for understanding the metabolic state of specific fluorophores within the retina. Future advancements in two-photon excitation FLIO can potentially expand the depth and scope of information beyond what the current setup of FLIO offers, enabling the detection of other important molecules such as NADH. The current understanding of FLIO requires further investigation through molecular imaging and pharmacological validation to accurately link fluorescence lifetimes to specific retinal molecules in vivo.
4. The use of FLIO in MacTel and Stargardt disease shows early potential to document metabolic changes before symptoms of vision change begin, aiding in the early detection of disease. Thus, FLIO technology has shown potential in detecting functional changes from the studies outlined in this review, sometimes preceding structural changes observed by traditional imaging modalities.
5. Based upon preliminary data, FLIO may have a role in the early detection of broad neurodegenerative conditions such as AD and PD and may also be useful in other conditions such as neuroinflammation exemplified by NMOSD.
6. The retina provides at least a window, and maybe a microcosm, into the central nervous system, and the use of FLIO in neurology and neuro-ophthalmology is increasing.
7. Classifying diseases based on abnormal FLIO signals requires disease-specific pattern recognition in fluorescence lifetimes. These patterns can be qualitative, as demonstrated by the distinct spatial patterns of lifetimes observed in Stargardt disease and MacTel type 2, which can be differentiated from one another based on their unique FLIO findings. These patterns can also be quantitative, such as the prolonged lifetimes observed in many conditions discussed in this review. For example, FLIO can already help differentiate new flecks from older flecks in Stargardt disease (112, 113). In the future, the spatial distribution of fluorescence lifetimes across different retinal layers may further aid in classifying disease, as many diseases affect specific layers of the retina differently. Additionally, the use of FLIO technology with multiple excitation and emission wavelengths in the future may help to establish disease-specific patterns of fluorescence lifetimes by capturing a broader range of fluorophore contributions.
8. Future strategies may involve developing disease-specific reference databases and using artificial intelligence (AI) to analyze fluorescence lifetime images, histograms, and phasor plots, enabling automated detection of disease-related abnormalities that are diagnostically accurate and reproducible. Additionally, integrating FLIO with imaging modalities, such as OCT, could improve disease classification by correlating metabolic abnormalities with retinal layer-specific structural changes. Recent advancements in FLIO analysis include the integration of AI, such as support vector machines, which have successfully differentiated fluorescence lifetimes between non-smokers and heavy smokers with an accuracy of 80% (139). Adaptive optics fluorescence lifetime imaging ophthalmoscopy (AOFLIO) is a technical enhancement of FLIO, acquiring fluorescence lifetimes with higher resolution and primarily from the RPE (140). This advancement of FLIO found prolonged lifetimes in patients with pentosan polysulfate toxicity, emphasizing subtle outer retina changes that are not visible with standard imaging modalities (140). Near-infrared AOFLIO is another technique that has enhanced standard FLIO technology to visualize the RPE cellular mosaic (141). These advancements highlight the potential of AI-assisted and AOFLIO techniques to enhance diagnostic accuracy and expand FLIO in ophthalmic and neurodegenerative diseases. FLIO has the potential to become a valuable tool for the early detection and monitoring of disease progression and for measuring the impact of experimental therapies on disease.
DM: Conceptualization, Data curation, Formal analysis, Investigation, Methodology, Project administration, Resources, Writing – original draft, Writing – review & editing, Validation, Visualization. EA: Conceptualization, Data curation, Formal analysis, Investigation, Methodology, Project administration, Resources, Validation, Visualization, Writing – original draft, Writing – review & editing, Software, Supervision. GH: Conceptualization, Data curation, Formal analysis, Funding acquisition, Investigation, Methodology, Project administration, Resources, Software, Supervision, Validation, Visualization, Writing – original draft, Writing – review & editing. RS: Conceptualization, Data curation, Formal analysis, Investigation, Methodology, Project administration, Resources, Writing – original draft, Writing – review & editing, Funding acquisition.
The author(s) declare that no financial support was received for the research, authorship, and/or publication of this article.
The authors declare that the research was conducted in the absence of any commercial or financial relationships that could be construed as a potential conflict of interest.
All claims expressed in this article are solely those of the authors and do not necessarily represent those of their affiliated organizations, or those of the publisher, the editors and the reviewers. Any product that may be evaluated in this article, or claim that may be made by its manufacturer, is not guaranteed or endorsed by the publisher.
1. Arnold, AC, Costa, RM, and Dumitrascu, OM. The spectrum of optic disc ischemia in patients younger than 50 years (an Amercian ophthalmological society thesis). Trans Am Ophthalmol Soc. (2013) 111:93–118.
2. Arnold, AC, and Hepler, RS. Fluorescein angiography in acute nonarteritic anterior ischemic optic neuropathy. Am J Ophthalmol. (1994) 117:222–30. doi: 10.1016/S0002-9394(14)73080-6
3. How, AC, and Koh, AH. Angiographic characteristics of acute central serous chorioretinopathy in an Asian population. Ann Acad Med Singap. (2006) 35:77–9. doi: 10.47102/annals-acadmedsg.V35N2p77
4. Kim, MK, and Kim, US. Analysis of fundus photography and fluorescein angiography in Nonarteritic anterior ischemic optic neuropathy and optic neuritis. Korean J Ophthalmol. (2016) 30:289–94. doi: 10.3341/kjo.2016.30.4.289
5. Littlewood, R, Mollan, SP, Pepper, IM, and Hickman, SJ. The utility of fundus fluorescein angiography in neuro-ophthalmology. Neuroophthalmology. (2019) 43:217–34. doi: 10.1080/01658107.2019.1604764
6. Marmor, MF, and Ravin, JG. Fluorescein angiography: insight and serendipity a half century ago. Arch Ophthalmol. (2011) 129:943–8. doi: 10.1001/archophthalmol.2011.160
8. Perez, MA, Bruce, BB, Newman, NJ, and Biousse, V. The use of retinal photography in nonophthalmic settings and its potential for neurology. Neurologist. (2012) 18:350–5. doi: 10.1097/NRL.0b013e318272f7d7
10. Pujari, A, Bhaskaran, K, Sharma, P, Singh, P, Phuljhele, S, Saxena, R, et al. Optical coherence tomography angiography in neuro-ophthalmology: current clinical role and future perspectives. Surv Ophthalmol. (2021) 66:471–81. doi: 10.1016/j.survophthal.2020.10.009
11. Minakaran, N, de Carvalho, ER, Petzold, A, and Wong, SH. Optical coherence tomography (OCT) in neuro-ophthalmology. Eye. (2021) 35:17–32. doi: 10.1038/s41433-020-01288-x
12. Murthy, RK, Haji, S, Sambhav, K, Grover, S, and Chalam, KV. Clinical applications of spectral domain optical coherence tomography in retinal diseases. Biom J. (2016) 39:107–20. doi: 10.1016/j.bj.2016.04.003
13. Greenberg, BM, and Frohman, E. Optical coherence tomography as a potential readout in clinical trials. Ther Adv Neurol Disord. (2010) 3:153–60. doi: 10.1177/1756285610368890
14. Spaide, RF, Fujimoto, JG, Waheed, NK, Sadda, SR, and Staurenghi, G. Optical coherence tomography angiography. Prog Retin Eye Res. (2018) 64:1–55. doi: 10.1016/j.preteyeres.2017.11.003
15. Sauer, L, Andersen, KM, Dysli, C, Zinkernagel, MS, Bernstein, PS, and Hammer, M. Review of clinical approaches in fluorescence lifetime imaging ophthalmoscopy. J Biomed Opt. (2018) 23:1–20. doi: 10.1117/1.JBO.23.9.091415
16. Sauer, L, Vitale, AS, Modersitzki, NK, and Bernstein, PS. Fluorescence lifetime imaging ophthalmoscopy: autofluorescence imaging and beyond. Eye. (2021) 35:93–109. doi: 10.1038/s41433-020-01287-y
17. Dysli, C, Wolf, S, Berezin, MY, Sauer, L, Hammer, M, and Zinkernagel, MS. Fluorescence lifetime imaging ophthalmoscopy. Prog Retin Eye Res. (2017) 60:120–43. doi: 10.1016/j.preteyeres.2017.06.005
18. Lakowicz, JR. Principles of fluorescence spectroscopy. 3rd ed. New York: Springer (2006). 954 p.
19. Chen, LC, Lloyd, WR III, Chang, CW, Sud, D, and Mycek, MA. Fluorescence lifetime imaging microscopy for quantitative biological imaging. Methods Cell Biol. (2013) 114:457–88. doi: 10.1016/B978-0-12-407761-4.00020-8
20. Schweitzer, D, Schenke, S, Hammer, M, Schweitzer, F, Jentsch, S, Birckner, E, et al. Towards metabolic mapping of the human retina. Microsc Res Tech. (2007) 70:410–9. doi: 10.1002/jemt.20427
21. Schweitzer, D, Kolb, A, Hammer, M, and Anders, R. Time-correlated measurement of autofluorescence. A method to detect metabolic changes in the fundus. Ophthalmologe. (2002) 99:774–9. doi: 10.1007/s00347-002-0656-3
22. Schweitzer, D, Kolb, A, Hammer, M, and Thamm, E. Basic investigations for 2-dimensional time-resolved fluorescence measurements at the fundus. Int Ophthalmol. (2001) 23:399–404. doi: 10.1023/A:1014475219117
23. Schweitzer, D, Hammer, M, Anders, R, and Doebbecke, T. Evaluation of time-resolved autofluorescence images of the ocular fundus In: GA Wagnieres editor. Diagnostic Optical Spectroscopy in Biomedicine II. Munich: Optica Publishing Group (2003).
24. Schweitzer, D, Hammer, M, Schweitzer, F, Anders, R, Doebbecke, T, Schenke, S, et al. In vivo measurement of time-resolved autofluorescence at the human fundus. J Biomed Opt. (2004) 9:1214–22. doi: 10.1117/1.1806833
25. Schweitzer, D, Hammer, M, Jentsch, S, and Schenke, S. Interpretation of measurements of dynamic fluorescence of the eye. Optics East. (2007) 6771:1–12. doi: 10.1117/12.735815
26. Galletly, NP, McGinty, J, Dunsby, C, Teixeira, F, Requejo-Isidro, J, Munro, I, et al. Fluorescence lifetime imaging distinguishes basal cell carcinoma from surrounding uninvolved skin. Br J Dermatol. (2008) 159:152–61. doi: 10.1111/j.1365-2133.2008.08577.x
27. Phipps, J, et al. Fluorescence lifetime imaging microscopy for the characterization of atherosclerotic plaques. Proc SPIE Int Soc Opt Eng. (2009) 7161:71612G. doi: 10.1117/12.813087
28. Marcu, L. Fluorescence lifetime in cardiovascular diagnostics. J Biomed Opt. (2010) 15:011106. doi: 10.1117/1.3327279
29. Bec, J, Xie, H, Yankelevich, DR, Zhou, F, Sun, Y, Ghata, N, et al. Design, construction, and validation of a rotary multifunctional intravascular diagnostic catheter combining multispectral fluorescence lifetime imaging and intravascular ultrasound. J Biomed Opt. (2012) 17:106012. doi: 10.1117/1.JBO.17.10.106012
30. Wu, Z, Liu, M, Liu, Z, and Tian, Y. Real-time imaging and simultaneous quantification of mitochondrial H(2)O(2) and ATP in neurons with a single two-photon fluorescence-lifetime-based probe. J Am Chem Soc. (2020) 142:7532–41. doi: 10.1021/jacs.0c00771
31. Lakowicz, JR, Szmacinski, H, and Johnson, ML. Calcium imaging using fluorescence lifetimes and long-wavelength probes. J Fluoresc. (1992) 2:47–62. doi: 10.1007/BF00866388
32. Datta, R, Gillette, A, Stefely, M, and Skala, MC. Recent innovations in fluorescence lifetime imaging microscopy for biology and medicine. J Biomed Opt. (2021) 26:070603. doi: 10.1117/1.JBO.26.7.070603
33. Csordás, G, Várnai, P, Golenár, T, Roy, S, Purkins, G, Schneider, TG, et al. Imaging interorganelle contacts and local calcium dynamics at the ER-mitochondrial interface. Mol Cell. (2010) 39:121–32. doi: 10.1016/j.molcel.2010.06.029
34. Lakowicz, JR, and Szmacinski, H. Fluorescence lifetime-based sensing of pH, Ca2+, K+ and glucose. Sensors Actuators B Chem. (1993) 11:133–43. doi: 10.1016/0925-4005(93)85248-9
35. Datta, R, Heaster, TM, Sharick, JT, Gillette, AA, and Skala, MC. Fluorescence lifetime imaging microscopy: fundamentals and advances in instrumentation, analysis, and applications. J Biomed Opt. (2020) 25:1–43. doi: 10.1117/1.JBO.25.7.071203
37. Becker, W, Bergmann, A, Hink, MA, König, K, Benndorf, K, and Biskup, C. Fluorescence lifetime imaging by time-correlated single-photon counting. Microsc Res Tech. (2004) 63:58–66. doi: 10.1002/jemt.10421
38. Kesavamoorthy, N, Junge, JA, Fraser, SE, and Ameri, H. Insights into metabolic activity and structure of the retina through multiphoton fluorescence lifetime imaging microscopy in mice. Cells. (2022) 11:2265. doi: 10.3390/cells11152265
39. Han, M, Giese, G, Schmitz-Valckenberg, S, Bindewald-Wittich, A, Holz, FG, Yu, J, et al. Age-related structural abnormalities in the human retina-choroid complex revealed by two-photon excited autofluorescence imaging. J Biomed Opt. (2007) 12:024012. doi: 10.1117/1.2717522
40. La Schiazza, O, and Bille, JF. High-speed two-photon excited autofluorescence imaging of ex vivo human retinal pigment epithelial cells toward age-related macular degeneration diagnostic. J Biomed Opt. (2008) 13:064008. doi: 10.1117/1.2999607
41. Peters, S, Hammer, M, and Schweitzer, D. Two-photon excited fluorescence microscopy application for ex vivo investigation of ocular fundus samples In: TC Peter and B Emmanuel editors. Advanced microscopy techniques II. Munich: Optica Publishing Group (2011).
42. Suhling, K, French, PM, and Phillips, D. Time-resolved fluorescence microscopy. Photochem Photobiol Sci. (2005) 4:13–22. doi: 10.1039/b412924p
43. Delori, FC, Dorey, CK, Staurenghi, G, Arend, O, Goger, DG, and Weiter, JJ. In vivo fluorescence of the ocular fundus exhibits retinal pigment epithelium lipofuscin characteristics. Invest Ophthalmol Vis Sci. (1995) 36:718–29.
44. Schweitzer, D, Jentsch, S, Schenke, S, Hammer, M, Biskup, C, and Gaillard, E. Spectral and time-resolved studies on ocular structures. Eur Conf Biomed Optics. SPIE BiOS. (2007) 6628:1–12. doi: 10.1117/12.726701
45. Digman, MA, Caiolfa, VR, Zamai, M, and Gratton, E. The phasor approach to fluorescence lifetime imaging analysis. Biophys J. (2008) 94:L14–6. doi: 10.1529/biophysj.107.120154
46. Colyer, R, Siegmund, O, Colyer, R, Colyer, R, Colyer, R, and Colyer, R. Phasor-based single-molecule fluorescence lifetime imaging using a wide-field photon-counting detector. Proc SPIE Int Soc Opt Eng. (2009) 7185:1–10. doi: 10.1117/12.809496
47. Becker, W, and Bergmann, A In: B Hickl, editor. New SPCImage version combines time-domain analysis with phasor plot. Becker and Hickl GmbH. (2018).
48. Malacrida, L, Ranjit, S, Jameson, DM, and Gratton, E. The phasor plot: a universal circle to advance fluorescence lifetime analysis and interpretation. Annu Rev Biophys. (2021) 50:575–93. doi: 10.1146/annurev-biophys-062920-063631
49. Sauer, L, Schweitzer, D, Ramm, L, Augsten, R, Hammer, M, and Peters, S. Impact of macular pigment on fundus autofluorescence lifetimes. Invest Ophthalmol Vis Sci. (2015) 56:4668–79. doi: 10.1167/iovs.14-15335
50. Bernstein, P, Dysli, C, Fischer, J, Hammer, M, Katayama, Y, Sauer, L, et al. Fluorescence lifetime imaging ophthalmoscopy (FLIO) In: JF Bille, editor. High resolution imaging in microscopy and ophthalmology: new frontiers in biomedical optics. Cham: Springer. (2019). 213–35.
51. Sauer, L, Andersen, KM, Li, B, Gensure, RH, Hammer, M, and Bernstein, PS. Fluorescence lifetime imaging ophthalmoscopy (FLIO) of macular pigment. Invest Ophthalmol Vis Sci. (2018) 59:3094–103. doi: 10.1167/iovs.18-23886
52. Greenberg, JP, Duncker, T, Woods, RL, Smith, RT, Sparrow, JR, and Delori, FC. Quantitative fundus autofluorescence in healthy eyes. Invest Ophthalmol Vis Sci. (2013) 54:5684–93. doi: 10.1167/iovs.13-12445
53. Dysli, C, Quellec, G, Abegg, M, Menke, MN, Wolf-Schnurrbusch, U, Kowal, J, et al. Quantitative analysis of fluorescence lifetime measurements of the macula using the fluorescence lifetime imaging ophthalmoscope in healthy subjects. Invest Ophthalmol Vis Sci. (2014) 55:2106–13. doi: 10.1167/iovs.13-13627
54. Hammer, M, Quick, S, Klemm, M, Schenke, S, Mata, N, Eitner, A, et al. In vivo and in vitro investigations of retinal fluorophores in age-related macular degeneration by fluorescence lifetime imaging In: A Periasamy and TC Peter editors. Proc. SPIE BiOS (2009).
55. Schweitzer, D, Gaillard, ER, Dillon, J, Mullins, RF, Russell, S, Hoffmann, B, et al. Time-resolved autofluorescence imaging of human donor retina tissue from donors with significant extramacular drusen. Invest Ophthalmol Vis Sci. (2012) 53:3376–86. doi: 10.1167/iovs.11-8970
56. Wakita, M, Nishimura, G, and Tamura, M. Some characteristics of the fluorescence lifetime of reduced pyridine nucleotides in isolated mitochondria, isolated hepatocytes, and perfused rat liver in situ. J Biochem. (1995) 118:1151–60. doi: 10.1093/oxfordjournals.jbchem.a125001
57. Niesner, R, Peker, B, Schlüsche, P, and Gericke, KH. Noniterative biexponential fluorescence lifetime imaging in the investigation of cellular metabolism by means of NAD(P)H autofluorescence. ChemPhysChem. (2004) 5:1141–9. doi: 10.1002/cphc.200400066
58. Schneckenburger, H, Wagner, M, Weber, P, Strauss, WSL, and Sailer, R. Autofluorescence lifetime imaging of cultivated cells using a UV picosecond laser diode. J Fluoresc. (2004) 14:649–54. doi: 10.1023/B:JOFL.0000039351.09916.cc
59. Kierdaszuk, B, Malak, H, Gryczynski, I, Callis, P, and Lakowicz, JR. Fluorescence of reduced nicotinamides using one- and two-photon excitation. Biophys Chem. (1996) 62:1–13. doi: 10.1016/S0301-4622(96)02182-5
60. Andrews, RM, Griffiths, PG, Johnson, MA, and Turnbull, DM. Histochemical localisation of mitochondrial enzyme activity in human optic nerve and retina. Br J Ophthalmol. (1999) 83:231–5. doi: 10.1136/bjo.83.2.231
61. Nakashima, N, Yoshihara, K, Tanaka, F, and Yagi, K. Picosecond fluorescence lifetime of the coenzyme of D-amino acid oxidase. J Biol Chem. (1980) 255:5261–3. doi: 10.1016/S0021-9258(19)70779-0
62. Skala, MC, Riching, KM, Gendron-Fitzpatrick, A, Eickhoff, J, Eliceiri, KW, White, JG, et al. In vivo multiphoton microscopy of NADH and FAD redox states, fluorescence lifetimes, and cellular morphology in precancerous epithelia. Proc Natl Acad Sci U S A. (2007) 104:19494–9. doi: 10.1073/pnas.0708425104
63. Penjweini, R, Roarke, B, Alspaugh, G, Gevorgyan, A, Andreoni, A, Pasut, A, et al. Single cell-based fluorescence lifetime imaging of intracellular oxygenation and metabolism. Redox Biol. (2020) 34:101549. doi: 10.1016/j.redox.2020.101549
64. Katz, ML, Drea, CM, Eldred, GE, Hess, HH, and Robison, WG Jr. Influence of early photoreceptor degeneration on lipofuscin in the retinal pigment epithelium. Exp Eye Res. (1986) 43:561–73. doi: 10.1016/S0014-4835(86)80023-9
65. Delori, FC, Goger, DG, and Dorey, CK. Age-related accumulation and spatial distribution of lipofuscin in RPE of normal subjects. Invest Ophthalmol Vis Sci. (2001) 42:1855–66.
66. Bone, RA, Landrum, JT, and Tarsis, SL. Preliminary identification of the human macular pigment. Vis Res. (1985) 25:1531–5. doi: 10.1016/0042-6989(85)90123-3
67. Bone, RA, Landrum, JT, Hime, GW, Cains, A, and Zamor, J. Stereochemistry of the human macular carotenoids. Invest Ophthalmol Vis Sci. (1993) 34:2033–40.
68. Snodderly, DM, Auran, JD, and Delori, FC. The macular pigment. II. Spatial distribution in primate retinas. Invest Ophthalmol Vis Sci. (1984) 25:674–85.
69. Kijlstra, A, Tian, Y, Kelly, ER, and Berendschot, TTJM. Lutein: more than just a filter for blue light. Prog Retin Eye Res. (2012) 31:303–15. doi: 10.1016/j.preteyeres.2012.03.002
70. Sharifzadeh, M, Bernstein, PS, and Gellermann, W. Nonmydriatic fluorescence-based quantitative imaging of human macular pigment distributions. J Opt Soc Am A Opt Image Sci Vis. (2006) 23:2373–87. doi: 10.1364/JOSAA.23.002373
71. Bhosale, P, and Bernstein, PS. Vertebrate and invertebrate carotenoid-binding proteins. Arch Biochem Biophys. (2007) 458:121–7. doi: 10.1016/j.abb.2006.10.005
72. Loane, E, Nolan, JM, O'Donovan, O, Bhosale, P, Bernstein, PS, and Beatty, S. Transport and retinal capture of lutein and zeaxanthin with reference to age-related macular degeneration. Surv Ophthalmol. (2008) 53:68–81. doi: 10.1016/j.survophthal.2007.10.008
73. Bhosale, P, Larson, AJ, Frederick, JM, Southwick, K, Thulin, CD, and Bernstein, PS. Identification and characterization of a pi isoform of glutathione S-transferase (GSTP1) as a zeaxanthin-binding protein in the macula of the human eye. J Biol Chem. (2004) 279:49447–54. doi: 10.1074/jbc.M405334200
74. Bhosale, P, and Bernstein, PS. Synergistic effects of zeaxanthin and its binding protein in the prevention of lipid membrane oxidation. Biochim Biophys Acta. (2005) 1740:116–21. doi: 10.1016/j.bbadis.2005.02.002
75. Bhosale, P, Li, B, Sharifzadeh, M, Gellermann, W, Frederick, JM, Tsuchida, K, et al. Purification and partial characterization of a lutein-binding protein from human retina. Biochemistry. (2009) 48:4798–807. doi: 10.1021/bi9004478
76. Bernstein, PS, Balashov, NA, Tsong, ED, and Rando, RR. Retinal tubulin binds macular carotenoids. Invest Ophthalmol Vis Sci. (1997) 38:167–75.
77. Bernstein, PS, Li, B, Vachali, PP, Gorusupudi, A, Shyam, R, Henriksen, BS, et al. Lutein, zeaxanthin, and meso-zeaxanthin: the basic and clinical science underlying carotenoid-based nutritional interventions against ocular disease. Prog Retin Eye Res. (2016) 50:34–66. doi: 10.1016/j.preteyeres.2015.10.003
78. Woodall, AA, Britton, G, and Jackson, MJ. Carotenoids and protection of phospholipids in solution or in liposomes against oxidation by peroxyl radicals: relationship between carotenoid structure and protective ability. Biochim Biophys Acta. (1997) 1336:575–86. doi: 10.1016/S0304-4165(97)00007-X
79. Ham, WT Jr, Ruffolo, JJ Jr, Mueller, HA, Clarke, AM, and Moon, ME. Histologic analysis of photochemical lesions produced in rhesus retina by short-wave-length light. Invest Ophthalmol Vis Sci. (1978) 17:1029–35.
80. Krinsky, NI. Antioxidant functions of carotenoids. Free Radic Biol Med. (1989) 7:617–35. doi: 10.1016/0891-5849(89)90143-3
81. Bone, RA, Landrum, JT, Friedes, LM, Gomez, CM, Kilburn, MD, Menendez, E, et al. Distribution of lutein and zeaxanthin stereoisomers in the human retina. Exp Eye Res. (1997) 64:211–8. doi: 10.1006/exer.1996.0210
82. Sauer, L, Peters, S, Schmidt, J, Schweitzer, D, Klemm, M, Ramm, L, et al. Monitoring macular pigment changes in macular holes using fluorescence lifetime imaging ophthalmoscopy. Acta Ophthalmol. (2017) 95:481–92. doi: 10.1111/aos.13269
83. Sauer, L, Gensure, RH, Andersen, KM, Kreilkamp, L, Hageman, GS, Hammer, M, et al. Patterns of fundus autofluorescence lifetimes in eyes of individuals with nonexudative age-related macular degeneration. Invest Ophthalmol Vis Sci. (2018) 59:AMD65. doi: 10.1167/iovs.17-23764
84. Dysli, C, Fink, R, Wolf, S, and Zinkernagel, MS. Fluorescence lifetimes of Drusen in age-related macular degeneration. Invest Ophthalmol Vis Sci. (2017) 58:4856–62. doi: 10.1167/iovs.17-22184
85. Sauer, L, Komanski, CB, Vitale, AS, Hansen, ED, and Bernstein, PS. Fluorescence lifetime imaging ophthalmoscopy (FLIO) in eyes with pigment epithelial detachments due to age-related macular degeneration. Invest Ophthalmol Vis Sci. (2019) 60:3054–63. doi: 10.1167/iovs.19-26835
86. Hammer, M, Königsdörffer, E, Liebermann, C, Framme, C, Schuch, G, Schweitzer, D, et al. Ocular fundus auto-fluorescence observations at different wavelengths in patients with age-related macular degeneration and diabetic retinopathy. Graefes Arch Clin Exp Ophthalmol. (2008) 246:105–14. doi: 10.1007/s00417-007-0639-9
87. Schmidt, J, Peters, S, Sauer, L, Schweitzer, D, Klemm, M, Augsten, R, et al. Fundus autofluorescence lifetimes are increased in non-proliferative diabetic retinopathy. Acta Ophthalmol. (2017) 95:33–40. doi: 10.1111/aos.13174
88. Schweitzer, D, Deutsch, L, Klemm, M, Jentsch, S, Hammer, M, Peters, S, et al. Fluorescence lifetime imaging ophthalmoscopy in type 2 diabetic patients who have no signs of diabetic retinopathy. J Biomed Opt. (2015) 20:61106. doi: 10.1117/1.JBO.20.6.061106
89. Schweitzer, D, Quick, S, Klemm, M, Hammer, M, Jentsch, S, and Dawczynski, J. Time-resolved autofluorescence in retinal vascular occlusions. Ophthalmologe. (2010) 107:1145–52. doi: 10.1007/s00347-010-2195-7
90. Hammer, M, Sauer, L, Klemm, M, Peters, S, Schultz, R, and Haueisen, J. Fundus autofluorescence beyond lipofuscin: lesson learned from ex vivo fluorescence lifetime imaging in porcine eyes. Biomed Opt Express. (2018) 9:3078–91. doi: 10.1364/BOE.9.003078
91. Dysli, C, Berger, L, Wolf, S, and Zinkernagel, MS. Fundus autofluorescence lifetimes and central serous chorioretinopathy. Retina. (2017) 37:2151–61. doi: 10.1097/IAE.0000000000001452
92. Vitale, AS, Sauer, L, Modersitzki, NK, and Bernstein, PS. Fluorescence lifetime imaging ophthalmoscopy (FLIO) in patients with choroideremia. Transl Vis Sci Technol. (2020) 9:33–3. doi: 10.1167/tvst.9.10.33
93. Dysli, C, Schuerch, K, Escher, P, Wolf, S, and Zinkernagel, MS. Fundus autofluorescence lifetime patterns in retinitis Pigmentosa. Invest Ophthalmol Vis Sci. (2018) 59:1769–78. doi: 10.1167/iovs.17-23336
94. Andersen, KM, Sauer, L, Gensure, RH, Hammer, M, and Bernstein, PS. Characterization of retinitis Pigmentosa using fluorescence lifetime imaging ophthalmoscopy (FLIO). Transl Vis Sci Technol. (2018) 7:20–18. doi: 10.1167/tvst.7.3.20
95. Jaggi, D, Solberg, Y, Dysli, C, Ebneter, A, Wolf, S, and Zinkernagel, MS. Fluorescence lifetime imaging ophthalmoscopy: findings after surgical reattachment of macula-off Rhegmatogenous retinal detachment. Retina. (2020) 40:1929–37. doi: 10.1097/IAE.0000000000002718
96. Sauer, L, Calvo, CM, Vitale, AS, Henrie, N, Milliken, CM, and Bernstein, PS. Imaging of Hydroxychloroquine toxicity with fluorescence lifetime imaging ophthalmoscopy. Ophthalmol Retina. (2019) 3:814–25. doi: 10.1016/j.oret.2019.04.025
97. Solberg, Y, Dysli, C, Möller, B, Wolf, S, and Zinkernagel, MS. Fluorescence lifetimes in patients with Hydroxychloroquine retinopathy. Invest Ophthalmol Vis Sci. (2019) 60:2165–72. doi: 10.1167/iovs.18-26079
98. Ermakov, IV, McClane, RW, Gellermann, W, and Bernstein, PS. Resonant Raman detection of macular pigment levels in the living human retina. Opt Lett. (2001) 26:202–4. doi: 10.1364/OL.26.000202
99. Charbel Issa, P, Gillies, MC, Chew, EY, Bird, AC, Heeren, TFC, Peto, T, et al. Macular telangiectasia type 2. Prog Retin Eye Res. (2013) 34:49–77. doi: 10.1016/j.preteyeres.2012.11.002
100. Sauer, L, Gensure, RH, Hammer, M, and Bernstein, PS. Fluorescence lifetime imaging ophthalmoscopy: a novel way to assess macular telangiectasia type 2. Ophthalmol Retina. (2018) 2:587–98. doi: 10.1016/j.oret.2017.10.008
101. Sauer, L, Vitale, AS, Modersitzki, NK, and Bernstein, PS. Longitudinal fluorescence lifetime imaging ophthalmoscopy analysis in patients with macular telangiectasia type 2 (MacTel). Retina. (2021) 41:1416–27. doi: 10.1097/IAE.0000000000003055
102. Sauer, L, Vitale, AS, Andersen, KM, Hart, B, and Bernstein, PS. Fluorescence lifetime imaging ophthalmoscopy (Flio) patterns in clinically unaffected children of macular telangiectasia type 2 (Mactel) patients. Retina. (2020) 40:695–704. doi: 10.1097/IAE.0000000000002646
103. Solberg, Y, Dysli, C, Wolf, S, and Zinkernagel, MS. Fluorescence lifetime patterns in macular telangiectasia type 2. Retina. (2020) 40:99–108. doi: 10.1097/IAE.0000000000002411
104. Goerdt, L, Sauer, L, Vitale, AS, Modersitzki, NK, Fleckenstein, M, and Bernstein, PS. Comparing fluorescence lifetime imaging ophthalmoscopy in atrophic areas of retinal diseases. Transl Vis Sci Technol. (2021) 10:11. doi: 10.1167/tvst.10.7.11
105. Sauer, L, Vitale, A, and Bernstein, PS. The sensitivity and specificity of FLIO (fluorescence lifetime imaging ophthalmoscopy) when imaging patients with MacTel. Invest Ophthalmol Vis Sci. (2022) 63:42–2.
106. Michaelides, M, Hunt, DM, and Moore, AT. The genetics of inherited macular dystrophies. J Med Genet. (2003) 40:641–50. doi: 10.1136/jmg.40.9.641
107. Stone, EM, Andorf, JL, Whitmore, SS, DeLuca, AP, Giacalone, JC, Streb, LM, et al. Clinically focused molecular investigation of 1000 consecutive families with inherited retinal disease. Ophthalmology. (2017) 124:1314–31. doi: 10.1016/j.ophtha.2017.04.008
108. Allikmets, R, Singh, N, Sun, H, Shroyer, NF, Hutchinson, A, Chidambaram, A, et al. A photoreceptor cell-specific ATP-binding transporter gene (ABCR) is mutated in recessive Stargardt macular dystrophy. Nat Genet. (1997) 15:236–46. doi: 10.1038/ng0397-236
109. Boyer, NP, Higbee, D, Currin, MB, Blakeley, LR, Chen, C, Ablonczy, Z, et al. Lipofuscin and N-retinylidene-N-retinylethanolamine (A2E) accumulate in retinal pigment epithelium in absence of light exposure: their origin is 11-cis-retinal. J Biol Chem. (2012) 287:22276–86. doi: 10.1074/jbc.M111.329235
110. Zhang, N, Tsybovsky, Y, Kolesnikov, AV, Rozanowska, M, Swider, M, Schwartz, SB, et al. Protein misfolding and the pathogenesis of ABCA4-associated retinal degenerations. Hum Mol Genet. (2015) 24:3220–37. doi: 10.1093/hmg/ddv073
111. Cideciyan, AV, Aleman, TS, Swider, M, Schwartz, SB, Steinberg, JD, Brucker, AJ, et al. Mutations in ABCA4 result in accumulation of lipofuscin before slowing of the retinoid cycle: a reappraisal of the human disease sequence. Hum Mol Genet. (2004) 13:525–34. doi: 10.1093/hmg/ddh048
112. Dysli, C, Wolf, S, Hatz, K, and Zinkernagel, MS. Fluorescence lifetime imaging in Stargardt disease: potential marker for disease progression. Invest Ophthalmol Vis Sci. (2016) 57:832–41. doi: 10.1167/iovs.15-18033
113. Solberg, Y, Dysli, C, Escher, P, Berger, L, Wolf, S, and Zinkernagel, MS. Retinal flecks in Stargardt disease reveal characteristic fluorescence lifetime transition over time. Retina. (2019) 39:879–88. doi: 10.1097/IAE.0000000000002519
114. Bambo, MP, Garcia-Martin, E, Pinilla, J, Herrero, R, Satue, M, Otin, S, et al. Detection of retinal nerve fiber layer degeneration in patients with Alzheimer's disease using optical coherence tomography: searching new biomarkers. Acta Ophthalmol. (2014) 92:e581–2. doi: 10.1111/aos.12374
115. Javaid, FZ, Brenton, J, Guo, L, and Cordeiro, MF. Visual and ocular manifestations of Alzheimer’s disease and their use as biomarkers for diagnosis and progression. Front Neurol. (2016) 7:55. doi: 10.3389/fneur.2016.00055
116. Kayabasi, AU, and Sergott, RC. OCT and FAF in the early diagnosis of Alzheimer's disease. Neurobiol Aging. (2014) 35:723. doi: 10.1016/j.neurobiolaging.2013.10.066
117. Wang, L, and Mao, X. Role of retinal amyloid-β in neurodegenerative diseases: overlapping mechanisms and emerging clinical applications. Int J Mol Sci. (2021) 22:2360. doi: 10.3390/ijms22052360
118. Jentsch, S, Schweitzer, D, Schmidtke, KU, Peters, S, Dawczynski, J, Bär, KJ, et al. Retinal fluorescence lifetime imaging ophthalmoscopy measures depend on the severity of Alzheimer's disease. Acta Ophthalmol. (2015) 93:e241–7. doi: 10.1111/aos.12609
119. Sadda, SR, Borrelli, E, Fan, W, Ebraheem, A, Marion, KM, Harrington, M, et al. A pilot study of fluorescence lifetime imaging ophthalmoscopy in preclinical Alzheimer's disease. Eye (Lond). (2019) 33:1271–9. doi: 10.1038/s41433-019-0406-2
120. Shivok, K, Affel, E, and Sergott, RC. Retinal mitochondrial fluorescence-lifetime ophthalmoscopy in patients with Alzheimer’s disease In: Alzheimer’s association international conference 2024, vol. 20. Philadelphia, PA: Wiley and Alzheimer’s Association (2024).
121. Suh, A, Ong, J, Kamran, SA, Waisberg, E, Paladugu, P, Zaman, N, et al. Retina Oculomics in neurodegenerative disease. Ann Biomed Eng. (2023) 51:2708–21. doi: 10.1007/s10439-023-03365-0
122. Rekik, A, Mrabet, S, Nasri, A, Abida, Y, Gharbi, A, Gargouri, A, et al. Eye movement study in essential tremor patients and its clinical correlates. J Neural Transm (Vienna). (2023) 130:537–48. doi: 10.1007/s00702-023-02614-9
123. Poewe, W, Seppi, K, Tanner, CM, Halliday, GM, Brundin, P, Volkmann, J, et al. Parkinson disease. Nat Rev Dis Primers. (2017) 3:17013. doi: 10.1038/nrdp.2017.13
124. Ramirez, AI, de Hoz, R, Salobrar-Garcia, E, Salazar, JJ, Rojas, B, Ajoy, D, et al. The role of microglia in retinal neurodegeneration: Alzheimer's disease, Parkinson, and Glaucoma. Front Aging Neurosci. (2017) 9:214. doi: 10.3389/fnagi.2017.00214
125. Li, JL, Lin, TY, Chen, PL, Guo, TN, Huang, SY, Chen, CH, et al. Mitochondrial function and Parkinson's disease: from the perspective of the Electron transport chain. Front Mol Neurosci. (2021) 14:797833. doi: 10.3389/fnmol.2021.797833
126. Park, JS, Davis, RL, and Sue, CM. Mitochondrial dysfunction in Parkinson's disease: new mechanistic insights and therapeutic perspectives. Curr Neurol Neurosci Rep. (2018) 18:21. doi: 10.1007/s11910-018-0829-3
127. Huang, J, Li, Y, Xiao, J, Zhang, Q, Xu, G, Wu, G, et al. Combination of multifocal Electroretinogram and spectral-domain OCT can increase diagnostic efficacy of Parkinson's disease. Parkinsons Dis. (2018) 2018:4163239. doi: 10.1155/2018/4163239
128. Unlu, M, Gulmez Sevim, D, Gultekin, M, and Karaca, C. Correlations among multifocal electroretinography and optical coherence tomography findings in patients with Parkinson's disease. Neurol Sci. (2018) 39:533–41. doi: 10.1007/s10072-018-3244-2
129. Shivok, K, Affel, M, Alizadeh, T-W, Liang, D, Kremens, R, and Sergott, R. Fluorescence-lifetime ophthalmoscopy findings in Parkinson’s disease patients with visual disturbances [abstract]. Mov Disord. (2023) 38:1.
130. Miura, Y, Rauenbusch, K, Prasuhn, J, Brüggemann, N, Grisanti, S, and Sonntag, SR. Comparison of retinal fluorescence lifetime between patients with Parkinson’s disease and healthy subjects. Invest Ophthalmol Vis Sci. (2024) 65:1382–2.
131. Shivok, K, Affel, M, Alizadeh, T-W, Liang, D, Kremens, R, and Sergott, R. Fluorescence lifetime imaging ophthalmoscopy (FLIO), a novel retinal mitochondrial biomarker for Parkinson’s disease. Mov Disord. (2024) 39:1. doi: 10.1002/alz.091880
132. Spaide, RF. Retinal vascular cystoid macular edema: review and new theory. Retina. (2016) 36:1823–42. doi: 10.1097/IAE.0000000000001158
133. Nagelhus, EA, Mathiisen, TM, and Ottersen, OP. Aquaporin-4 in the central nervous system: cellular and subcellular distribution and coexpression with KIR4.1. Neuroscience. (2004) 129:905–13. doi: 10.1016/j.neuroscience.2004.08.053
134. Newman, EA. Inward-rectifying potassium channels in retinal glial (Muller) cells. J Neurosci. (1993) 13:3333–45. doi: 10.1523/JNEUROSCI.13-08-03333.1993
135. Sotirchos, ES, Saidha, S, Byraiah, G, Mealy, MA, Ibrahim, MA, Sepah, YJ, et al. In vivo identification of morphologic retinal abnormalities in neuromyelitis optica. Neurology. (2013) 80:1406–14. doi: 10.1212/WNL.0b013e31828c2f7a
136. Foolad, F, Khodagholi, F, Nabavi, SM, and Javan, M. Changes in mitochondrial function in patients with neuromyelitis optica; correlations with motor and cognitive disabilities. PLoS One. (2020) 15:e0230691. doi: 10.1371/journal.pone.0230691
137. Morch, MT, Khorooshi, R, Marczynska, J, Dubik, M, Nielsen, S, Nieland, JD, et al. Mitochondria-a target for attenuation of astrocyte pathology. J Neuroimmunol. (2021) 358:577657. doi: 10.1016/j.jneuroim.2021.577657
138. Cappellani, F, Sergott, R, Pulido, J, Affel, E, and Fernandez, B. NMOSD retinal mitochondrial fluorescence correlates with ganglion cell layer loss consistent with retinal Vasculitis, in ECTRIMS 2024. Copenhagen, DK: Sage Journals. (2024).
139. Thiemann, N, Sonntag, SR, Kreikenbohm, M, Böhmerle, G, Stagge, J, Grisanti, S, et al. Artificial intelligence in fluorescence lifetime imaging ophthalmoscopy (FLIO) data analysis-toward retinal metabolic diagnostics. Diagnostics. (2024) 14:431. doi: 10.3390/diagnostics14040431
140. Bowles Johnson, KE, Tang, JAH, Kunala, K, Huynh, KT, Parkins, K, Yang, Q, et al. Fluorescence lifetime imaging of human retinal pigment epithelium in pentosan polysulfate toxicity using adaptive optics scanning light ophthalmoscopy. Invest Ophthalmol Vis Sci. (2024) 65:27. doi: 10.1167/iovs.65.4.27
Keywords: neurodegenerative diseases, fluorescence lifetime imaging ophthalmoscopy, Alzheimer’s disease, Parkinson’s disease, neuromyelitis optica spectrum disorder
Citation: Markowitz DM, Affel E, Hajnóczky G and Sergott RC (2025) Future applications of fluorescence lifetime imaging ophthalmoscopy in neuro-ophthalmology, neurology, and neurodegenerative conditions. Front. Neurol. 16:1493876. doi: 10.3389/fneur.2025.1493876
Edited by:
Jana Lizrova Preiningerova, Charles University, CzechiaReviewed by:
Yan Yan, Fudan University, ChinaCopyright © 2025 Markowitz, Affel, Hajnóczky and Sergott. This is an open-access article distributed under the terms of the Creative Commons Attribution License (CC BY). The use, distribution or reproduction in other forums is permitted, provided the original author(s) and the copyright owner(s) are credited and that the original publication in this journal is cited, in accordance with accepted academic practice. No use, distribution or reproduction is permitted which does not comply with these terms.
*Correspondence: Robert C. Sergott, cmNzMjIwQGNvbWNhc3QubmV0
Disclaimer: All claims expressed in this article are solely those of the authors and do not necessarily represent those of their affiliated organizations, or those of the publisher, the editors and the reviewers. Any product that may be evaluated in this article or claim that may be made by its manufacturer is not guaranteed or endorsed by the publisher.
Research integrity at Frontiers
Learn more about the work of our research integrity team to safeguard the quality of each article we publish.