
94% of researchers rate our articles as excellent or good
Learn more about the work of our research integrity team to safeguard the quality of each article we publish.
Find out more
ORIGINAL RESEARCH article
Front. Neurol., 27 February 2025
Sec. Stroke
Volume 16 - 2025 | https://doi.org/10.3389/fneur.2025.1478240
This article is part of the Research TopicAdvancing Precision Medicine in Acute Stroke Care: Personalized Treatment Strategies and OutcomesView all 20 articles
 Adrián Valls Carbó1
 Alicia Palomar2
 Carlos Laredo3
 Mariano Werner4Laura Dorado1Sebastià Remollo1
 Josep Munuera5
 Josep Puig6Yolanda Silva7
 Natalia Pérez de la Ossa1Meritxell Gomis1Alejandro Bustamante1Carlos Castaño1Lucía Muñoz1Sira Domenech1Mikel Terceño7
 Mònica Millán1
 María Hernández-Pérez1*
Background: Half of the patients who undergo successful recanalization after endovascular treatment (EVT) experience poor clinical outcomes. Impaired microvascular reperfusion (IMR) may explain this lack of improvement, but its frequency and clinical significance remain unclear. The study aims to describe the frequency and associated factors of IMR.
Materials and methods: We conducted a study on a cohort of patients with anterior large artery occlusion, treated with EVT at a single center, who achieved mTICI ≥2C. Perfusion MRI was obtained at arrival, up to 2 h after EVT (post-EVT MRI), and on day 5. IMR was observed only on the post-EVT relative cerebral blood volume (rCBV) maps as voxels within the follow-up ischemic lesion, exhibiting a > 15% asymmetry compared to a mirror homolog, in the absence of internal carotid occlusion, hemorrhagic transformation, or arterial reocclusion. Patients with an IMR volume greater than 5 mL were defined as having significant IMR. IMR was analyzed as a binary variable (presence/absence using the 5 mL cut-off) and by total and relative volume.
Results: IMR was present in 8 out of 33 patients (24.2%), with 4 out of 11 (36.4%) having mTICI 2C, and 4 out of 22 (18.2%) having mTICI 3. After adjustment for relevant variables, absolute and relative IMR volumes were associated with higher National Institutes of Health Stroke Scale (NIHSS) scores at 5 days (adjusted beta =0.50 [0.05, 0.96], p = 0.03) and at 24 h (adjusted beta = 0.11 [0.02, 0.19], p = 0.01). No independent associations were found between IMR and the 90-day modified Rankin Scale (mRS).
Conclusion: IMR is present in one-quarter of patients and is associated with worse early neurological outcomes.
The no-reflow (NR) phenomenon (1) has been defined as the absence of microvascular filling after endovascular treatment (EVT). Initially identified in preclinical models of the nervous system, NR is attributed to the obstruction of arterioles and capillaries resulting from microthrombi, endothelial swelling, and pericyte contraction (2, 3). Early in vivo descriptions of NR highlighted the absence of capillary blush in selective angiograms distal to the occlusion site after EVT (4). While microthrombi and pericyte contraction are central to the NR phenomenon, other factors—such as circulatory failure or vasogenic edema—may also play a role beyond its primary scope (5). To address these broader mechanisms, the term impaired microvascular reperfusion (IMR) despite complete recanalization is currently preferred. Unlike the NR concept, IMR offers a more pragmatic framework, including all forms of persistent hypoperfusion, regardless of the underlying cause.
The earlier studies on IMR utilized digital subtraction angiography (DSA), which was performed immediately after EVT. Despite the lack of validation in preclinical models (5), perfusion imaging techniques have become the preferred method for identifying IMR, relying on persistent hypoperfusion as a surrogate marker (6). The perfusion maps used, the inclusion criteria applied, and the definition of IMR on these maps have all varied. Some studies have focused on persistent hypoperfusion in relative cerebral blood volume (rCBV) or relative cerebral blood flow rCBF maps within the infarcted area (7), while others have evaluated it as persistent regions of Tmax>6 s outside or within the infarcted tissue (8). This variability across studies helps to explain the differences in reported prevalence (0–42.9%) and its impact on functional outcomes (7–9). Recently, ter Schiphorst’s review (5) proposed a set of inclusion criteria to establish a baseline quality standard.
This study aimed to investigate the prevalence and prognostic significance of impaired microvascular perfusion in a sample of patients achieving successful angiographic recanalization after acute ischemic stroke. We hypothesized that brain perfusion abnormalities after successful EVT are common and contribute to adverse clinical outcomes in stroke patients.
This study is a part of the prospective project Futile Reperfusion in Ischemic Acute Stroke (FURIAS). The clinical and radiological protocol of the FURIAS project was detailed in a previous study (10). The comparison of the characteristics of the eligible cohort can be found in Supplementary Table 2. The Research Ethics Committee of the Germans Trias I Pujol Hospital approved the study. All the patients or their relatives provided written informed consent. We recruited consecutive patients with anterior large vessel occlusion who underwent EVT. In this group of patients, we performed MRI at three time points: at hospital arrival (MRI pre-EVT), less than 2 h after endovascular treatment (MRI post-EVT), and 5 days after the stroke (MRI on day 5). All patients had an mRS score of less than 2 before the stroke and an NIHSS score of ≥6 upon admission. Additionally, they had time from onset to admission of ≤6 h, until the publication of the DAWN trial (11). After January 2018, we recruited patients with the DAWN criteria (11).
Inclusion criteria: For this sub-study, we included patients achieving final mTICI2c or mTICI3, with adequate perfusion imaging at arrival and post-EVT. Exclusion criteria: we excluded patients with an extracranial internal carotid artery (ICA) occlusion and those who presented a hemorrhagic transformation (parenchymal hematoma; PH or hemorrhagic infarct; IH) or an arterial reocclusion on the post-EVT MRI. Patients with ICA occlusion, patients with mTICI <2C, and patients presenting reocclusion in the magnetic resonance angiogram (MRA) post-EVT were excluded because some perfusion deficit is expected in such situations. Furthermore, patients showing any hemorrhagic transformation in the post-EVT MRI were excluded because blood can produce artifacts in the perfusion sequences.
All images were performed using a 3 Tesla Siemens Magnetom Verio (Siemens, Erlangen, Germany), except for nine MRIs at 5 days that were acquired on a 1.5 Tesla Philips (Philips Healthcare, Best, Netherlands). The MRI protocol included diffusion-weighted imaging (DWI), susceptibility-weighted imaging, fluid-attenuated inversion recovery (FLAIR), Time of flight MRA, and perfusion-weighted imaging (PWI). PWI was not performed at 5 days. Further information about the imaging protocol can be found elsewhere (10).
All the images were securely stored and pseudonymized for analysis. PWI images pre- and post-EVT were processed using Olea Sphere 3.0 – SP22 software (Olea Medical, La Ciotat, France) to obtain rCBV, rCBF, Tmax, and time-to-peak maps. FMRIB’s Linear Image Registration Tool (FLIRT) was used to perform a 6-degree corregistration of the post-EVT DWI (including the segmentations above) to the PWI post-EVT maps. We used mutual information as the evaluation metric during the registration process, and all the registrations were reviewed by an expert in neuroimaging (MH).
The pre-EVT MRI was utilized to assess penumbra volumes, while the post-EVT MRI enabled the application of the definition for IMR. Additionally, the 5-day MRI was used to evaluate outcomes, including final infarct volume and hemorrhagic transformation.
A stroke neurologist expert in neuroimaging (MH) manually segmented hyperintensities on DWI pre-EVT, post-EVT, and at day 5, creating lesion masks (12). Infarct volume (mm3) at each time point was calculated from the DWI masks, and hemorrhagic transformation was assessed on the MRI at 5 days according to the European Cooperative Acute Stroke Study II (ECASS-II) classification.
We obtained pre-EVT Tmax>6 s and Tmax>10s masks by applying the corresponding thresholds (6 and 10 s) to the pre-EVT Tmax maps. Hypoperfusion intensity ratio (HIR) was calculated on the pre-EVT maps by dividing the volume of tissue with Tmax >10s by the Tmax>6 s volume.
An experienced interventional neuroradiologist (MW) blinded to the clinical and radiological data evaluated all the angiographies and recorded the final arterial revascularization status according to the mTICI scale with 2c grades (12).
Figure 1 shows the pipeline of the imaging post-processing. We obtained a specular mask of the post-EVT infarct volume in the contralateral hemisphere and calculated the median value of rCBV excluding cerebrospinal fluid. Voxels within the post-EVT infarct volume that exhibited at least a 15% reduction in the rCBV value relative to the mirrored mask volume’s median value were considered to have post-EVT hypoperfusion (7). Only clusters of more than 10 contiguous voxels with hypoperfusion were considered significant (5). All the final masks were reviewed by a vascular neurologist to discard artifacts and ensure the quality of the masks. We calculated the total volume of IMR and the median value of rCBV within IMR. Significant IMR was defined when a patient had an IMR volume beyond 5 mL. This cut-off was established based on previous literature, which suggested establishing a significant threshold (5) to evaluate perfusion deficits. All the images and masks were visually reviewed to exclude potential sequelae lesions associated with hypoperfusion.

Figure 1. Pipeline of the post-processing. (1) Rigid registration of the DWI post-EVT and its infarct segmentation to the rCBV post-EVT. (2) Post-EVT Infarct flip. (3 and 4) Obtention of the voxel values of the rCBV post-EVT in the contralateral flipped infarct and determination of the 15% threshold. (5) Threshold application within the infarct segmentation. (6) Obtention of the infarct microvascular impairment segmentation. DWI, diffusion-weighted image; EVT, endovascular treatment, rCBV, relative cerebral blood volume.
Despite the comparability of rCBV and CBF maps in terms of IMR (13), rCBV was preferred due to its consistency in our cohort and its stronger association with capillary density and microvascular integrity, as demonstrated in other neurological conditions such as gliomas (14).
The study described variables by mean (standard deviation), median (interquartile range, IQR), or absolute frequencies and percentages as appropriate. We used a paired Wilcoxon signed-rank test to compare the rCBV values in regions of interest with the contralateral side. Baseline characteristics were compared between patients with and without IMR using the chi-square, Fisher exact, or Mann–Whitney test. A Spearman’s rank correlation was conducted when evaluating associations between two quantitative variables.
We conducted multiple regression analyses to study the association between IMR (evaluated as a binary variable and as volumes) and clinical and radiological outcomes. Variables and models employed are found in Supplementary Table 1.
Statistical analysis was performed with R (22), with two-sided p-values <0.05 considered statistically significant.
All data are available upon reasonable request.
Between April 2015 and October 2018, we recruited 99 patients, out of which 33 patients were selected for analysis. Figure 2 reveals reasons for exclusion. The median (IQR) volume of infarct post-EVT and saved penumbra were 15.8 [6.23; 20.1] ml and 99.4 [50.7; 191], respectively. Infarcted and saved penumbra areas in post-EVT exhibited similar median rCBV values to their specular ROIs in the healthy hemisphere. Specifically, the infarcted region had an rCBV value of 1.54 [1.19–2.31] mL/100 g compared to 1.34 [0.96–1.79] mL/100 g for its specular ROI, p = 0.147. Similarly, the saved penumbra region had an rCBV value of 1.61 [1.10–2.05] mL/100 g, compared to 1.37 [1.13–2.00] mL/100 g for its specular ROI, with a p-value of 0.84.
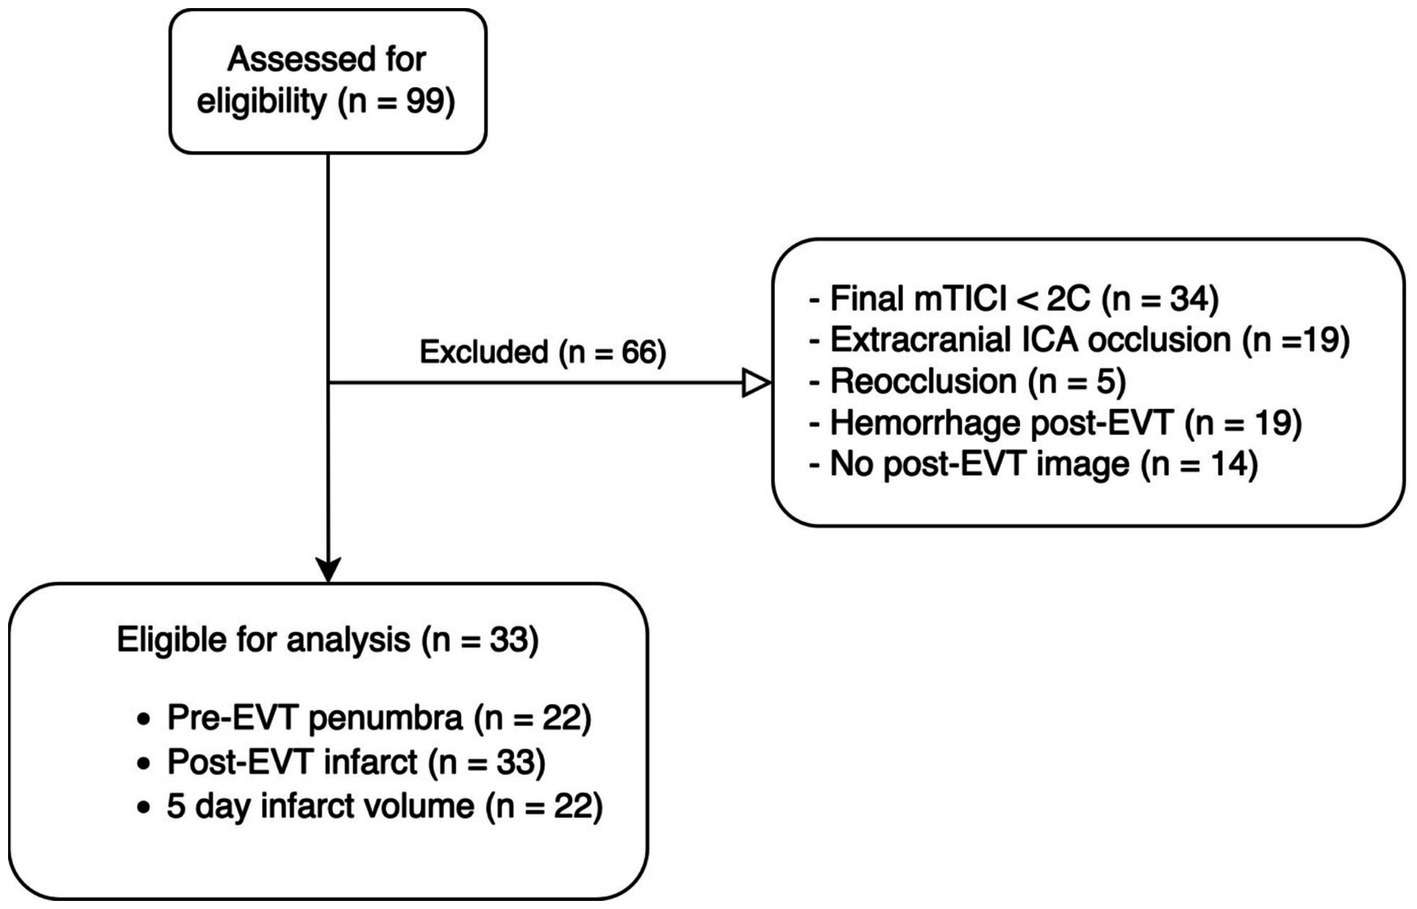
Figure 2. Consort diagram. EVT, Endovascular treatment; ICA, intracranial carotid artery; mTICI, modified Thrombolysis in Cerebral Infarction.
Out of 33 patients analyzed, only 8 displayed significant IMR areas, which accounted for 24.2% of the patients. Figure 3 displays some representative cases. A significant IMR was present in 4 out of 11 (36.4%) patients achieving mTICI2c and in 4 out of 22 (18.2%) achieving mTICI3 (p = 0.39). In the patients with significant IMR, the median (IQR) IMR volume was 14.5 [11.4; 21.5] mL, with an area that represented 43 [34; 54] % of the infarcted tissue. Moreover, the IMR voxels had a median rCBV value of 0.58 [0.13; 0.86] mL/100 g.
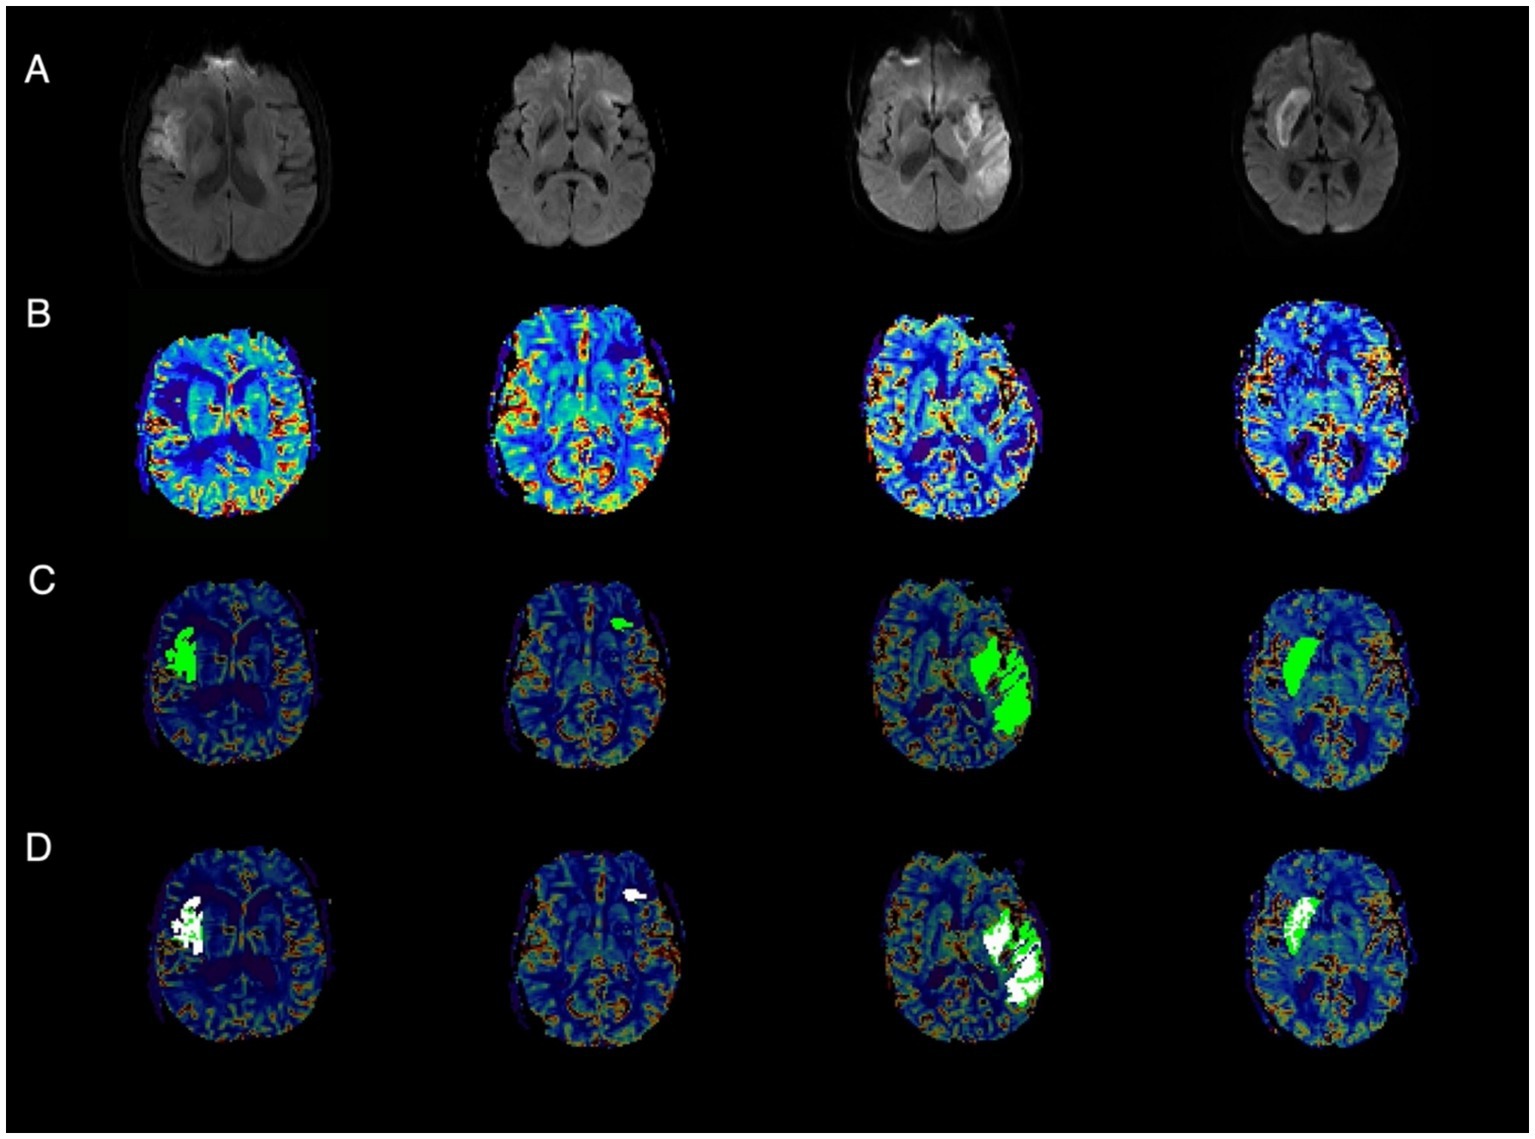
Figure 3. Representative cases of infarct microvascular impairment (IMR). (A) Post-EVT diffusion-weighted imaging (DWI); (B) Post-EVT relative cerebral blood volume (rCBV); (C) Post-EVT rCBV with overlaid infarct area (light green); (D) Post-EVT rCBV showing the infarct area (green) and regions of IMR (white).
Table 1 summarizes the baseline characteristics of the cohort and patients with significant IMR. The presence of significant IMR was associated with larger pre-EVT DWI lesions. In the adjusted analysis, the presence of significant IMR was not found to be associated with any outcome (Table 2).
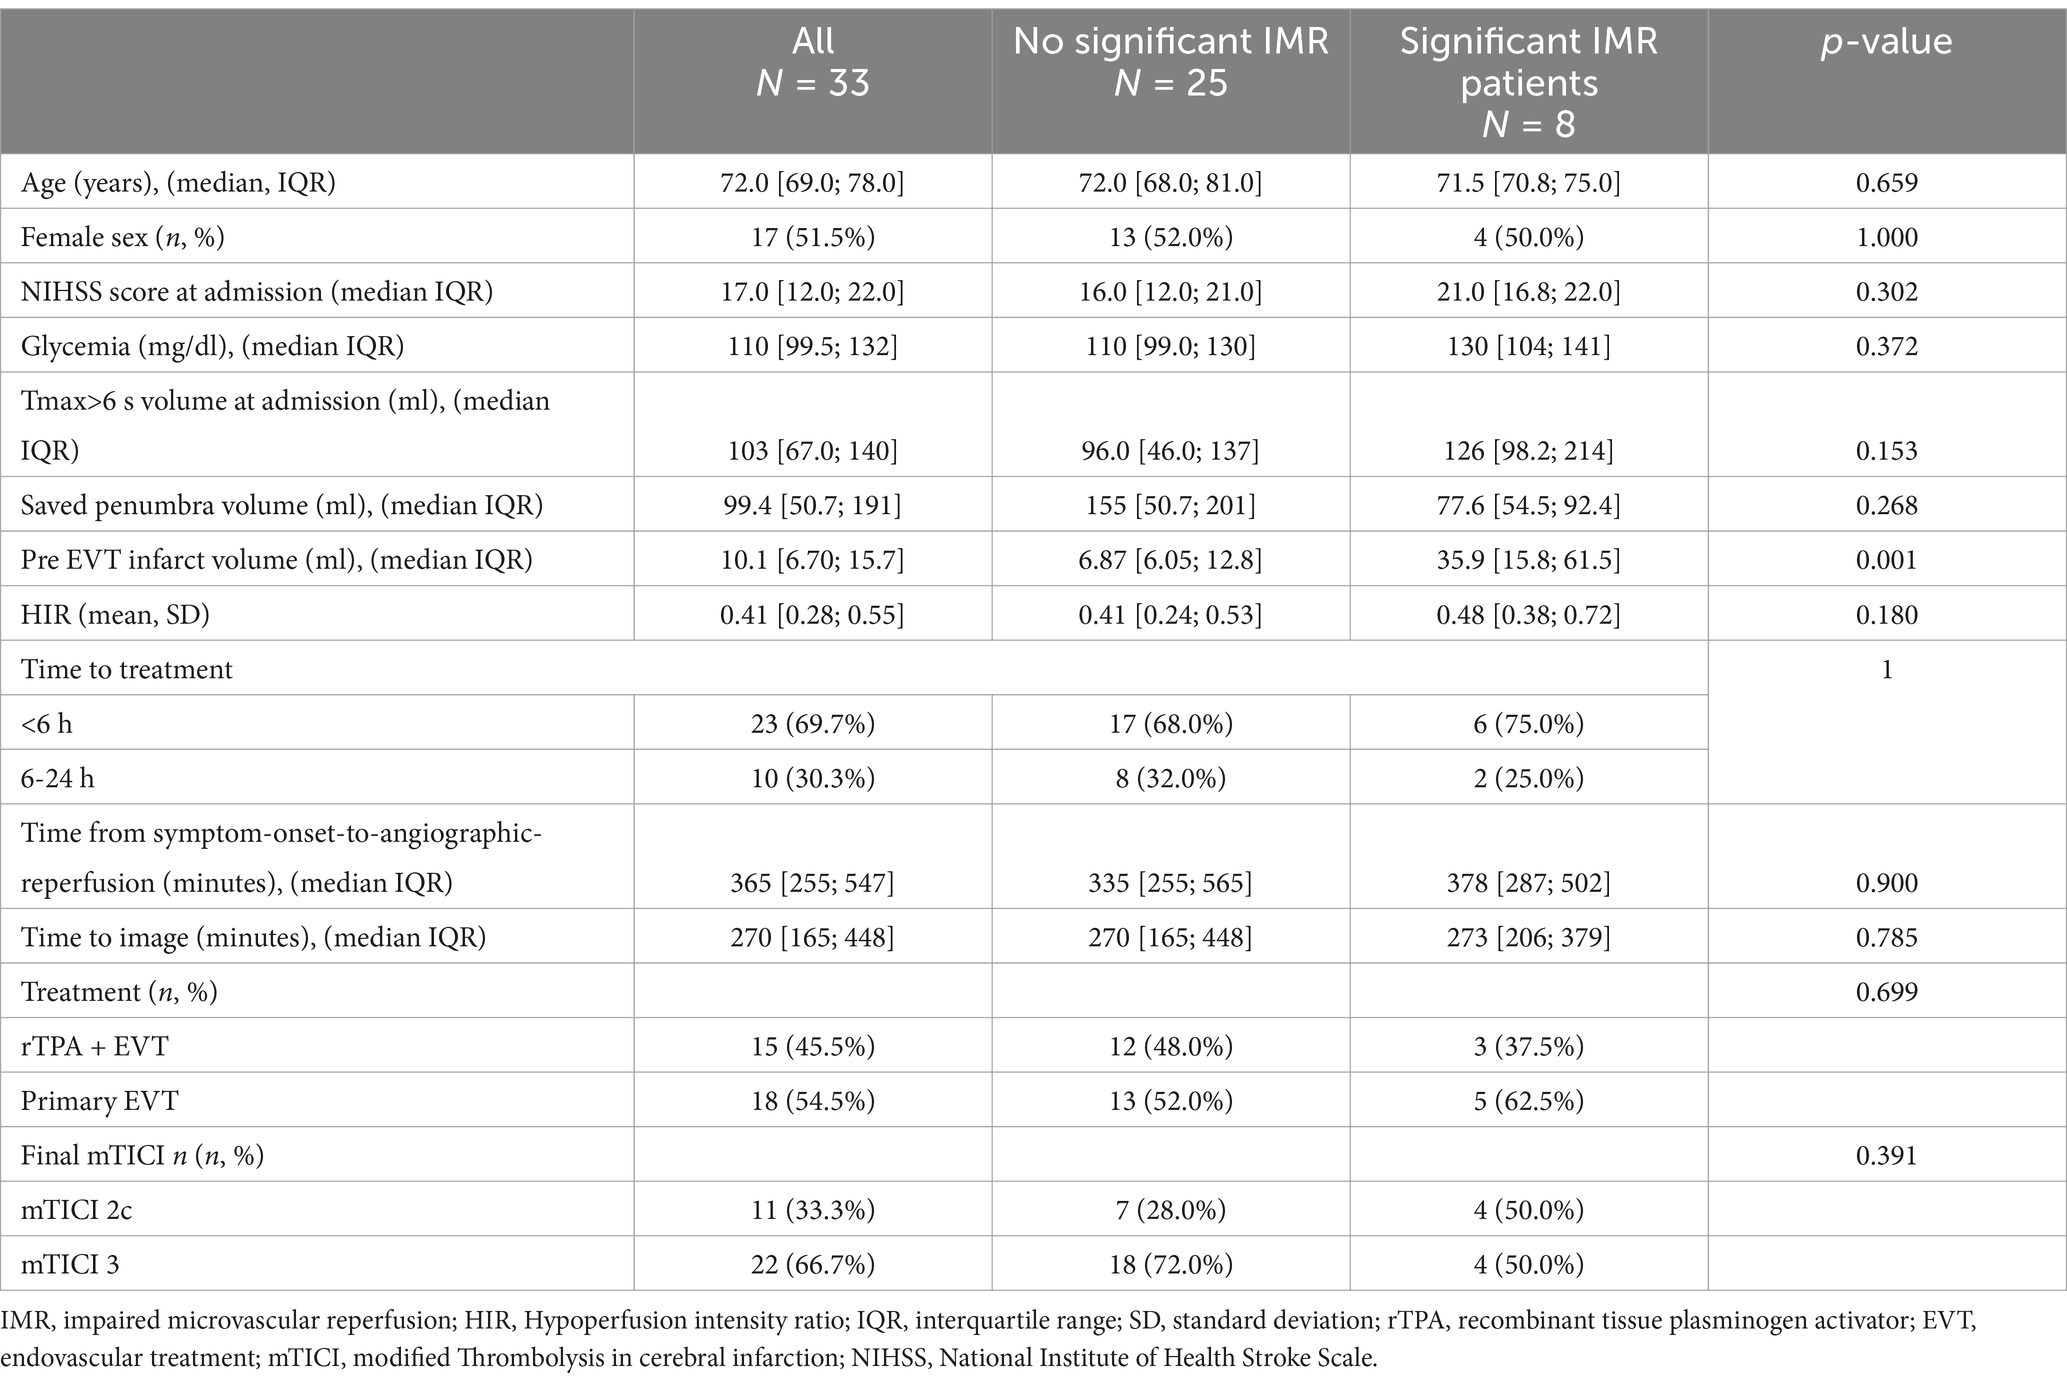
Table 1. Baseline characteristics of the patients.
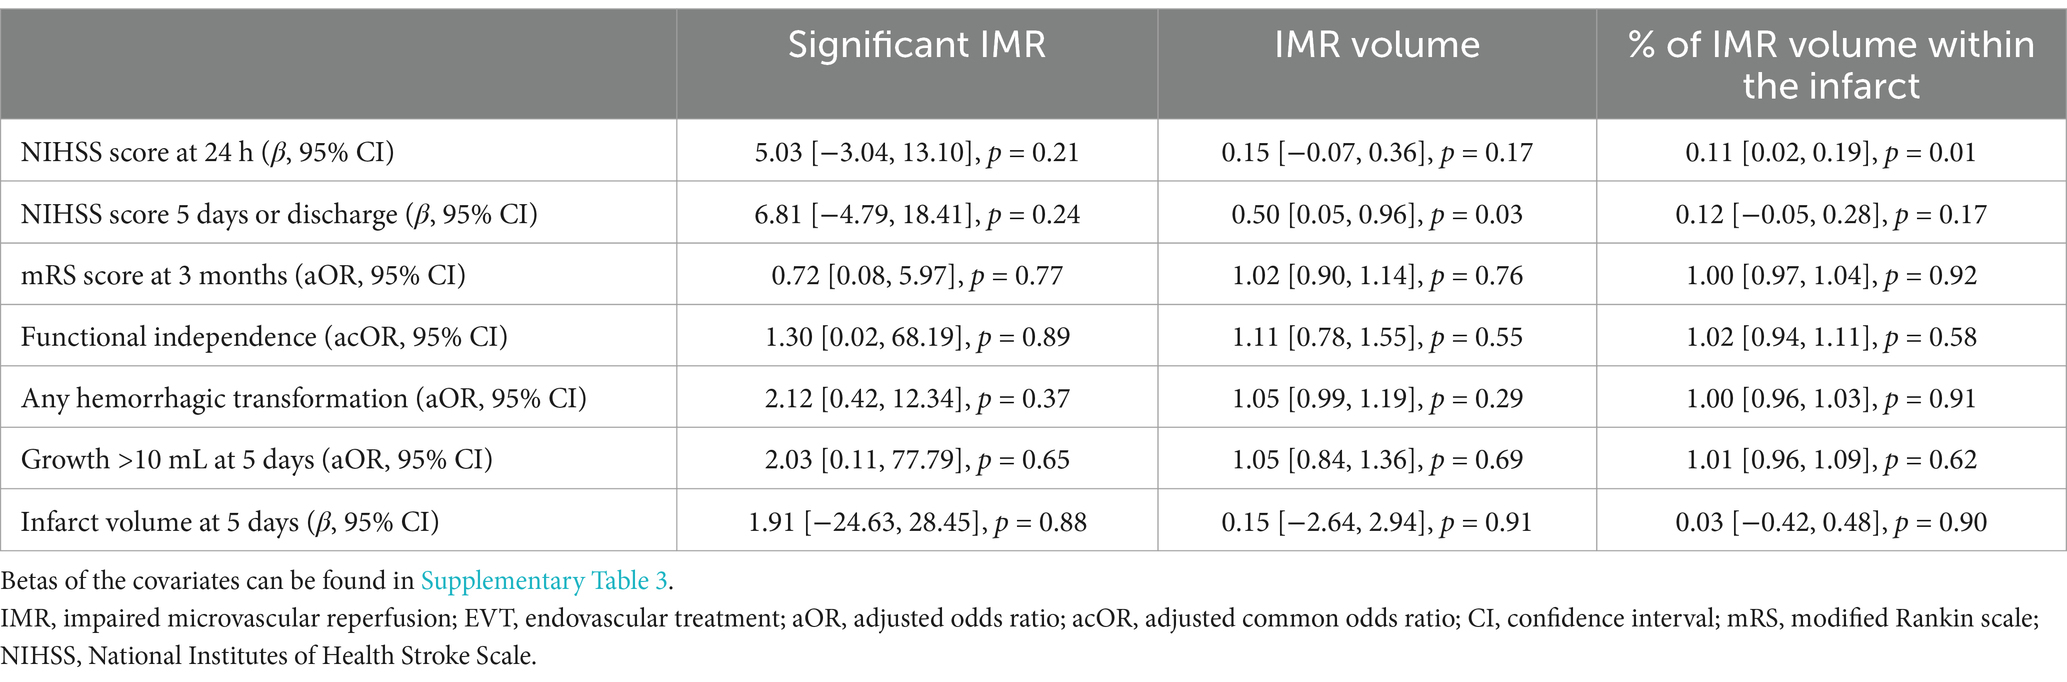
Table 2. Multiple regression analysis of IMR.
When evaluated quantitatively, IMR volume was associated with post-EVT infarct volume (rho = 0.82, p < 0.01), infarct volume at day 5 (rho = 0.63, p < 0.01), NIHSS scores at 24 h (rho = 0.57, p < 0.01) and 5 days (rho = 0.63, p < 0.01), and mRS scores at 90 days (common OR = 1.09 [1.01; 1.18], p = 0.03). In the adjusted analysis, absolute and relative IMR volume remained significantly associated with the NIHSS scores at 5 days and 24 h, respectively (Table 2).
Post-EVT rCBV values within the infarct were not linked with final mTICI, NIHSS, hemorrhagic transformation, infarct growth, use of rTPA, or functional outcome at 3 months. The IMR frequency was similar in rTPA-treated and untreated patients (5/18 (27.8%) and 3/15 (20%) p = 0.699, respectively).
Our data reveal that significant IMR is present in approximately one-quarter of patients following successful EVT. While a larger IMR volume was initially associated with a worse prognosis, this relationship did not persist after adjustment for confounding factors.
The prevalence of persistent perfusion deficits is debated; our study reported a 24.2% occurrence (18.2% in patients with final mTICI 3), contrasting with other rates ranging from 0 to 42.5% (6, 7, 15, 16). Discrepancies may arise from different imaging techniques, perfusion thresholds, timing of imaging, and inclusion criteria. Using definitions and exclusion criteria similar to previous studies (7), IMR rates in our cohort were comparable (25–29%) despite earlier imaging after recanalization.
Studies performing imaging within 30 min after EVT showed a delay exceeding Tmax >6 s in 42.5% of mTICI3 patients (6). However, these studies applied less stringent criteria, including patients with ICA occlusions (17% had tandem lesions) and post-EVT hematomas, potentially inflating IMR prevalence. In contrast, other studies using a more similar methodology than ours (7), but without excluding hemorrhagic areas, reported IMR in 25.3% of patients when imaging was acquired up to 24 h after complete recanalization. When researchers included mTICI 2c-3 patients and excluded the three possible causes of apparent persistent hypoperfusion (ICA stenosis, intracranial reocclusion, or areas of hemorrhage), the prevalence of IMR was dramatically reduced to 3.33% (16) or 0% (17).
Compared to those with similar selection criteria, our higher prevalence may be attributed to the shorter imaging acquisition time (<2 h vs. up to 24 h), the longer onset-to-recanalization time ([255–547 min] vs. [61–367 min]), and the use of a less stringent method for assessing hypoperfusion (15% reduction compared to the mirror region vs. 40% of the mirror region or visual assessment). Recent research (13) has explored the optimal methodology for evaluating IMR by comparing four different definitions (6, 7, 16, 18) in a common cohort of 131 patients. Although the reported prevalence of IMR varied widely (0.8–22.1%), the definition employed in our study (7) proved to be the most effective in predicting functional outcomes at 3 months. While we assumed a 5-mL volume threshold (5) to determine significant IMR, it has not been validated, highlighting the need to establish a volume cut-off to determine relevant IMR. Additionally, the 15% difference compared to the mirror region is supported by limited evidence (side-to-side variations of 14.5% on SPECT between healthy hemispheres are considered normal (19, 20)), emphasizing the necessity for thresholds derived from preclinical studies that also account for distinctions between white and gray matter.
Consistent with previous literature (7), we found that IMR volume was associated with higher NIHSS scores at 5 days (absolute) and 24 h (relative). Still, we could not find any significant association between other outcomes and IMR in its current definition. Other studies have shown that persistent Tmax>6 s, either inside or outside the infarct, is associated with perfusion derangement and functional outcomes (8, 18), and in a previous study of our cohort, including patients with any final mTICI, post-EVT Tmax>6 s volume was associated with infarct growth (10).
Our analysis was possibly underpowered due to the small sample size; thus, the lack of association of IMR with outcomes could be a type II error. Given the stringent exclusion criteria (with 66% of our sample being excluded) and the intrinsic complexity of conducting repeated image studies with stroke patients shortly after revascularization, overcoming this obstacle will require the implementation of a well-designed multicentric study. While the prevalence of IMR is lower than what is typically observed in clinical practice after excluding all potential causes, it is still more common than earlier studies have suggested (16, 17). The strict selection criteria inherently limit the sample size [n = 27 and n = 33 in (16, 17)], making it challenging to identify statistically significant associations. Therefore, we call for the collaboration of other centers to continue this line of research.
Our study offers several strengths. We exclusively used MRI perfusion imaging, yielding unique data on perfusion values post-EVT. Unlike previous studies (6, 7, 9) that incorporate both CT and MRI, this approach helps reduce variability. In addition, our computational approach provides precise quantification of perfusion abnormalities and infarct characteristics, minimizing subjectivity and enhancing reproducibility compared to traditional visual assessment methods. Compared to other methods that consider the whole infarct as either affected or unaffected, our approach permits the segmentation of IMR, delimiting its extent to certain areas of the infarct, which allows its quantification.
However, like other methods, this approach struggles to differentiate distinct IMR thresholds between gray and white matter. Given the lower rCBV levels in white matter, particularly in infarcts affecting both gray and white matter, our method may be less sensitive in segmenting IMR voxels in the gray matter and less specific in identifying affected voxels in the white matter. In such cases, determining a separate threshold for each tissue type would be necessary. However, due to the disruption of tissue integrity following an infarct, applying such thresholds in the infarcted area would likely be challenging.
Additionally, we defined infarct based on DWI volume within 2 h after EVT, potentially underestimating the accurate infarct volume due to partial DWI’s reversibility. Despite this, we found no differences in the presence of IMR among mTICI2c and mTICI3 grades. While we did not apply p-value corrections due to ongoing debates on their utility (21), our findings align with existing literature.
Our results emphasize the prognostic importance of post-EVT perfusion yet highlight the need for a consistent IMR definition. The dynamic nature of cerebral perfusion after reperfusion therapies complicates this effort, requiring consideration of imaging timing and thresholds. Radiological definitions should align with anatomopathological criteria, necessitating further radiological-pathological studies to establish a unified IMR concept, identify contributing factors, and develop therapeutic strategies.
In summary, IMR volume is significantly and independently associated with poor outcomes in ischemic stroke patients. However, additional research is required to validate these findings and investigate optimal timing and definitions of IMR.
This article was presented as a poster at the ESOC (European Stroke Organization Conference) 2023.
The raw data supporting the conclusions of this article will be made available by the authors, without undue reservation.
The studies involving humans were approved by the Research Ethics Committee of the Germans Trias I Pujol Hospital. The studies were conducted in accordance with the local legislation and institutional requirements. The participants provided their written informed consent to participate in this study.
AV: Conceptualization, Data curation, Formal analysis, Investigation, Methodology, Software, Writing – original draft, Writing – review & editing. AP: Data curation, Investigation, Writing – review & editing. CL: Data curation, Investigation, Writing – review & editing. MW: Writing – review & editing. LD: Writing – review & editing. SR: Writing – review & editing. JM: Writing – review & editing. JP: Writing – review & editing. YS: Writing – review & editing. NP: Writing – review & editing. MG: Writing – review & editing. AB: Writing – review & editing. CC: Writing – review & editing. LM: Funding acquisition, Project administration, Resources, Writing – review & editing. SD: Writing – review & editing. MT: Writing – review & editing. MM: Funding acquisition, Writing – review & editing. MH-P: Data curation, Formal analysis, Funding acquisition, Investigation, Methodology, Resources, Supervision, Writing – original draft, Writing – review & editing.
The author(s) declare that financial support was received for the research, authorship, and/or publication of this article. The study was funded by project “PI21/01548”, Instituto de Salud Carlos III and co-funded by European Union (ERDF, “A way to make Europe” and project “RD21/0006/0024”, Instituto de Salud Carlos III and the Next Generation EU funds that finance the actions of the Recovery and Resilience Mechanism (MRR).
The authors declare that the research was conducted in the absence of any commercial or financial relationships that could be construed as a potential conflict of interest.
The authors declare that Generative AI was used in the creation of this manuscript. The authors used ChatGPT 4.0 to improve the readability and language of the manuscript. After using this tool, the authors reviewed and edited the content as needed and take full responsibility for the content of the published article.
All claims expressed in this article are solely those of the authors and do not necessarily represent those of their affiliated organizations, or those of the publisher, the editors and the reviewers. Any product that may be evaluated in this article, or claim that may be made by its manufacturer, is not guaranteed or endorsed by the publisher.
The Supplementary material for this article can be found online at: https://www.frontiersin.org/articles/10.3389/fneur.2025.1478240/full#supplementary-material
1. Fischer, EG, and Ames, A. Studies on mechanisms of impairment of cerebral circulation following ischemia: effect of hemodilution and perfusion pressure. Stroke. (1972) 3:538–42. doi: 10.1161/01.STR.3.5.538
2. Dalkara, T, and Arsava, EM. Can restoring incomplete microcirculatory reperfusion improve stroke outcome after thrombolysis? J Cereb Blood Flow Metab. (2012) 32:2091–9. doi: 10.1038/jcbfm.2012.139
3. Kaesmacher, J, Dobrocky, T, Heldner, MR, Bellwald, S, Mosimann, PJ, Mordasini, P, et al. Systematic review and meta-analysis on outcome differences among patients with TICI2b versus TICI3 reperfusions: success revisited. J Neurol Neurosurg Psychiatry. (2018) 89:910–7. doi: 10.1136/jnnp-2017-317602
4. Arsava, EM, Arat, A, Topcuoglu, MA, Peker, A, Yemisci, M, and Dalkara, T. Angiographic microcirculatory obstructions distal to occlusion signify poor outcome after endovascular treatment for acute ischemic stroke. Transl Stroke Res. (2018) 9:44–50. doi: 10.1007/s12975-017-0562-2
5. Ter Schiphorst, A, Turc, G, Hassen, WB, Oppenheim, C, and Baron, JC. Incidence, severity and impact on functional outcome of persistent hypoperfusion despite large-vessel recanalization, a potential marker of impaired microvascular reperfusion: systematic review of the clinical literature. J Cereb Blood Flow Metab. (2024) 44:38–49. doi: 10.1177/0271678X231209069
6. Rubiera, M, Garcia-Tornel, A, Olivé-Gadea, M, Campos, D, Requena, M, Vert, C, et al. Computed tomography perfusion after Thrombectomy: an immediate surrogate marker of outcome after recanalization in acute stroke. Stroke. (2020) 51:1736–42. doi: 10.1161/STROKEAHA.120.029212
7. Ng, FC, Churilov, L, Yassi, N, Kleinig, TJ, Thijs, V, Wu, T, et al. Prevalence and significance of impaired microvascular tissue reperfusion despite macrovascular angiographic reperfusion (no-reflow). Neurol Int. (2022) 98:E790–801. doi: 10.1212/WNL.0000000000013210
8. Laredo, C, Rodríguez, A, Oleaga, L, Hernández-Pérez, M, Renú, A, Puig, J, et al. Adjunct thrombolysis enhances brain reperfusion following successful Thrombectomy. Ann Neurol. (2022) 92:860–70. doi: 10.1002/ana.26474
9. Soares, BP, Tong, E, Hom, J, Cheng, SC, Bredno, J, Boussel, L, et al. Reperfusion is a more accurate predictor of follow-up infarct volume than recanalization: a proof of concept using CT in acute ischemic stroke patients. Stroke. (2010) 41:766. doi: 10.1161/STROKEAHA.109.568766
10. Hernández-Pérez, M, Werner, M, Remollo, S, Martín, C, Cortés, J, Valls, A, et al. Early and delayed infarct growth in patients undergoing mechanical Thrombectomy: a prospective, serial MRI study. Stroke. (2022) 54:217–25. doi: 10.1161/STROKEAHA.122.039090
11. Nogueira, RG, Jadhav, AP, Haussen, DC, Bonafe, A, Budzik, RF, Bhuva, P, et al. Thrombectomy 6 to 24 hours after stroke with a mismatch between deficit and infarct. N Engl J Med. (2018) 378:11–21. doi: 10.1056/NEJMoa1706442
12. Goyal, M, Fargen, KM, Turk, AS, Mocco, J, Liebeskind, DS, Frei, D, et al. 2C or not 2C: defining an improved revascularization grading scale and the need for standardization of angiography outcomes in stroke trials. J Neurointerv Surg. (2014) 6:83–6. doi: 10.1136/neurintsurg-2013-010665
13. Mutimer, CA, Mujanovic, A, Kaesmacher, J, Churilov, L, Kleinig, TJ, Parsons, MW, et al. Comparison of perfusion imaging definitions of the no-reflow phenomenon after Thrombectomy-what is the best perfusion imaging definition? Ann Neurol. (2024) 96:1104–14. doi: 10.1002/ana.27073
14. Server, A, Graff, BA, Orheim, TED, Schellhorn, T, Josefsen, R, Gadmar, ØB, et al. Measurements of diagnostic examination performance and correlation analysis using microvascular leakage, cerebral blood volume, and blood flow derived from 3T dynamic susceptibility-weighted contrast-enhanced perfusion MR imaging in glial tumor grading. Neuroradiology. (2011) 53:435–47. doi: 10.1007/s00234-010-0770-x
15. Marks, MP, Lansberg, MG, Mlynash, M, Kemp, S, Mctaggart, RA, Zaharchuk, G, et al. Angiographic outcome of endovascular stroke therapy correlated with MR findings, infarct growth, and clinical outcome in the DEFUSE 2 trial. Int J Stroke. (2014) 9:860–5. doi: 10.1111/ijs.12271
16. Ter Schiphorst, A, Charron, S, Ben, HW, Provost, C, Naggara, O, Benzakoun, J, et al. Tissue no-reflow despite full recanalization following thrombectomy for anterior circulation stroke with proximal occlusion: a clinical study. J Cereb Blood Flow Metab. (2021) 41:253–66. doi: 10.1177/0271678X20954929
17. Luijten, SPR, Bos, D, van Doormaal, PJ, Goyal, M, Dijkhuizen, RM, Dippel, DWJ, et al. Cerebral blood flow quantification with multi-delay arterial spin labeling in ischemic stroke and the association with early neurological outcome. Neuroimage Clin. (2023) 37:103340. doi: 10.1016/j.nicl.2023.103340
18. Bai, X, Yu, F, Tian, Q, Li, W, Sha, A, Cao, W, et al. Clinical significance and influencing factors of microvascular tissue reperfusion after macrovascular recanalization. Transl Stroke Res. (2022) 14:446–54. doi: 10.1007/s12975-022-01053-0
19. Chatterjee, NR, Ansari, SA, Vakil, P, Prabhakaran, S, Carroll, TJ, and Hurley, MC. Automated analysis of perfusion weighted MRI using asymmetry in vascular territories. Magn Reson Imaging. (2015) 33:618–23. doi: 10.1016/j.mri.2015.01.009
20. Baird, AE, Donnan, GA, Austin, MC, Hennessy, OF, Royle, J, and McKay, WJ. Asymmetries of cerebral perfusion in a stroke-age population. J Clin Neurosci. (1999) 6:113–20. doi: 10.1016/S0967-5868(99)90075-9
21. Gelman, A, Hill, J, and Yajima, M. Why we (usually) don’t have to worry about multiple comparisons. J Res Educ Eff. (2012) 5:189–211. doi: 10.1080/19345747.2011.618213
22. R Core Team. (2022). R: A language and environment for statistical computing. R Foundation for Statistical Computing, Vienna, Austria. Available at: https://www.R-project.org/
Keywords: no-reflow, perfusion imaging, MRI, ischemic stroke, reperfusion
Citation: Valls Carbó A, Palomar A, Laredo C, Werner M, Dorado L, Remollo S, Munuera J, Puig J, Silva Y, Pérez de la Ossa N, Gomis M, Bustamante A, Castaño C, Muñoz L, Domenech S, Terceño M, Millán M and Hernández-Pérez M (2025) Relevance of persistent perfusion deficits on clinical outcomes after successful endovascular treatment: a prospective serial magnetic resonance study. Front. Neurol. 16:1478240. doi: 10.3389/fneur.2025.1478240
Edited by:
Jean-Claude Baron, University of Cambridge, United KingdomReviewed by:
Wenbo Zhao, Capital Medical University, ChinaCopyright © 2025 Valls Carbó, Palomar, Laredo, Werner, Dorado, Remollo, Munuera, Puig, Silva, Pérez de la Ossa, Gomis, Bustamante, Castaño, Muñoz, Domenech, Terceño, Millán and Hernández-Pérez. This is an open-access article distributed under the terms of the Creative Commons Attribution License (CC BY). The use, distribution or reproduction in other forums is permitted, provided the original author(s) and the copyright owner(s) are credited and that the original publication in this journal is cited, in accordance with accepted academic practice. No use, distribution or reproduction is permitted which does not comply with these terms.
*Correspondence: María Hernández-Pérez, bWhlcm5hbmRlekBpZ3RwLmNhdA==
Disclaimer: All claims expressed in this article are solely those of the authors and do not necessarily represent those of their affiliated organizations, or those of the publisher, the editors and the reviewers. Any product that may be evaluated in this article or claim that may be made by its manufacturer is not guaranteed or endorsed by the publisher.
Research integrity at Frontiers
Learn more about the work of our research integrity team to safeguard the quality of each article we publish.