
94% of researchers rate our articles as excellent or good
Learn more about the work of our research integrity team to safeguard the quality of each article we publish.
Find out more
ORIGINAL RESEARCH article
Front. Neurol., 19 February 2025
Sec. Neurorehabilitation
Volume 16 - 2025 | https://doi.org/10.3389/fneur.2025.1434733
 Jin Wang1,2,3†
 Zhilin Shu4†
 Yue Wang1Jiewei Lu4
 Xinyuan Zhang1
 Yuanyuan Cheng5Yang Yu5
 Jianda Han4,6
 Zhizhong Zhu5*
 Ningbo Yu4,6*
 Jialing Wu1,2,3,5*
Introduction: Cognitive decline is common in Parkinson’s disease (PD). Reliance on neuropsychological testing alone can lead to delayed identification, and an objective and comprehensive approach is needed in clinical practice. We assessed brain functional connectivity during PD-MCI (mild cognitive impairment) and PD-NC (normal cognition) patients, and healthy controls (HC) completing the Stroop color-word test (SCWT) using functional near-infrared spectroscopy (fNIRS), and explored the predictive value of combining relevant brain function and behavioral information for general cognitive decline in PD.
Methods: Nineteen patients with PD-MCI, 21 with PD-NC and 33 age-matched HC were recruited. Group differences in executive performance and prefrontal functional connectivity were analyzed. Receiver operating characteristic analysis was used to measure the value of combining brain functional connectivity with executive and motor function in predicting PD-MCI.
Results: During the color-word incongruent test, PD-MCI patients had significantly lower correct rate than HC and PD-NC patients. Meanwhile, PD-MCI patients exhibited significantly increased regional strength of the left and right prefrontal cortex (RSl, RSr), and global efficiency than HC, and compared with PD-NC, PD-MCI patients showed significantly higher RSr. For PD patients, MMSE score and correct rate during the color-word incongruent test were negatively associated with the RSr after adjusting for education level and age. After combined the RSr, correct rate and MDS-UPDRS III score, diagnostic sensitivity and specificity of PD-MCI reached 0.737 and 0.810, respectively, with an area under the curve of 0.830.
Conclusion: We proposed a signature combining brain functional connectivity with executive and motor function for general cognitive decline in PD, which could provide new insights into early detection and intervention of this problem.
Cognitive decline including mild cognitive impairment (MCI) and dementia is frequently found in patients with Parkinson’s disease (PD). PD-MCI is an independent risk factor for dementia and is considered a critical stage of rehabilitation treatment (1). PD-MCI involves multiple domains like executive function, visuospatial and memory abilities and is characterized by executive deficits, including impaired conflict detection, selective attention, and inhibitory functions, which may have significant adverse effects on patients’ social functioning and quality of life (2). In addition, there is a strong correlation between impaired executive function and decreased motor capacity in PD. (3) For example, Nie et al. (4) collected 234 non-dementia PD patients for analysis of relevant risk factors of PD-MCI, and found that increased UPDRS-III score (OR: 1.032; 95%CI: 1.008–1.057; p = 0.01) was a risk factor for PD-MCI. A meta-analysis by Baiano et al. (1) demonstrated that PD-MCI patients had worse motor symptoms than non-PD-MCI patients, and the ES was significantly positive (=0.40). However, PD-MCI is often overlooked by patients, their families, and even clinicians due to patients’ retained functional independence and more prominent motor symptoms. Additionally, the potentially lagging changes in neuropsychological tests, when compared with those in brain function, may also impede the early identification of the disease (5). Hence, developing an improved and objective method combining relevant brain function and behavioral features to evaluate PD-MCI is of great importance.
Functional connectivity (FC) analysis can reflect the communication between different brain regions. A few resting-state functional MRI (rs-fMRI) researches have suggested that patients with PD-MCI demonstrate increased FC between right inferior frontal gyrus and posterior cingulate cortex (6, 7), and cognitive training can help PD patients save brain resources (8). Moreover, De Micco et al. (9) showed that FC within frontal, parietal, temporal, sensorimotor and occipital networks using rs-fMRI could independently predict cognitive progression at 2-year follow-up.
However, there is limited information regarding cortical FC of specific areas during cognitive processes in PD. In the past few years, functional near-infrared spectroscopy (fNIRS) has been increasingly applied in cortical activation and neural networks researches with its unique advantages of task suitability, and our team’s previous study has shown its effectiveness on reflecting cognitive impairment (10). But at that time, the cortical abnormalities caused by PD itself were not fully considered, so the PD-NC (normal cognition) group was not included, and the inclusion of brain channels was not targeted enough. Therefore, we could use fNIRS to study FC in the prefrontal cortex (PFC) networks, a core brain region responsible for executive function, during the Stroop color-word test (SCWT) in PD-MCI and PD-NC patients.
Consequently, we aimed to study the characteristics of brain FC during cognitive tasks in PD patients and explore the diagnostic value of its combination with other necessary features for PD-MCI.
Our study enrolled 40 patients with PD from the out- and inpatient departments of Tianjin Huanhu Hospital and 33 healthy controls (HC) were recruited from among the patients’ caregivers. All patients were clinically diagnosed with PD according to the criteria of MDS (2015) (11) and did not meet Parkinson’s disease dementia (12). The criteria for inclusion for PD patients were: aged ≥50 years; at Hoehn and Yahr (H&Y) stages I to III in their “off” state; received stable medication for more than 2 months; able to understand and coordinate with the entire examination and testing process; and being right-handed. Exclusion criteria comprised: being illiterate; having color vision disorders; suffering from Parkinson’s disease psychosis, like hallucinations; obvious depression (Beck Depression Inventory (BDI) score > 13); recent use of anticholinergic or other drugs affecting cognition; serious motor complications; prior deep brain stimulation surgeries; and histories of stroke, hypothyroidism, hydrocephalus or other diseases that may affect cortical blood flow and cognition. All participants in the HC group were also ≥50 years old, right-handed, not illiterate, free from color vision disorders, not in an obvious depressive state, had no histories of diseases affecting cortical blood flow, and demonstrated good compliance. Moreover, neither the participants themselves nor their families reported any cognitive decline in the HC group.
The enrolled PD patients were divided into PD-MCI group and PD-NC group. PD-MCI was determined using the MDS Task Force Level I criteria (13): (1) gradual decline in cognitive function based on PD as reported by patients or observers; (2) MoCA (Beijing Version) confirmed evidence of objective cognitive impairment. Based on a large-scale epidemiological survey in China, the cutoff point was set at 19/20 for individuals whose schooling duration was ≤6 years and 24/25 for those with ≥7 years of education (14); (3) and although they may have some difficulty in processing complex functional tasks, cognitive dysfunction was not sufficient to significantly affect their functional independence. Patients who did not meet PD-MCI were assigned to the PD-NC group. Correspondingly, the healthy subjects we finally included also did not meet the MCI criteria. Specifically, the MoCA threshold followed the same rules as those for PD-MCI.
The sample size was computed using G*Power v3.1.9.2. An estimated sample size of 66 subjects was deemed sufficient. However, considering the potential for missing data, a total of 73 subjects were enrolled in this study, which means an increase of approximately 10%.
The Ethics Committee of Tianjin Huanhu Hospital approved this study, which was then registered in the Chinese Clinical Trial Registry. Before participating in the research, all subjects gave their written informed consent.
The experimental procedure is illustrated in Figure 1. All PD patients (in the “off” state) and HC independently completed the computerized SCWT. For all subjects, the same experimenter controlled the computer. The test required them to read the colors (including red, yellow, green and blue) in which the words “red,” “yellow,” “green,” or “blue” in the middle of the screen were written, rather than the words themselves. Once a word was read out, the next one was showed immediately. Color-word congruent or incongruent test denoted that color of words exactly coincided with or differed from the meanings of the words. Each subject was required to have an average correct rate of >60% by training. And after a rest for 30 s, three blocks were conducted, with each followed by a 30-s of rest. Each block contained one color-word congruent test, one color-word incongruent test and a rest between them with each lasting 30 s. Color-word congruent and incongruent tests were generated randomly. In addition, the background of the screen was always black, and the experiment was conducted in a controlled laboratory setting to minimize potential environmental effects. Moreover, the amounts of total responses and correct responses, and correct rate during the color-word congruent and incongruent tests were calculated, respectively.
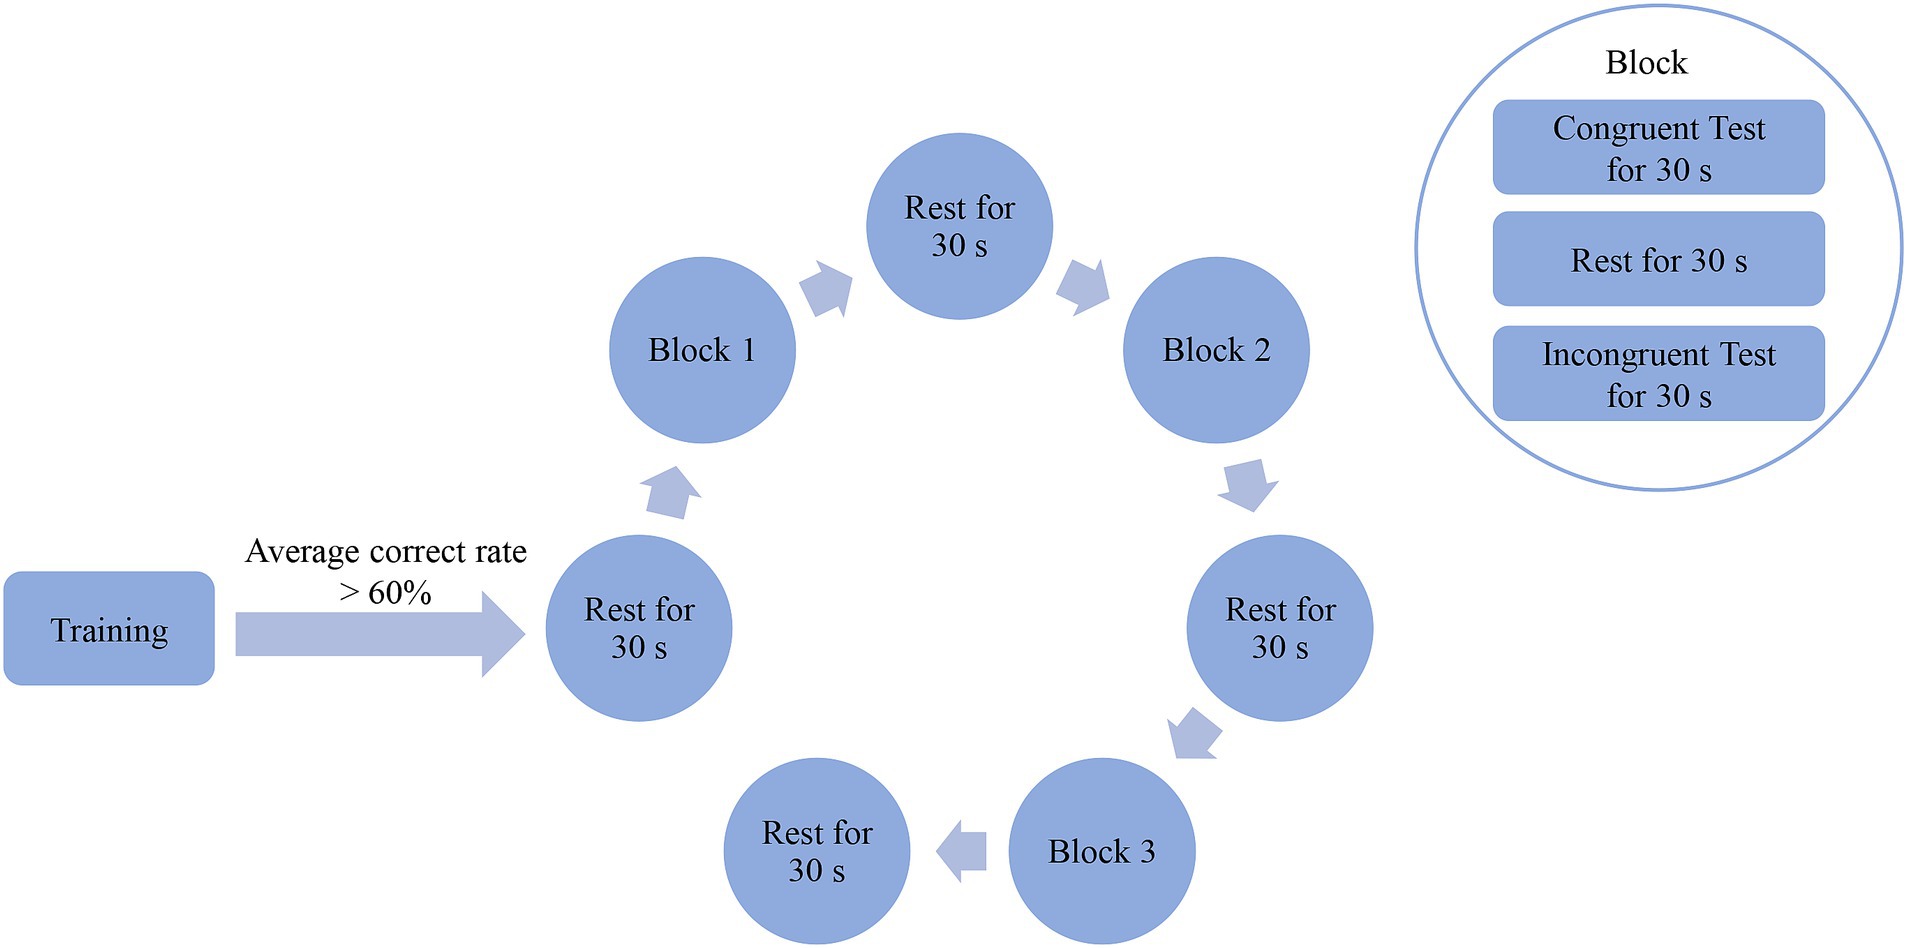
Figure 1. Entire experimental procedure of the SCWT. Subjects were required to read the colors (including red, yellow, green and blue) in which words (red, yellow, green or blue) on the middle of the screen were written rather than words themselves. Color-word congruent or incongruent test denoted that colors of words exactly coincided with or differed from meanings of words themselves. Each subject was required to have an average correct rate of >60% by training. And after a rest for 30 s, three blocks were conducted with each followed by a 30-s of rest. Each block contained one color-word congruent test, one color-word incongruent test and a rest between them with each lasting 30 s. Color-word congruent and incongruent tests were generated randomly.
fNIRS scanning was performed using a wireless continuous-wave system (Nirsmart, produced by Danyang Huichuang Medical Equipment Co., Ltd.) when participants performing the SCWT. The system made use of near-infrared light at 730 and 850 nm to gauge the optical intensities of oxygenated hemoglobin (HbO2) and deoxygenated hemoglobin (HbR) at a rate of 11 samples per second. 6 sources, 6 detectors and the resulting 14 channels were placed on the left and right PFC (LPFC, RPFC). The source-detector distance was 3 cm. The instrument was designed in accordance with the three-dimensional positioning algorithm and international 10–20 electrode placement system. This is illustrated in Figure 2. The identification of interest regions was grounded on the standardized cap sizes to accommodate various cephalic circumferences.
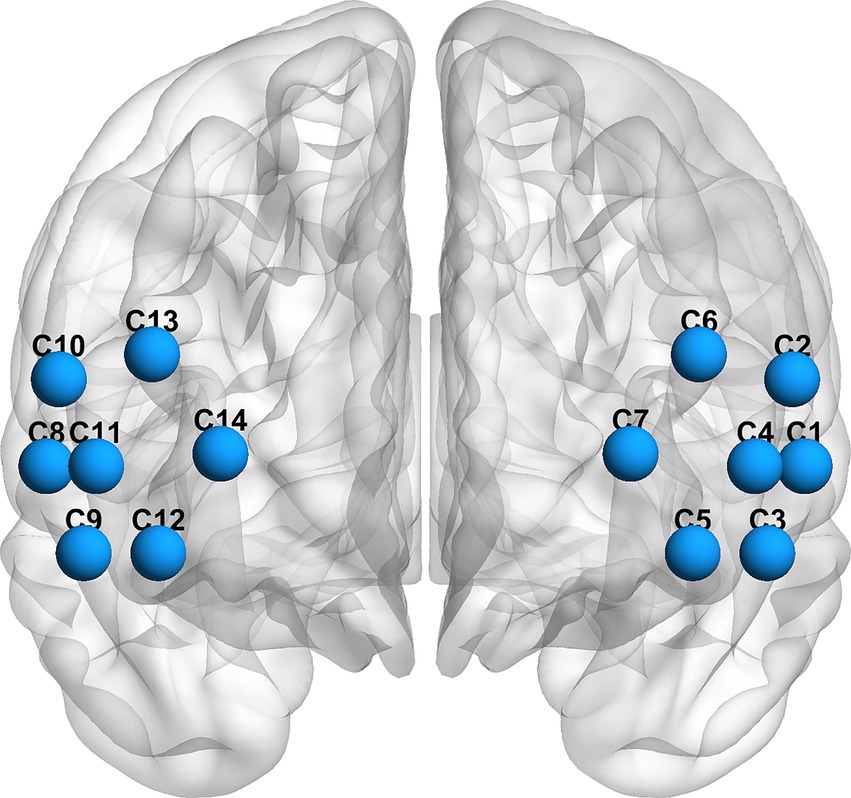
Figure 2. Deployments of the fNIRS channels in LPFC and RPFC.
For the raw fNIRS data, two methods were used to remove the motion artifacts: moving standard deviation and spline interpolation. Subsequently, a bandpass filter between 0.01–0.2 Hz was used to suppress physiological noise such as pulse, respiration, and baseline drift. Then, HbO2 concentration variations were computed using the modified Beer–Lambert law. Finally, the HbO2 data for the task periods were extracted for further analysis.
The HbO2 data of each kind of SCWT, congruent or incongruent, was divided into three 30-s epochs of the task periods and averaged to form a new 30-s epoch. Pearson’s correlation coefficient (PCC) between each pair of channels was calculated for the averaged epoch to reflect the functional correlation of the brain regions. Given two HbO2 data, and , the PCC values ( ) was calculated as follows:
Where, represents the covariance between and and denote the standard deviations of and respectively.
Fisher’s Z-transformation was applied to transform values to values, namely -transformed PCC values between and , which normalized the distribution and decreased the skewness.
Considering that the meaning of negative connections was not yet well-defined, and given that our focus was on the integration of brain information during cognitive tasks, all negative connections and self - connections were set to zero.
A network was constructed when channels were regarded as nodes and the PCC values between every two channels were treated as edges. In this study, three indices were introduced to quantify the characteristics of brain networks: regional strength ( ), global efficiency ( ) and clustering coefficient ( ).
is considered to reflect the strength of connections between a brain region and other brain regions and within the region itself (15). It was worked out as follows:
Where, refers to the degree of node , and indicate the set of all nodes belonging to a certain region and the number of nodes, respectively.
GE is a measure of the functional integration of brain networks (16). It was calculated as follows:
Where, stands for the inverse of the average shortest path length between each of the two channels ( and ), and are the collections of all nodes and the total node count, respectively.
CC was introduced to depict the local efficiency of information transfer (17). It was defined as follows:
Where, signifies the number of triangles that can be formed between node and its neighboring nodes.
The FC was analyzed using MATLAB (2018b, MathWorks, Natick, Massachusetts) and the measures was derived using Brain Connectivity Toolbox.
The Shapiro–Wilk test was used to check whether the data within each group followed a normal distribution, if necessary. Normally distributed data, were expressed by means (standard deviations); if not, by medians (lower quartiles-upper quartiles). The t-test, one-way analysis of variance (ANOVA), chi-square, Mann–Whitney U, Kruskal-Wallis and Wilcoxon signed-rank tests were used to assess between-group differences in the demographic, clinical, neuropsychological, and FC data. Bonferroni’s adjustment was used for multiple comparisons between the groups. Multiple linear regression method was used to examine the relationship between FC and MMSE scores, MoCA scores as well as executive performance during the SCWT. PD-MCI was taken as the gold standard to draw the receiver operating characteristic (ROC) curve. The area under the curve (AUC) was calculated to evaluate the quality of each predictor. p ≤ 0.05 was considered statistically significant. The data were analyzed using SPSS version 25 for Windows.
In this study, a total of 73 participants were enrolled, including 33 HC, 21 patients with PD-NC and 19 with PD-MCI. The demographic, neuropsychological and clinical data are presented in Table 1. There were 12 patients with PD at H&Y stage II and 28 at stage III, with an average MDS-UPDRS III score at 35.53 (13.17). No significant differences regarding age or sex were identified among the three groups. In terms of education, the years of schooling in PD-NC group were significantly higher than those of the HC group (p = 0.016) and PD-MCI group (p = 0.019). Patients with PD-MCI had significantly lower MMSE (p = 0.004, p < 0.001, respectively) and MoCA scores (p < 0.001, respectively) than HC and PD-NC patients. Patients with PD-MCI exhibited significantly higher proportion of H&Y stage III and higher MDS-UPDRS III scores than PD-NC patients (p = 0.011, p = 0.010, respectively). There were no statistically significant differences in disease duration, side of more affected limb, or levodopa equivalent daily dosage (LEDD) between the PD-NC and PD-MCI groups.
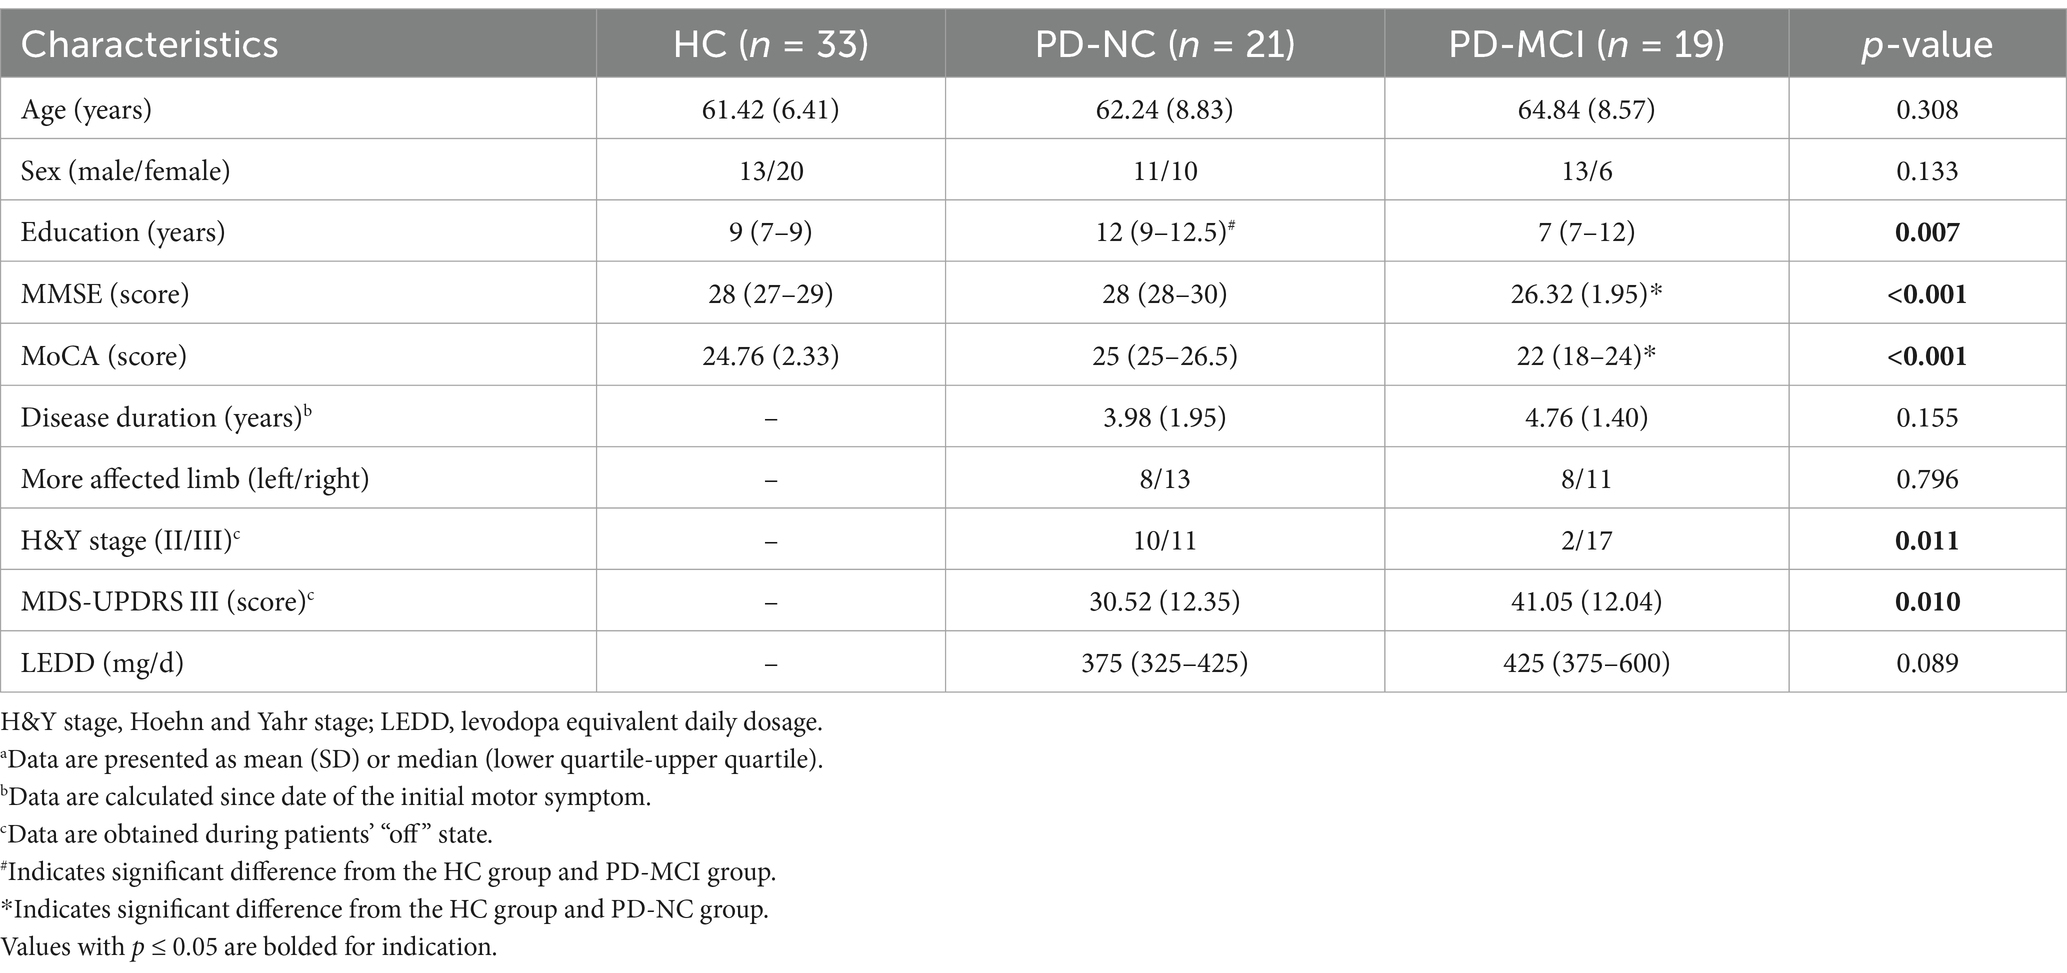
Table 1. Comparisons of demographic, neuropsychological and clinical characteristics among HC, PD-NC and PD-MCI groupsa.
A detailed summary of cognitive performance during the SCWT for HC and patients with PD-NC and PD-MCI is provided in Table 2. As expected, amounts of total responses and correct responses, and correct rate in the color-word congruent test were significantly higher than those in the incongruent condition for the HC (p < 0.001, p < 0.001, p = 0.001), PD-NC (p < 0.001, respectively) and PD-MCI groups (p < 0.001, respectively), indicating the Stroop effect. None of the measures of cognitive performance in the congruent condition were statistically significant among the three groups. However, during the color-word incongruent test, patients with PD-MCI exhibited significantly worse performance with reduced correct rate, compared to HC (p = 0.001) and patients with PD-NC (p = 0.046).
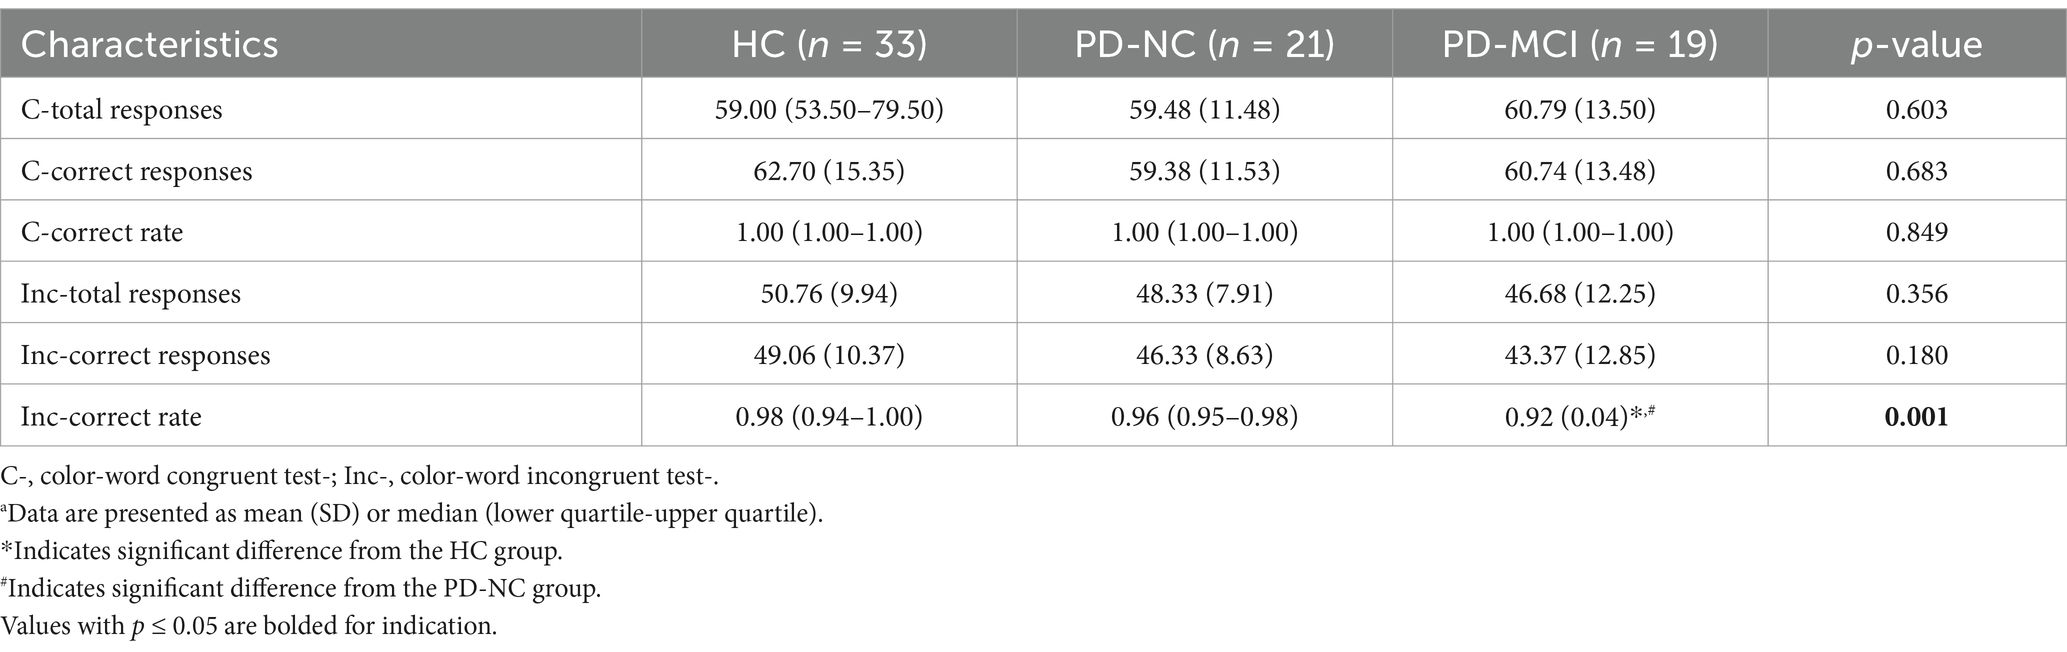
Table 2. Comparison of cognitive performance during the SCWT among HC, PD-NC and PD-MCI groupsa.
In terms of FC measures, compared to completing the color-word incongruent test, the HC group showed a consistently higher tendency of RS of the LPFC and RPFC (RSl, RSr), as well as GE and CC during the color-word congruent test, whereas the PD-MCI group displayed the opposite trend. However, no significant differences were found between the color-word congruent and incongruent tests for all the three groups. During the color-word congruent test, no significant differences were found among the three groups. Nevertheless, in the color-word incongruent test, compared to HC and PD-NC, PD-MCI showed an increasing trend of all the FC measures and the differences in RSl (p = 0.030), RSr (p = 0.009), and GE (p = 0.007) reached statistical significance between the PD-MCI and HC groups, and RSr was the only parameter that differed significantly between the PD-MCI and PD-NC patients (p = 0.044). These results are shown in Tables 3, 4 and Figure 3.
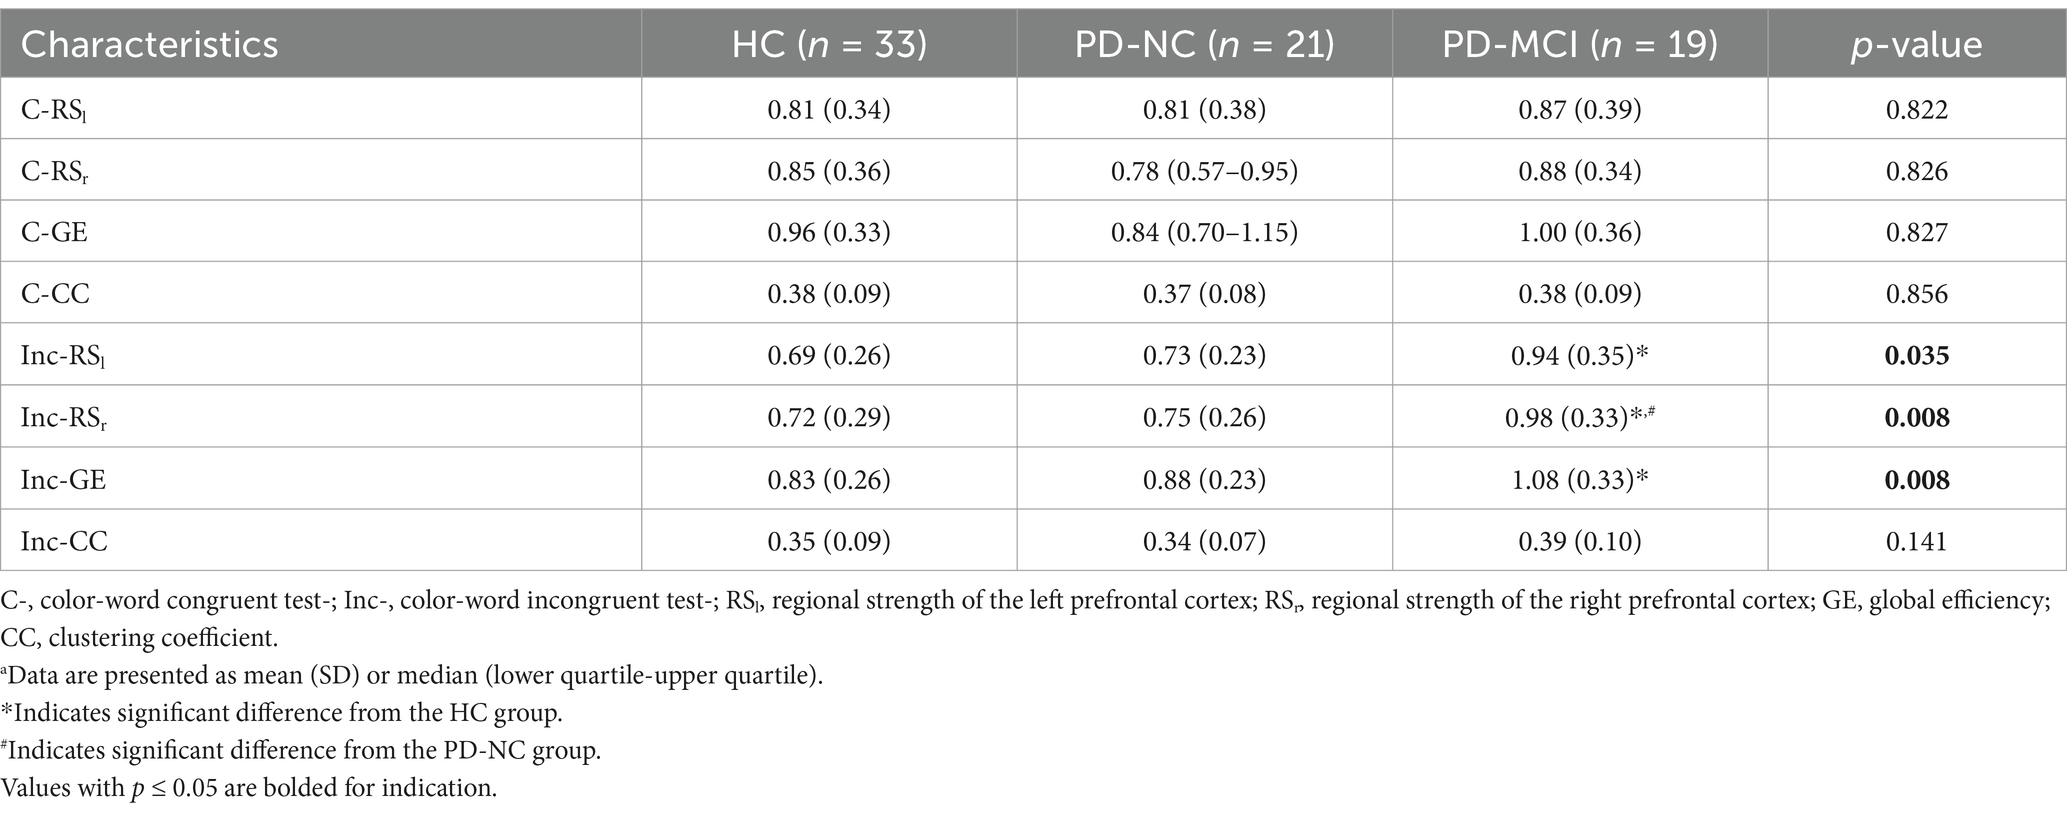
Table 3. Comparison of functional connectivity during the SCWT among HC, PD-NC and PD-MCI groupsa.
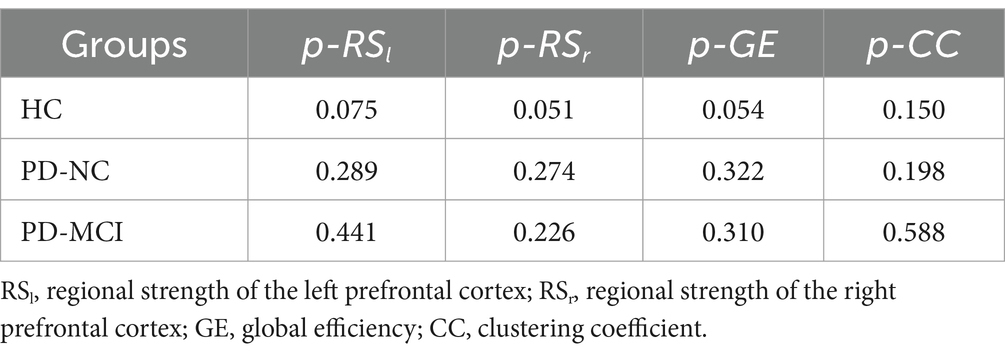
Table 4. Comparison of brain functional connectivity between the color-word congruent test and color-word incongruent test (p-value) in three groups.
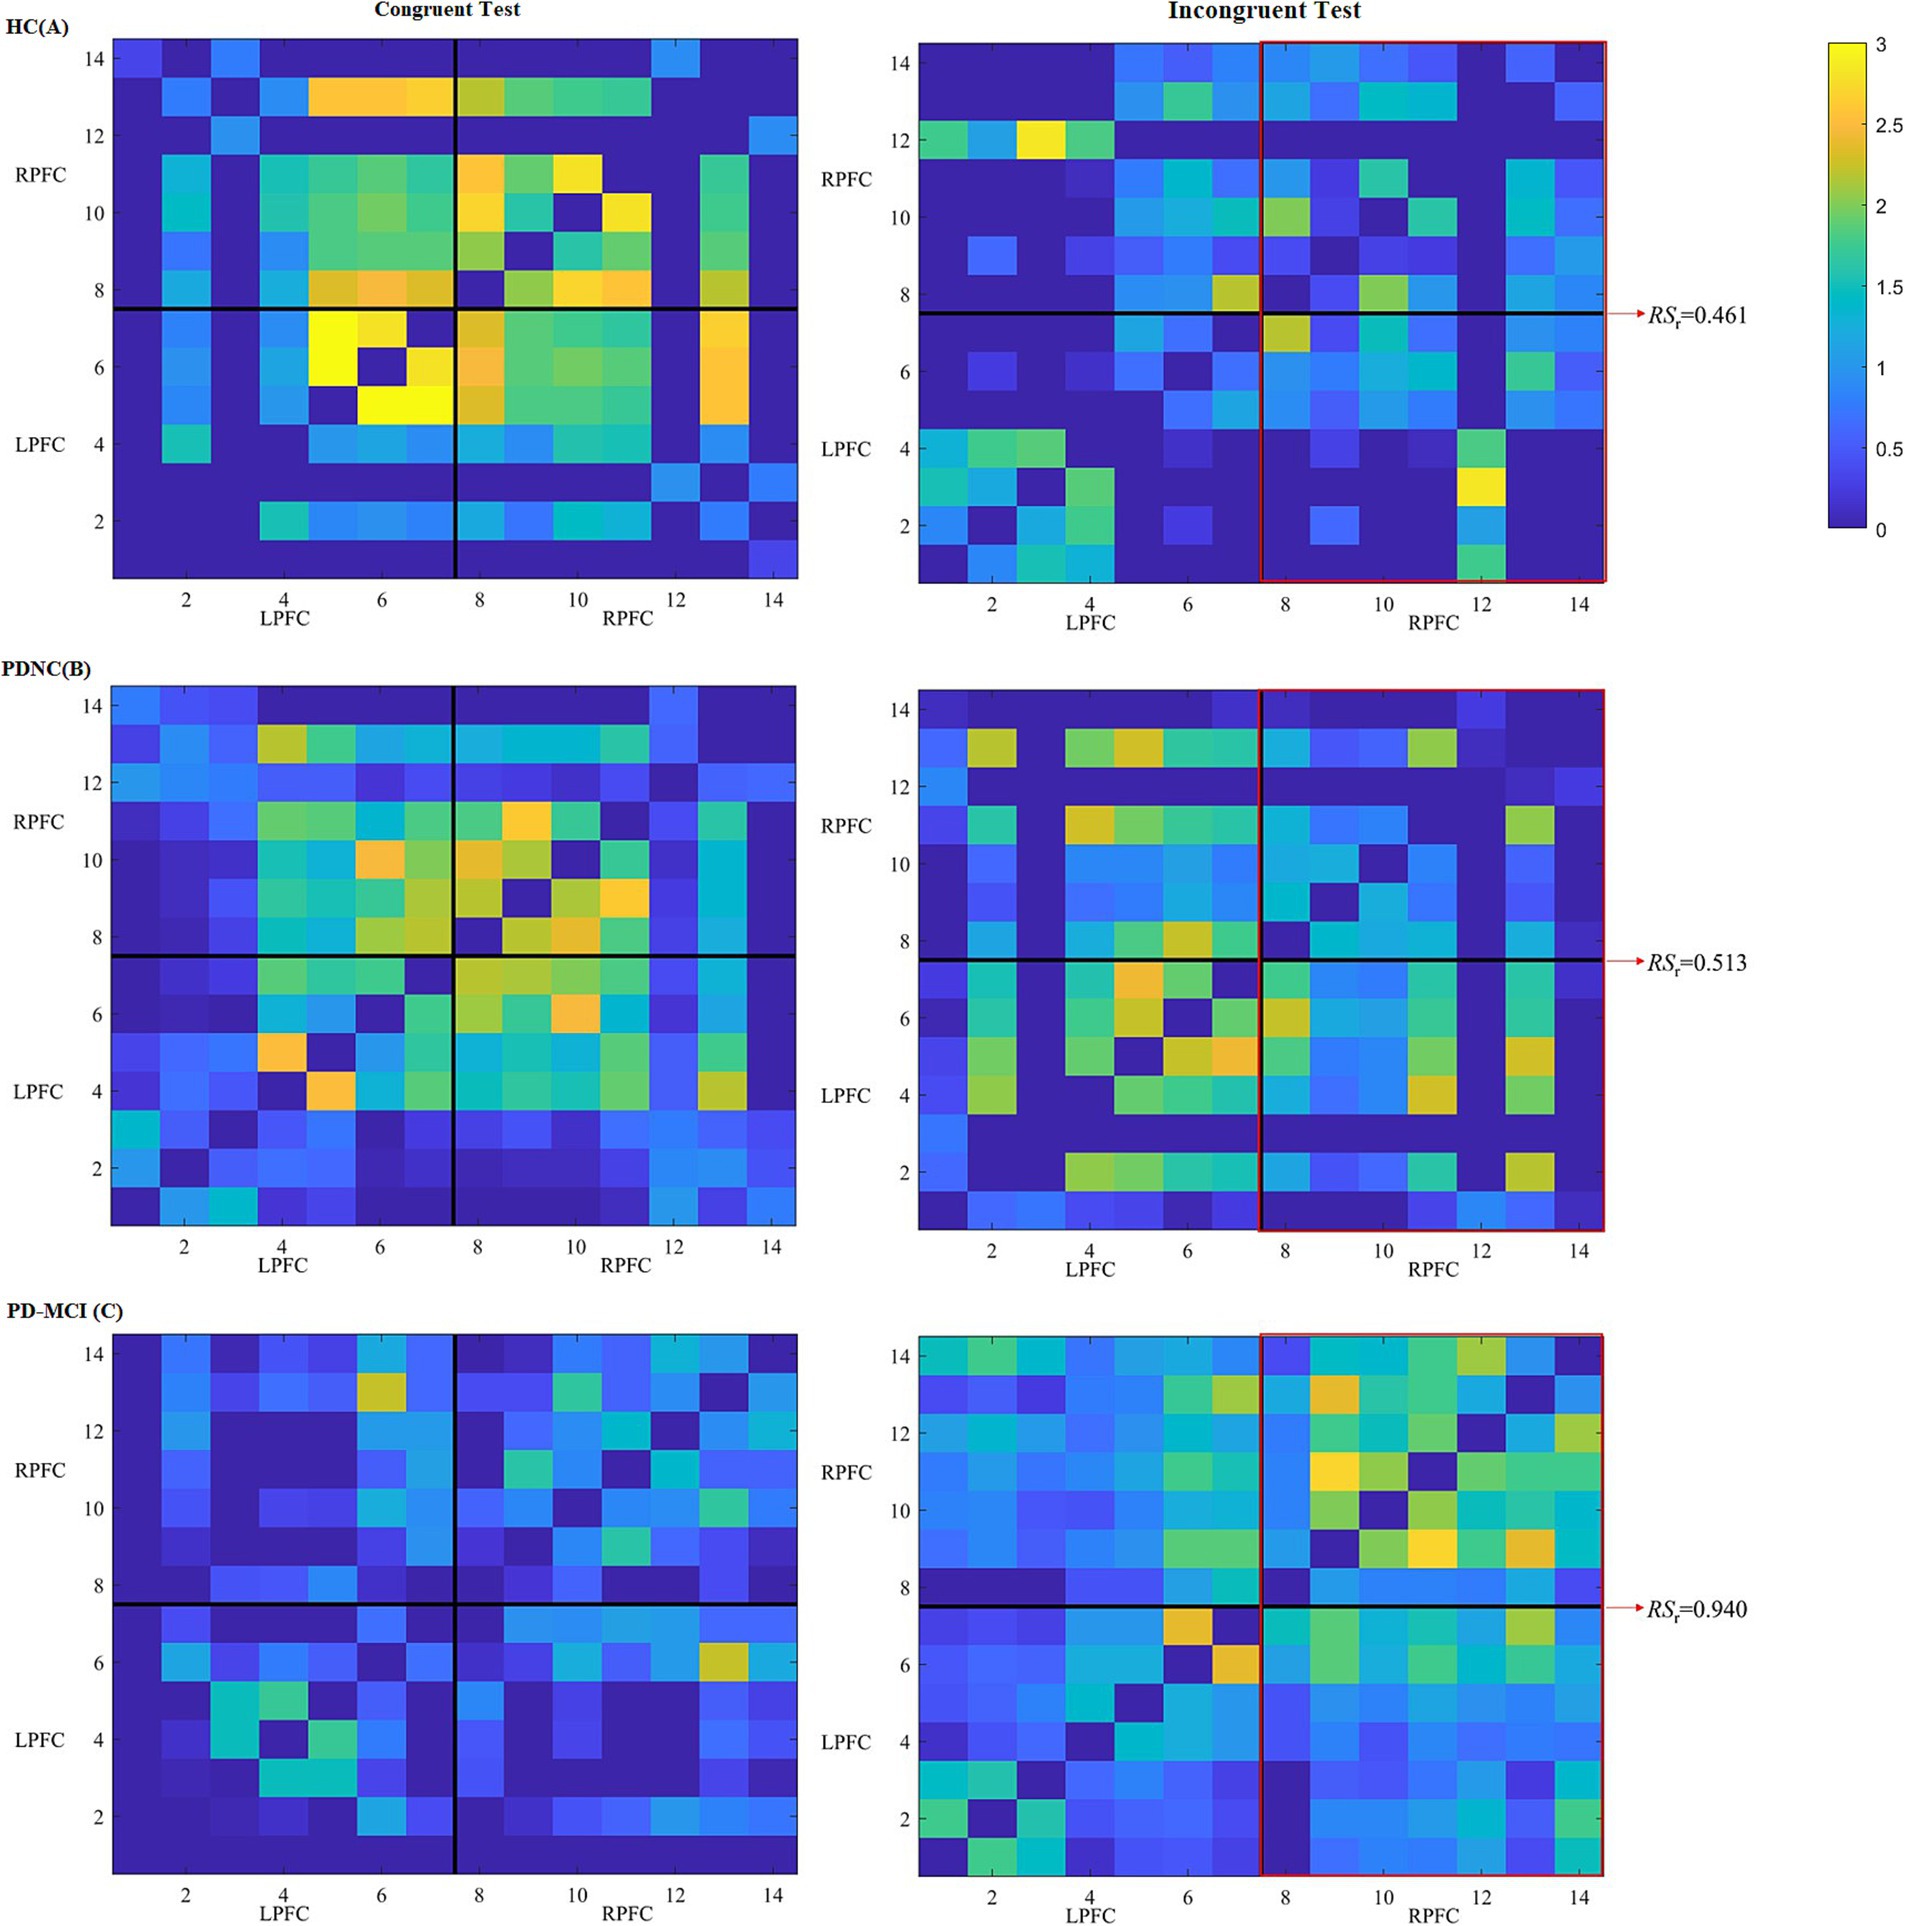
Figure 3. Heatmaps of FC among different channels of three participants, respectively, from HC (A), PD-NC (B) and PD-MCI (C) groups during the color-word congruent (left) and incongruent (right) tests. The heatmaps are divided into LPFC and RPFC parts, and x-axis and y-axis correspond to the fNIRS channels. Each pixel denotes the -transformed Pearson’s correlation coefficient value between the paired channels. Warmer colors denote larger values between the brain regions, whereas colder colors denote smaller values. The red frames reflect connections between channels in the RPFC and LPFC and connections within the RPFC.
In the uncorrected model, MMSE score, MoCA score, and correct rate during the color-word incongruent test were all negatively correlated with the RSr. Considering that the PD-NC group had significantly different years of education from the other two groups, we adjusted for this and the age. After adjusting, we found that MMSE score and correct rate were still associated with the RSr. These results are shown in Table 5.
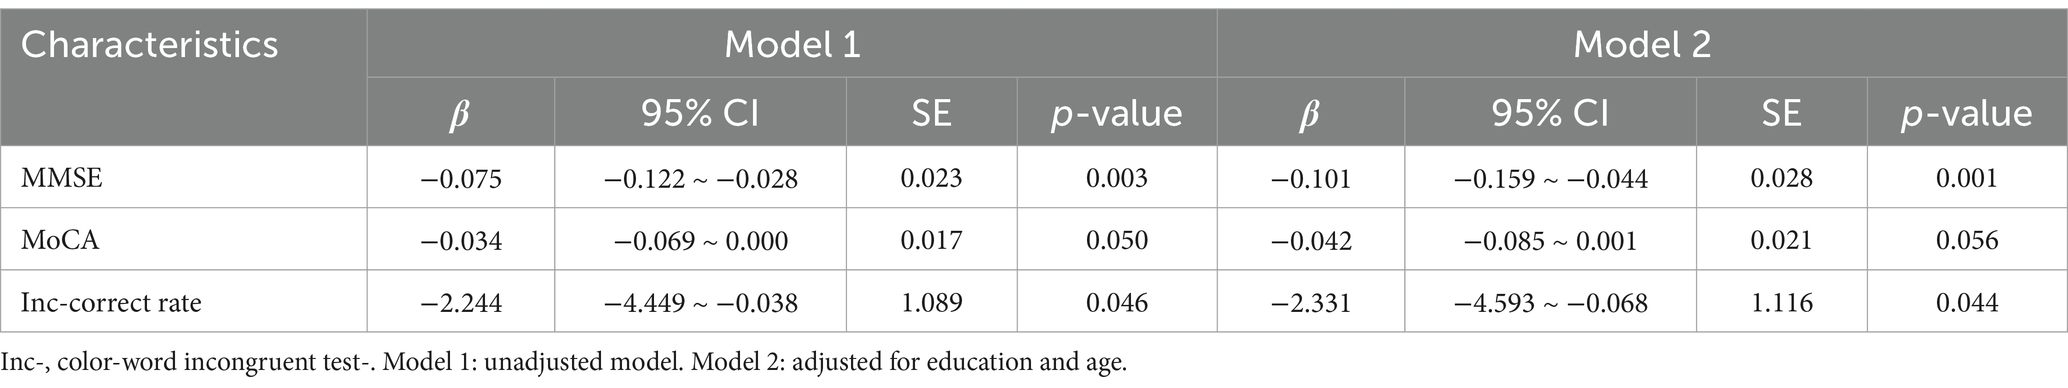
Table 5. Correlation between cognitive function and RSr level (color-word incongruent test) in PD patients.
ROC analysis was performed for RSr, correct rate during the color-word incongruent test and score of MDS-UPDRS III. The AUC of these parameters for detecting PD-MCI from non-dementia patients with PD were 0.697, 0.782, and 0.746, respectively. The above three parameters were jointly analyzed to assess their diagnostic value. The AUC of the combined parameter for detecting PD-MCI was 0.830, with cutoff value of 0.548, sensitivity of 0.737, and specificity of 0.810. These results are shown in Figure 4.
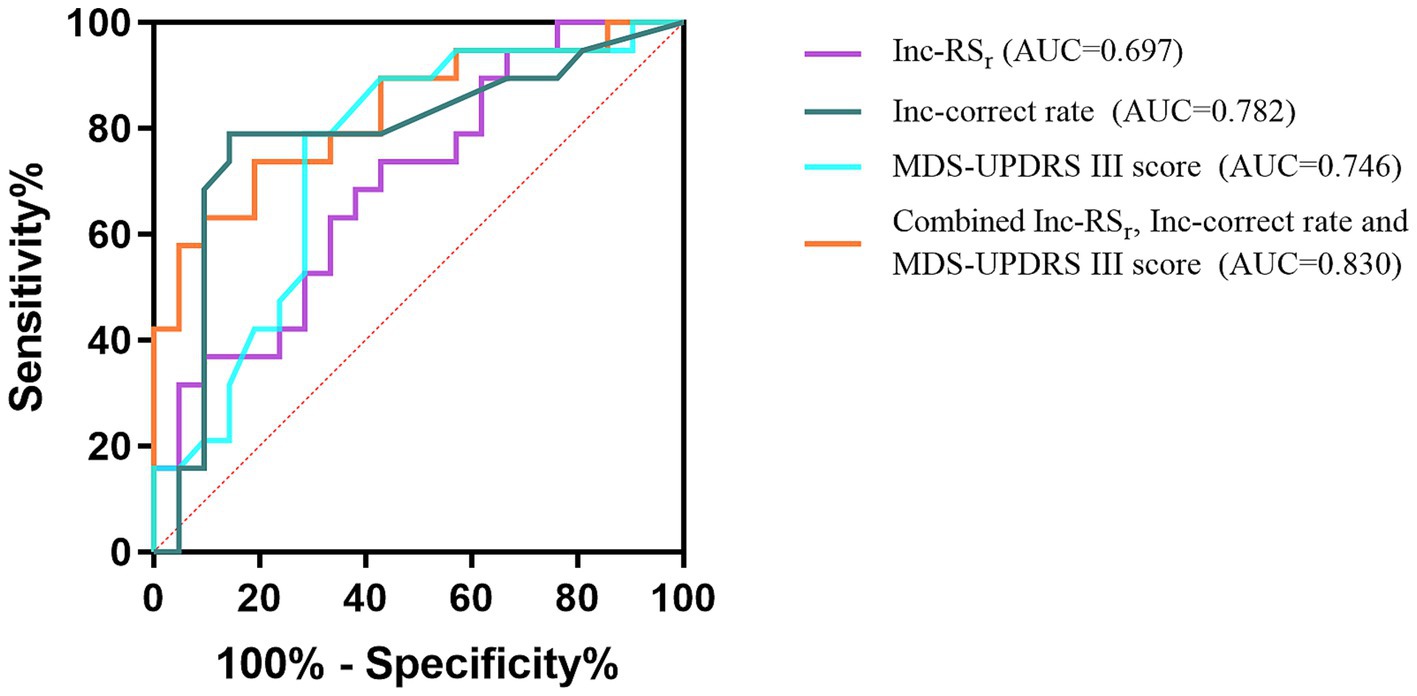
Figure 4. ROC curves of the Inc-RSr, Inc-correct rate, MDS-UPDRS III score, and the combined parameter for PD-MCI. Inc-, color-word incongruent test-.
Our study confirmed a significant decline in executive function in patients with PD-MCI compared to HC and PD-NC patients. This could be mainly caused by the related pathogenesis like formation of cortical Lewy bodies, Alzheimer’s disease-like changes, cerebral microvascular lesions, and various neurotransmitter changes dominated by dopamine. Previous studies have found that older age, males, lower education level, longer disease course, and severe motor symptoms are associated with the occurrence of PD-MCI (18). In our study, there were no significant differences in age, gender or disease course between the PD-MCI and PD-NC groups, but patients with PD-MCI had significantly higher MDS-UPDRS III scores compared with PD-NC patients, with 41.05 (12.04) and 30.52 (12.35) points, respectively. Hence, in combination with previous researches conducted by Nie (4), Baiano et al. (1), MDS-UPDRS III score could be used as an effective supplementary indicator to reflect the cognitive status of PD patients.
According to the Chinese population-based study (14) which focused on the stratification of educational level, the average MoCA scores of our HC, PD-NC and PD-MCI groups are reasonable, although they are much lower than those of the original research. Xu’s study (19) and Jia’s (20) study can prove this. In China, MoCA with its good validity and reliability has become one of the most recommended methods for the general cognitive function assessment of Parkinson’s disease. However, it is obviously affected by the educational level, which is prone to causing deviation. Hence, when using MoCA to reflect cognitive function, we have fully considered this. In China, for the age range included in our study, low educational level is common, and the influence it brings is multifaceted. Firstly, older people with a low educational level are inclined to only handle simple family affairs in daily life and have a low degree of social participation. That is to say, the cognitive requirements for them are not high enough. And if it is a PD patient, this situation will be more prominent. Secondly, some items of the MoCA heavily depend on the educational level, especially the line-connecting, clock-drawing, cube-copying, repetition 1, language fluency, similarity 2, and delayed recall items (21). To sum up, the common low educational level, the resulting reduction in the complaint of cognitive decline which is crucial for distinguishing MCI and NC, and the unfriendliness of MoCA towards people with low educational level jointly leads to much lower MoCA scores than those in foreign countries, no matter it is HC, PD-NC or PD-MCI.
To understand PD-MCI from the perspective of brain function was one of our objectives. The FC analysis indicated that patients with PD-MCI had significant higher RSl, RSr, and GE than HC during the color-word incongruent test, and the RSr was found to achieve a predictive value in differentiating PD-MCI from PD-NC. RS can be considered to directly reflect the intensity of information processing of a particular brain region, and GE is a superior measure of resource integration. We demonstrated that RSr, not RSl was a promising indicator in PD-MCI. This may involve complex inhibition and attention networks. The neural basis of inhibitory function is a right-sided framework consisting of anatomically connected presupplementary motor area, inferior frontal gyrus and subthalamic nucleus (22, 23). Attentional function is mainly managed by the ventral and dorsal networks. The ventral network, consisting of right frontoparietal regions, like inferior frontal gyrus, is responsible for attention shifting, and the dorsal network, involving bilateral frontoparietal regions, is responsible for the maintenance of alertness via the top-down allocation of attention (24, 25). Therefore, the right neural basis of the SCWT can be explained to some extent. Additionally, there was no significant difference in CC among the three groups. This can be explained from the following two aspects: On the one hand, when participants perform a new complex task, brain synchronization pattern is formed first, resulting in higher integrated components rather than separate components, and the robustness of the brain network to random errors and the local efficiency of information processing cannot mature in a short time. That is, CC changes relatively little under our cognitive test. On the other hand, the cognitive decline of PD-MCI patients was mainly in fluid intelligence, which is mainly related to the integration of brain functional network (26). Further research on the role of tasks that repeatedly stimulate the frontal cognitive networks over longer periods of time on CC and other FC measures may aid in elucidating this issue.
In this study, MMSE score and correct rate during the color-word incongruent test were negatively associated with the RSr after adjusting for education level and age, suggesting a compensatory mechanism. Klobušiaková et al. (27) evaluated the between-network connectivity of the frontoparietal control network and other resting state networks in patients with PD-MCI and PD-NC using fMRI, and found that the connectivity increased with time as well as MCI status, also indicating similar principle.
This study revealed that although not statistically significant, HC group displayed an accordant higher trend of RSl, RSr, GE and CC when performing the color-word congruent test compared to the incongruent condition, and PD-MCI group exhibited stronger FC during the color-word incongruent test behind the common better performance in the congruent condition for the two groups. This is possibly because HC had greater mental flexibility and information monitoring when completing the SCWT. It should be more difficult to distinguish the two dimensions of word color and word meaning when they are consistent. For similar information, they may need to pay more attention and overcome self-doubt. In contrast, for inconsistent information, they would pay more attention to the target while ignoring others and less consideration to the contradiction and their usual reaction tendency (28).
A study on executive function in PD patients using fMRI by Hamada et al. (29) showed that reduced switching in semantic fluency task was a strong indicator of PD-MCI and was correlated to decreased FC in the salience network. The different FC results might be related to several differences between our study and theirs. First, the range of brain regions involved in the salience network is larger in their study. Second, compared with the task state, their resting-state network may be more vulnerable to the influences of individual brain development trajectories and emotional regulation, which may have affected the results to some extent. Third, although both are focused on executive function, compared with the verbal fluency task, SCWT is likely to place more emphasis on reflecting the abilities of control processing and selective attention, and may be less affected by the educational level of the participants.
Although FC, which reflects changes in central function, is generally considered to be more sensitive than behavioral manifestations, the RSr was not an ideal classifier when used alone to predict PD-MCI in our study (AUC = 0.697). This may be due to the fact that it is not only influenced by cognitive function, but also related to individual effort levels, different thinking habits, and ceiling and floor effects. Therefore, the corresponding cognitive performance and indicators that better reflect the pathological nature of PD-MCI should be combined. Changes in the fronto-striatal pathway and dopaminergic and non-dopaminergic transmitters lead to impaired cognitive and motor function in PD. Relatively speaking, the decline in motor ability is more directly affected and easier to detect in actual clinical work. In addition, as mentioned above, the suggestive value of more severe motor deficits for PD-MCI has been demonstrated. Hence, we used RSr and correct rate during the color-word incongruent test, and MDS-UPDRS III score for joint analysis. The AUC of the combined parameter for detecting PD-MCI reached 0.830, with cutoff value of 0.548, sensitivity of 0.737, and specificity of 0.810.
This study had some limitations. (1) It had a cross-sectional design with a small sample size, which may limit the generalizability of our findings. Longitudinal and larger studies are needed to confirm these results. (2) The PD-NC group in our study had significantly more years of education compared to the PD-MCI and HC groups. This disparity undermines the optimal comparability of the baseline information across the three groups. (3) When analyzing brain FC, we set all negative connections and self-connections to zero, which could lead to the loss of some inhibitory regulation information. Additionally, we did not adopt methods to eliminate the interference of scalp hemodynamics in the fNIRS data. In future research, we intend to handle these issues with more prudence and explore alternative or more refined methods. (4) Posterior parietal cortex also plays a role in encoding targets and goal-related information for control, and we can incorporate it into further research. (5) The SCWT we designed has a fixed duration, which may not be sensitive enough to reflect subjects’ reaction time by analyzing the amounts of responses. (6) When judging MoCA abnormalities, we chose to refer to a large-scale epidemiological study in China with similar wide range of educational levels, but our age was slightly younger, which might affect the division of PD-MCI and PD-NC.
In conclusion, we provide a novel signature that combines brain FC with executive and motor function to study cognitive decline in PD. Our findings may help promote early rehabilitation and follow up.
The raw data supporting the conclusions of this article will be made available by the authors, without undue reservation.
The studies involving humans were approved by the Ethics Committee of Tianjin Huanhu Hospital. The studies were conducted in accordance with the local legislation and institutional requirements. The participants provided their written informed consent to participate in this study.
JWa: Conceptualization, Data curation, Formal analysis, Investigation, Methodology, Validation, Visualization, Writing – original draft. ZS: Data curation, Formal analysis, Investigation, Methodology, Software, Validation, Visualization, Writing – original draft. YW: Data curation, Formal analysis, Writing – review & editing. JL: Formal analysis, Software, Writing – review & editing. XZ: Data curation, Formal analysis, Writing – review & editing. YC: Formal analysis, Investigation, Writing – review & editing. YY: Project administration, Supervision, Writing – review & editing. JH: Funding acquisition, Project administration, Writing – review & editing. ZZ: Funding acquisition, Resources, Writing – review & editing. NY: Funding acquisition, Resources, Writing – review & editing. JWu: Funding acquisition, Project administration, Resources, Supervision, Writing – review & editing.
The author(s) declare financial support was received for the research, authorship, and/or publication of this article. This study was funded by the Science and Technology Program of Tianjin (21JCZDJC00170), Tianjin Health Research Project (TJWJ2022MS033, TJWJ2022MS031), Tianjin Key Medical Discipline (Specialty) Construction Project (TJYXZDXK-052B) and National Natural Science Foundation of China (U1913208).
We are grateful to the patients and their families.
The authors declare that the research was conducted in the absence of any commercial or financial relationships that could be construed as a potential conflict of interest.
All claims expressed in this article are solely those of the authors and do not necessarily represent those of their affiliated organizations, or those of the publisher, the editors and the reviewers. Any product that may be evaluated in this article, or claim that may be made by its manufacturer, is not guaranteed or endorsed by the publisher.
1. Baiano, C, Barone, P, Trojano, L, and Santangelo, G. Prevalence and clinical aspects of mild cognitive impairment in Parkinson's disease: a meta-analysis. Mov Disord. (2020) 35:45–54. doi: 10.1002/mds.27902
2. Aarsland, D, Batzu, L, Halliday, GM, Geurtsen, GJ, Ballard, C, Ray Chaudhuri, K, et al. Parkinson disease-associated cognitive impairment. Nat Rev Dis Primers. (2021) 7:47. doi: 10.1038/s41572-021-00280-3
3. Heremans, E, Nieuwboer, A, Spildooren, J, Vandenbossche, J, Deroost, N, Soetens, E, et al. Cognitive aspects of freezing of gait in Parkinson's disease: a challenge for rehabilitation. J Neural Transm. (2013) 120:543–57. doi: 10.1007/s00702-012-0964-y
4. Nie, K, Gao, Y, Mei, M, Guo, M, Huang, Z, Wang, L, et al. The clinical characteristics and cognitive features of mild cognitive impairment in Parkinson's disease and the analysis of relevant factors. J Clin Neurosci. (2019) 63:142–8. doi: 10.1016/j.jocn.2019.01.021
5. Wang, X, Huang, W, Su, L, Xing, Y, Jessen, F, Sun, Y, et al. Neuroimaging advances regarding subjective cognitive decline in preclinical Alzheimer's disease. Mol Neurodegener. (2020) 15:55. doi: 10.1186/s13024-020-00395-3
6. Wang, Z, Jia, X, Chen, H, Feng, T, and Wang, H. Abnormal spontaneous brain activity in early Parkinson's disease with mild cognitive impairment: a resting-state fMRI study. Front Physiol. (2018) 9:1093. doi: 10.3389/fphys.2018.01093
7. Zhan, ZW, Lin, LZ, Yu, EH, Xin, JW, Lin, L, Lin, HL, et al. Abnormal resting-state functional connectivity in posterior cingulate cortex of Parkinson's disease with mild cognitive impairment and dementia. CNS Neurosci Ther. (2018) 24:897–905. doi: 10.1111/cns.12838
8. Nombela, C, Bustillo, PJ, Castell, PF, Sanchez, L, Medina, V, and Herrero, MT. Cognitive rehabilitation in Parkinson's disease: evidence from neuroimaging. Front Neurol. (2011) 2:82. doi: 10.3389/fneur.2011.00082
9. de, R, Agosta, F, Basaia, S, Siciliano, M, Cividini, C, Tedeschi, G, et al. Functional connectomics and disease progression in drug-Naïve Parkinson’s disease patients. Mov Disord. (2021) 36:1603–16. doi: 10.1002/mds.28541
10. Shu, Z, Wang, J, Cheng, Y, Lu, J, Lin, J, Wang, Y, et al. fNIRS-based graph frequency analysis to identify mild cognitive impairment in Parkinson's disease. J Neurosci Methods. (2024) 402:110031. doi: 10.1016/j.jneumeth.2023.110031
11. Postuma, RB, Berg, D, Stern, M, Poewe, W, Olanow, CW, Oertel, W, et al. MDS clinical diagnostic criteria for Parkinson's disease. Mov Disord. (2015) 30:1591–601. doi: 10.1002/mds.26424
12. Emre, M, Aarsland, D, Brown, R, Burn, DJ, Duyckaerts, C, Mizuno, Y, et al. Clinical diagnostic criteria for dementia associated with Parkinson's disease. Mov Disord. (2007) 22:1689–707; quiz 1837. doi: 10.1002/mds.21507
13. Litvan, I, Goldman, JG, Tröster, AI, Schmand, BA, Weintraub, D, Petersen, RC, et al. Diagnostic criteria for mild cognitive impairment in Parkinson's disease: Movement Disorder Society task force guidelines. Mov Disord. (2012) 27:349–56. doi: 10.1002/mds.24893
14. Lu, J, Li, D, Li, F, Zhou, A, Wang, F, Zuo, X, et al. Montreal cognitive assessment in detecting cognitive impairment in Chinese elderly individuals: a population-based study. J Geriatr Psychiatry Neurol. (2011) 24:184–90. doi: 10.1177/0891988711422528
15. Luo, CY, Guo, XY, Song, W, Chen, Q, Cao, B, Yang, J, et al. Functional connectome assessed using graph theory in drug-naive Parkinson's disease. J Neurol. (2015) 262:1557–67. doi: 10.1007/s00415-015-7750-3
16. Xia, Y, Chen, Q, Shi, L, Li, M, Gong, W, Chen, H, et al. Tracking the dynamic functional connectivity structure of the human brain across the adult lifespan. Hum Brain Mapp. (2019) 40:717–28. doi: 10.1002/hbm.24385
17. Huang, H, Liu, X, Jin, Y, Lee, SW, Wee, CY, and Shen, D. Enhancing the representation of functional connectivity networks by fusing multi-view information for autism spectrum disorder diagnosis. Hum Brain Mapp. (2019) 40:833–54. doi: 10.1002/hbm.24415
18. Yarnall, AJ, Rochester, L, and Burn, DJ. Mild cognitive impairment in Parkinson’s disease. Age Ageing. (2013) 42:567–76. doi: 10.1093/ageing/aft085
19. Xu, S, Lin, G, and Zhu, Y. The research of using Montreal cognitive assessment to evaluate mild cognitive impairment in patients with Parkinson's disease. Chinese J Rehabil Med. (2015) 30:251–4. doi: 10.3969/j.issn.1001-1242.2015.03.009
20. Jia, X, Wang, Z, Huang, F, Su, C, du, W, Jiang, H, et al. A comparison of the Mini-mental state examination (MMSE) with the Montreal cognitive assessment (MoCA) for mild cognitive impairment screening in Chinese middle-aged and older population: a cross-sectional study. BMC Psychiatry. (2021) 21:485. doi: 10.1186/s12888-021-03495-6
21. Hong-Ji, S, Yue, X, Xiao-Hong, Z, Heng-Ge, X, and Wei-Ping, W. Items in Montreal cognitive assessment. Chinese J Geriatric Heart Brain Vessel Dis. (2014) 16:387–390. doi: 10.3969/j.issn.1009-0126.2014.04.015
22. Aron, AR, Behrens, TE, Smith, S, Frank, MJ, and Poldrack, RA. Triangulating a cognitive control network using diffusion-weighted magnetic resonance imaging (MRI) and functional MRI. J Neurosci. (2007) 27:3743–52. doi: 10.1523/JNEUROSCI.0519-07.2007
23. Aron, AR. From reactive to proactive and selective control: developing a richer model for stopping inappropriate responses. Biol Psychiatry. (2011) 69:e55–68. doi: 10.1016/j.biopsych.2010.07.024
24. Corbetta, M, Patel, G, and Shulman, GL. The reorienting system of the human brain: from environment to theory of mind. Neuron. (2008) 58:306–24. doi: 10.1016/j.neuron.2008.04.017
25. Fan, J, McCandliss, BD, Fossella, J, Flombaum, JI, and Posner, MI. The activation of attentional networks. NeuroImage. (2005) 26:471–9. doi: 10.1016/j.neuroimage.2005.02.004
26. Wang, R, Liu, M, Cheng, X, Wu, Y, Hildebrandt, A, and Zhou, C. Segregation, integration, and balance of large-scale resting brain networks configure different cognitive abilities. Proc Natl Acad Sci U S A. (2021) 118:e2022288118. doi: 10.1073/pnas.2022288118
27. Klobušiaková, P, Mareček, R, Fousek, J, Výtvarová, E, and Rektorová, I. Connectivity between brain networks dynamically reflects cognitive status of Parkinson's disease: a longitudinal study. J Alzheimers Dis. (2019) 67:971–84. doi: 10.3233/JAD-180834
28. MacLeod, CM, and MacDonald, PA. Interdimensional interference in the Stroop effect: uncovering the cognitive and neural anatomy of attention. Trends Cogn Sci. (2000) 4:383–91. doi: 10.1016/s1364-6613(00)01530-8
Keywords: functional connectivity, functional near-infrared spectroscopy, cognitive decline, Parkinson’s disease, Stroop color-word test
Citation: Wang J, Shu Z, Wang Y, Lu J, Zhang X, Cheng Y, Yu Y, Han J, Zhu Z, Yu N and Wu J (2025) A signature combining brain functional connectivity with executive and motor function for general cognitive decline in Parkinson’s disease. Front. Neurol. 16:1434733. doi: 10.3389/fneur.2025.1434733
Edited by:
Maria Francesca De Pandis, Hospital San Raffaele Cassino, ItalyReviewed by:
Ildefonso Rodriguez-Leyva, Autonomous University of San Luis Potosi, MexicoCopyright © 2025 Wang, Shu, Wang, Lu, Zhang, Cheng, Yu, Han, Zhu, Yu and Wu. This is an open-access article distributed under the terms of the Creative Commons Attribution License (CC BY). The use, distribution or reproduction in other forums is permitted, provided the original author(s) and the copyright owner(s) are credited and that the original publication in this journal is cited, in accordance with accepted academic practice. No use, distribution or reproduction is permitted which does not comply with these terms.
*Correspondence: Jialing Wu, d3l3amwyMDA5QGhvdG1haWwuY29t; Ningbo Yu, bnl1QG5hbmthaS5lZHUuY24=; Zhizhong Zhu, emh1MzYxMjEyMDlAc2luYS5jb20=
†These authors have contributed equally to this work and share first authorship
Disclaimer: All claims expressed in this article are solely those of the authors and do not necessarily represent those of their affiliated organizations, or those of the publisher, the editors and the reviewers. Any product that may be evaluated in this article or claim that may be made by its manufacturer is not guaranteed or endorsed by the publisher.
Research integrity at Frontiers
Learn more about the work of our research integrity team to safeguard the quality of each article we publish.