 Yanwen Xu1Hanyu Zhu1Yuqi Su2Zhizhi Chen1Chuanliu Wang1Ming Yang1Feifei Jiang1Yunping Li3
 Yongming Xu3*
- 1Department of Neurology, The Quzhou Affiliated Hospital of Wenzhou Medical University, Quzhou People’s Hospital, Quzhou, China
- 2Operation Room, The Quzhou Affiliated Hospital of Wenzhou Medical University, Quzhou People’s Hospital, Quzhou, China
- 3Department of Neurosurgery, The Quzhou Affiliated Hospital of Wenzhou Medical University, Quzhou People’s Hospital, Quzhou, China
Objective: Intracerebral hemorrhage (ICH) is a common cerebrovascular disease characterized by high mortality and disability rates. Neuritin, significantly expressed in injured brain tissues, is implicated in the molecular mechanisms underlying acute brain injury. We aimed to explore the prognostic and predictive value of serum neuritin in ICH.
Methods: In this prospective cohort study, serum neuritin levels were measured at admission in 202 patients, on post-ICH days 1, 3, 5, 7, and 10 in 54 of these patients, and at the time of enrollment in 100 healthy controls. The Glasgow Coma Scale (GCS) and hematoma volume were used as severity indicators. A poor prognosis was defined as a modified Rankin Scale (mRS) score of 3–6 at 90 days after ICH. END was defined as a decrease of ≥2 points in the GCS score within 24 h of admission. A multivariate logistic regression model was used to assess the independent relationships between serum neuritin levels, END, and poor prognosis.
Results: Serum neuritin levels were significantly increased at the time of patient admission, continued to rise on day 1, peaked on day 3, and then gradually diminished from day 5 until day 10. The levels remained substantially higher in patients compared to healthy controls throughout the 10-day period. The levels were independently related to GCS scores and hematoma volume. In subgroup analyses, the levels showed a linear relationship with the likelihood of experiencing END and poor prognosis at the 90-day mark after ICH. Additionally, the levels were independently associated with END, ordinal mRS scores, and poor prognosis. Under receiver operating characteristic (ROC) curve analysis, serum neuritin levels effectively predicted both END and poor prognosis. Two models incorporating GCS, hematoma volume, and serum neuritin levels were developed and represented using two nomograms separately to estimate END risks and poor prognosis. These models demonstrated clinical efficiency, stability, and validity in ROC, calibration, and decision curve analyses. Internal validation of the models was conducted using a randomly extracted subset of 101 patients. Furthermore, two specific weighted scoring systems were developed to optimize clinical prediction of poor prognosis and END after ICH.
Conclusion: Elevated serum neuritin levels are strongly associated with disease severity, END, and 90-day poor neurological outcomes following ICH, establishing serum neuritin as a potential prognostic biomarker for ICH.
1 Introduction
Spontaneous intracerebral hemorrhage (sICH) pertains to the non-traumatic rupture of blood vessels resulting in the accumulation of blood within brain tissue, and it is correlated with high rates of disability and mortality (1, 2). Mechanisms underlying secondary brain injury after ICH are very complex, including inflammatory reactions, cellular apoptosis, perihematomal edema, and more, which are all related to poor outcomes for patients (3–5). In recent years, some biomarkers have been widely studied in ICH prognosis prediction and severity assessment (6, 7). Several factors, such as age, intraventricular hemorrhage, subtentorial hemorrhage, Glasgow Coma Scale (GCS), and hematoma volume, are associated with the prognosis of sICH (1, 8). Early neurological deterioration (END) is a common phenomenon, and its appearance is highly associated with poor prognosis in sICH patients (9, 10). Thus, it is significant to explore biomarkers of pertinence to END and poor prognosis following ICH.
Neuritin, also known as CPG15, is a newly described member of the family of neurotrophic factors (11). It possesses numerous properties, such as the facilitation of neuroplasticity, anti-inflammation, and anti-apoptosis (12). Neuritin expressions by animal neurons can be markedly up-regulated, and its supplementation significantly depressed neuroinflammation, reduced brain edema, and attenuated neuronal death in experimental ICH, ischemic stroke, subarachnoid hemorrhage, and Alzheimer’s disease (13–18). Thus, these features could identify neuritin as a potential endogenous mechanism for the minimization of secondary injury, which could imply its utility as a biomarker of brain injury. Here, we conducted an observational study to investigate the alteration of serum neuritin levels and its prognostic implications in ICH.
2 Materials and methods
2.1 Study design and participant selection
Consecutive recruitment of sICH patients admitted to Quzhou People’s Hospital was conducted from April 2020 to December 2022. The inclusion criteria were as follows: (1) first-ever stroke; (2) admission within 24 h of symptom onset; (3) age 18 years or older; (4) non-surgical treatment of hematoma; (5) intraparenchymal bleeding.
The exclusion criteria were the following: (1) hematoma caused by congenital or acquired coagulation abnormalities, hemorrhagic transformation of cerebral infarction, moyamoya disease, intracranial aneurysm, arteriovenous malformation, or neoplasms; (2) a history of other previous neurological diseases, such as ischemic or hemorrhagic stroke, intracranial tumors, or severe head trauma; and (3) specific diseases or conditions, such as infection in recent months, pregnancies, malignancies, uremia, liver cirrhosis, or chronic heart or lung disease (Supplementary Figure S1).
Additionally, healthy individuals who underwent physical examinations at our hospital were consecutively recruited as controls from May 2021 to July 2022. All controls met the following enrollment criteria: (1) no underlying diseases, including but not limited to hypertension, diabetes, hyperlipidemia, and coronary heart disease, and (2) normal results in routine blood tests, such as blood glucose, platelet count, hemoglobin concentration, and white blood cell count, in the normal ranges (Supplementary Figure S1).
This observational study was continually divided into a cross-sectional sub-study and a prospective cohort sub-study. In the cross-sectional assessment for investigating the longitudinal change of serum neuritin levels following ICH, venous blood was drawn at enrollment in controls, at admission in all patients, and at days 1, 3, 5, 7, and 10 after ICH in a portion of patients who were willing for blood collections at several time points. In the prospective cohort investigation for determining the feasibility of serum neuritin as a prognostic biomarker in ICH, all patients had their measurements of serum neuritin levels at admission and were observed for END and poor prognosis at the 90-day mark after ICH. This study was performed following principles set forth in the Declaration of Helsinki. The protocol of the current study was approved by the Institutional Review Committee at the Quzhou People’s Hospital (Opinion No: 2022–136). Written informed consent forms were obtained from patients’ relatives and controls themselves.
2.2 Acquired information
We collected basic information about the patients, including demographics (age and sex), vascular risk factors (hypertension, diabetes, and hyperlipidemia), medication history (use of statins, antiplatelet agents, and anticoagulants), and medical history. Stroke severity was assessed at admission using the GCS. All patients underwent baseline computed tomography scans of the head, and the hematoma volume was measured using the ABC/2 formula (19). Localizations of hematoma in lobular, subtentorial, intraventricular, or subarachnoid space were recorded. Upon arrival at the emergency center, non-invasive techniques were applied to reading systolic and diastolic blood pressures. A decrease of ≥2 points in GCS score within 24 h after admission was deemed as END (9). Patients with a modified Rankin Scale (mRS) score of ≥3 at post-stroke 90 days were considered to have a poor prognosis (20).
2.3 Immune analysis
Venous blood samples of controls were collected at their recruitment into this study. Peripheral blood specimens at admission were collected from all patients, and those at days 1, 3, 5, 7, and 10 after ICH were gained from some patients who consented to blood collections at multiple time points. Blood glucose, potassium, and C-reactive protein levels and white blood cell counts were measured by employing routine methods. A quick deposition of blood specimens into 5 mL gel-containing biochemistry tubes (Ningbo Siny Medical Technology Co., Ltd., China) was undertaken to measure serum neuritin levels. Once coagulation was observed, blood samples were spun at 2,000 g for 10 min. Subsequently, the supernatants were moved into Eppendorf tubes (Eppendorf Tubes® BioBased, China) for prompt preservation at conditions of below 80°C for later analysis. Quantifications were conducted in batches of serum neuritin levels. In detail, a batch of serum samples, which were collected in a recent quarter, were thawed for measurements at the end of a quarter in order to ensure time from blood drawings to biomarker measurements did not exceed 3 months to prevent protein from breaking down. By applying a commercially available kit (Article Number: EH0944; Wuhan Fine Biotech Co., Ltd.), serum neuritin detection by enzyme-linked immunosorbent assay was in duplicate fulfilled in a blinded mode by the same proficient personnel in accordance with the manufacturer’s instructions. The sensitivity of the kit was 18.75 pg./mL, and the detection range was 31.25–2,000 pg./mL, with both intra-assay and inter-assay variabilities below 10%. The dual measurements were calculated to acquire the average values for the statistical assessments in the end. A high correlation existed between the double measurements (ρ = 0.998, p < 0.001; intraclass correlation coefficient = 0.998, p < 0.001). Using the Bland–Altman plot, a satisfactory consensus was ascertained between the two measurements (Supplementary Figure S2).
2.4 Statistical analysis
The SPSS 23.0 (SPSS Inc., Chicago, IL, United States), MedCalc 20 (MedCalc Software, Ltd., Ostend, Belgium), GraphPad Prism 7.01 (GraphPad Software Inc., San Diego, California, United States), and the software package R (version 3.5.1)1 were operated for plotting figures or statistical analyses. Normality evaluation by the Kolmogorov–Smirnov test was finished for measurement data, and subsequently, they were reported as means with standard deviations (SDs) or medians with 25–75 percentiles as deemed suitable. Qualitative data were presented as counts (proportions). The data comparisons between the two groups were completed using the chi-square test, Fisher exact test, t-test, or the Mann–Whitney U test as applicable. The Kruskal–Wallis H test was used to compare the differences in data among multiple groups. The Spearman correlation coefficient was generated to analyze the bivariate correlations. Subsequently, significantly correlated variables on univariate analysis (p < 0.05) were consolidated in the multifactorial linear regression model to identify variables that were independently relevant to serum neuritin levels. In order to discern independent predictors of poor prognosis indicated by mRS scores, mRS was regarded as an ordinal variable and a categorical variable (mRS 0–2 versus 3–6). The binary logistic regression model and ordinal regression model were constructed to ascertain independent predictors of poor prognosis. The variables with p < 0.05 on the univariate analysis should be integrated into the multivariable models for further analysis. Associations were expressed as odds ratios (ORs) and 95% confidence intervals (CIs). Similarly, independent predictors of END were determined using identical methods. Discrimination efficiency was assessed using receiver operating characteristic (ROC) curve analysis, with reporting of the area under the curve (AUC) and the corresponding 95% CI values. The restricted cubic splines were plotted to show a linear relationship, the combined models were visualized via the nomograms, calibration curves were generated to assess the stability of the models, and decision curves were produced to evaluate the clinical validity of the models. Half of all patients were randomly extracted for an internal validation of models. Weighted scoring systems were formed to optimize the prediction of poor prognosis and END after ICH. A two-sided p-value less than 0.05 signified a statistical difference.
3 Results
3.1 Participant selection and features
Initially, the consecutive recruitment of 269 patients with ICH was completed in compliance with the prespecified inclusion criteria in Supplementary Figure S1. In total, 67 patients were ineligible and removed from this study in accordance with the predefined exclusion requirements in Supplementary Figure S1. Finally, a collective of 202 ICH cases were retained for further analysis. The baseline characteristics of all 202 patients are listed in Supplementary Table S1. Moreover, among these 202 patients, mRS scores 0, 1, 2, 3, 4, 5, and 6 were found separately in 17, 21, 73, 32, 36, 17, and 6 patients (median, 2; 25th–75th percentiles, 2–4).
A total of 91 and 57 patients experienced adverse outcomes at 90 days and END post-ICH, respectively. Moreover, a total of 54 consented to blood collection at multiple time points. Supplementary Table S1 shows no significant differences in baseline characteristics between all patients and the 54 who agreed to blood collection at several time points post-ICH (all p > 0.05). In addition, 100 healthy controls were recruited. A total of 53 males and 47 females composed controls, with a mean age of 61.1 years (SD, 14.0 years), and controls encompassed 20 tobacco smokers and 19 alcohol consumers. Statistically, there were no significant differences in age, sex, smoking, and alcohol consumption between all patients and the controls (all p > 0.05).
3.2 Change of serum neuritin levels and its correlation with sickness severity
Serum neuritin levels of ICH patients promptly increased at admission, maintained elevated levels on day 1, reached the highest levels on day 3, and then gradually decreased from day 5 to day 10; and serum neuritin levels were significantly higher during the initial 10 days after ICH in patients than in controls (p < 0.001; Supplementary Figure S3). Serum neuritin levels in ICH patients were graphically shown to be significantly negatively correlated with GCS scores (p < 0.001; Supplementary Figure S4A) and to be substantially positively related to hematoma volume (p < 0.001; Supplementary Figure S4B). According to GCS, the patients were divided into three groups with scores of 3–8, 9–12, and 13–15 separately. In accordance with hematoma volume, the patients were categorized into two groups with bleeding sizes of below 30 mL and above 30 mL, respectively. In the form of a graph, serum neuritin levels were markedly highest in patients with the scores 3–8, were medium in those with the scores 9–12, and were profoundly lowest in those with the scores 13–15 (p < 0.001; Supplementary Figure S4C). In addition, serum neuritin levels were dramatically higher in patients with hematoma volume > 30 mL than in those with hematoma volume < 30 mL (p < 0.001; Supplementary Figure S4D). Moreover, within the framework of the Spearman test, serum neuritin levels were highly correlated with age, GCS scores, hematoma volume, diabetes mellitus, blood glucose levels, and intraventricular hemorrhage (all p < 0.05; Table 1). Moreover, a multivariate linear regression model was developed with the incorporation of the above-mentioned six significantly correlated variables, leading to the finding that admission serum neuritin levels were independently correlated with GCS scores and hematoma volume (both p < 0.05; Table 2).
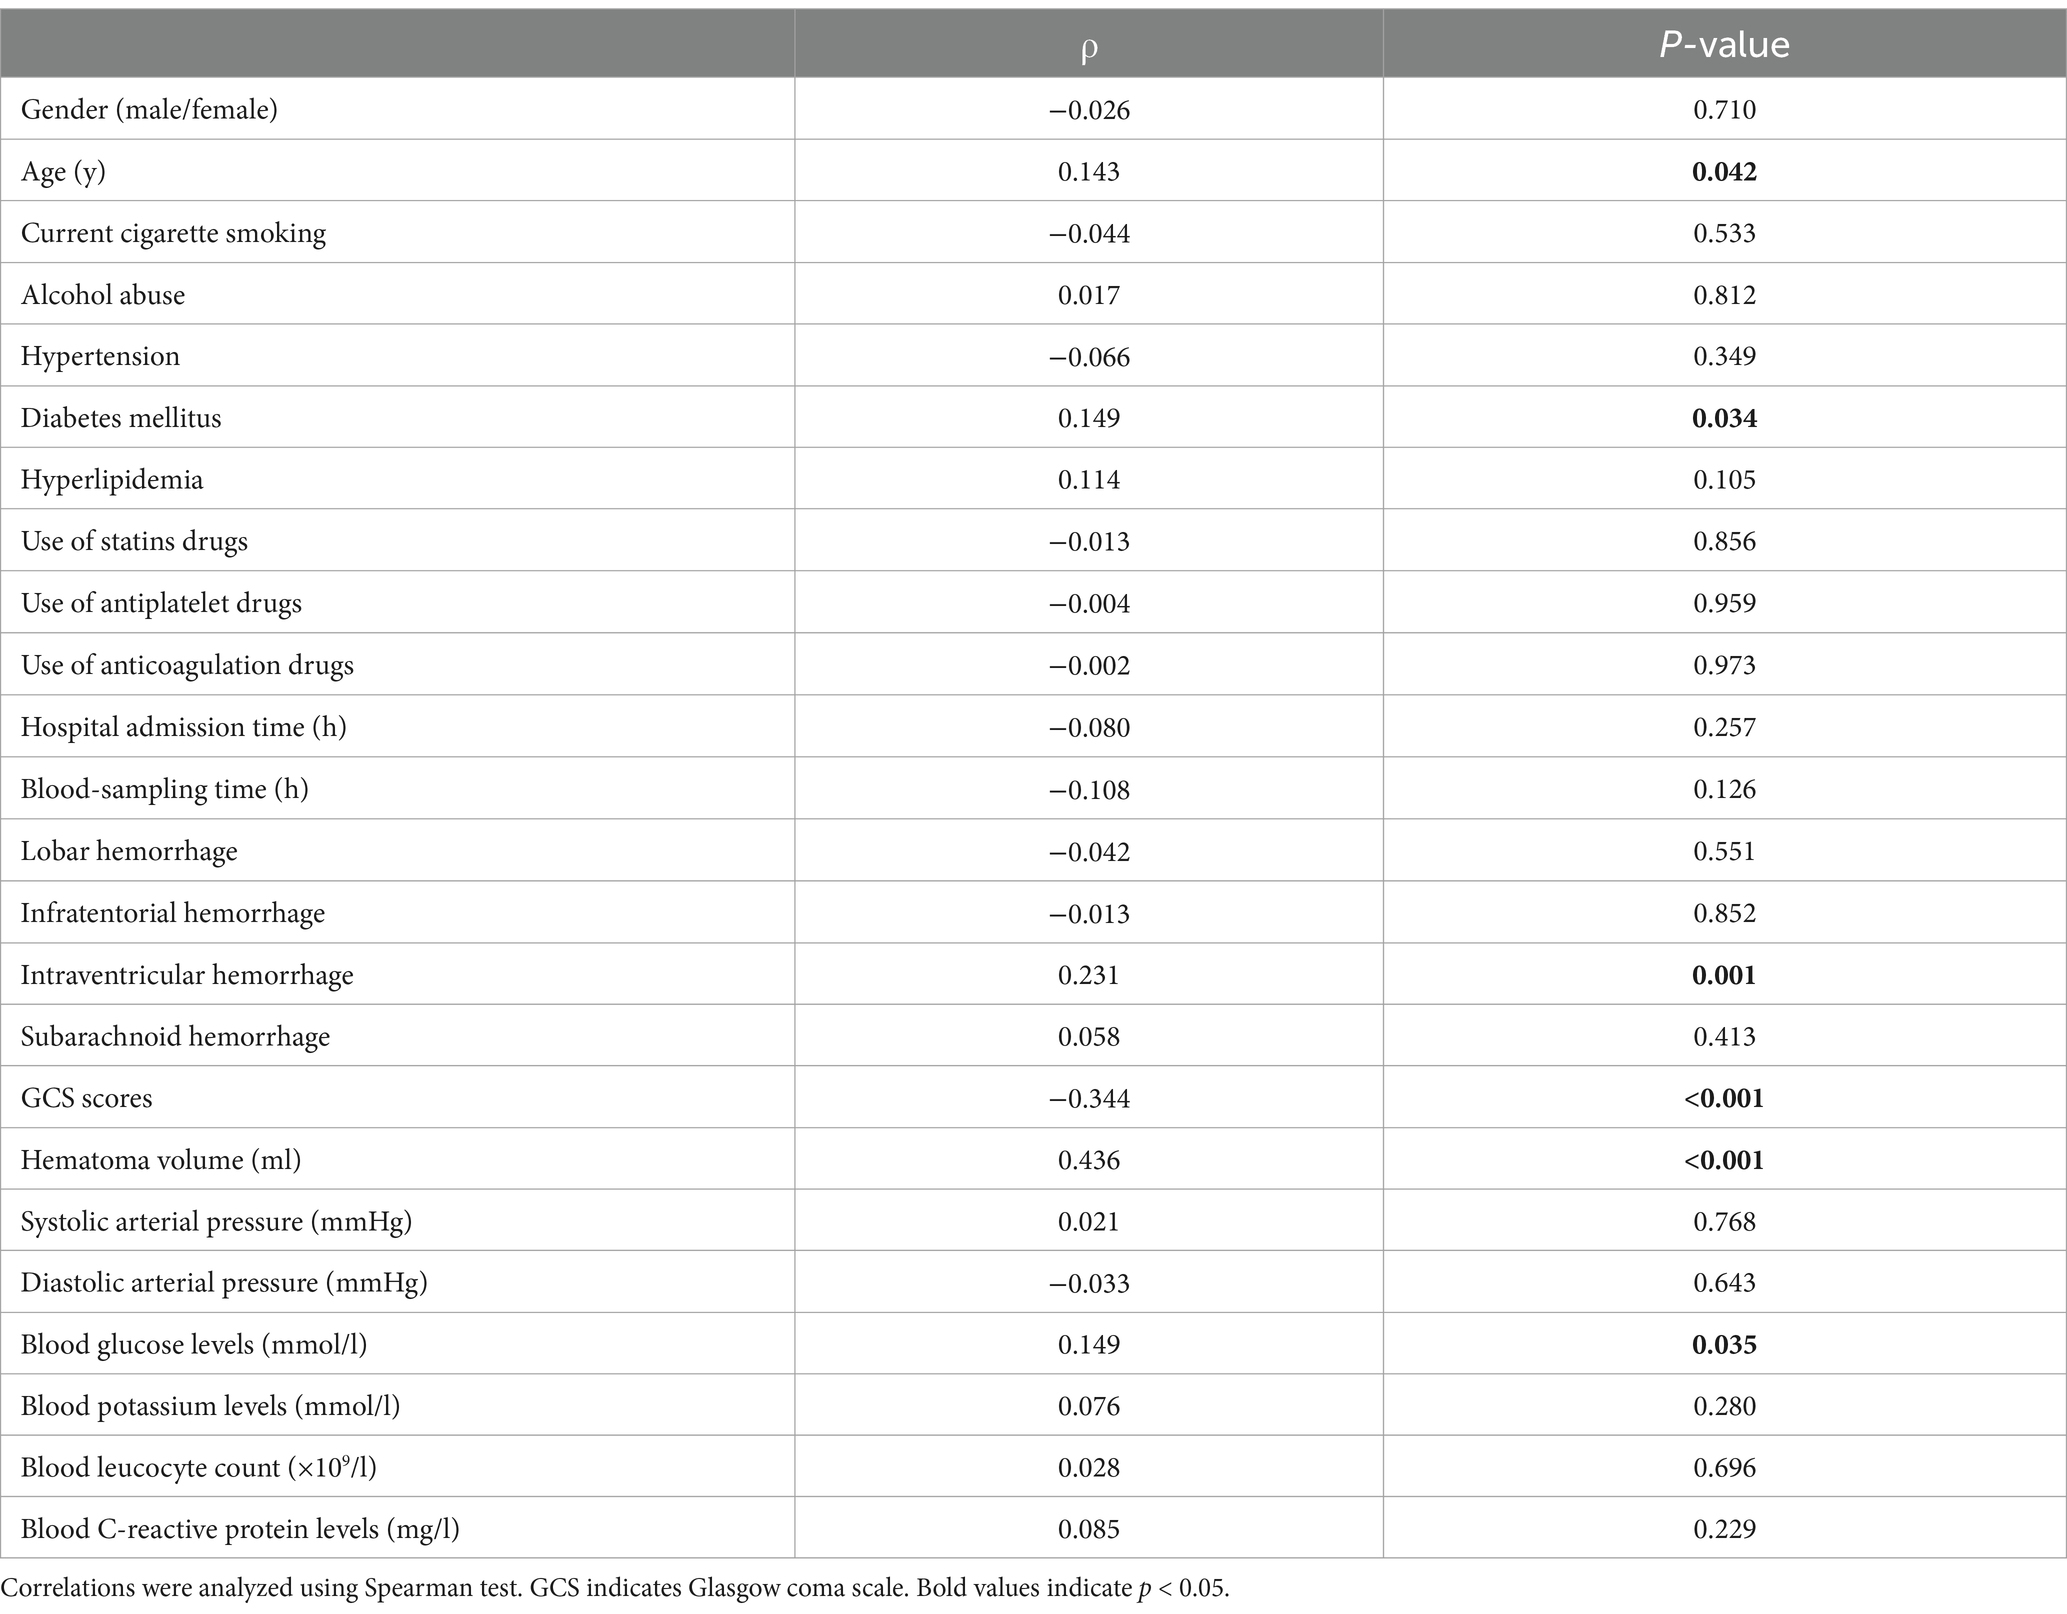
Table 1. Factors correlated with serum neuritin levels after intracerebral hemorrhage.
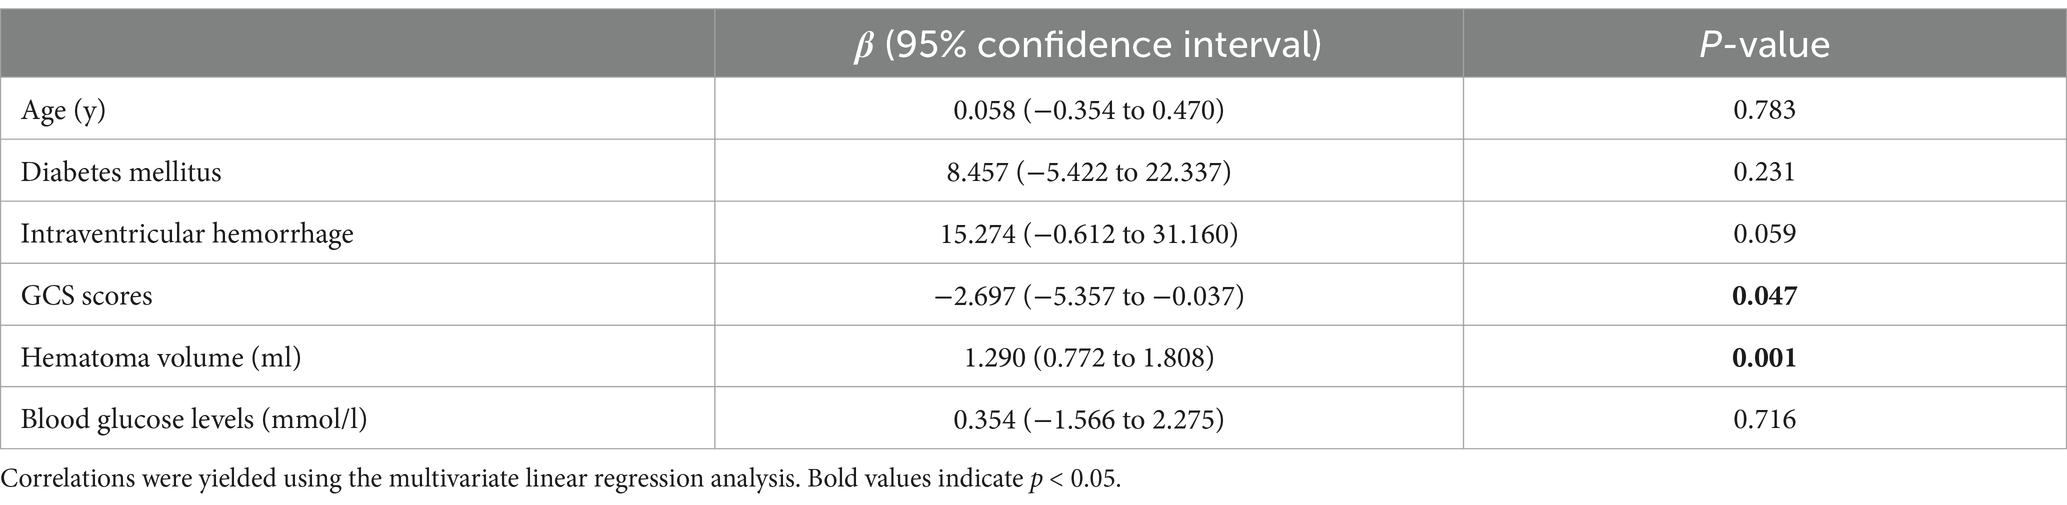
Table 2. Multivariate linear regression analysis between elevated serum neuritin levels and other variables.
3.3 Relationship between serum neuritin levels and post-ICH neurological outcome
Serum neuritin levels were significantly increased in patients with poor prognoses, as opposed to those with good prognoses (p < 0.001; Supplementary Figure S5).
Using the as a continuous variable in a linear analysis, it showed a clear positive correlation with the serum neuritin levels of patients (p < 0.001; Supplementary Figure S6A). Furthermore, the ICH patients were classified into seven groups based on their mRS scores from 0 to 6. There was a marked trend by a graphical representation that serum neuritin levels were increased in the order of the scores from 0 to 6 (p < 0.001; Supplementary Figure S6B). In the context of restricted cubic spline assessment, there was a linear concentration-response relationship between serum neuritin and risk of 90-day poor outcome (P for non-linear >0.05; Supplementary Figure S7). Moreover, under the ROC curve, serum neuritin levels efficaciously predicted post-stroke 90-day poor outcomes among this group of ICH patients (AUC, 0.771; 95% CI, 0.707–0.827), and serum neuritin levels >238.0 pg./mL distinguished patients with development of poor 90-day outcomes with specificity and sensitivity values of 88.29 and 56.04% (Youden index J, 0.4433), respectively (Figure 1).
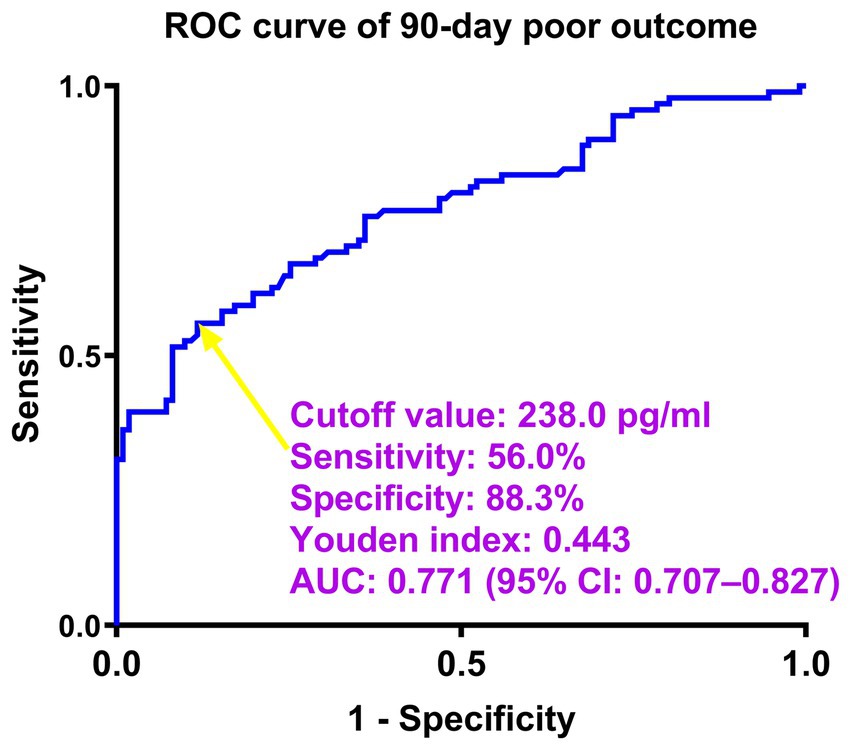
Figure 1. Predictive ability of serum neuritin levels for poor outcomes at 90 days after intracerebral hemorrhage under the receiver-operating characteristic curve. Serum neuritin levels significantly predicted post-stroke 90-day poor outcome (area under the curve, 0.771; 95% confidence interval, 0.707–0.827). Serum neuritin levels >238.0 pg./mL distinguished patients with the development of poor 90-day outcomes with specificity and sensitivity values of 88.3 and 56.0% (maximum Youden index J, 0.4433), respectively. ROC denotes receiver operating characteristic; AUC, area under the curve; 95% CI, 95% confidence interval. The yellow arrow points to the cutoff value of serum neuritin levels.
From the perspective of statistics, mRS was recognized as an ordinal variable. Serum neuritin levels, GCS scores, hematoma volume, diabetes mellitus, blood C-reactive protein levels, and intraventricular hemorrhage significantly differed among seven groups, which were divided at a base of mRS (all p < 0.05; Table 3). With the help of the multifactorial ordinal regression analysis, GCS scores, hematoma volume, and serum neuritin levels were independently associated with mRS scores at 90 days after ICH (all p < 0.01; Table 4).
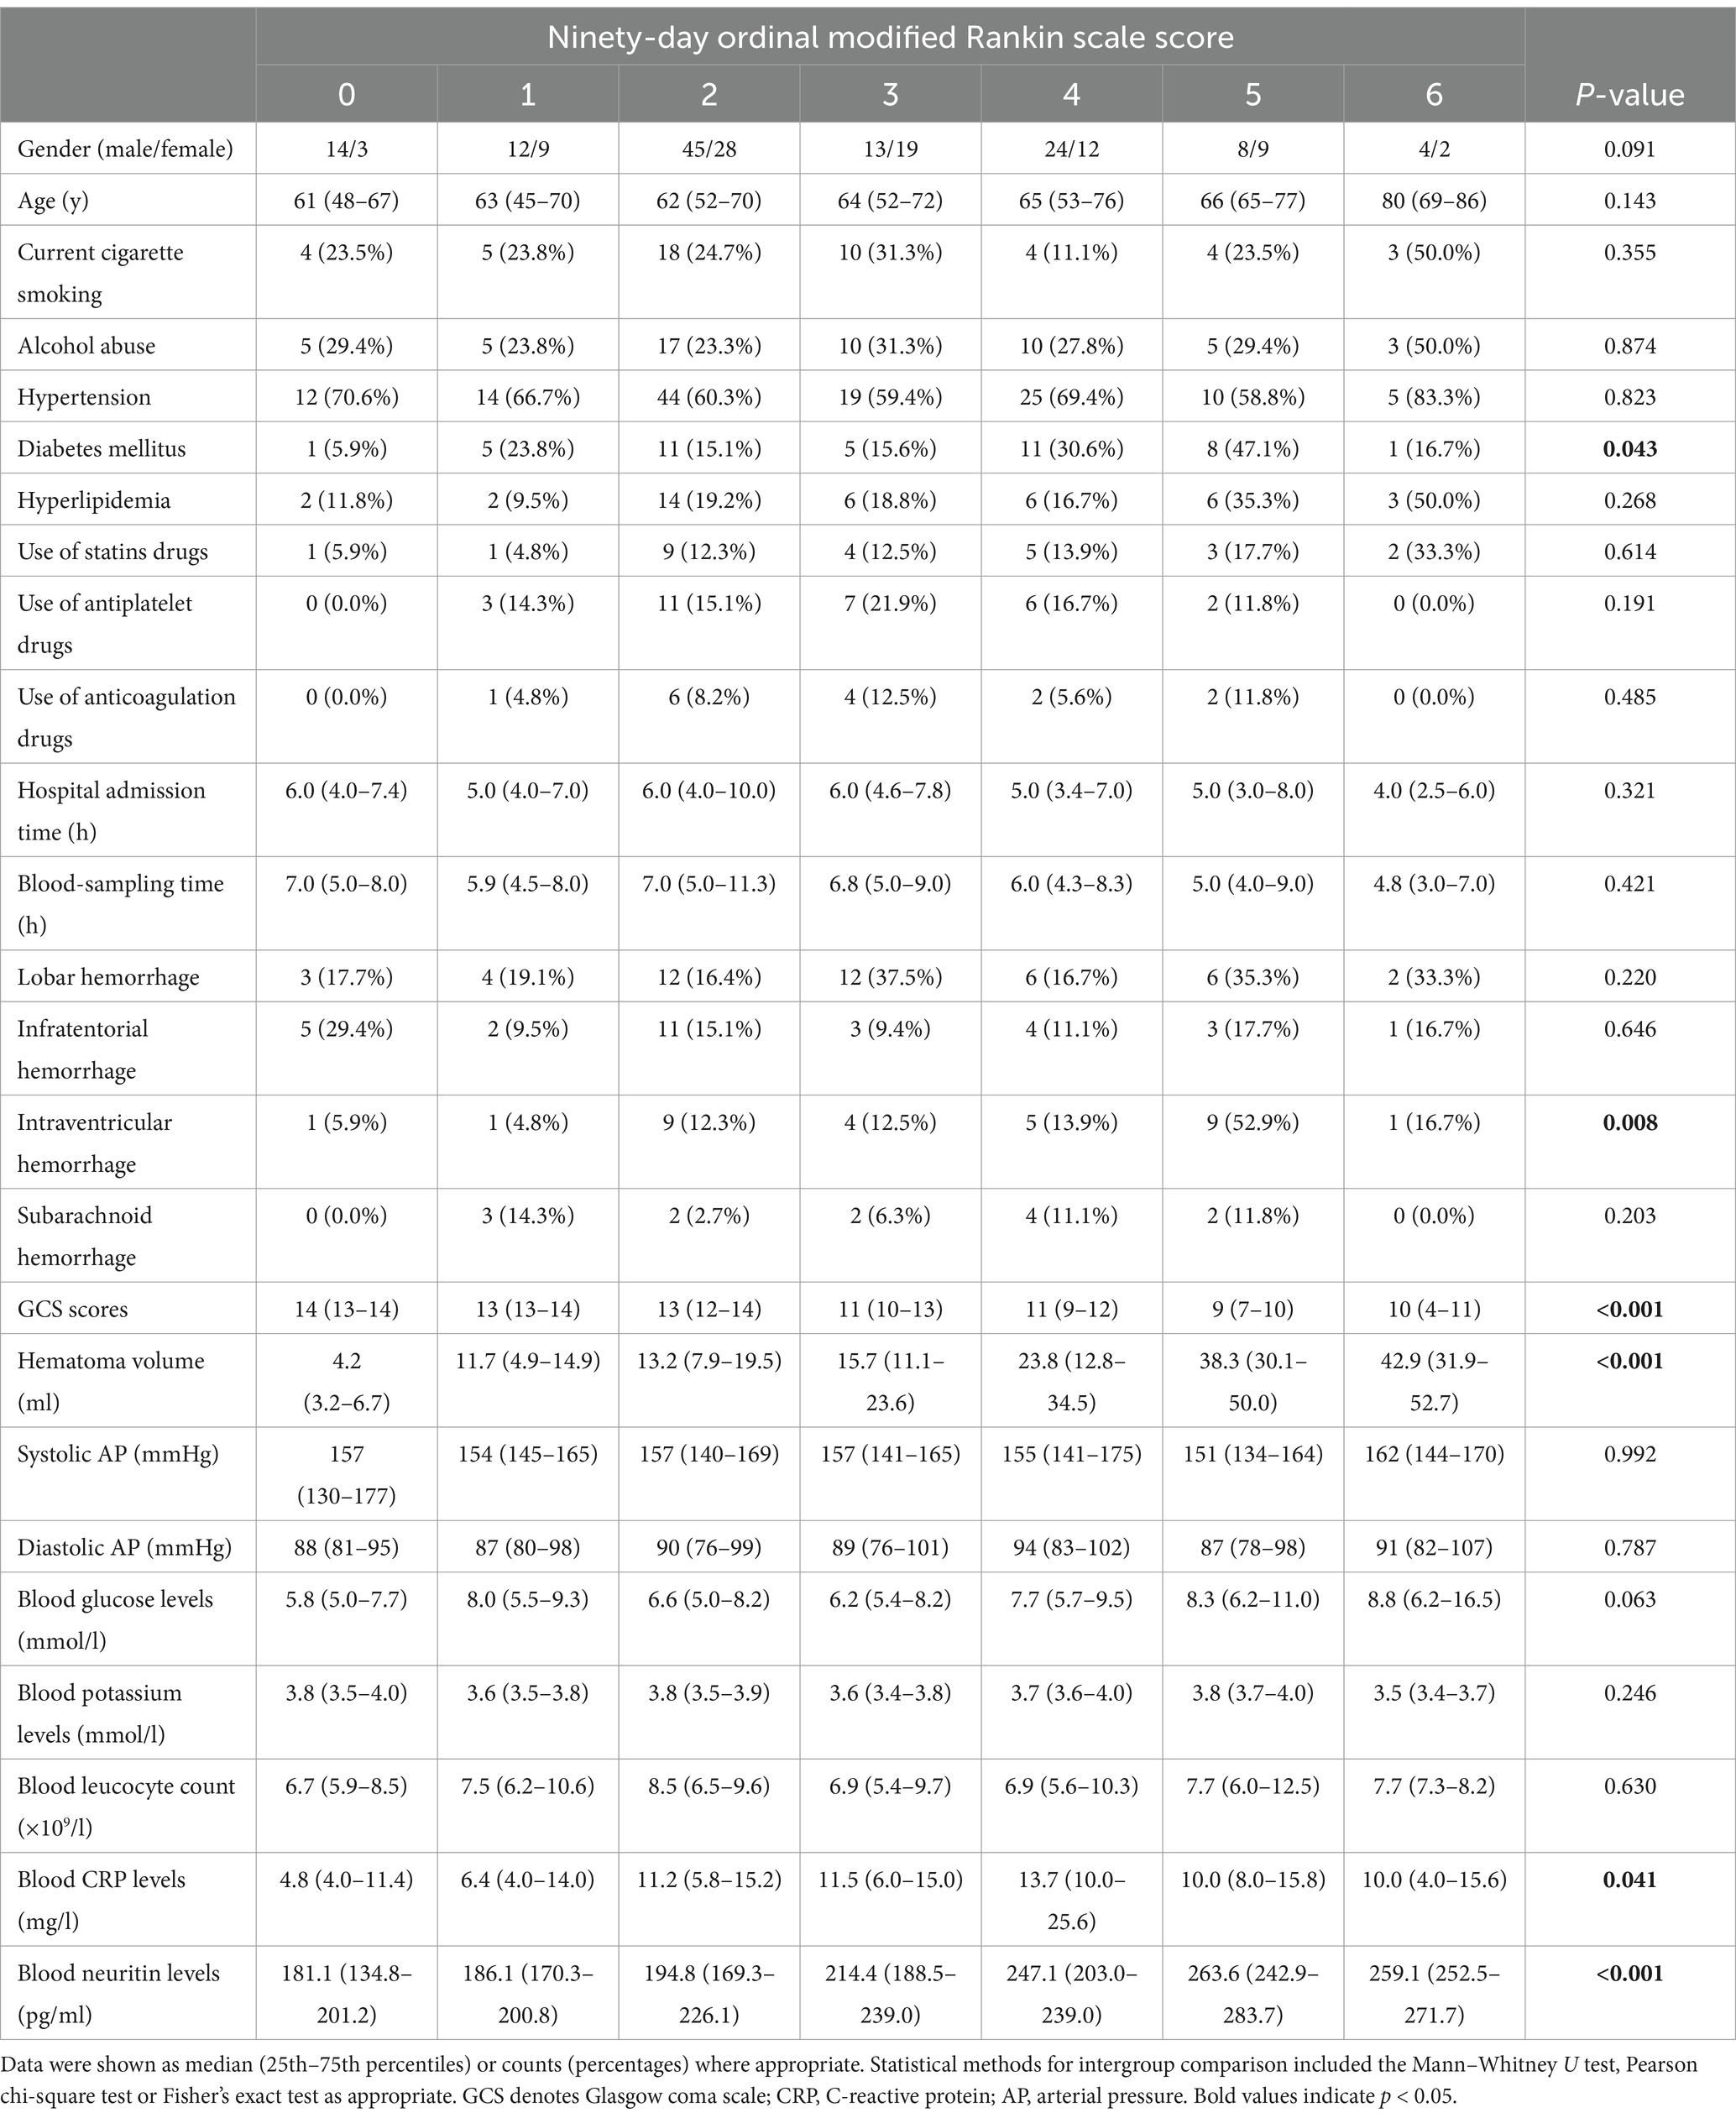
Table 3. Factors associated with ordinal 90-day modified Rankin scale scores after intracerebral hemorrhage.
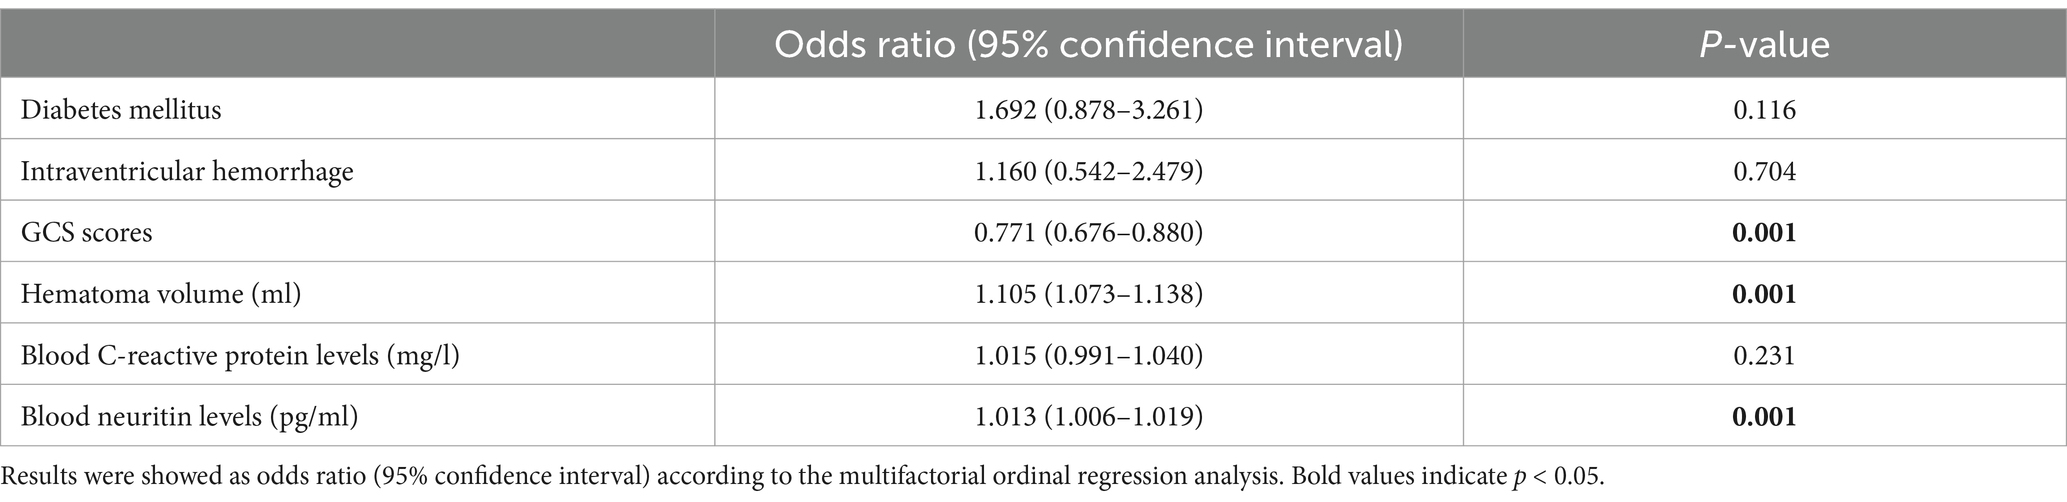
Table 4. Multifactorial ordinal regression analysis of risk factors for modified Rankin scale scores at 90 days after intracerebral hemorrhage.
As shown in Table 5, patients with a poor prognosis, relative to those presenting with a good prognosis, tended to have significantly higher age, hematoma volume, blood glucose levels, and serum neuritin levels, were likely to exhibit substantially lower GCS scores, and were prone to display markedly higher percentages of diabetes mellitus and intraventricular hemorrhage (all p < 0.05). By applying the binary logistic regression analysis, GCS scores, hematoma volume, and serum neuritin levels emerged as the three independent predictors of poor prognosis at 90 days after ICH (all p < 0.01; Table 6).
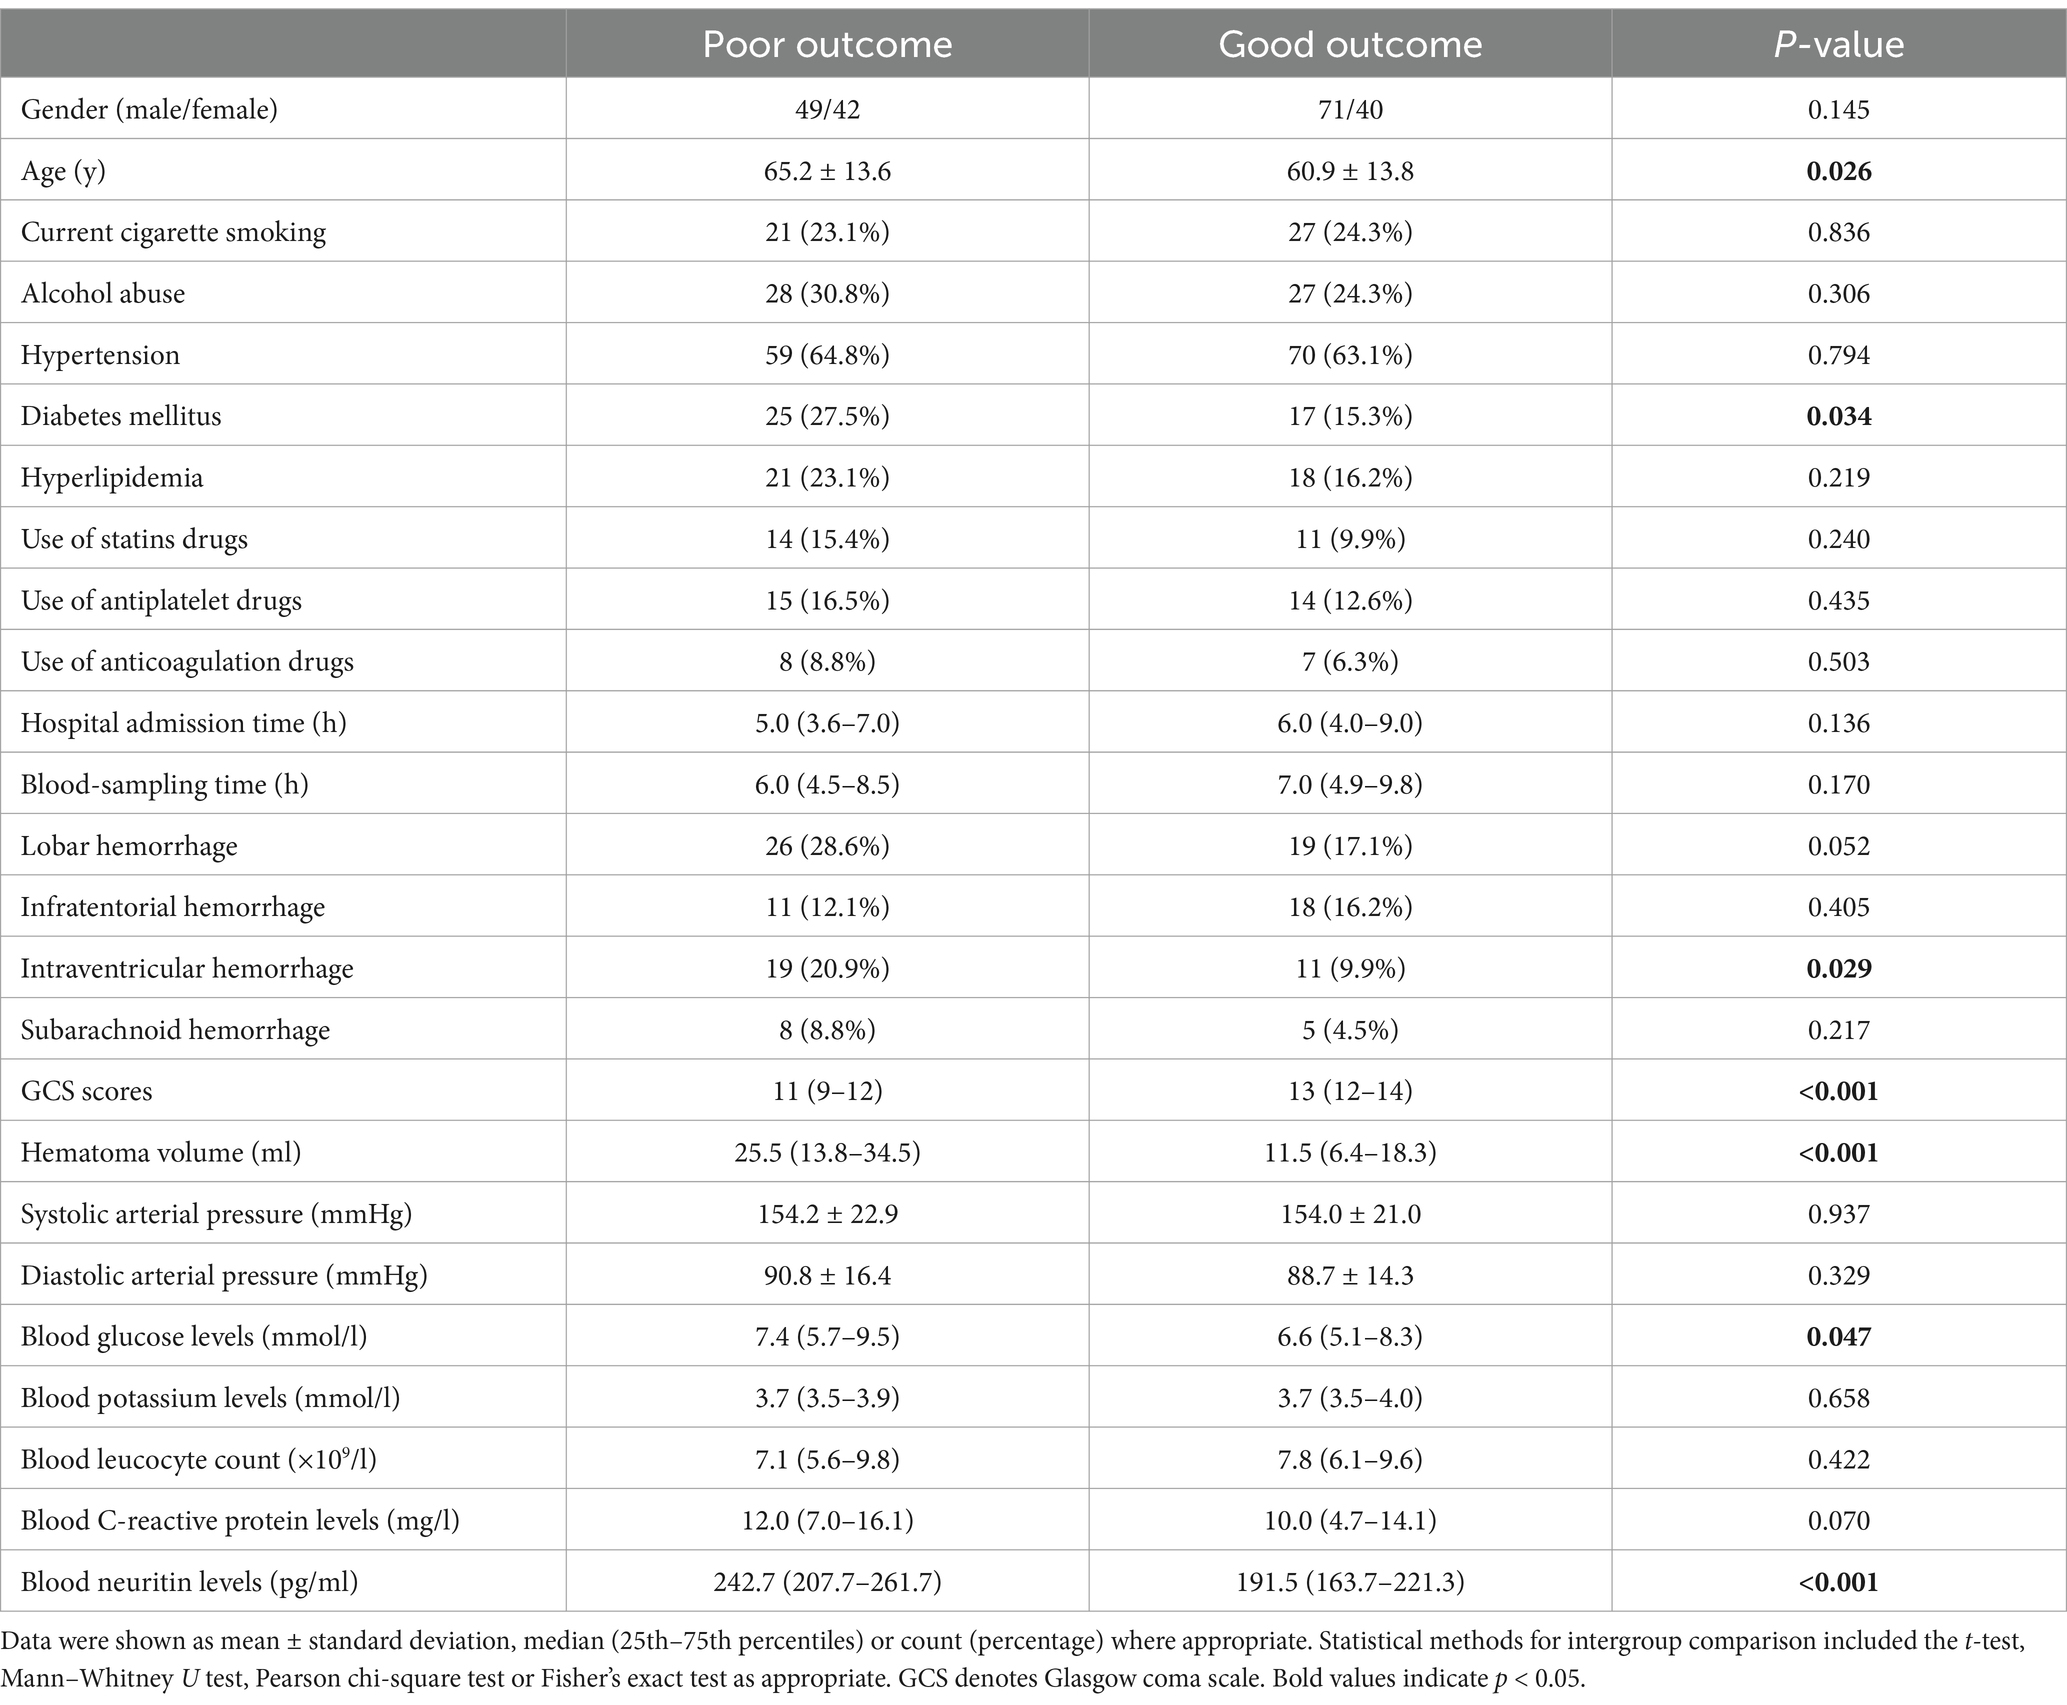
Table 5. Factors associated with 90-day poor outcome after intracerebral hemorrhage.
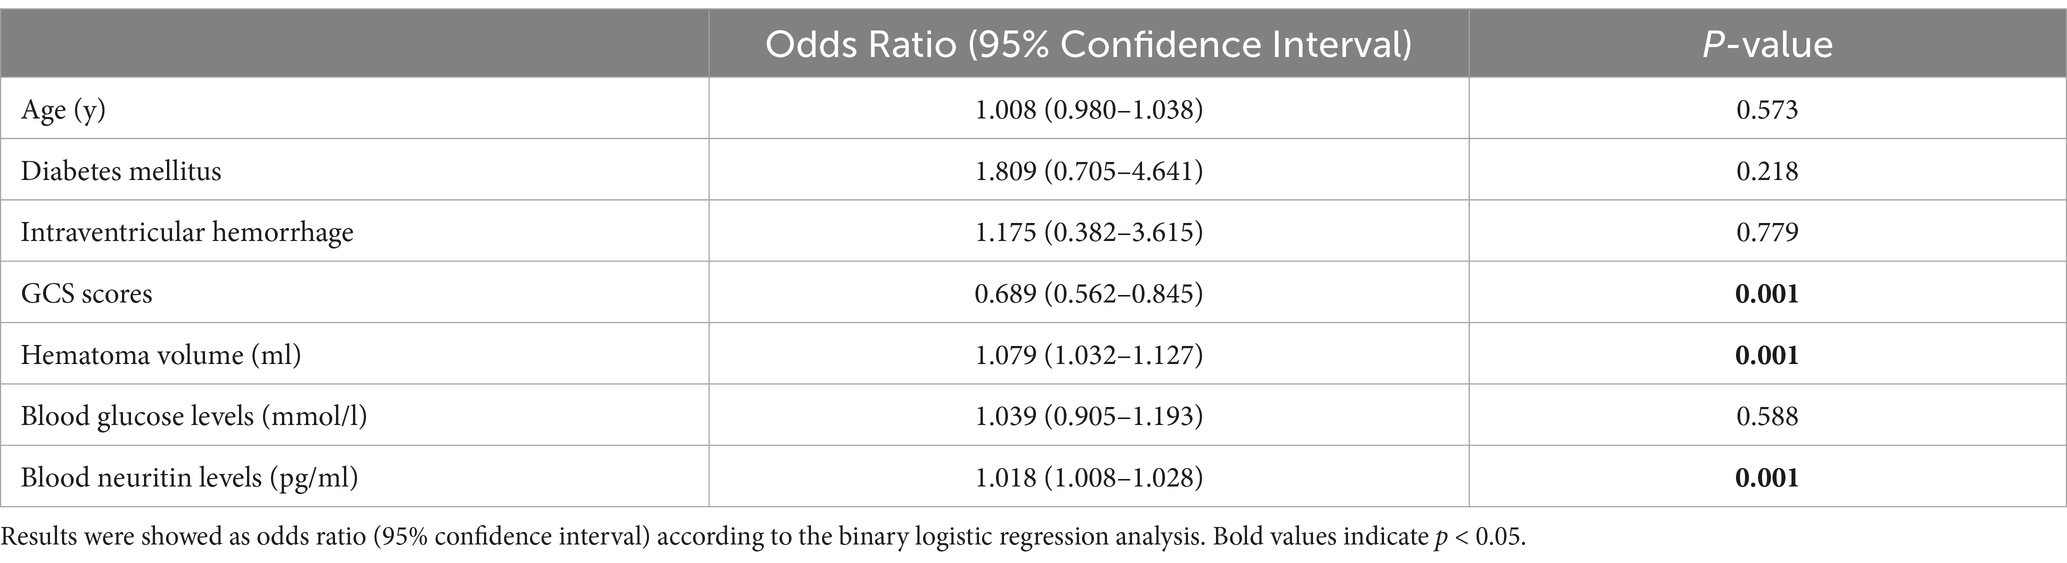
Table 6. Multivariate logistic regression analysis for risk factors of poor outcome in intracerebral hemorrhage.
As displayed in Figure 2, the ability of serum neuritin levels in prognosticating poor prognosis was equivalent to those of GCS scores (AUC, 0.807; 95% CI, 0.745–0.859; p = 0.408) and hematoma volume (AUC, 0.801; 95% CI, 0.739–0.854; p = 0.451). The independent predictors of poor prognosis, i.e., GCS, hematoma volume, and serum neuritin, were combined to configure a model, which was delineated by adopting a nomogram for visual representation (Figure 3). The combined model represented higher prognostic and predictive efficiency than any of GCS, hematoma volume, and serum neuritin (all p < 0.01; Figure 2). Under the calibration curve, the prediction model ran acceptably stably (Figure 4). Using decision curve analysis, the prediction model had satisfactory clinical fitness (Figure 5). Furthermore, 101 patients were randomly extracted from the whole group of 202 patients. Supplementary Table S1 showed no significant distinctions of baseline features between the whole group and the extracted 101 patients (all p > 0.05). There were no substantial differences in terms of the predictive ability of both serum neuritin levels and the combination model in anticipating poor prognosis under the ROC curve between all 202 patients and the extracted 101 patients (both p > 0.05; Supplementary Figures S8, S9). Moreover, we defined GCS scores of 3–8 as 2, 9–12 as 1, and 13–15 as 0. Hematoma volume ≥ 30 mL was defined as 1, and hematoma volume < 30 mL was defined as 0. Serum neuritin levels ≥238.0 pg./mL were defined as 1, while levels less than 238.0 pg./mL were defined as 0. Percentages of patients with poor prognosis, which were 13.0% (10/77), 44.6% (29/65), 78.1% (25/32), 94.7% (18/19), and 100% (9/9) successively, were gradually increased in the order of the total scores from 0 to 4.
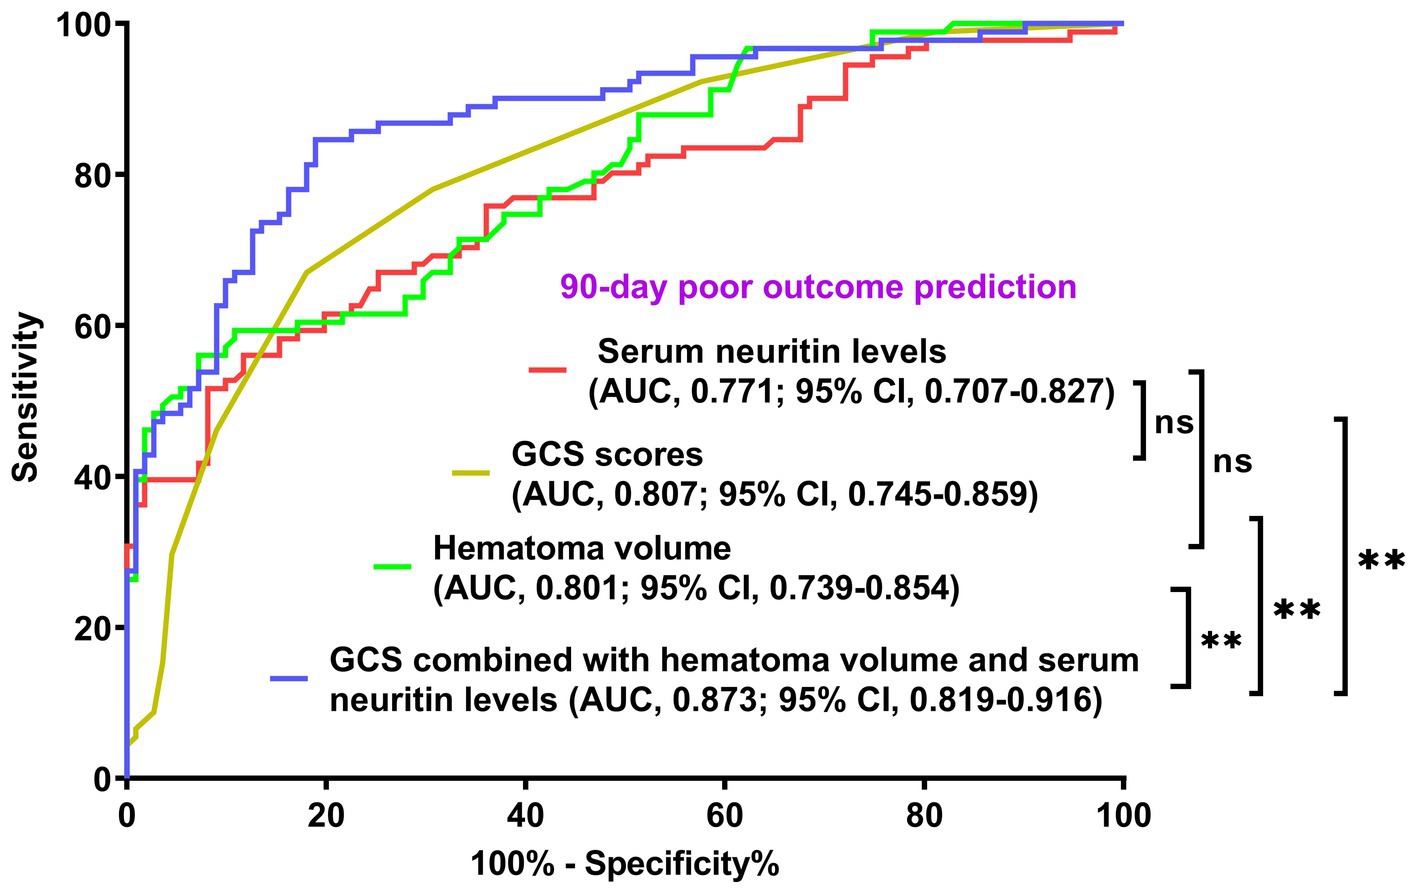
Figure 2. Comparison of discriminatory capability with respect to serum neuritin levels, Glasgow coma scale scores, hematoma volume, and combined model for 90-day poor outcome following intracerebral hemorrhage under the receiver operating characteristic curve. Prognostic predictive ability of serum neuritin level (area under curve, 0.771; 95% confidence interval, 0.707–0.827) was similar to those of Glasgow coma scale scores (area under curve, 0.807; 95% confidence interval, 0.745–0.859; p = 0.408) and hematoma volume (area under curve, 0.801; 95% confidence interval, 0.739–0.854; p = 0.451). Combined models, which contained Glasgow coma scale scores, hematoma volume, and serum neuritin levels, represented higher prognostic predictive efficiency than any of them (all **p < 0.01). GCS means Glasgow coma scale; AUC, area under the curve; 95% CI, 95% confidence interval; ns, non-significant.
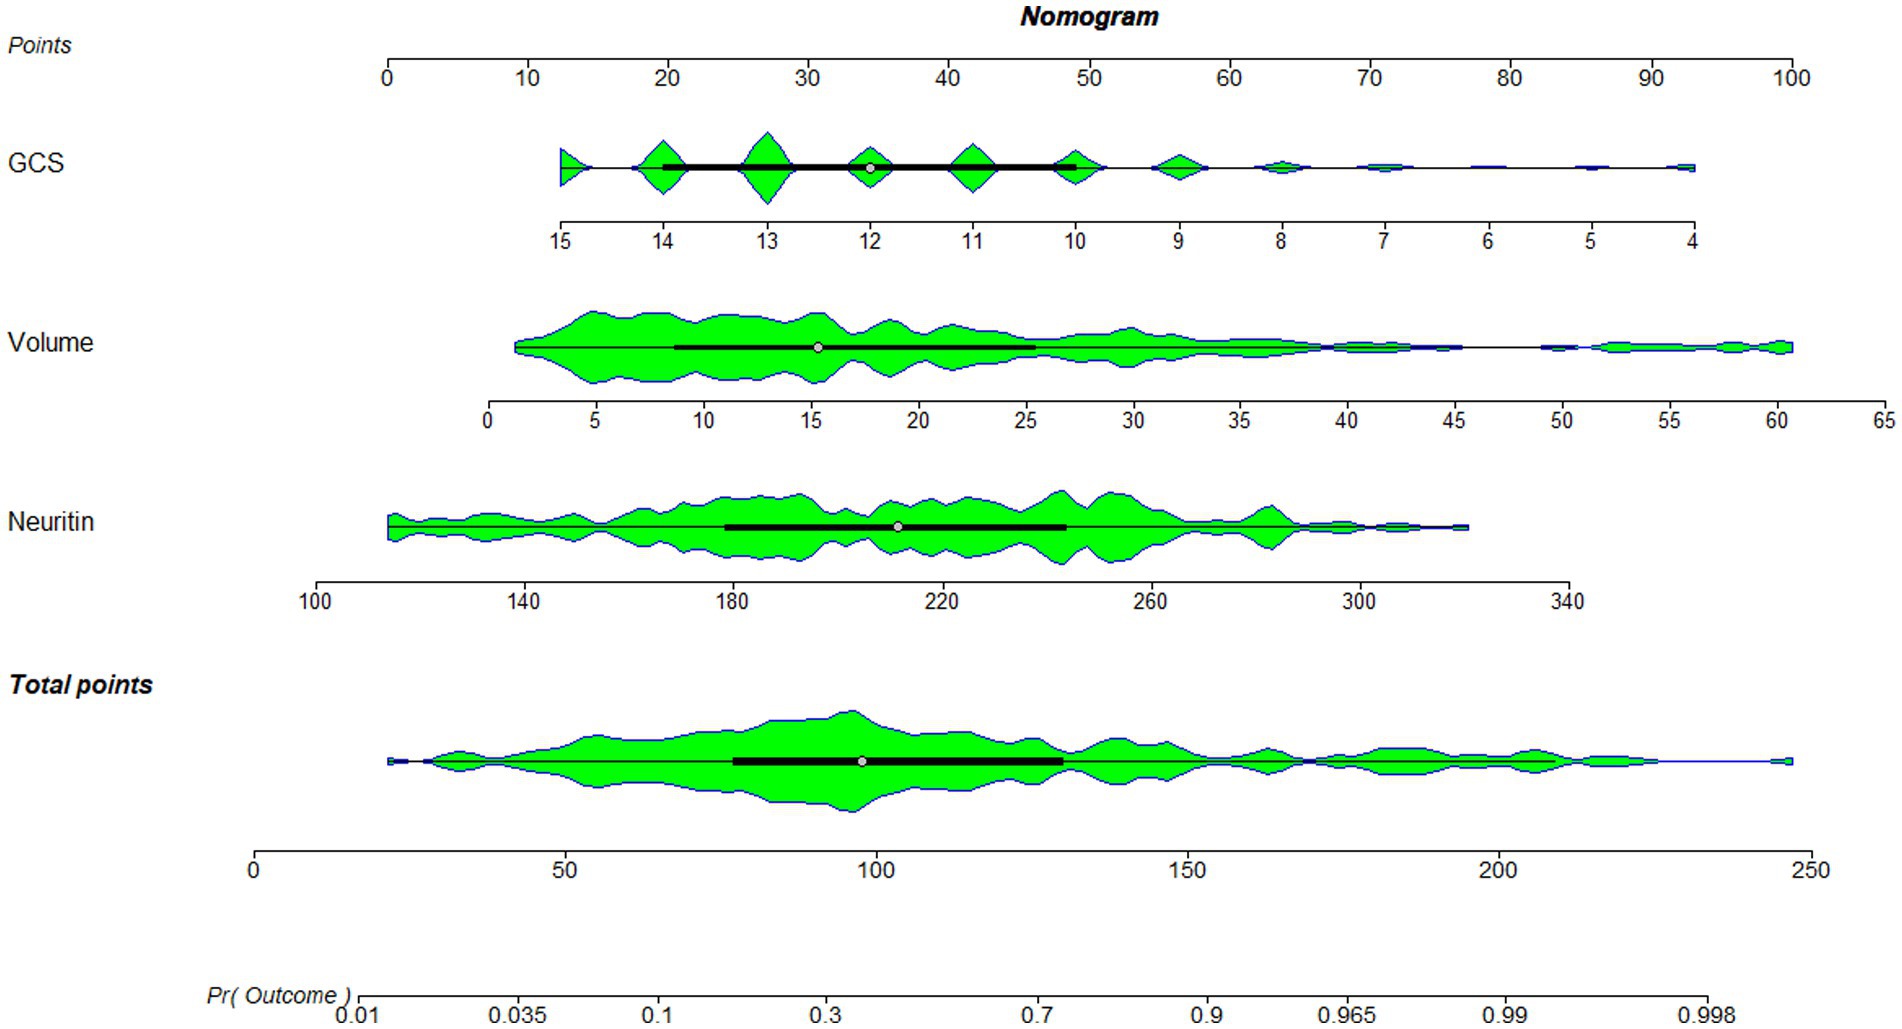
Figure 3. Nomogram combining serum neuritin levels at admission, Glasgow coma scale scores, and hematoma volume for predicting post-stroke 90-day poor prognosis. A nomogram was established to assess how the combination model was used to predict a poor prognosis at 90 days after intracerebral hemorrhage. GCS denotes the Glasgow coma scale, which is volume and hematoma volume.
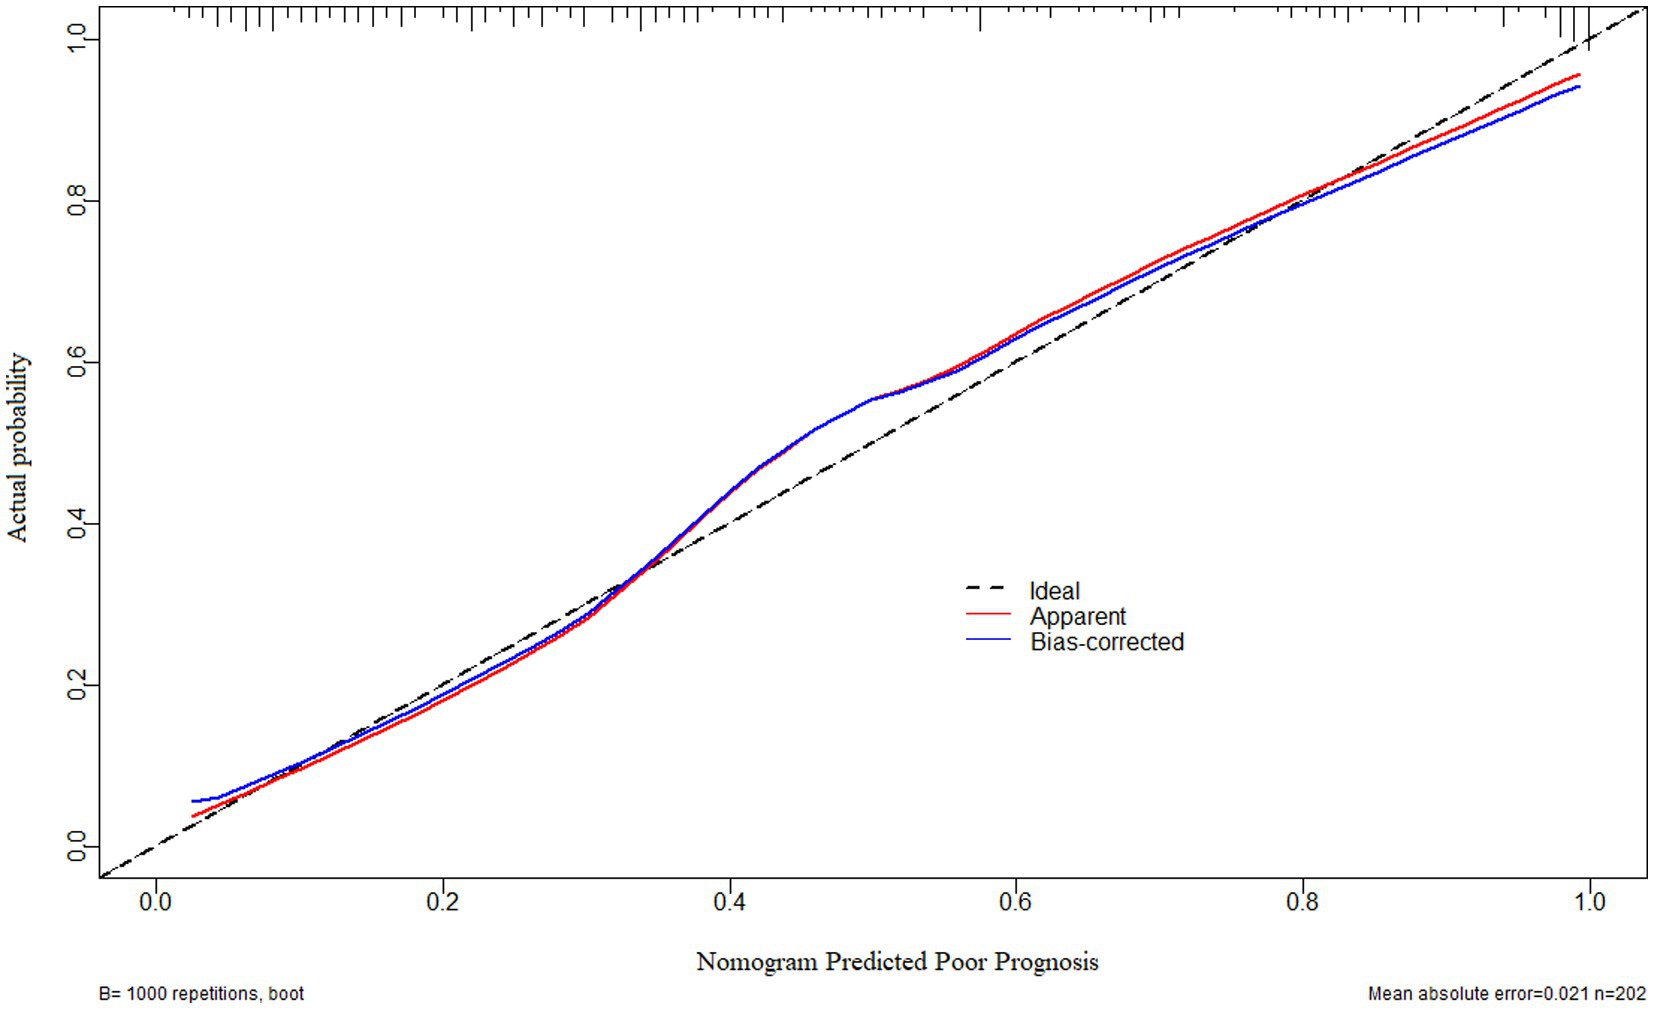
Figure 4. Calibration curve verifying the stability of a prognostic prediction model containing serum neuritin levels at admission, Glasgow coma scale scores, and hematoma volume after intracerebral hemorrhage. Under the calibration curve, such a prediction model was relatively stable.
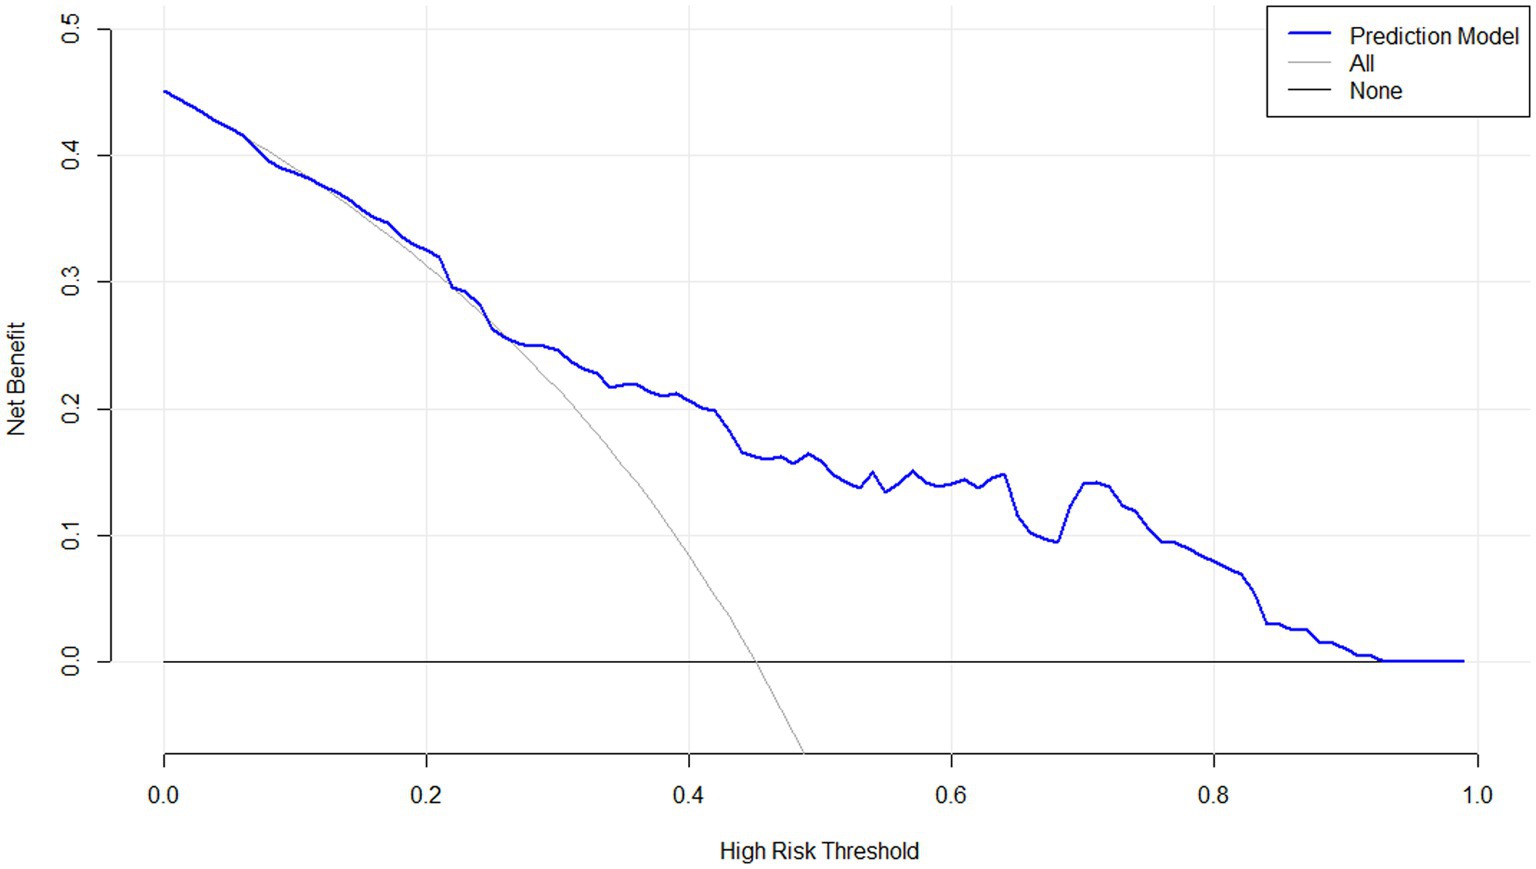
Figure 5. Decision curve confirming the clinical benefit of a prognostic prediction model containing serum neuritin levels at admission among patients with intracerebral hemorrhage. Decision curve analysis demonstrated that such a prediction model combining serum neuritin levels at admission, Glasgow coma scale scores, and hematoma volume, relatively speaking, had a high clinical benefit.
3.4 Relationship between serum neuritin levels and END after ICH
Serum neuritin levels in patients suffering from END were significantly higher than those in those without (p < 0.001; Supplementary Figure S10). By utilizing a restricted cubic spline, serum neuritin levels were linearly correlated with END probability (P for non-linear >0.05; Supplementary Figure S11). Moreover, under the ROC curve, serum neuritin levels efficiently predicted END among this group of ICH patients (AUC, 0.794; 95% CI, 0.732–0.848), and serum neuritin levels >242.5 pg./mL distinguished patients at the development of END with specificity and sensitivity values of 86.90 and 63.16% (Youden index J, 0.5005), respectively (Figure 6).
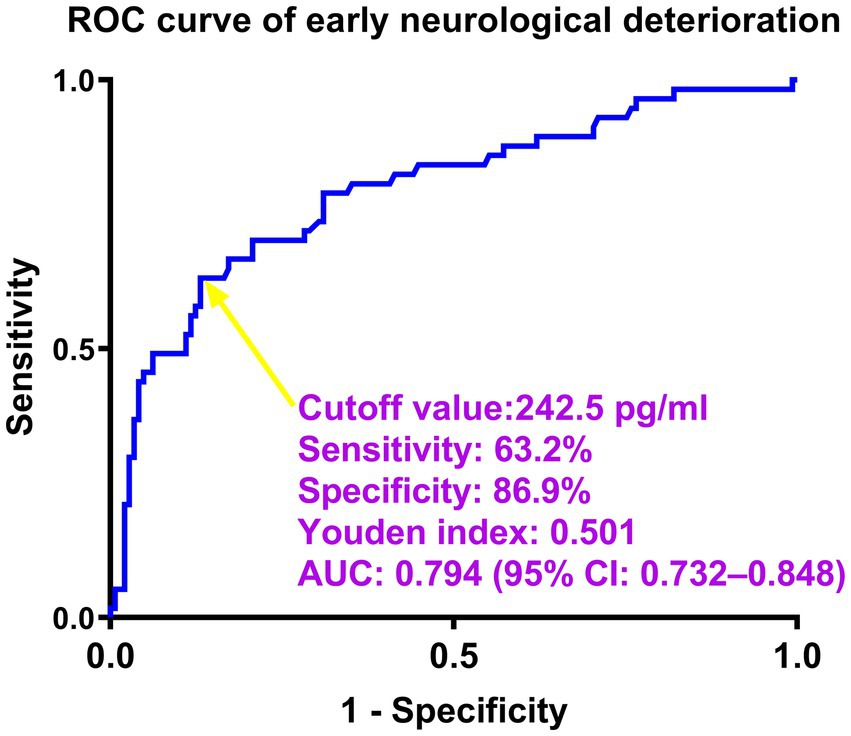
Figure 6. Predictive ability of serum neuritin levels for early neurological deterioration after intracerebral hemorrhage under the receiver-operating characteristic curve. Serum neuritin levels significantly predicted early neurological deterioration (area under the curve, 0.794; 95% confidence interval, 0.732–0.848). Serum neuritin levels >242.5 pg./mL distinguished patients with the development of early neurological deterioration with specificity and sensitivity values of 86.9 and 63.2% (maximum Youden index J, 0.501), respectively. ROC means receiver operating characteristic; AUC, area under the curve; 95% CI, 95% confidence interval. A yellow arrow points to the cutoff value of serum neuritin levels.
As listed in Table 7, significantly lower GCS scores, substantially higher hematoma volumes, blood glucose levels, and serum neuritin levels, and markedly higher proportions of intraventricular hemorrhage and diabetes mellitus were confirmed in patients with END than in those without (all p < 0.05). Under application of the multivariate logistic regression analysis, GCS scores, hematoma volume, and serum neuritin levels were three independent predictors of END after ICH (all p < 0.05; Table 8). Moreover, Figure 7 shows that its discriminatory ability was similar to those of GCS scores (AUC, 0.836; 95% CI, 0.778–0.884; p = 0.314) and hematoma volume (AUC, 0.818; 95% CI, 0.757–0.868; p = 0.543). The three predictors were consolidated to establish a model, and subsequently, a nomogram was drawn for a visual manifestation of the prediction model (Figure 8). Under calibration curve evaluation, the prediction model was marked by high stability (Figure 9). Using decision curve analysis, the prediction model was clinically valid (Figure 10).
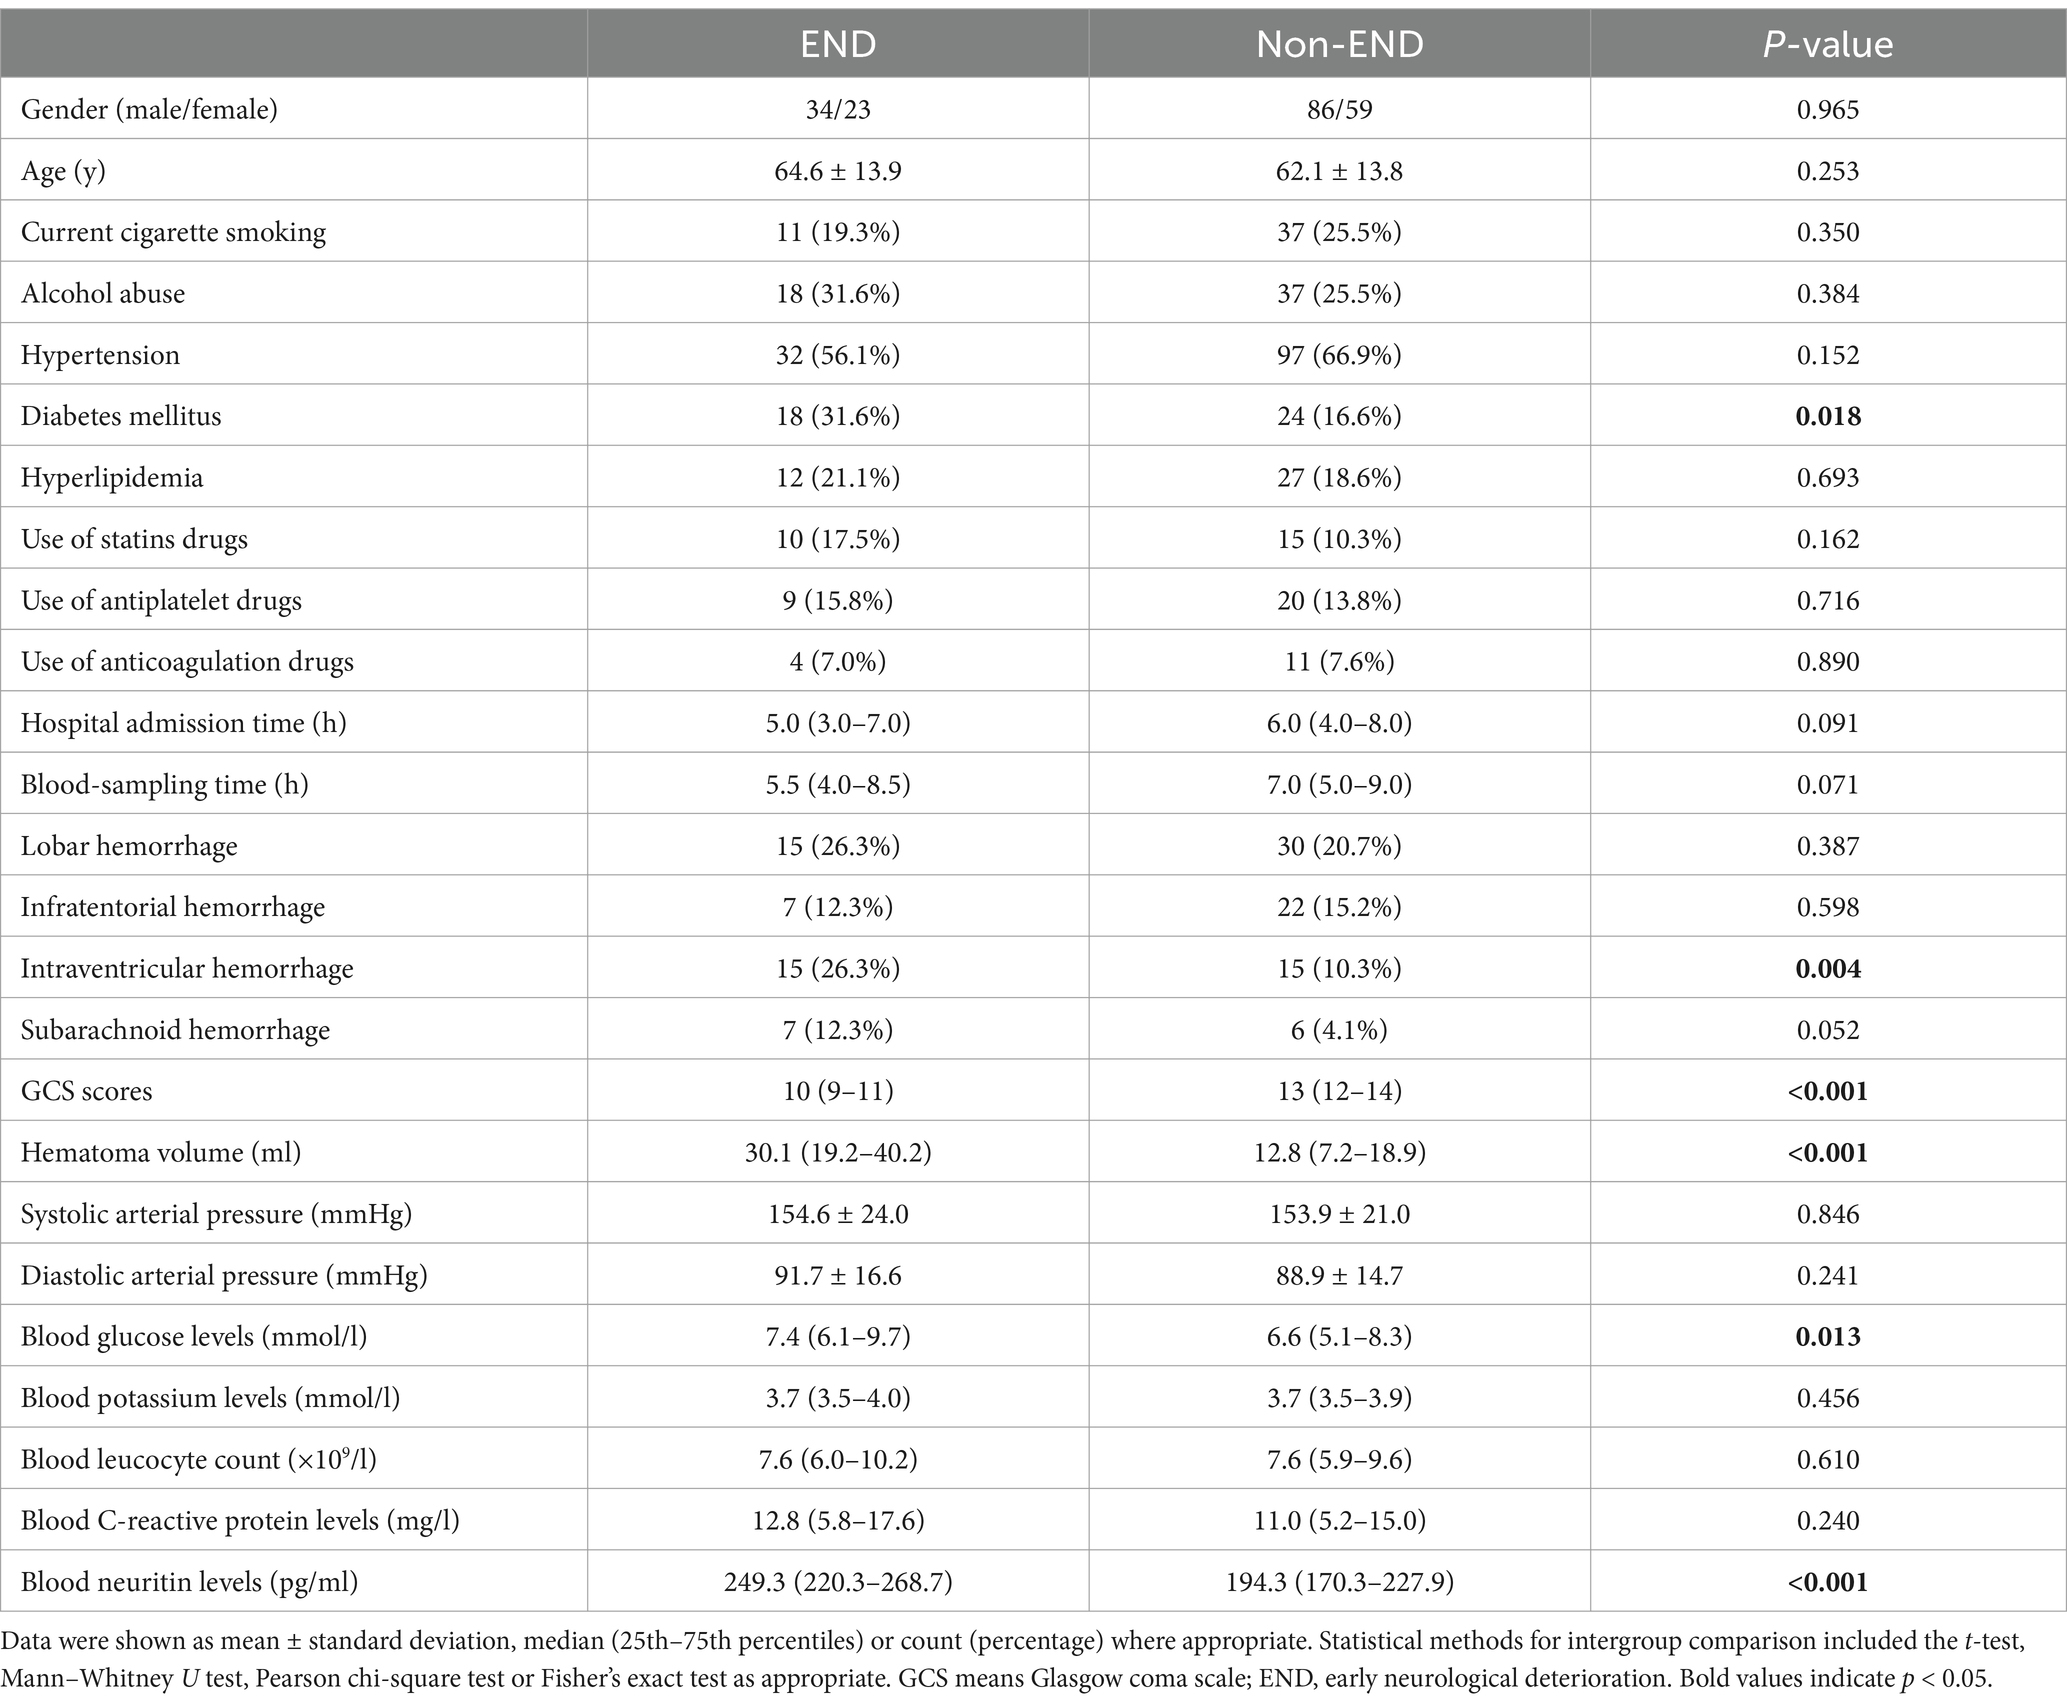
Table 7. Factors associated with early neurological deterioration after intracerebral hemorrhage.
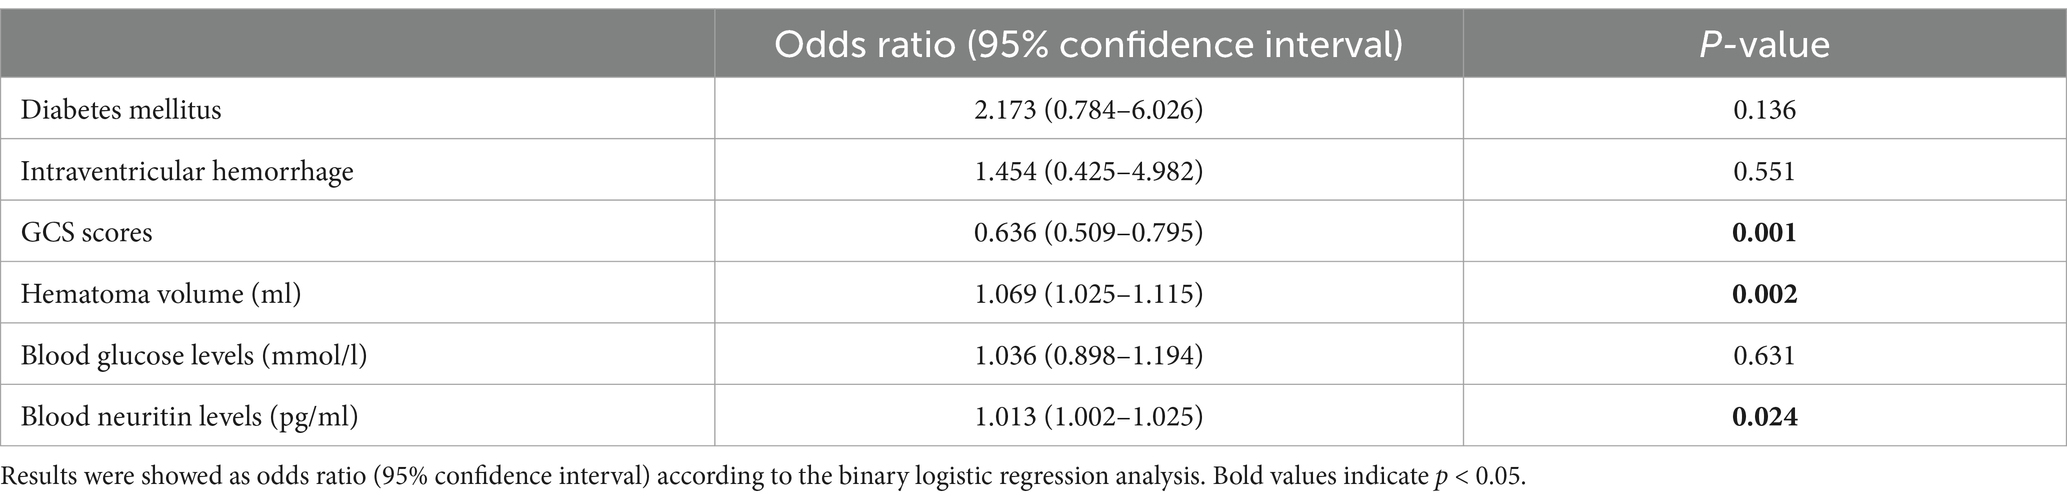
Table 8. Multivariate logistic regression analysis for risk factors of early neurological deterioration in intracerebral hemorrhage.
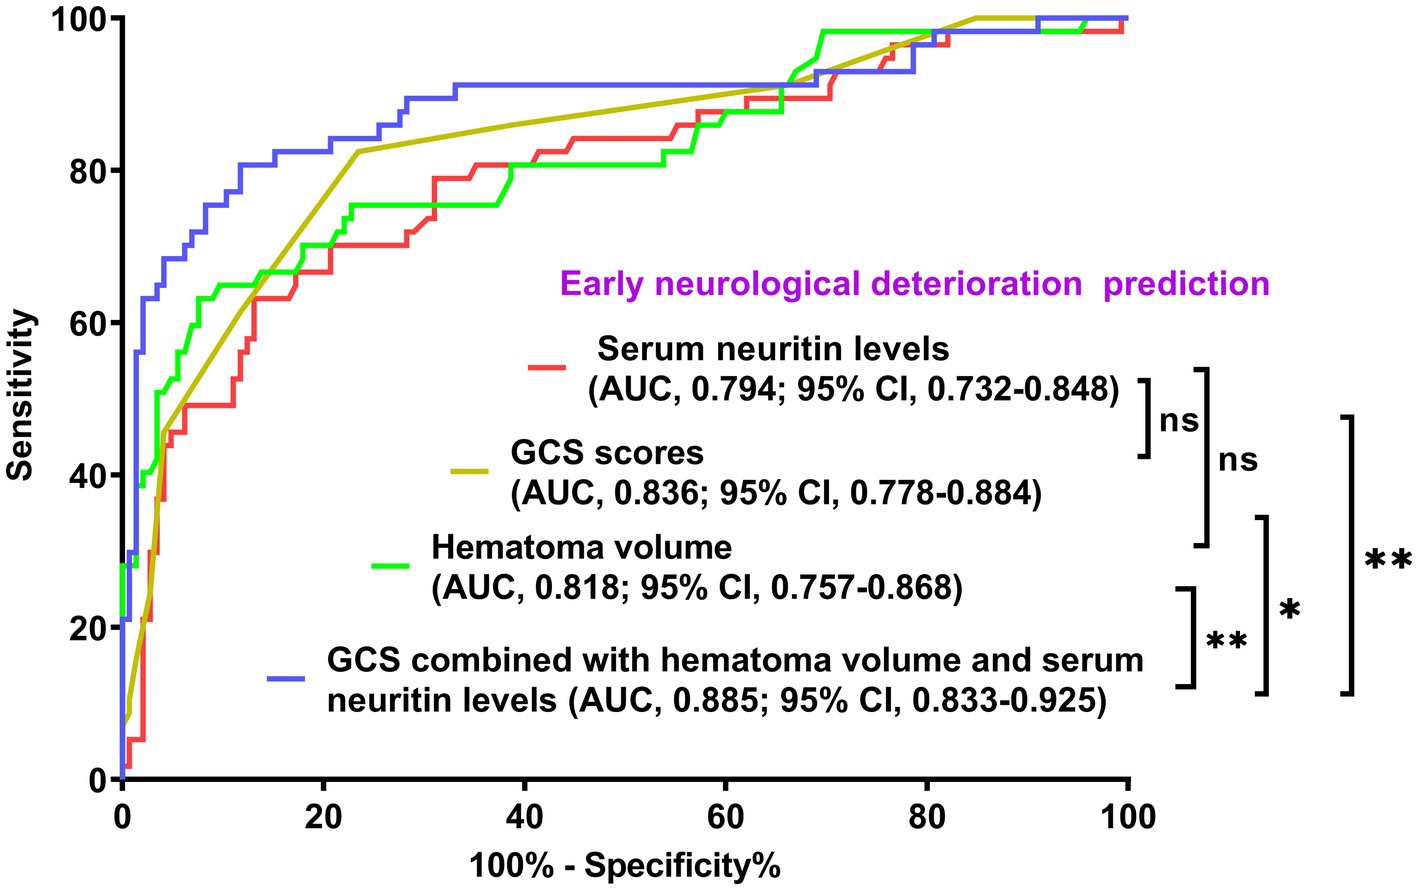
Figure 7. Comparison of discriminatory capability with respect to serum neuritin levels, Glasgow Coma Scale scores, and hematoma volume for early neurological deterioration following intracerebral hemorrhage under the receiver operating characteristic curve. The predictive ability of serum neuritin level (area under the curve, 0.794; 95% confidence interval, 0.732–0.848) was similar to those of Glasgow coma scale scores (area under the curve, 0.836; 95% confidence interval, 0.778–0.884; p = 0.314) and hematoma volume (area under the curve, 0.818; 95% confidence interval, 0.757–0.868; p = 0.543). Combined models containing the Glasgow Coma Scale scores, hematoma volume, and serum neuritin levels represented higher early neurological deterioration predictive efficiency than any of them (*p < 0.05 or **p < 0.01). GCS means Glasgow coma scale; AUC, area under the curve; 95% CI, 95% confidence interval; ns, non-significant.
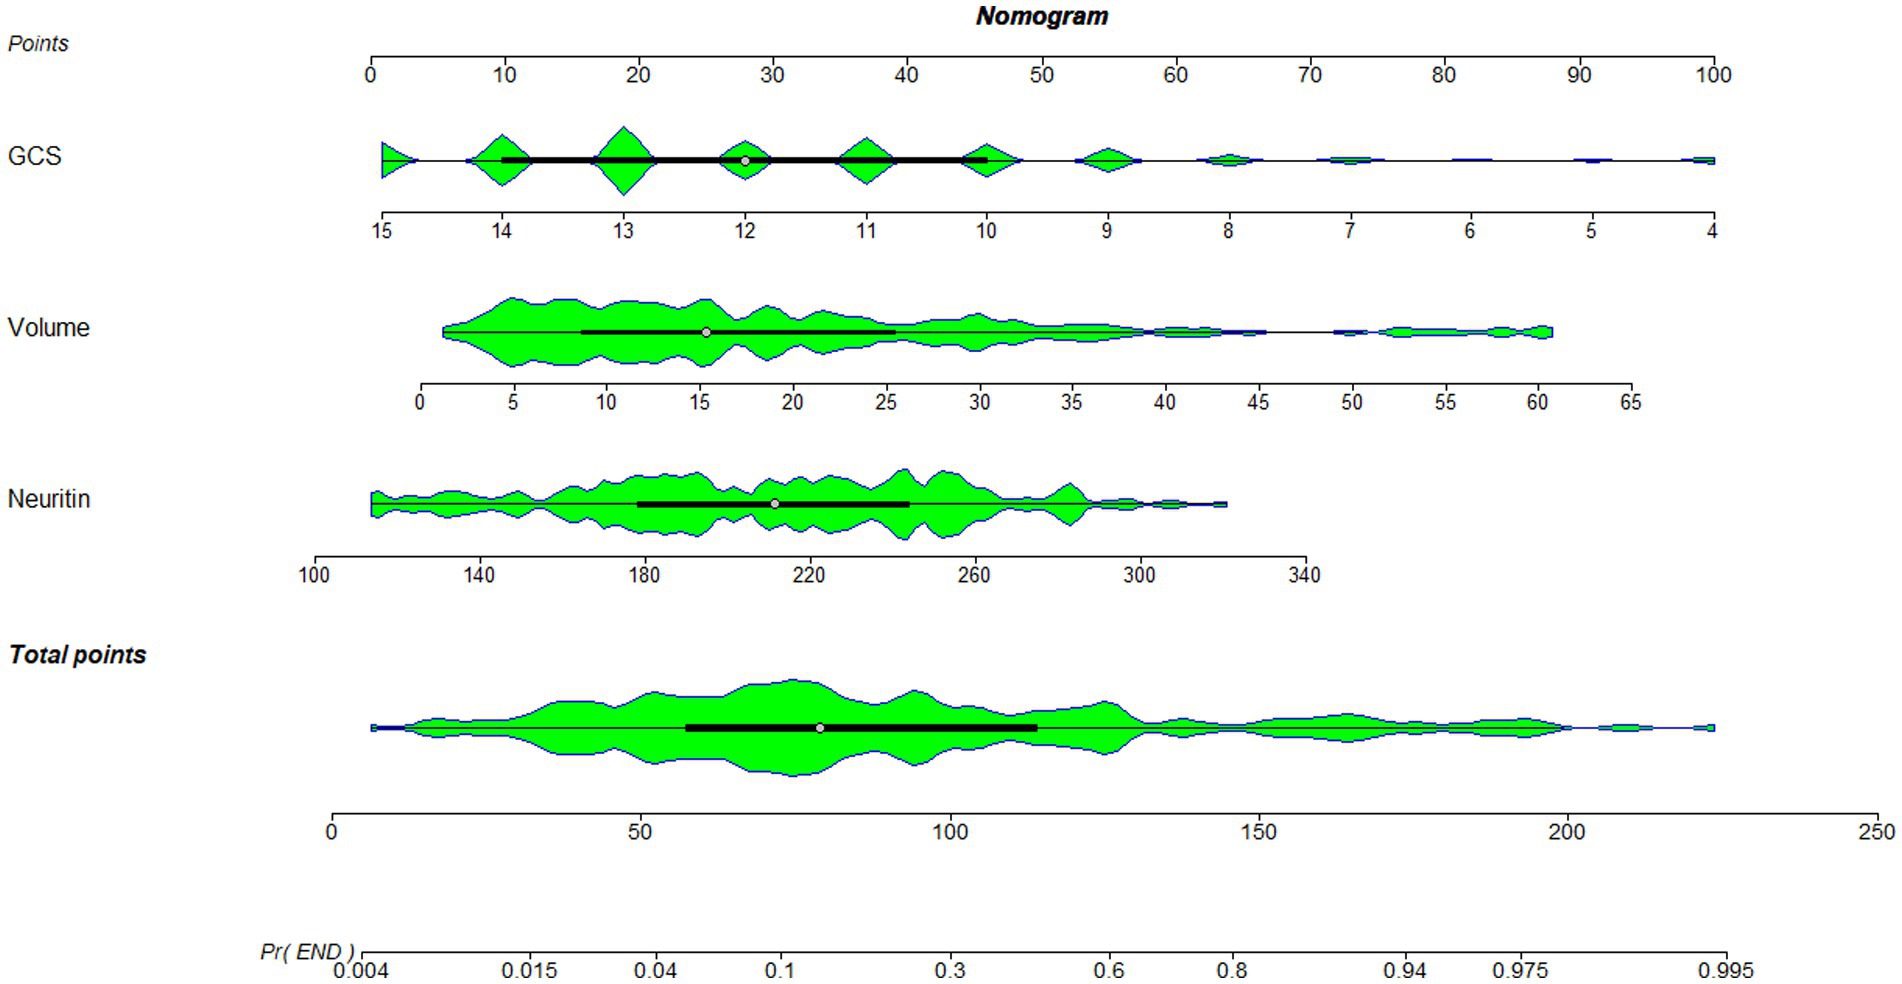
Figure 8. Nomogram combining serum neuritin levels at admission, Glasgow coma scale scores, and hematoma volume for predicting early neurological deterioration. A nomogram was established to assess how the combination model was used to predict early neurological deterioration after intracerebral hemorrhage. GCS denotes the Glasgow coma scale, which is volume and hematoma volume.
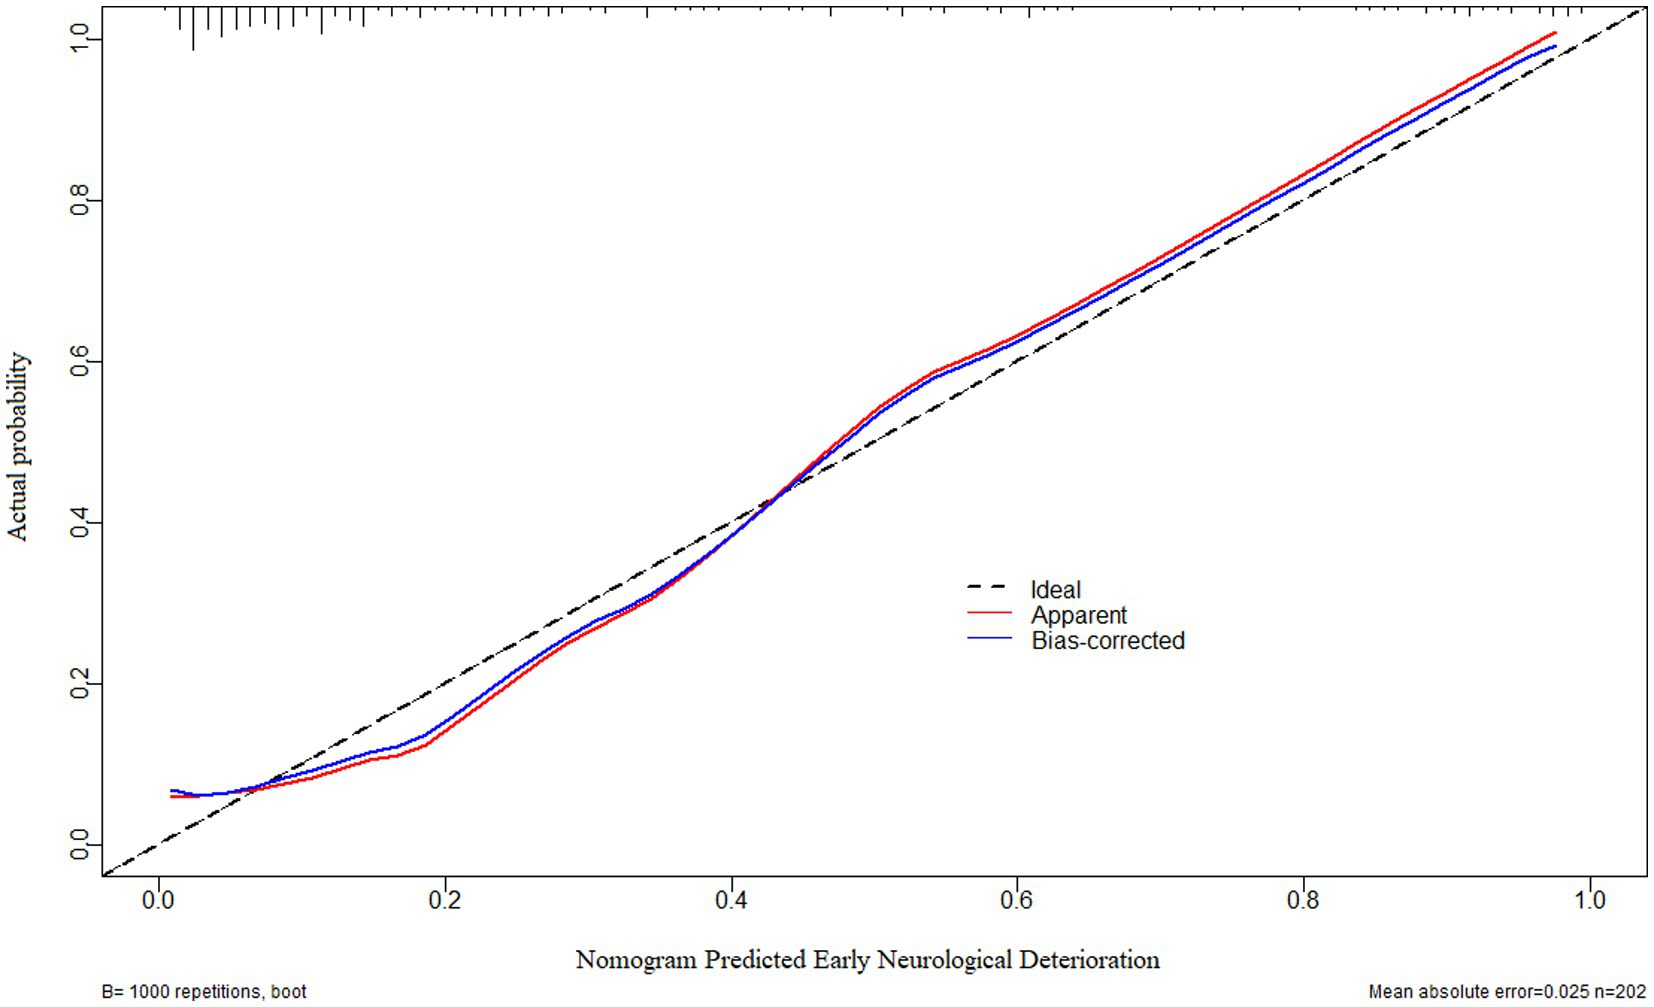
Figure 9. Calibration curve verifying the stability of early neurological deterioration prediction model containing serum neuritin levels at admission, Glasgow coma scale scores, and hematoma volume after intracerebral hemorrhage. Under the calibration curve, such a prediction model was relatively stable.
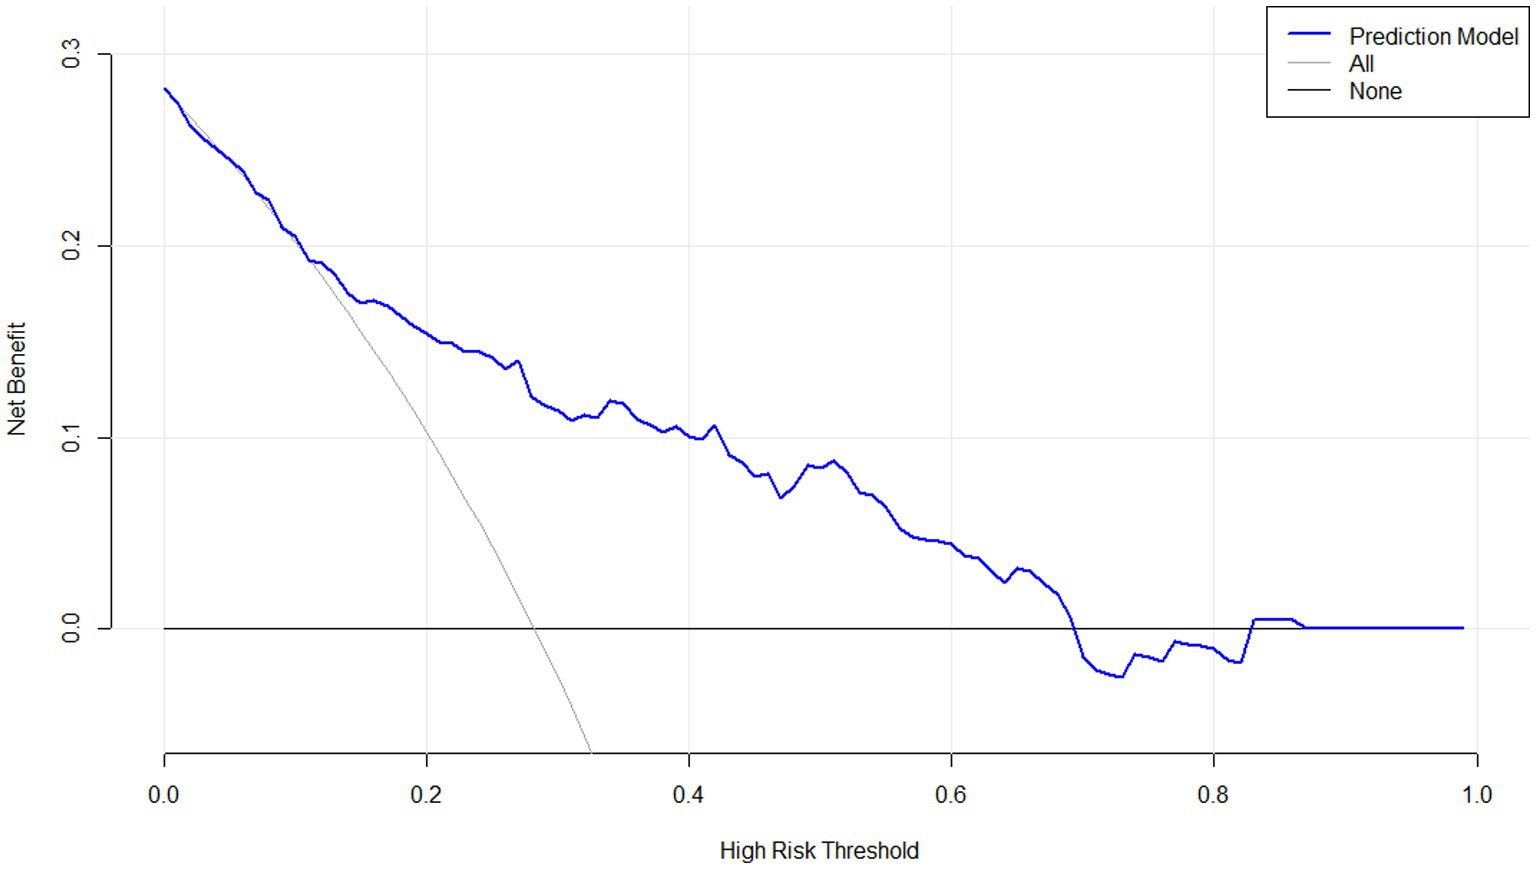
Figure 10. Decision curve confirming the clinical benefit of early neurological deterioration prediction model containing serum neuritin levels at admission among patients with intracerebral hemorrhage. Decision curve analysis demonstrated that such a prediction model combining serum neuritin levels at admission, Glasgow coma scale scores, and hematoma volume, relatively speaking, had a high clinical benefit.
The combined model demonstrated higher END predictive efficiency for END compared to its individual components (all p < 0.05; Figure 7). Furthermore, no significant differences were observed in the predictive ability of both serum neuritin levels and the combined model for anticipating END under the ROC curve between all 202 patients and the subset of 101 patients (both p > 0.05; Supplementary Figures S12, S13).
We categorized GCS as follows: scores of 3–8 were defined as 2, scores of 9–12 as 1, and scores of 13–15 as 0. Hematoma volume was categorized as ≥30 mL (defined as 1) < 30 mL (defined as 0). Serum neuritin levels were categorized as ≥242.5 pg./mL (defined as 1) and <242.5 pg./mL (defined as 0). The percentages of patients with END increased progressively, with total scores ranging from 0 to 4: 6.5% (5/77), 12.3% (8/65), 56.3% (18/32), 94.7% (18/19), and 88.9% (8/9), respectively.
4 Discussion
To the best of our knowledge, there have been no studies on changes in serum neuritin levels in ICH patients and their relationship to prognosis and END after ICH. In the present study, we demonstrated that (1) serum neuritin levels in patients increased at admission, peaked at day 3, and then gradually decreased and were significantly higher during the 10 days after ICH than in healthy controls; (2) admission serum neuritin levels were independently associated with END and adverse outcomes at 90 days after ICH; (3) admission serum neuritin levels exhibited a similar prognostic and END predictive power as compared to GCS scores and hematoma volume; (4) the prediction models with the integration of GCS, hematoma volume and serum neuritin performed satisfactorily by using many statistical methods and internal validation. Therefore, serum neuritin may be a potential biomarker for assessing disease severity and predicting adverse outcomes as well as END in ICH patients.
Neuritin is a novel neurotrophic factor with anti-inflammatory, anti-apoptotic, and neuroprotective effects (11). A growing body of data has confirmed the protective effects of neuritin in acute brain injury. In vitro and in vivo experiments, neuritin is coordinately expressed with integrin, myelin oligodendrocyte glycoprotein, and microtubule-associated protein 1A and collaboratively promotes neuronal regeneration and inhibits neuronal apoptosis (21–24). In the ICH mouse model, a large amount of neuritin was expressed in neurons, significantly reducing brain injury, brain edema, and neuronal apoptosis caused by ICH (13). Similarly, in the subarachnoid hemorrhage and traumatic brain injury experiment, neuritin can significantly reduce the destruction of the blood–brain barrier, brain edema, and cell apoptosis in rats, thus playing a neuroprotective role (16, 25). Another experimental study showed that neuritin-overexpressing transgenic mice demonstrate enhanced neuroregenerative capacity and that neuritin could improve outcomes following cerebral ischemia injury (26). Thus, neuritin could play a neuroprotective role in acute brain injury, and subsequently, neuritin may become a therapeutic target of acute brain injury.
Neuritin is expressed in many tissues, but it is mainly concentrated in the neuronal soma (11, 21). Neuritin showed a persistent activation in the frontal-cingulate cortex in a rat model of cerebral ischemia (27). After acute brain injury, the expression of neuritin in the brain tissues of rats with subarachnoid hemorrhage and mice with cerebral ischemia was significantly upregulated (15, 26). Hence, considering the neuroprotective effect of neuritin, we speculate that the increased expression of neuritin may be a compensatory response to acute brain injury.
One study confirmed that neuritin can be released in brain tissue after acute brain injury (13). Therefore, neuritin may leak into the peripheral blood through the damaged blood–brain barrier, resulting in increased neuritin levels in the peripheral blood. In this study, there were no significant differences in baseline features between all 202 patients and those 54 consenting for blood collections at multiple time points after ICH, indicating that those 54 patients may be representative of the whole patients from a statistical perspective. Our study further found that serum neuritin levels were significantly higher in ICH patients compared to healthy controls, with the highest value on day 3 post-ICH. It is concluded that the neuritin in the serum of ICH patients may be at least partially derived from the injured brain tissue.
To the best of our knowledge, it is unclear whether serum neuritin is strongly associated with poor long-term outcomes in ICH patients. Neuritin has anti-inflammatory, anti-apoptotic, and neuroprotective effects (11). Hence, we speculate that serum neuritin may be a predictor of 90-day post-ICH adverse outcomes. In this study, adverse outcomes were defined as mRS scores ≥3. Final results showed that serum neuritin levels, besides GCS scores and hematoma volume, were independently associated with poor prognosis. In addition, serum neuritin levels, GCS scores, and hematoma volume had similar prognostic abilities under the ROC curve. Our findings provide further evidence to support the hypothesis that serum neuritin may be a useful biomarker for assessing disease severity after ICH.
It is well known that GCS score and hematoma volume are commonly used clinically to evaluate the poor prognosis of ICH patients (28, 29). In this study, our results suggest that serum neuritin was also a prognostic determinant of ICH. In addition, serum neuritin levels were independently associated with END, which occurs after ICH, leading to a poorer prognosis in such patients. The results showed that serum neuritin levels, compared with GCS score and hematoma volume, had a certain value in predicting the prognosis of aSAH. These results may strongly support the hypothesis that serum neuritin may represent a promising prognostic biomarker for ICH. However, at present, the known studies of other researchers only included ICH animal model experiments, and there are no relevant studies on the relationship between peripheral blood neuritin and acute brain injury in humans. This is probably a preliminary study on the role of serum neuritin as a prognostic biomarker for ICH. Larger cohort studies are needed in the future to verify this conclusion.
In our study, an interesting finding is that the prediction models with the integration of GCS, serum neuritin, and hematoma volume performed well in the prediction of poor prognosis and END. The models’ stability and clinical validity have been verified using a calibration curve and decision curve. In the current study, the restricted cubic splines have been plotted, which confirmed the linear relations existed between serum neuritin levels and the risk of poor prognosis and END. Statistically, such a result is strongly supportive of the notion that serum neuritin could be considered a continuous variable that can be integrated into the prediction models. Moreover, by using multivariate analysis, serum neuritin levels were independently correlated with GCS scores and hematoma volumes, and the levels had independent associations with ordinal mRS scores at the 90-day mark after ICH. Moreover, the models were verified for their discrimination efficiency by extracting a portion of patients. For the sake of convenience in clinical application, two exclusive weighted scaling systems were configured for anticipation of END and poor prognosis post-ICH. Such results have solidified serum neuritin as a potential biomarker for reflecting severity and forecasting poor prognosis after ICH.
There are several advantages and limitations. The advantages are that (1) as far as we are aware, this may be the first series to explore the prognostic role of serum neuritin in ICH, and therefore serum neuritin was verified to be a potential prognostic biomarker of ICH; and (2) all severity correlations and prognosis associations were demonstrated using multiple factorial analyses herein, so the conclusions may be more rational and scientific. The limitations are that (1) because a medium sample size of 202 patients was included in this study, an internal validation of the model was done only via extracting half of the entire number; (2) all conclusions were based on a medium number of patients and therefore should be validated in a larger cohort study in the future; (3) it may be of clinical value that the follow-up period is extended to 6 months and even 1 year; and (4) baseline data were incomplete in the controls.
5 Conclusion
To the best of our knowledge, this is the first study to quantitatively measure serum neuritin levels in ICH patients. Our study found that (1) disease severity, as reflected by GCS score and hematoma volume, is strongly correlated with serum neuritin levels, and (2) serum neuritin levels independently predict poor prognosis and END after ICH. Therefore, we speculate that neuritin may be a potential biomarker for ICH prognosis.
Data availability statement
The raw data supporting the conclusions of this article will be made available by the authors, without undue reservation.
Ethics statement
The studies involving humans were approved by the Institutional Review Committee at the Quzhou People’s Hospital. The studies were conducted in accordance with the local legislation and institutional requirements. The participants provided their written informed consent to participate in this study.
Author contributions
YaX: Data curation, Formal analysis, Investigation, Methodology, Software, Validation, Visualization, Writing – original draft. HZ: Methodology, Project administration, Software, Validation, Writing – review & editing. YS: Data curation, Resources, Software, Validation, Writing – review & editing. ZC: Conceptualization, Investigation, Methodology, Visualization, Writing – review & editing. CW: Conceptualization, Data curation, Formal analysis, Investigation, Writing – review & editing. MY: Data curation, Investigation, Methodology, Visualization, Writing – review & editing. FJ: Conceptualization, Investigation, Project administration, Software, Writing – review & editing. YL: Data curation, Investigation, Validation, Visualization, Writing – review & editing. YoX: Conceptualization, Funding acquisition, Investigation, Methodology, Resources, Supervision, Validation, Visualization, Writing – original draft, Writing – review & editing.
Funding
The author(s) declare that no financial support was received for the research, authorship, and/or publication of this article.
Conflict of interest
The authors declare that the research was conducted in the absence of any commercial or financial relationships that could be construed as a potential conflict of interest.
Publisher’s note
All claims expressed in this article are solely those of the authors and do not necessarily represent those of their affiliated organizations, or those of the publisher, the editors and the reviewers. Any product that may be evaluated in this article, or claim that may be made by its manufacturer, is not guaranteed or endorsed by the publisher.
Supplementary material
The Supplementary material for this article can be found online at: https://www.frontiersin.org/articles/10.3389/fneur.2024.1490023/full#supplementary-material
Abbreviations
GCS, Glasgow Coma Scale; sICH, spontaneous intracerebral hemorrhage; END, early neurological deterioration; mRS, modified Rankin Scale; ROC, receiver operating characteristic; AUC, area under curve; 95% CI, 95% confidence interval; OR, odds ratio.
Footnotes
References
1. Al-Shahi Salman, R, Frantzias, J, Lee, RJ, Lyden, PD, Battey, TWK, Ayres, AM, et al. Absolute risk and predictors of the growth of acute spontaneous intracerebral haemorrhage: a systematic review and meta-analysis of individual patient data. Lancet Neurol. (2018) 17:885–94. doi: 10.1016/S1474-4422(18)30253-9
2. Guo, Q, Su, H, He, JB, Li, HQ, and Sha, JJ. MiR-590-5p alleviates intracerebral hemorrhage-induced brain injury through targeting Peli1 gene expression. Biochem Biophys Res Commun. (2018) 504:61–7. doi: 10.1016/j.bbrc.2018.08.121
3. Beez, T, Steiger, HJ, and Etminan, N. Pharmacological targeting of secondary brain damage following ischemic or hemorrhagic stroke, traumatic brain injury, and bacterial meningitis – a systematic review and meta-analysis. BMC Neurol. (2017) 17:209. doi: 10.1186/s12883-017-0994-z
4. Murthy, SB, Moradiya, Y, Dawson, J, Lees, KR, Hanley, DF, Ziai, WC, et al. Perihematomal edema and functional outcomes in intracerebral hemorrhage: influence of hematoma volume and location. Stroke. (2015) 46:3088–92. doi: 10.1161/STROKEAHA.115.010054
5. Li, B, Wu, D, Song, W, Jiang, W, and Li, W. A prospective cohort study regarding usability of serum RIPK3 as a biomarker in relation to early hematoma growth and neurological outcomes after acute intracerebral hemorrhage. Clin Chim Acta. (2024) 562:119850. doi: 10.1016/j.cca.2024.119850
6. Hviid, CVB, Gyldenholm, T, Lauridsen, SV, Hjort, N, Hvas, AM, and Parkner, T. Plasma neurofilament light chain is associated with mortality after spontaneous intracerebral hemorrhage. Clin Chem Lab Med. (2020) 58:261–7. doi: 10.1515/cclm-2019-0532
7. Luger, S, Witsch, J, Dietz, A, Hamann, GF, Minnerup, J, Schneider, H, et al. Glial fibrillary acidic protein serum levels distinguish between intracerebral hemorrhage and cerebral ischemia in the early phase of stroke. Clin Chem. (2017) 63:377–85. doi: 10.1373/clinchem.2016.263335
8. Wu, X, Liu, M, Yan, T, Wang, Z, Yu, W, Du, Q, et al. Plasma PRPC levels correlate with severity and prognosis of intracerebral hemorrhage. Front Neurol. (2022) 13:913926. doi: 10.3389/fneur.2022.913926
9. Amer, HA, El-Jaafary, SIM, Sadek, HMAE, Fouad, AM, and Mohammed, SS. Clinical and paraclinical predictors of early neurological deterioration and poor outcome in spontaneous intracerebral hemorrhage. Egypt J Neurol Psychiatr Neurosurg. (2023) 59:74. doi: 10.1186/s41983-023-00675-x
10. Zhu, W, Zhou, J, Ma, B, and Fan, C. Predictors of early neurological deterioration in patients with intracerebral hemorrhage: a systematic review and meta-analysis. J Neurol. (2024) 271:2980–91. doi: 10.1007/s00415-024-12230-6
11. Yao, JJ, Zhao, QR, Lu, JM, and Mei, YA. Functions and the related signaling pathways of the neurotrophic factor neuritin. Acta Pharmacol Sin. (2018) 39:1414–20. doi: 10.1038/aps.2017.197
12. Zhou, S, and Zhou, J. Neuritin, a neurotrophic factor in nervous system physiology. Curr Med Chem. (2014) 21:1212–9. doi: 10.2174/0929867321666131218093327
13. Lu, J, Li, Z, Zhao, Q, Liu, D, and Mei, YA. Neuritin improves the neurological functional recovery after experimental intracerebral hemorrhage in mice. Neurobiol Dis. (2021) 156:105407. doi: 10.1016/j.nbd.2021.105407
14. Xu, H, Dong, J, Li, Y, Zhang, L, Yin, J, Zhu, C, et al. Neuritin has a neuroprotective role in the rat model of acute ischemia stroke by inhibiting neuronal apoptosis and NLRP3 inflammasome. J Stroke Cerebrovasc Dis. (2023) 32:107391. doi: 10.1016/j.jstrokecerebrovasdis.2023.107391
15. Zhang, H, Ren, K, Hu, Y, Liu, B, He, Y, Xu, H, et al. Neuritin promotes autophagic flux by inhibiting the cGAS-STING pathway to alleviate brain injury after subarachnoid haemorrhage. Brain Res. (2024) 1836:148909. doi: 10.1016/j.brainres.2024.148909
16. Zhang, H, He, X, Wang, Y, Sun, X, Zhu, L, Lei, C, et al. Neuritin attenuates early brain injury in rats after experimental subarachnoid hemorrhage. Int J Neurosci. (2017) 127:1087–95. doi: 10.1080/00207454.2017.1337013
17. Choi, Y, Lee, K, Ryu, J, Kim, HG, Jeong, AY, Woo, RS, et al. Neuritin attenuates cognitive function impairments in tg2576 mouse model of Alzheimer's disease. PLoS One. (2014) 9:e104121. doi: 10.1371/journal.pone.0104121
18. Xi, C, Zhang, Y, Yan, M, Lv, Q, Lu, H, Zhou, J, et al. Exogenous neuritin treatment improves survivability and functions of Schwann cells with improved outgrowth of neurons in rat diabetic neuropathy. J Cell Mol Med. (2020) 24:10166–76. doi: 10.1111/jcmm.15627
19. Sagar, R, Kumar, A, Verma, V, Yadav, AK, Raj, R, Rawat, D, et al. Incremental accuracy of blood biomarkers for predicting clinical outcomes after intracerebral hemorrhage. J Stroke Cerebrovasc Dis. (2021) 30:105537. doi: 10.1016/j.jstrokecerebrovasdis.2020.105537
20. Wang, Z, Xu, J, Zou, S, Chen, Z, Dong, S, and Wang, K. Prognostic significance of plasma S1P in acute intracerebral hemorrhage: a prospective cohort study. Clin Chim Acta. (2023) 551:117585. doi: 10.1016/j.cca.2023.117585
22. Putz, U, Harwell, C, and Nedivi, E. Soluble CPG15 expressed during early development rescues cortical progenitors from apoptosis. Nat Neurosci. (2005) 8:322–31. doi: 10.1038/nn1407
23. Di Giovanni, S, Faden, AI, Yakovlev, A, Duke-Cohan, JS, Finn, T, Thouin, M, et al. Neuronal plasticity after spinal cord injury: identification of a gene cluster driving neurite outgrowth. FASEB J. (2005) 19:153–4. doi: 10.1096/fj.04-2694fje
24. Xi, S, Liu, W, Zhang, H, Gao, R, and Huang, J. Effect of neuritin protein on axonal regeneration after acute spinal cord injury in rats. Zhongguo Xiu Fu Chong Jian Wai Ke Za Zhi. (2009) 23:1219–23.
25. Liu, Q, Zhang, H, Xu, J, and Zhao, D. Neuritin provides neuroprotection against experimental traumatic brain injury in rats. Int J Neurosci. (2018) 128:811–20. doi: 10.1080/00207454.2018.1424155
26. Wan, K, Mao, F, Li, Q, Wang, L, Wei, Z, Wang, P, et al. Neuritin-overexpressing transgenic mice demonstrate enhanced neuroregeneration capacity and improved spatial learning and memory recovery after ischemia-reperfusion injury. Aging. (2020) 13:2681–99. doi: 10.18632/aging.202318
27. Rickhag, M, Teilum, M, and Wieloch, T. Rapid and long-term induction of effector immediate early genes (BDNF, Neuritin, and arc) in the peri-infarct cortex and dentate gyrus after ischemic injury in rat brain. Brain Res. (2007) 1151:203–10. doi: 10.1016/j.brainres.2007.03.005
28. Wang, Z, Wu, X, Yan, T, Liu, M, Yu, W, Du, Q, et al. Elevated plasma complement C1q levels contribute to a poor prognosis after acute primary intracerebral hemorrhage: a prospective cohort study. Front Immunol. (2022) 13:920754. doi: 10.3389/fimmu.2022.920754
Keywords: intracerebral hemorrhage, neuritin, early neurological deterioration, prognosis, severity, outcome
Citation: Xu Y, Zhu H, Su Y, Chen Z, Wang C, Yang M, Jiang F, Li Y and Xu Y (2025) Serum neuritin as a predictive biomarker of early neurological deterioration and poor prognosis after spontaneous intracerebral hemorrhage: a prospective cohort study. Front. Neurol. 15:1490023. doi: 10.3389/fneur.2024.1490023
Edited by:
Changiz Taghibiglou, University of Saskatchewan, CanadaReviewed by:
Amit Persad, University of Saskatchewan, CanadaMichael Pushie, University of Saskatchewan, Canada
Copyright © 2025 Xu, Zhu, Su, Chen, Wang, Yang, Jiang, Li and Xu. This is an open-access article distributed under the terms of the Creative Commons Attribution License (CC BY). The use, distribution or reproduction in other forums is permitted, provided the original author(s) and the copyright owner(s) are credited and that the original publication in this journal is cited, in accordance with accepted academic practice. No use, distribution or reproduction is permitted which does not comply with these terms.
*Correspondence: Yongming Xu, MTUwNTcwNzA2MTVAMTYzLmNvbQ==