 Bintao Xu1†
 Li Tao1†Honge Gui1
 Pan Xiao1Xiaole Zhao1Hongyu Wang1Huiyue Chen1Hansheng Wang1
 Fajin Lv1Tianyou Luo1Oumei Cheng2Jing Luo2Yun Man2
 Zheng Xiao2Weidong Fang1*
- 1Department of Radiology, The First Affiliated Hospital of Chongqing Medical University, Chongqing, China
- 2Department of Neurology, The First Affiliated Hospital of Chongqing Medical University, Chongqing, China
Background: Due to the absence of biomarkers, the misdiagnosis of essential tremor (ET) with other tremor diseases and enhanced physiologic tremor is very common in practice. Combined radiomics based on diffusion tensor imaging (DTI) and three-dimensional T1-weighted imaging (3D-T1) with machine learning (ML) give a most promising way to identify essential tremor (ET) at the individual level and further reveal the potential imaging biomarkers.
Methods: Radiomics features were extracted from 3D-T1 and DTI in 103 ET patients and 103 age-and sex-matched healthy controls (HCs). After data dimensionality reduction and feature selection, five classifiers, including the support vector machine (SVM), random forest (RF), logistic regression (LR), extreme gradient boosting (XGBoost) and multi-layer perceptron (MLP), were adopted to discriminate ET from HCs. The mean values of the area under the curve (mAUC) and accuracy were used to assess the model’s performance. Furthermore, a correlation analysis was conducted between the most discriminative features and clinical tremor characteristics.
Results: All classifiers achieved good classification performance (with mAUC at 0.987, 0.984, 0.984, 0.988 and 0.981 in the test set, respectively). The most powerful discriminative features mainly located in the cerebella-thalamo-cortical (CTC) and visual pathway. Furthermore, correlation analysis revealed that some radiomics features were significantly related to the clinical tremor characteristics in ET patients.
Conclusion: These results demonstrated that combining radiomics with ML algorithms could not only achieve high classification accuracy for identifying ET but also help us to reveal the potential brain microstructure pathogenesis in ET patients.
Introduction
Essential tremor (ET) brings about a considerable global health burden, affecting approximately 1% of the world’s population (1). Recently, the International Parkinson and Movement Disorder Society redefined ET as a bilateral isolated upper limb action tremor syndrome lasting for a minimum of 3 years, and ET with other soft neurological signs such as impaired tandem gait, questionable dystonic posturing and memory impairment were referred to as ET-plus (2). The design of a “pure” ET subtype with a more precise and narrow definition seemed to make the diagnosis of ET easier in clinical settings. However, due to the absence of pathological, genetic and neuroimaging biomarkers, the misdiagnosis of ET with Parkinson’s disease (PD), dystonia and enhanced physiologic tremor is very common in practice (3, 4). Therefore, establishing biomarkers of ET, especially imaging markers, is an extremely urgent task at present.
Diffusion tensor imaging (DTI) and high-resolution three-dimensional T1-weighted imaging (3D-T1) as non-invasive and in vivo magnetic resonance imaging (MRI) sequences have been widely used to measure brain microstructural changes and further construct the potential imaging markers in a lot of neurodegenerative diseases and movement disorders, such as Alzheimer’s disease, PD, dystonia, and multiple system atrophy (5–7). Recently, using 3D-T1 and DTI analysis, very few studies gained some variable and inconsistent findings, and some of these studies supported that the dentato-rubro-thalamic tract and its structure connectivity brain areas were associated with ET patients (8, 9). However, most of these studies were traditional mass univariate analyses, and they could not be used to predict ET patients at an individual level. Furthermore, these 3D-T1 and DTI analysis methods limited to traditional metrics such as the average value of gray matter (GM) volumes or thickness, fractional anisotropy (FA), radial diffusivity (RD), axial diffusivity (AD) and mean diffusivity (MD), and actually, these images not only provided information on different aspects of these microstructures but also contained vast numbers of quantitative information, such as radiomics features. Radiomics analysis can abstract vast quantitative features, including first-order statistical information from DTI and 3D-T1, and then these features are inputted for machine learning (ML) algorithms (10). ML builds optimal models by learning and training from massive input data and then applies the model to new data to predict and analyze diseases based on a single-subject level (11). To our knowledge, up to now, no studies have combined radiomic analysis based on DTI and 3D-T1 to identify ET patients from HCs.
Moreover, it is crucial to understand the potential clinical implications of these imaging markers. Radiomic features extracted from imaging data can potentially correlate with clinical variables, which may offer deeper insights into the pathology and progression of ET. Establishing these correlations can not only aid in the accurate diagnosis of ET but also help in monitoring disease progression and treatment response.
Hence, we aimed to explore whether combined radiomic analysis of DTI and 3D-T1 with multiple ML algorithms could be used to effectively distinguish ET patients from HCs and to evaluate the radiomics correlates with clinical variables of interest for ET pathology. We also expected that our proposed method would not only reveal the brain microstructural changes but also further help to understand brain microstructural pathogenesis in ET.
Materials and methods
Participants
This study was approved by the Ethics Committee of the First Affiliated Hospital of Chongqing Medical University (Chongqing, China) in accordance with the Helsinki Declaration ethical principles. All patients fulfilled the following criteria: (1) the ET diagnosis met the 2018 Movement Disorders Consensus Criteria (2), and all patients had annual follow-ups through the outpatient department or telephone; (2) the patients had an onset age between 18 to 55 years, and patients with earlier or later onset were not included; (3) the patients were without any apparent cognitive impairment (Mini-Mental State Examination (MMSE) scores >24); (4) the patients were without PD, dystonia, psychogenic tremor, thyroid disease, stroke, epilepsy, head injury or any other neurological dysfunction; (5) the patients were without other neurological soft signs, such as dystonia, ataxia, parkinsonism, rest tremor or non-motor symptoms, that is ET-plus patients did not include in this study. In addition, none of the HCs reported having first-or second-degree relatives with ET, and all subjects met DTI image quality control standards. Ultimately, 206 participants were enrolled, including 103 ET patients and 103 age-, sex-, and education-matched HCs, all right-handed.
Tremor severity was assessed with the Fahn-Tolosa-Marin Tremor Rating Scale (TRS). Meanwhile, to consider a ceiling effect for severe tremor while tremor amplitude >4 cm for the TRS scale, the Essential Tremor Rating Assessment Scale (TETRAS) was also adopted to assess tremor severity. The Hamilton Anxiety Rating Scale (HARS-14) and the 17-item Hamilton Depression Rating Scale (HDRS-17) were adopted to assess the anxiety and depression severity of all participants. The MMSE was used to briefly assess cognitive function and screen for dementia.
MRI acquisition and data preprocessing
3D-T1, DTI and T2-FLAIR images were acquired using a GE Signa Hdxt 3-T scanner (General Electric Medical Systems, Milwaukee, WI, United States); for detailed parameters, see Supplementary material S1. Data preprocessing was conducted using the VBM implemented in SPM12 software1 and PANDA toolbox version 2.2,2 and detailed data preprocessing steps are provided in Supplementary material S2.
Radiomics feature extraction
Previous studies have demonstrated that the brain microstructural changes were not only limited to white matter (WM) fiber tracts but also extended to gray matter (GM) areas. To capture these changes, the automated anatomical labeling 3 (AAL3) (12) and Johns Hopkins University (JHU) (13) tractography atlases were utilized. The FA, AD, RD, and MD maps of DTI were partitioned into 214 volumes of interest (VOIs), which included 164 regions defined by AAL3 and 50 regions defined by JHU-ICBM. Similarly, the GM maps of 3D-T1 were partitioned into 164 VOIs by AAL3, while the WM maps of 3D-T1 were partitioned into 50 VOIs by JHU-ICBM. The open-source Python package, pyradiomics, was employed to extract 15 first-order features, including the mean, median, maximum, range, variance, skewness, kurtosis, 10th percentile, 90th percentile, inter-quartile range, mean absolute deviation, robust mean absolute deviation, root mean squared, energy and total energy. These features were used to describe the voxel intensity distribution within the image mask (detailed information about extracted features is reported in Supplementary Table S1) (14). After the above process, 12,300 (164 × 15 × 5) GM features and 3,750 (50 × 15 × 5) WM features were obtained for every subject. GM features were sourced from GM regions defined by AAL3 in the FA, AD, RD, and MD maps of DTI, as well as the GM maps of 3D-T1. WM features were sourced from WM regions defined by JHU-ICBM in the FA, AD, RD, and MD maps of DTI, as well as the WM maps of 3D-T1.
Feature selection
The machine-learning analysis was performed by using a scikit-learn open-source package3 in Python. Due to the curse-of-dimensionality or small-n-large-p problem, a total of 16,050 features greatly exceeded the sample size, while most features were redundant and irrelevant (15). Therefore, dimensionality reduction and feature selection were necessary steps to obtain the most important features and improve the accuracy of the model. Before the feature selection, the dataset was partitioned into training and testing sets in the ratio of 7:3, and a Z-score standardization was performed, respectively, to keep the data in sets mutually independent. Then, dimensionality reduction and feature selection were conducted in the training set in three steps. First, we conducted a two-sample t-test to assess the statistical significance of the relationship between each feature and the target variable. Features with a p-value below 0.05 were deemed statistically significant. Next, we employed the mutual information method to filter out features that showed a low correlation with the target variable, setting a threshold of 0.05. Lastly, we utilized the absolute shrinkage and selection operator (LASSO) algorithm in the feature selection process. LASSO is a regression method that addresses the issue of multicollinearity by shrinking the coefficients of less critical features toward zero, thereby effectively eliminating redundant features from the model. The key to LASSO’s effectiveness lies in its penalization parameter λ, a hyperparameter that controls the degree of regularization of the model. It was tuned under the criteria of minimal mean squared error (MSE) to construct the optimal subset of features via a 10-fold cross-validated grid-search approach, and the weight coefficients of each feature were calculated. The loss function of LASSO is as follows:
where are the observed values, are the predicted values, is the penalization parameter, are the coefficients of the features, is the number of observations, and is the number of features.
Model construction and evaluation
In order to enhance the performance and generalization ability of our models, we employed nested loops to perform hyperparameter tuning and make full use of subject data. Initially, the entire dataset was split into a training set and a test set in a 7:3 ratio using stratified splitting, ensuring that the proportions of the two classes were balanced in both sets. The independent test set served as the outer loop for evaluating model performance, while the training set after dimensionality reduction and feature selection was used as the inner loop for 10-fold cross-validation and grid search to determine the optimal classifier parameters. In each fold of the inner loop, various hyperparameter combinations were attempted, and model scores were recorded, with the combination yielding the highest score selected as the optimal hyperparameters, which were then fitted to the entire training set and evaluated on the test set. We employed several common machine learning classifiers, including the support vector machine with radial basis function kernel (RBF-SVM) (16), random forest (RF) (17), logistic regression with the linear kernel (Linear-LR) (18), extreme gradient boosting (XGBoost) (19) and multi-layer perceptron (MLP) (20), to build models based on the preserved features from feature selection. Specifically, we searched for the optimal hyperparameters for RBF-SVM (penalty parameter C), Linear-LR (parameter C), RF (number of decision trees), XGBoost (number of decision trees, maximum depth, learning rate), and MLP (hidden layer size, activation function, optimizer) classifiers. To ensure unbiased classification estimates, the entire framework was repeated 100 times. The whole procedure for the nested loop is illustrated in Supplementary Figure S1.
The model’s performance was evaluated using an independent test set in the outer loop, ensuring a more representative evaluation of the model’s ability to generalize. To gage model performance, we computed metrics, including mean accuracy (mACC), mean balanced accuracy (mBACC), mean sensitivity (mSN), and mean specificity (mSP). We also constructed the mean receiver operating characteristic (mROC) curve and calculated the mean area under the curve (mAUC) to gauge the models’ classification performance and diagnostic accuracy. The model that achieved the highest mAUC value was considered the best-performing model. To compare the different classification algorithms, we utilized the Friedman test followed by the Wilcoxon signed-rank test for pairwise comparisons when significant differences were identified. To correct for multiple comparisons, we applied the Bonferroni method, considering an adjusted alpha (α) level of <0.05 as statistically significant. The formulae are as follows:
where TP represents the number of positive samples correctly classified, TN represents the number of negative samples correctly classified, FP represents the number of negative samples incorrectly classified, and FN represents the number of positive samples incorrectly classified.
To assess the statistical significance of the classification model, we conducted permutation testing by randomly shuffling the labels of both patients and HCs. This process was iterated 1,000 times, and the entire framework was executed on each occasion. We then compared the obtained classification performance metrics with those generated using randomly reassigned labels and calculated the corresponding p-value (21). A p-value below the significance threshold of 0.05 indicates a robust classification performance, providing compelling evidence that the classifier effectively distinguishes between the two groups.
Identification of discriminative features
Considering that the dataset was randomly divided into a 7:3 ratio and the entire process was repeated 100 times, each iteration resulted in slightly different compositions of training and testing sets. This inherent variability meant that different features might be selected during each iteration of the feature selection process. To ensure that the final subset of features is representative and robust, features that were selected in more than 60 iterations were deemed relevant for distinguishing between individuals with ET and HCs. This method helps mitigate the risk of overfitting to any particular random split of the data, enhancing the generalizability of our model. Moreover, features that appear consistently across numerous iterations are likely to capture fundamental patterns and relationships within the data, making them more reliable for distinguishing between ET and HCs. We then computed the average feature weights. The absolute value of the average feature weight indicates the feature’s contribution to the model’s classification performance. Features with larger average feature weights are considered more significant in terms of their impact on the model’s discriminative capability. The whole radiomics analysis workflow is illustrated in Supplementary Figure S2.
Statistical analysis
We analyzed the demographic data and clinical characteristics of both groups using SPSS statistical software. Initially, we assessed the normality of continuous variables with the Kolmogorov–Smirnov test (K-S test). For normally distributed variables, we conducted a two-sample t-test, while for non-normally distributed variables, we employed the Mann–Whitney U test. To examine differences in qualitative data, such as gender, we used the chi-square test. A two-tailed p-value <0.05 was regarded as significant. Furthermore, we performed partial Pearson correlation analysis to explore potential relationships between the selected features and clinical tremor status, as indicated by scale scores. Meanwhile, the age, gender, education years, and scores of the MMSE, HARS-14, and HDRS-17 as covariates, applying Bonferroni multiple comparison correction (p < 0.05/10*(10–1)/2 = 0.001).
Results
Demographic and clinical characteristics
Demographic and clinical data for all participants are summarized in Table 1. There were no statistically significant differences between the ET group and HCS group in age, gender, education level, handedness, smoking status, HDRS-17, HDRS-14 scores, etc. (p > 0.05). However, there was a significant difference in MMSE scores between the two groups, with the ET group scoring lower than the HCS group (p = 0.0006).
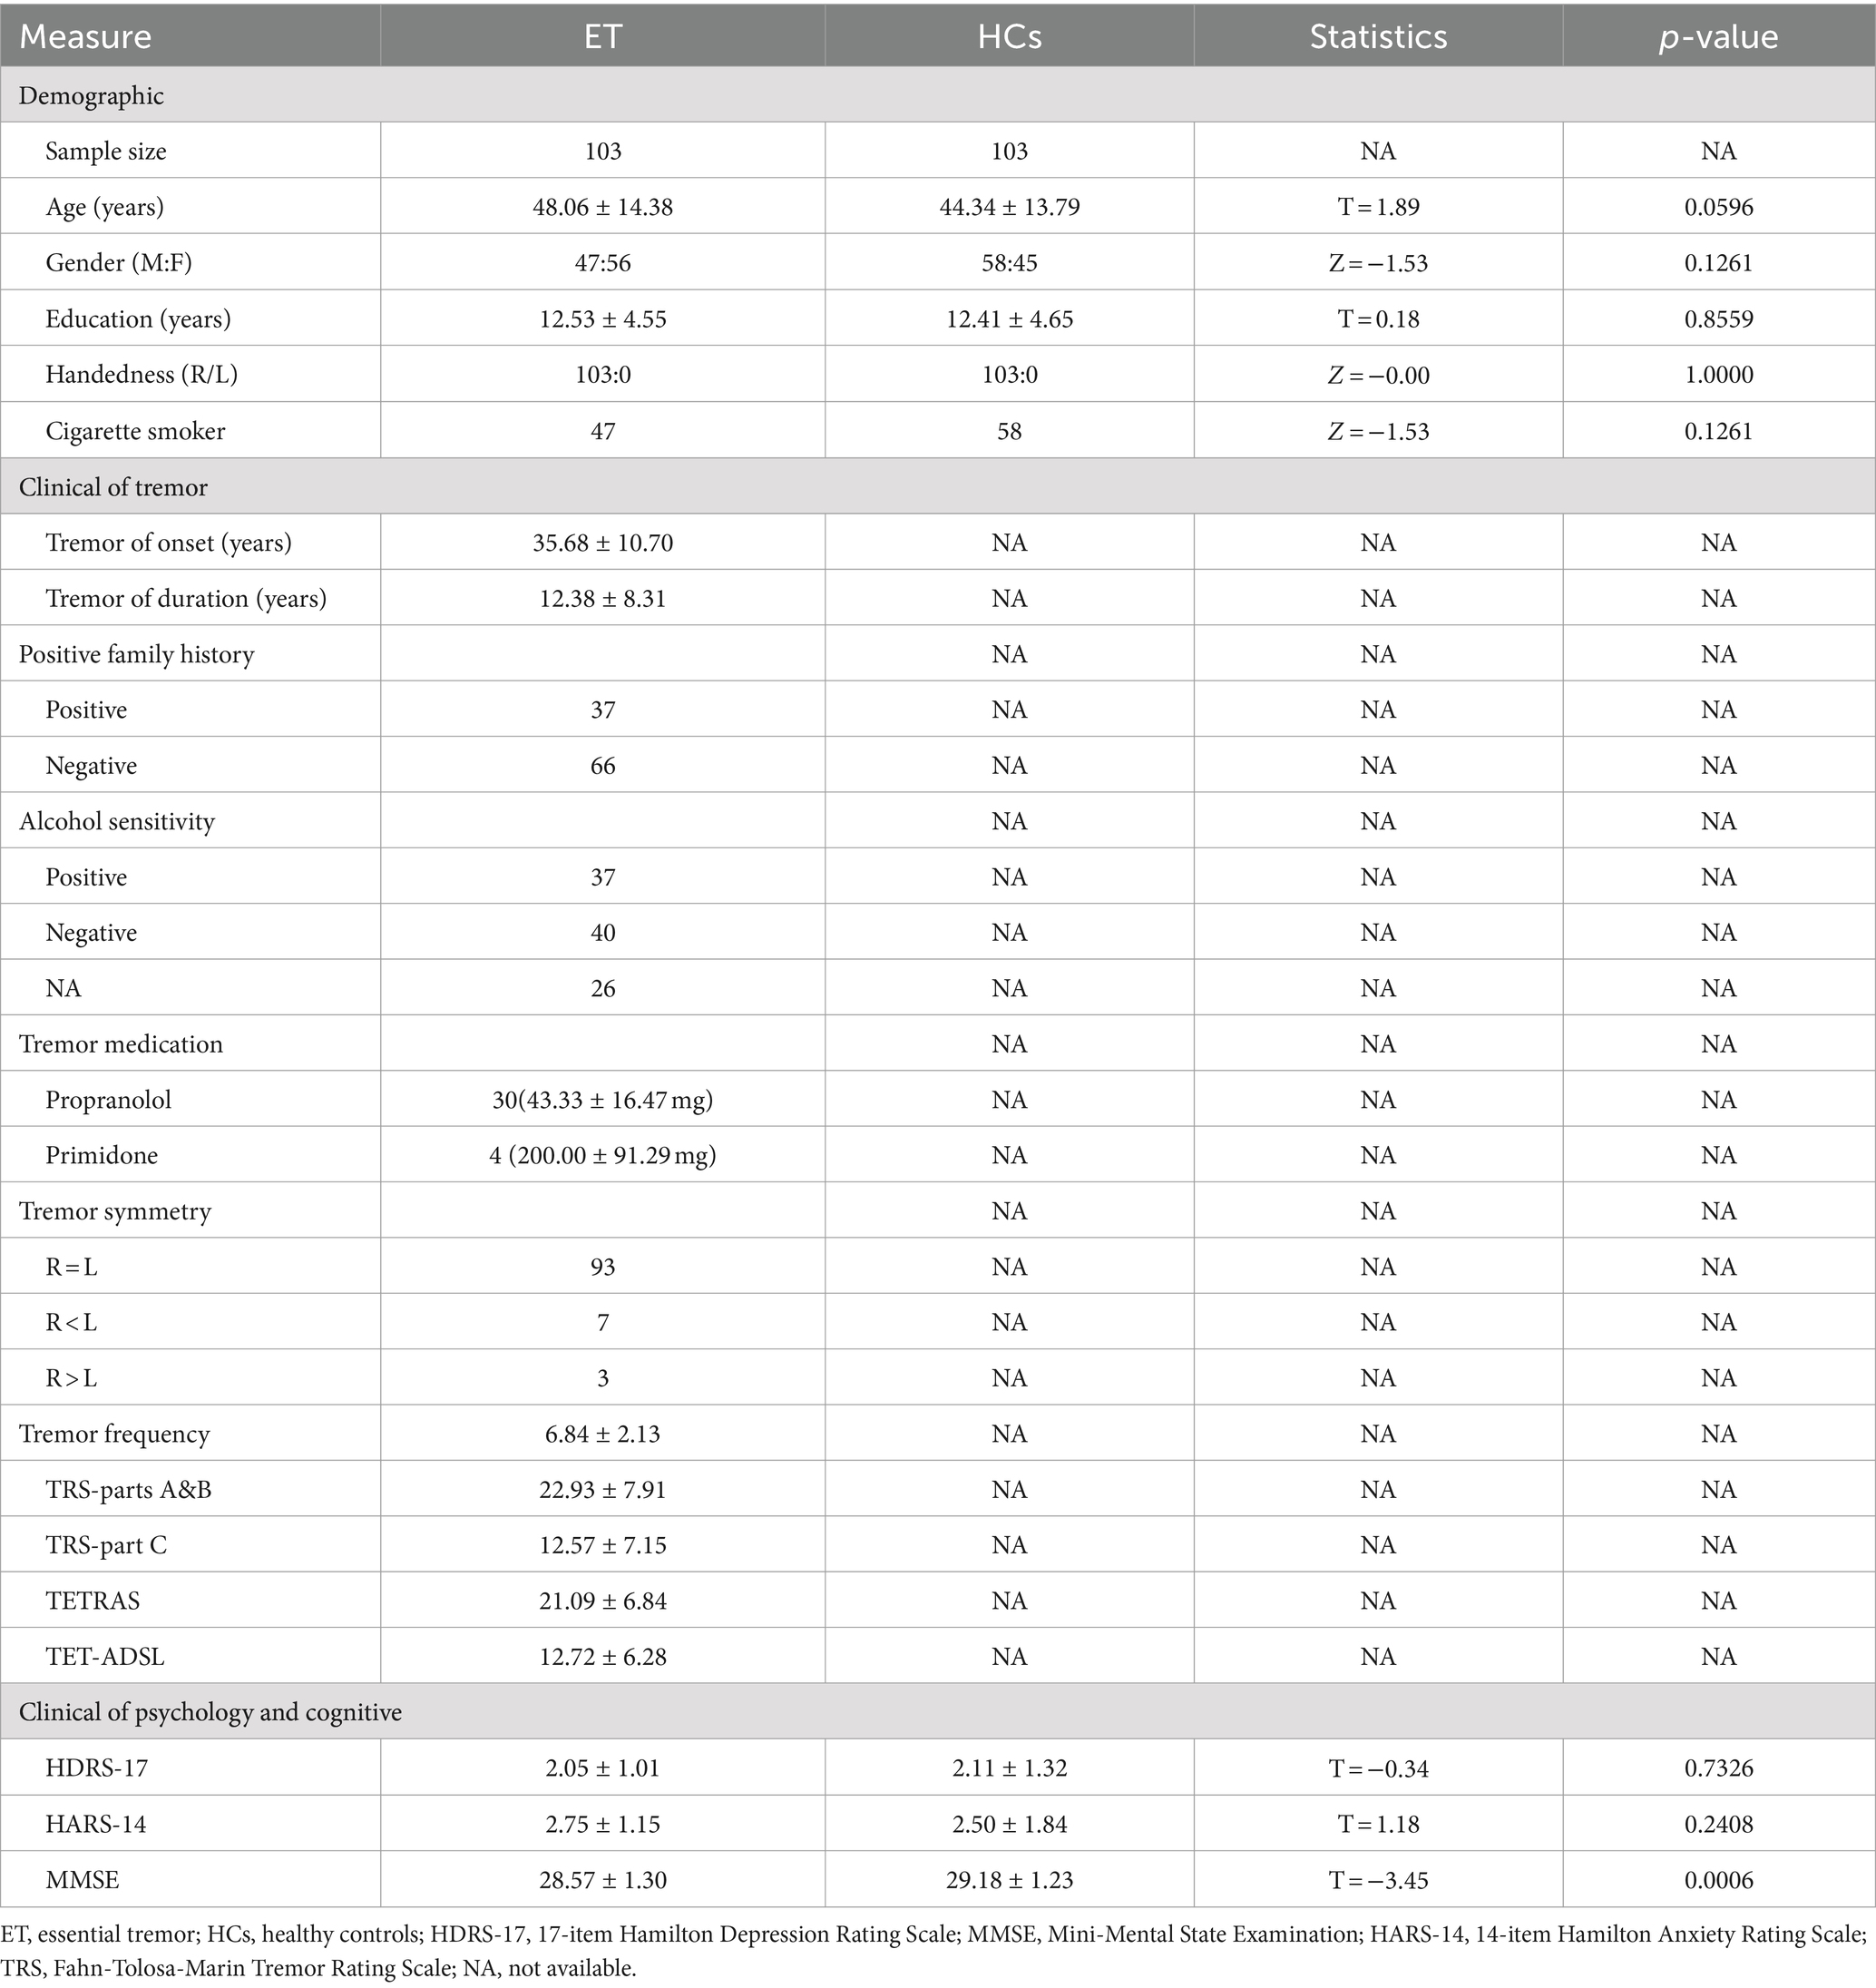
Table 1. Demographic and clinical features of ET and HCs.
Discriminative features
Following three steps of feature reduction, an average of approximately 46 features were retained (range: 16 to 82) per round, with an average Lasso penalization parameter λ of 0.0052. Due to the complete random sampling of the training and test sets, the training set samples for feature selection were different, and the retained features varied in each round. With 100 repetitions of the entire framework, a total of 100 feature subsets containing different selected features were obtained. For the final distinguishing subset of features, we considered only those features that were selected in more than 60 iterations. Ultimately, 10 features met this criterion (Table 2; Figure 1): mean MD in left inferior cerebellar peduncle (ICP), mean FA in right inferior cerebellar peduncle (ICP), energy FA in left inferior cerebellar peduncle (ICP), mean FA in left inferior cerebellar peduncle (ICP), skewness GM in left pulvinar inferior(tPuL), kurtosis MD in right ventral posterolateral(tVPL), energy MD in left ventral posterolateral(tVPL), kurtosis GM in left calcarine fissure and surrounding cortex(CAL), energy GM in left cerebellar lobule IV ~ V(CER4_5) and mean MD in left superior cerebellar peduncle(SCP). The most frequent and highest-weighted feature was Mean in the FA map located in the left inferior cerebellar peduncle, occurring 100 times out of 100 rounds with an average weight of 0.416.
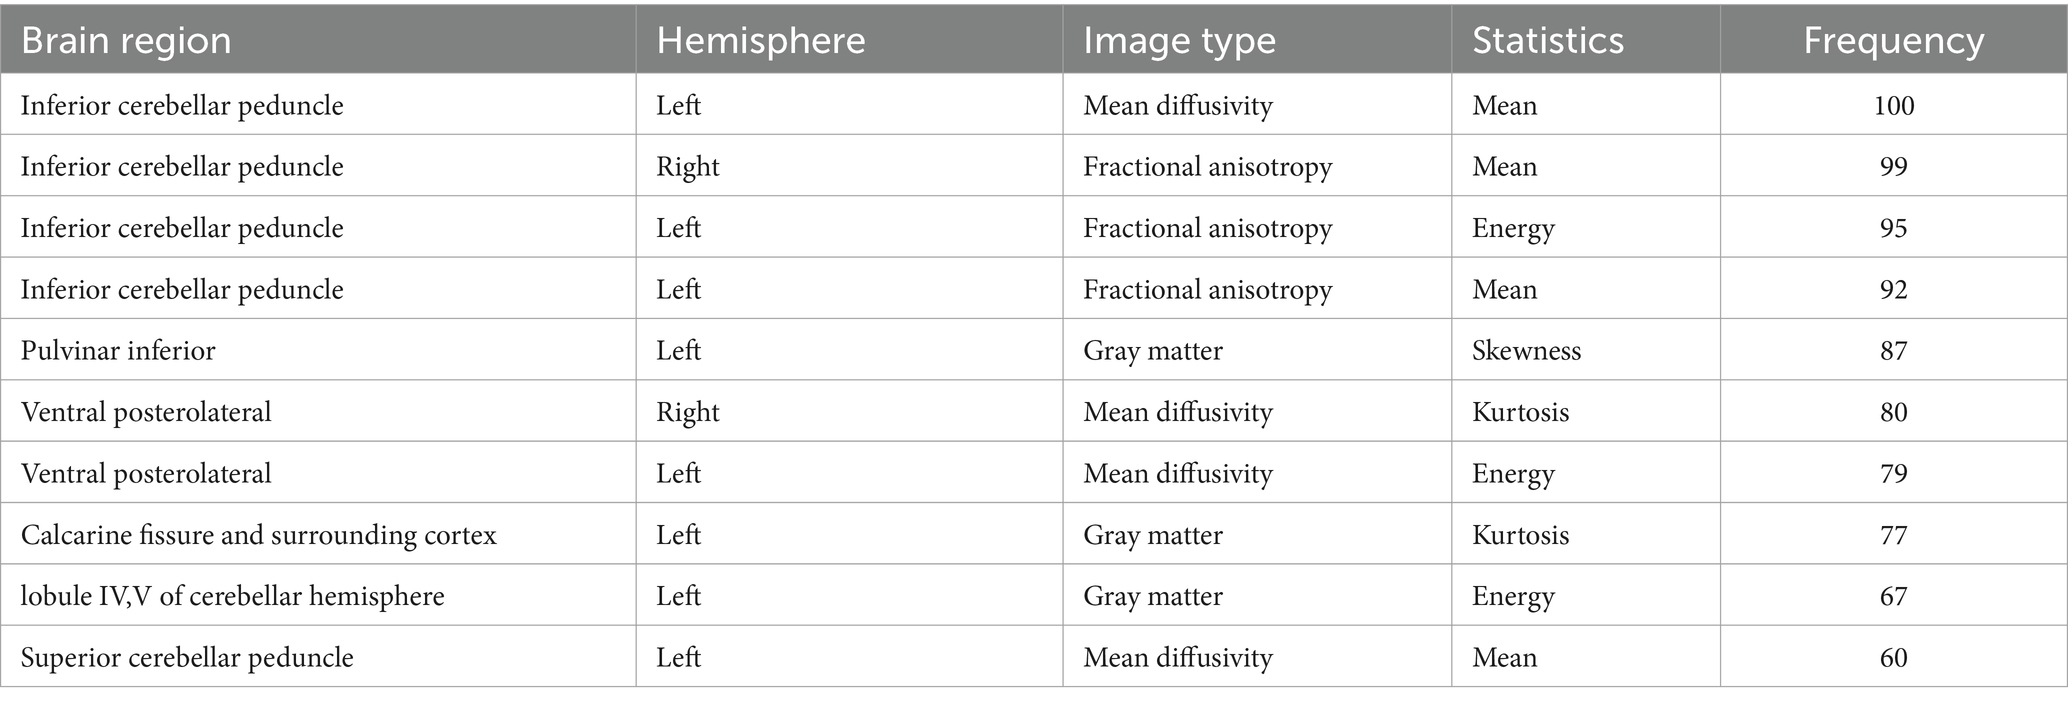
Table 2. The significant discriminative features between ET and HCs.
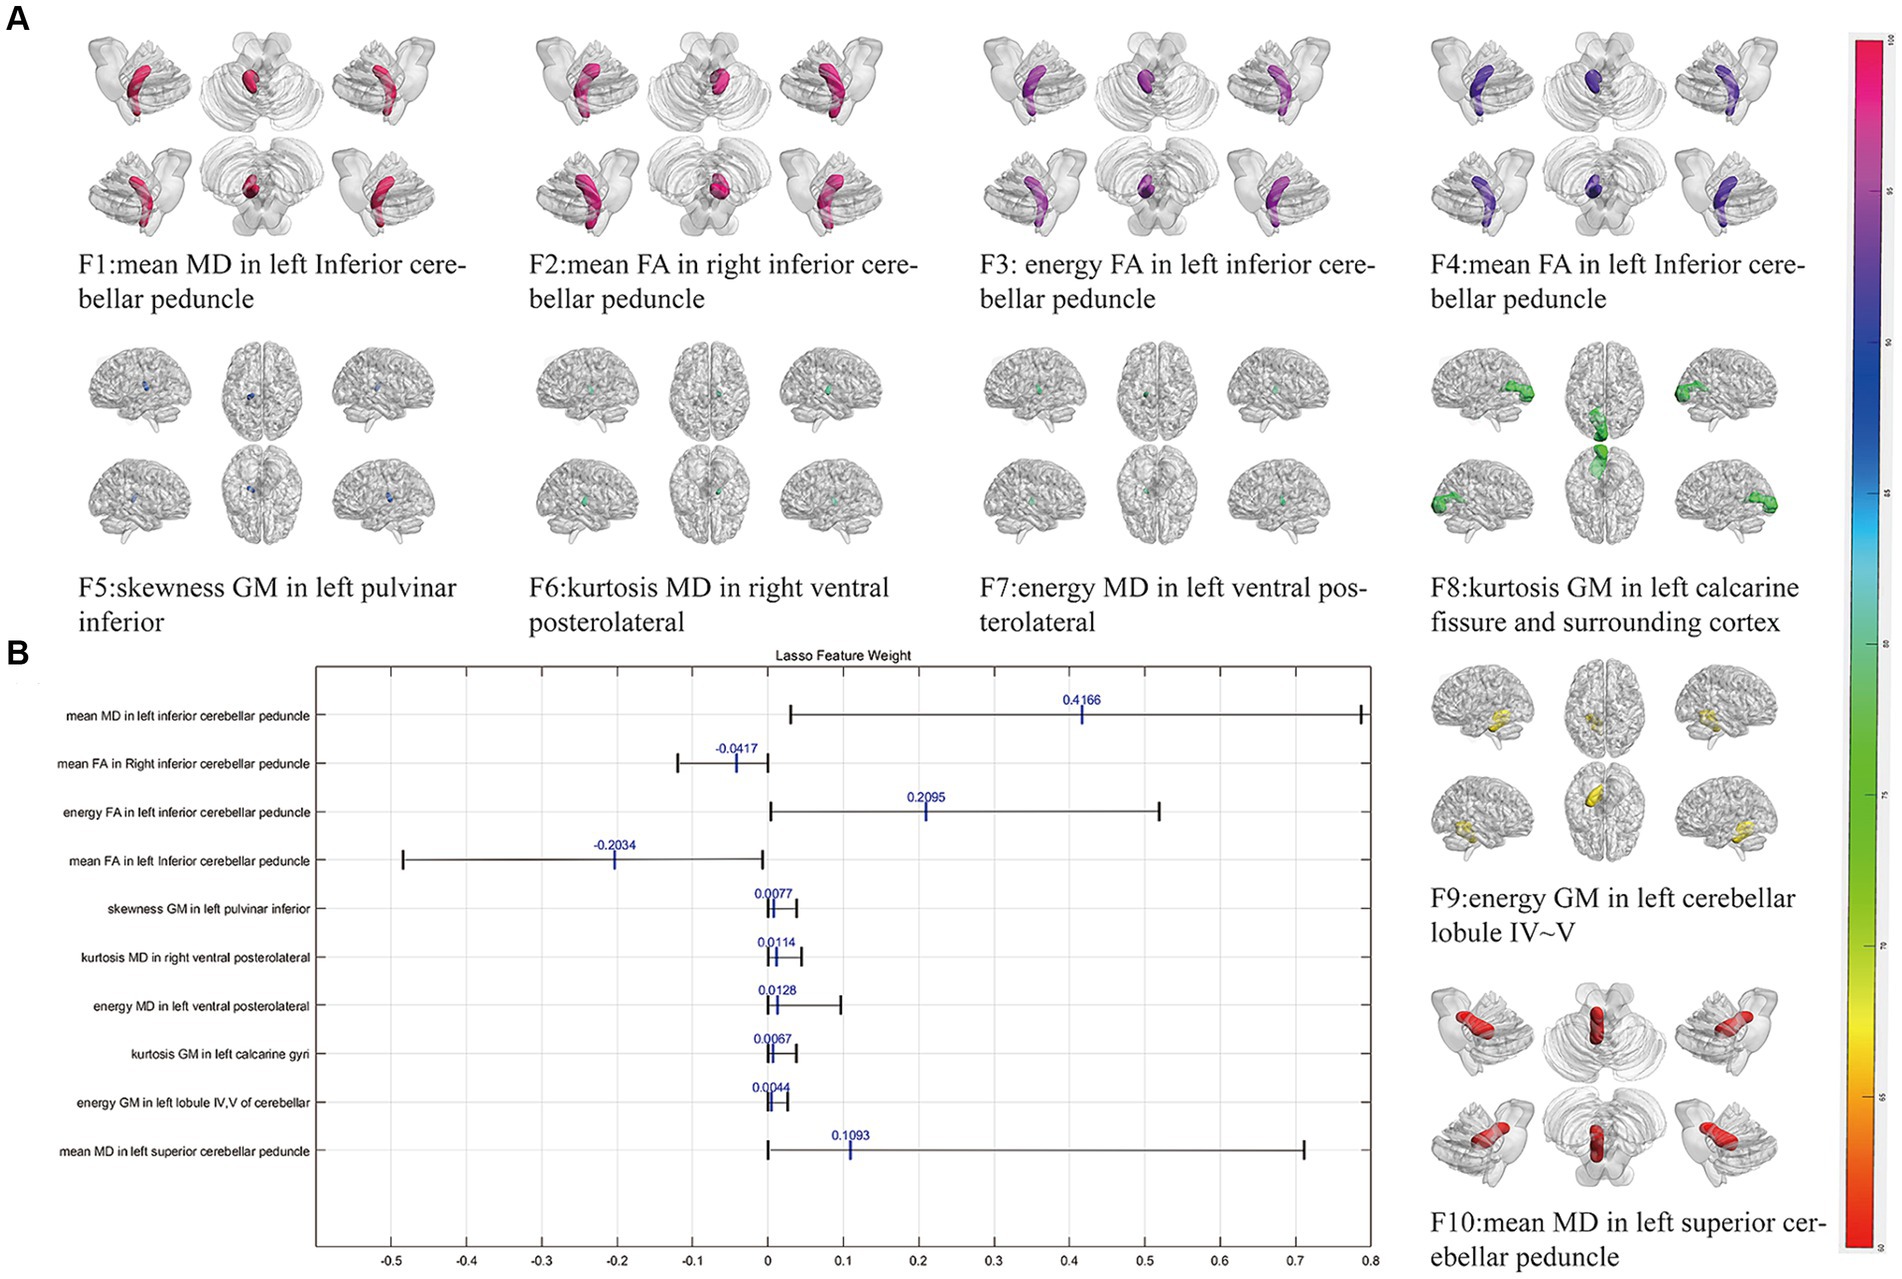
Figure 1. The selected most power discriminative features. (A) Showed the alignment diagram based on the coefficients in the LASSO analysis of the most discriminative features, with the black horizontal line segments representing the range of the coefficients, with the left end indicating the minimum value and the right end indicating the maximum value. The blue line represented the mean value of the coefficients. (B) Showed the most power discriminative features between ET and HCs groups and the color bar value represents the frequency of the features. FA, fractional anisotropy; MD, mean diffusivity; GM, gray matter.
Classification performance
In our automated classification framework, we employed five classifiers. To thoroughly evaluate the classification performance, we repeated the entire framework 100 times and assessed the model’s average performance across these 100 rounds. All classifiers achieved good classification performance with little overfitting (Figure 2 and Table 3). Evaluating a machine learning model’s performance on a test set is crucial, as it provides a critical assessment of the model’s ability to accurately classify or predict previously unseen data. This evaluation determines the model’s effectiveness and reliability in practical applications (22). In the test set, the RBF-SVM, linear-LR, RF, XGBoost, and MLP classifiers achieved mean accuracy and mean AUC values of 97.63% and 0.987, 97.66% and 0.984, 95.01% and 0.984, 95.41% and 0.988, and 95.06% and 0.981, respectively. Considering the highest mAUC value in the test set, we selected XGBoost as the optimal classifier for our model, with average learning rate, max depth, and n_estimators values of 0.20, 3.56, and 187, respectively. Furthermore, it demonstrated a mean balanced accuracy of 93.67%, a mean sensitivity of 95.41%, and a mean specificity of 97.15%. The Friedman test revealed statistically significant differences in AUC values among the classifiers (p < 0.0001). Wilcoxon signed-rank test indicated that the differences between RBF-SVM and RF, RBF-SVM and MLP, RF and XGBoost, and RF and LR were statistically significant, with p-values <0.05 (Figure 3). The results of the permutation test confirmed the reliability of accuracy and AUC values for all models, with p-values consistently less than 0.001 in the iterations. Detailed hyperparameters for each round for all models are shown in Supplementary Table S2.
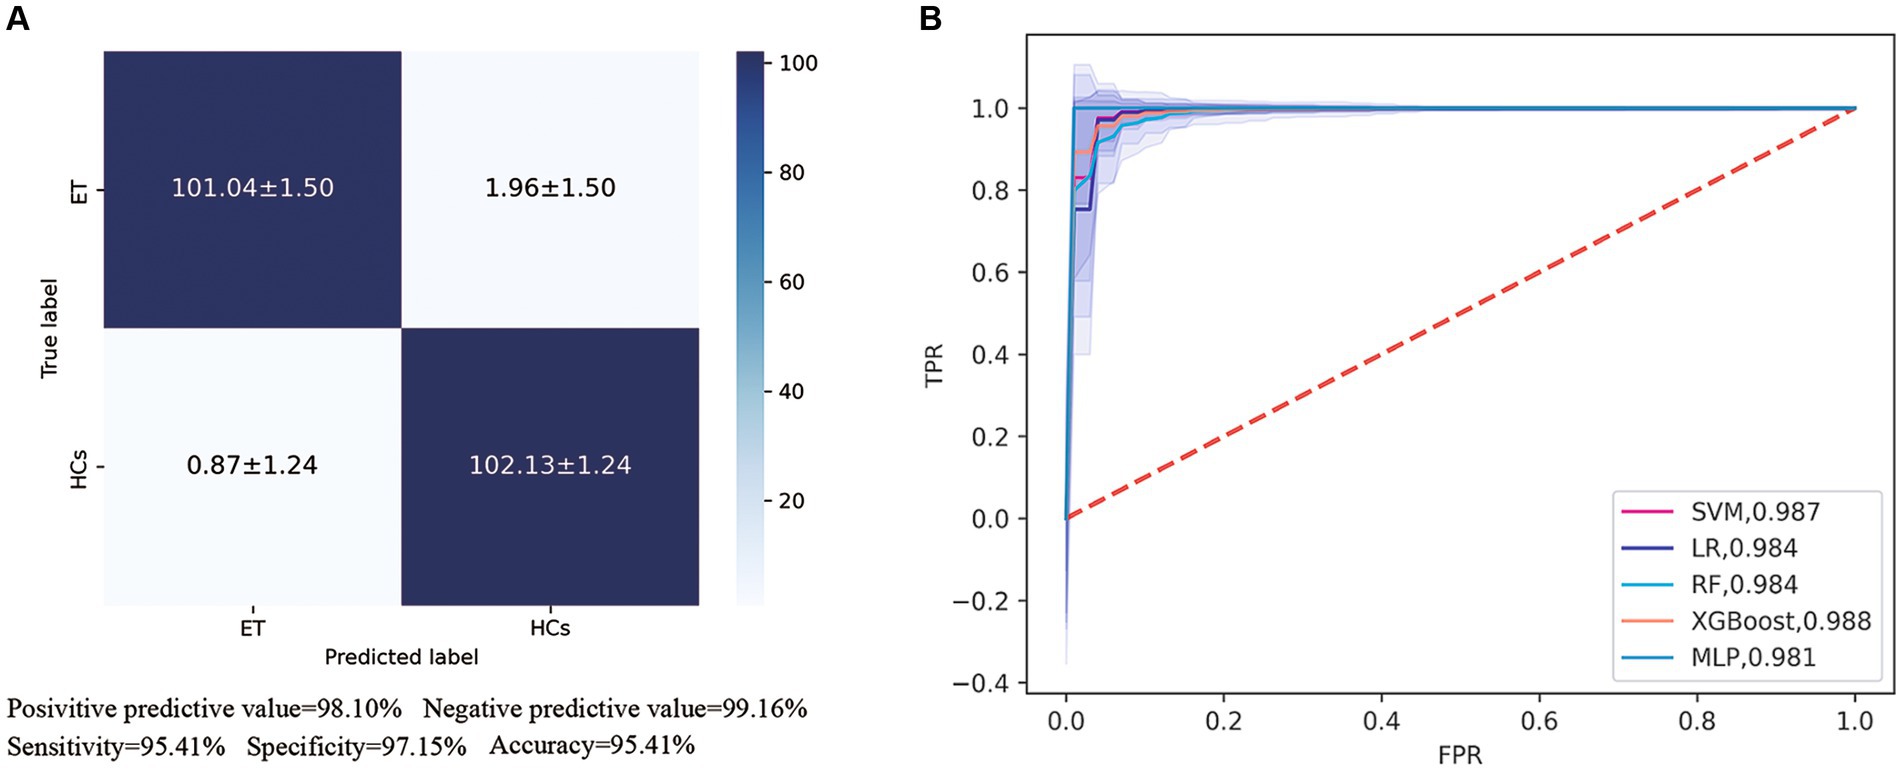
Figure 2. Receiver operating characteristic (ROC) curves and area under the curve (AUC) of five machine learning models. (A) Showed the confusion matrix of the best classifier-XGBoos based on 100 cycles. (B) Showed the ROC curves and AUC values of all classifiers on the test set. SVM, the support vector machine; RF, random forest; LR, logistic regression; XGBoost, extreme gradient boosting; MLP, multi-layer perceptron.
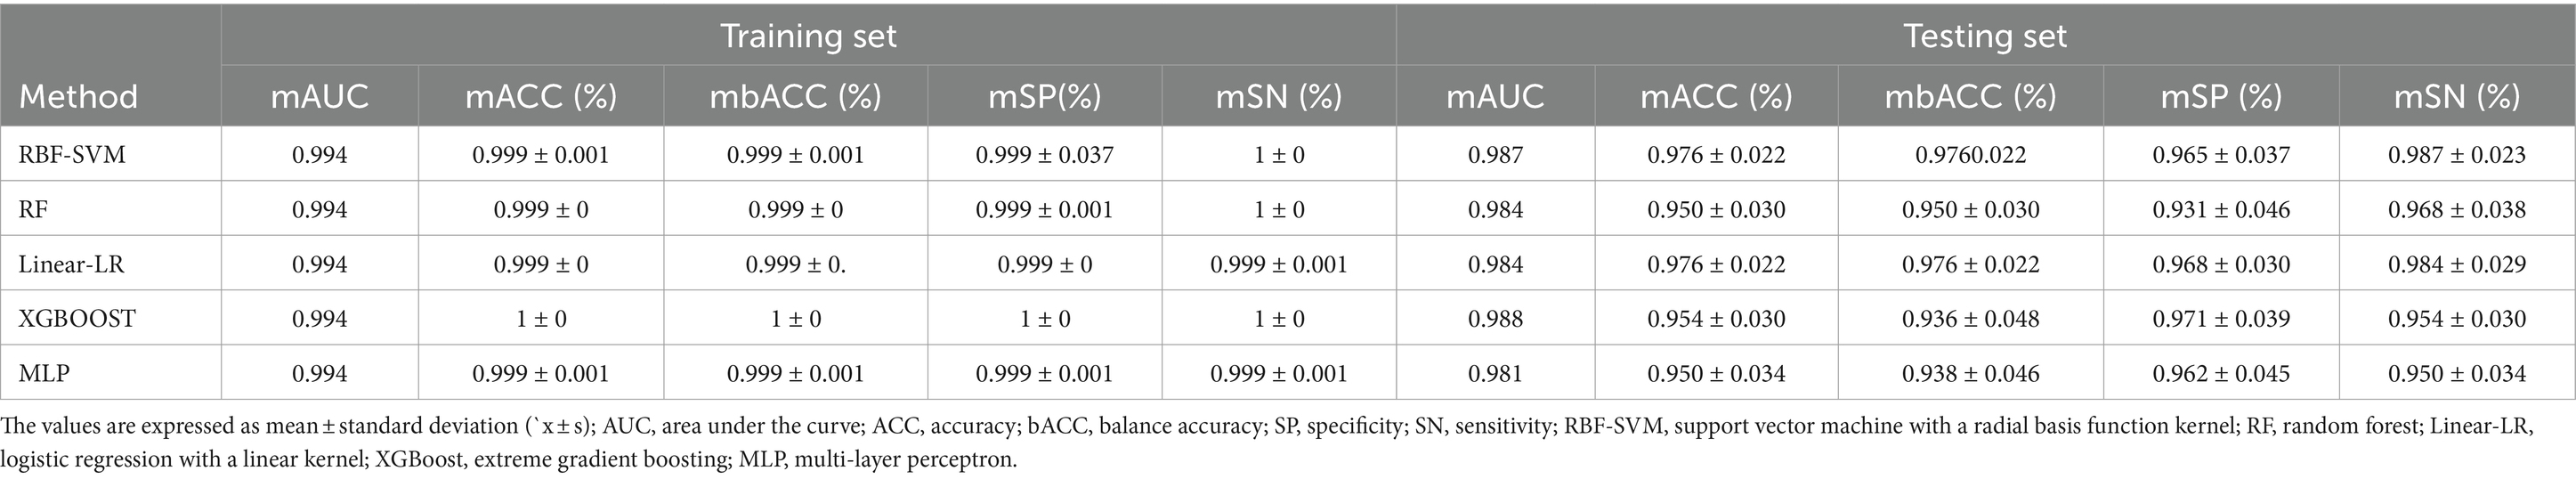
Table 3. The classification performance in the training set and testing set.
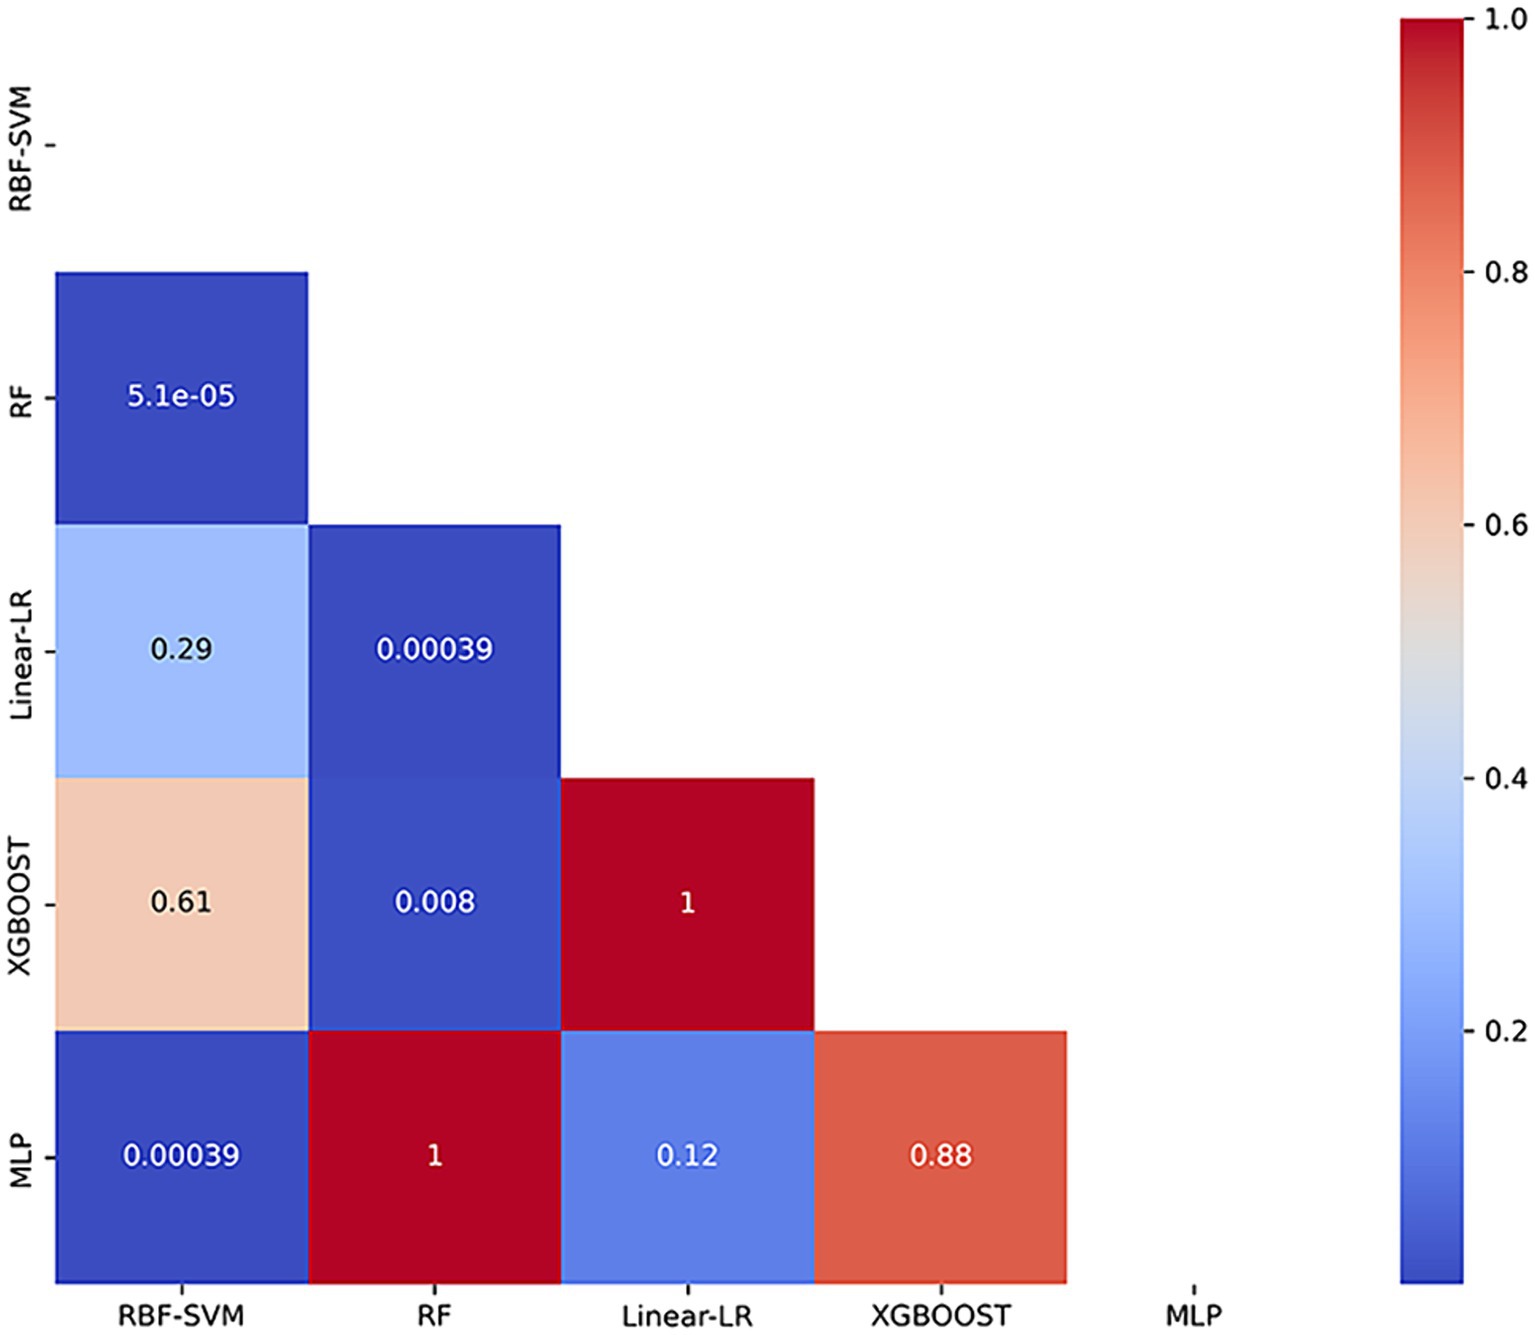
Figure 3. Heatmap of p-values from Wilcoxon Signed-Rank Test with Bonferroni Correction. The heatmap presents the p-values obtained from pairwise comparisons of classification models using the Wilcoxon signed-rank test, adjusted with the Bonferroni correction. RBF-SVM, the support vector machine with radial basis function kernel; RF, random forest; Linear-LR, logistic regression with the linear kernel; XGBoost, extreme gradient boosting; MLP, multi-layer perceptron.
Correlation analysis
Figure 4 showed the partial Pearson’s correlation analysis results, and three features were significantly correlated with clinical tremor characteristics in ET patients. The mean MD in left superior cerebellar peduncle and the energy GM in left cerebellar lobule IV ~ V had a negative correlation with TRS parts A&B (p < 0.001, r = − 0.41 and - 0.47, respectively), and the kurtosis GM in left calcarine gyri had a positive correlation with TRS parts A&B (p < 0.001, r = 0.43).
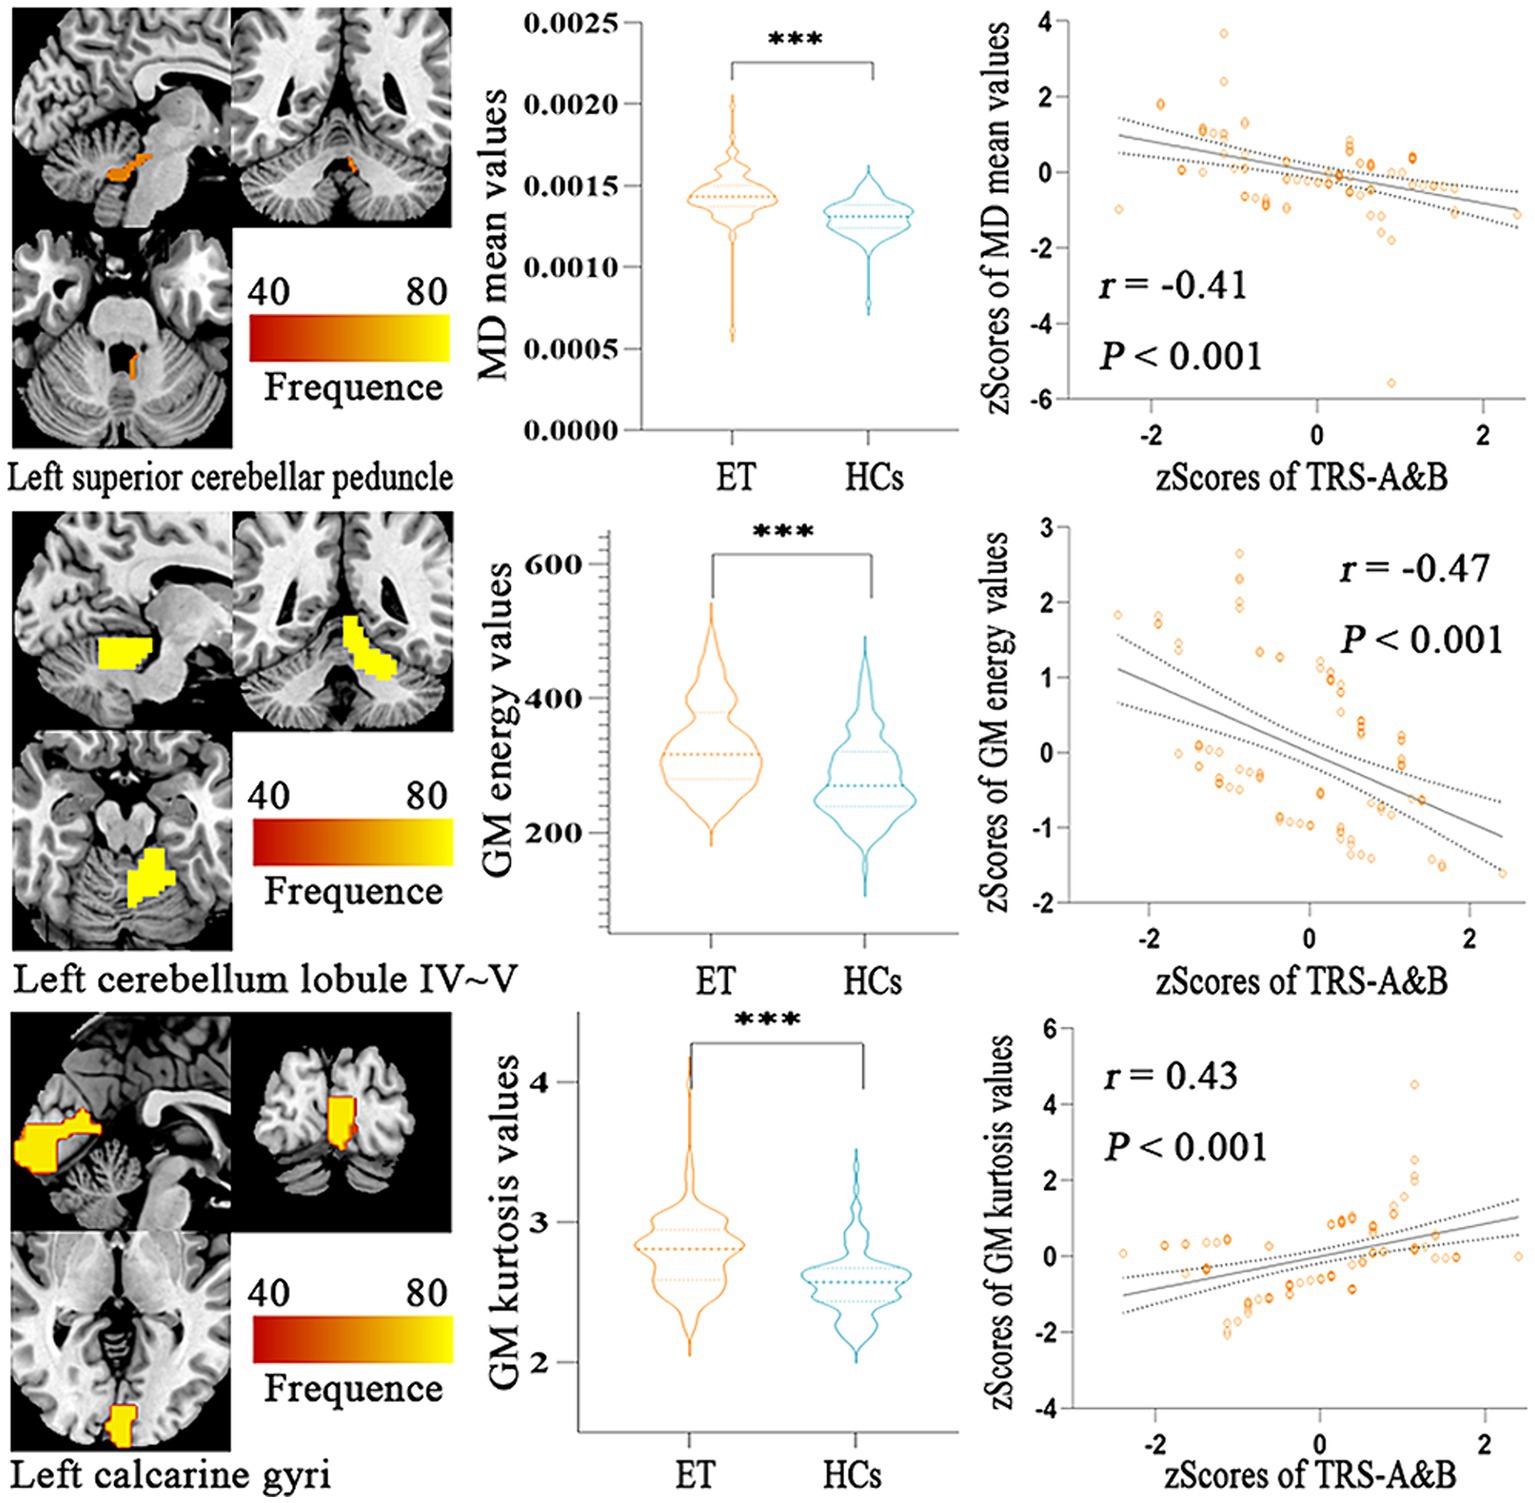
Figure 4. Partial Pearson Correlation analysis results between the selected radiomics features and clinical tremor characteristics in ET patients. Bonferroni multiple comparison corrections, corrected p < 0.05/10*(10-1)/2. Violin plots displaying the mean and standard deviations of the selected radiomics features in the ET and HCs group; Scatter plots showing the correlation analysis in the ET group. ***p < 0.001. ET, essential tremor; HCs, healthy controls; zTRS A&B scores, z-transformed Fahn-Tolosa-Marin Tremor Rating Scale parts A and B scores.
Discussion
In our study, we combined radiomics features extracted from 3D-T1 and DTI with multiple machine learning algorithms to identify ET patients from HCs and had three main findings. First, all ML algorithms (RBF-SVM, linear-LR, RF, XGBoost, and MLP classifiers) achieved excellent classification performance (with mAUC at 0.987, 0.984, 0.984, 0.988 and 0.981, respectively), and among these classifiers, XGBoost performed the best (mAUC value at 0.994). Second, the most powerful discriminative features came from both the brain GM and WM tract, and primarily located in the cerebello-thalamo-cortical (CTC) and cerebello-visual pathway. Third, some radiomics features in cerebellar GM, WM tract and visual gyri could be used to explain partially clinical tremor symptoms.
In the recent decade, due to the inherent advantages of allowing the simultaneous evaluation of multiple different source features without any a priori knowledge, that is, the multivariate approach, machine learning algorithms have been widely applied to identify ET (23). Using clinical characteristics such as gait and postural transition parameters (24), voice samples underwent sound signal (25), Archimedes’ spiral and wearable multi-segment upper limb tremor assessment system (26, 27), some studies have achieved good classification performance to discriminate ET from PD or ET from HCs. Meanwhile, few studies adopted MRI data as input features performed the above work, resulting in similar results. For instance, Zhang et al. employed resting-state fMRI data with SVM, Gradient Boosted Decision Tree, RF and Gaussian Naïve Bayes algorithms, achieving classification accuracies of 82.8, 79.4, 78.9, and 72.4%, respectively (28). Additionally, Jia et al. used DTI and found that the apparent diffusion coefficient (ADC) value of the red nuclei in ET patients was significantly higher compared to controls (0.90 vs. 0.77; p = 0.000), although no significant differences were found for FA or ADC values of other structures (29).In another study, Prasad et al. utilized 3D-T1 imaging and observed significant atrophy in the bilateral middle cerebellar peduncle, ICP, and cerebellar gray matter. Their multi-variate classifier discriminated ET from controls with a test accuracy of 86.66% (30). Compared to the above studies, our research obtained excellent classification performance, and we attributed this improvement to the following advantages: First, the diagnosis of ET patients was according to the 2018 consensus criteria in our studies, and most of the above studies just adopted the traditional consensus criteria. Almost all researchers agree that ET is a heterogeneous disease, and the heterogeneous traits cause variable and inconsistent results between different studies (31). The traditional consensus criteria paid little attention to the heterogeneity of ET, and the 2018 consensus criteria, with a more precise and narrow definition, let the cohorts of ET be more highly homogeneous. Second, 3D-T1 and DTI were used as input data, and these structural MRI images made the results more robust. The clinical characteristics and resting-state fMRI data are easily disturbed by multiple factors, such as different observers, indicators, and physiological states. However, these factors have less impact on 3D-T1 and DTI, and some metrics of 3D-T1 and DTI have been adopted as imaging markers in a lot of neurodegenerative diseases, such as Alzheimer’s disease and multiple system atrophy. Third, an AAL3 and JHU-ICBM atlas were used to comprehensively and simultaneously observe GM and WM microstructural changes, and most of the above studies only focused on GM or WM changes with tract-based spatial statistics or region of interest (ROI) methods based on some priori knowledge (32). Fourth, a large sample size (103 ET patients and 103 HCs) made our study easier to gain stable and consistent results, and except for our previous studies based on resting-state fMRI data, most of the above studies only included 20 to 40 ET patients. Therefore, we suggested that combining the radiomics features extracted from 3D-T1 and DTI with multiple machine learning algorithms would provide another important way to discriminate ET from HCs, and it would be adopted as a routine analysis in clinical practice.
The most powerful discriminative features came from both the brain GM and WM tracts, and primarily located in the cerebello-thalamo-cortical (CTC) pathway, consistent with the previous clinical, pathological and neuroimaging findings. The ventral intermediate nucleus (VIM) of the thalamus is an established therapeutic target. An increasing number of treatment methods, including stereotactic thalamotomy, deep-brain stimulus (DBS), gamma knife and focused ultrasound, have selected the VIM as the prime treatment target for ET and achieved good therapeutic effects (33–36). The VIM anatomical projects to the cerebellum and motor cortices and comprise the CTC pathway. Combined the above features give powerful evidence that the CTC pathway plays a crucial role in the generation or transmission of tremors in ET patients. Meanwhile, growing pathologic evidence is attributable to the key pathogenesis role of the cerebellum in ET. Post-mortem studies reported that loss or swelling of Purkinje cells and reducing GABA receptor density in the dentate nucleus were related to ET patients (37). Again, neuroimage from PET, structure, task, and resting-state fMRI also supported that the CTC pathway was associated with ET (38–41). However, our results were not fully consistent with the above studies. First, some radiomics of VIM, such as kurtosis MD in right ventral posterolateral (VPL) and energy MD in left ventral posterolateral (VPL), acted as the most powerful discriminative features to discriminate ET from HCs, but a correlation analysis did not explore any relationships between these features and clinical tremor status. We suggested that the VIM perhaps served as a relay station for tremor transmission from the cerebellum to the cerebral cortex in the CTC pathway and did not undertake tremor generation. Second, among the 10 most powerful discriminative features selected, 4 features, including mean MD in left inferior cerebellar peduncle (ICP), mean FA in right inferior cerebellar peduncle (ICP), mean FA in left Inferior cerebellar peduncle (ICP) and mean MD in left superior cerebellar peduncle (SCP), could be obtained by the traditional methods and the remaining 6 features existed in radiomics analysis. This profile further suggested that radiomics analysis can abstract vast quantitative features and these features also contain important information to discriminate ET from HCs.
The most powerful discriminative features located in the visual pathway seemed to be contract to most of previous studies. There is still a debate about whether the visual pathways are associated with tremors in ET patients. Using morphometric analysis of 3D-T1, most other researchers and our previous studies did not reveal any morphometric changes, including the visual areas in ET patients. However, some other studies from grip-force task fMRI reported that the visual feedback and visual areas played a vital role in modulating the severity of tremor in ET patients (42). Meanwhile, a VBM study reported that GM density changes in the visual pathway were related to ET patients (43). Again, the tremor improvement after stereotactic radio-surgical thalamotomy were involvement in the high-level visual areas (44). Finally, the most powerful discriminative features located in the visual pathway were kurtosis GM in left calcarine fissure in the present studies, and they could not be measured by the above traditional morphometric analysis methods. Therefore, we suggested that our results provide complementary information rather than contradictory information from previous studies.
Limitations
There are several limitations that should be noted. Firstly, although the sample size of this study was relatively larger than others, it was recruited from a single center, which limited the generalizability and stability of the proposed model. Secondly, we employed strict inclusion criteria to recruit patients and had annual follow-ups. Misdiagnosing is common due to the diagnosis being strongly dependent on clinical symptoms and nervous system examinations and a lack of biomarkers in ET patients. Thirdly, the present study utilized only first-order radiomics features without considering a wide range of textural features, which are now widely used in the context of studies of neurological diseases. Additionally, some deep learning algorithms could automatically and directly extract discriminant information from the raw images. Therefore, in our future study, we hope to apply deep learning algorithms combined with MRI images to provide new insights into the microstructural changes of ET.
Conclusion
Combined radiomics features based on 3D-T1 and DTI with multiple machine learning algorithms have achieved good classification performance for discriminating ET from HCs. The most powerful discriminatory features were not only confined to the typical tremor networks but also extended into the visual pathway, and these features would help to understand the brain microstructural pathogenesis mechanisms in ET patients.
Data availability statement
The raw data supporting the conclusions of this article will be made available by the authors, without undue reservation.
Ethics statement
The studies involving human participants were reviewed and approved by the Ethics Committee of the First Affiliated Hospital of Chongqing Medical University. Written informed consent to participate in this study was provided by the patients/participants or patient/participants' legal guardian/next of kin. Written informed consent was obtained from the individual(s) for the publication of any potentially identifiable images or data included in this article.
Author contributions
BX: Data curation, Investigation, Visualization, Writing – original draft, Writing – review & editing. LT: Methodology, Writing – original draft, Writing – review & editing. HG: Conceptualization, Data curation, Writing – review & editing. PX: Formal analysis, Project administration, Writing – review & editing. XZ: Validation, Visualization, Writing – review & editing. HoW: Investigation, Resources, Writing – review & editing. HC: Formal analysis, Funding acquisition, Writing – review & editing. HaW: Investigation, Project administration, Writing – review & editing. FL: Formal analysis, Funding acquisition, Writing – review & editing. TL: Methodology, Project administration, Writing – review & editing. OC: Methodology, Project administration, Writing – review & editing. JL: Project administration, Resources, Writing – review & editing. YM: Conceptualization, Data curation, Writing – review & editing. ZX: Validation, Writing – review & editing. WF: Funding acquisition, Methodology, Project administration, Resources, Writing – review & editing.
Funding
The author(s) declare that financial support was received for the research, authorship, and/or publication of this article. This study was funded by the National Natural Science Foundation of China (NSFC: 81671663) and the Natural Science Foundation of Chongqing (NSFCQ: cstc2014jcyjA10047).
Conflict of interest
The authors declare that the research was conducted in the absence of any commercial or financial relationships that could be construed as a potential conflict of interest.
Publisher’s note
All claims expressed in this article are solely those of the authors and do not necessarily represent those of their affiliated organizations, or those of the publisher, the editors and the reviewers. Any product that may be evaluated in this article, or claim that may be made by its manufacturer, is not guaranteed or endorsed by the publisher.
Supplementary material
The Supplementary material for this article can be found online at: https://www.frontiersin.org/articles/10.3389/fneur.2024.1460041/full#supplementary-material
Footnotes
1. ^http://www.fil.ion.ucl.ac.uk/spm/software/spm12
2. ^http://www.nitrc.org/projects/panda
3. ^version 0.20.1, freely available: http://scikit-learn.org/.
References
1. Shanker, V. Essential tremor: diagnosis and management. BMJ. (2019) 366:l4485. doi: 10.1136/bmj.l4485
2. Bhatia, KP, Bain, P, Bajaj, N, Elble, RJ, Hallett, M, Louis, ED, et al. Consensus statement on the classification of tremors. From the task force on tremor of the International Parkinson and Movement Disorder Society. Mov Disord. (2018) 33:75–87. doi: 10.1002/mds.27121
3. Mk, P, and Sh, K. Essential tremor: clinical perspectives and pathophysiology. J Neurol Sci. (2022) 435:120198. doi: 10.1016/j.jns.2022.120198
4. Fanning, A, and Kuo, S-H. Clinical heterogeneity of essential tremor: understanding neural substrates of action tremor subtypes. Cerebellum. (2023) 2023:551. doi: 10.1007/s12311-023-01551-3
5. Prasuhn, J, Heldmann, M, Münte, TF, and Brüggemann, N. A machine learning-based classification approach on Parkinson’s disease diffusion tensor imaging datasets. Neurol Res Pract. (2020) 2:46. doi: 10.1186/s42466-020-00092-y
6. Lee, W, Park, B, and Han, K. Classification of diffusion tensor images for the early detection of Alzheimer’s disease. Comput Biol Med. (2013) 43:1313–20. doi: 10.1016/j.compbiomed.2013.07.004
7. Pang, H, Yu, Z, Yu, H, Chang, M, Cao, J, Li, Y, et al. Multimodal striatal neuromarkers in distinguishing parkinsonian variant of multiple system atrophy from idiopathic Parkinson’s disease. CNS. Neurosci Ther. (2022):cns.13959. doi: 10.1111/cns.13959
8. Bot, M, van Rootselaari, A-F, Odekerken, V, Dijk, J, de Bie, RMA, Beudel, M, et al. Evaluating and optimizing Dentato-Rubro-thalamic-tract deterministic Tractography in deep brain stimulation for essential tremor. Oper Neurosurg (Hagerstown). (2021) 21:533–9. doi: 10.1093/ons/opab324
9. Coenen, VA, Sajonz, B, Prokop, T, Reisert, M, Piroth, T, Urbach, H, et al. The dentato-rubro-thalamic tract as the potential common deep brain stimulation target for tremor of various origin: an observational case series. Acta Neurochir. (2020) 162:1053–66. doi: 10.1007/s00701-020-04248-2
10. Liu, Z, Wang, S, Dong, D, Wei, J, Fang, C, Zhou, X, et al. The applications of Radiomics in precision diagnosis and treatment of oncology: opportunities and challenges. Theranostics. (2019) 9:1303–22. doi: 10.7150/thno.30309
11. Khosla, M, Jamison, K, Ngo, GH, Kuceyeski, A, and Sabuncu, MR. Machine learning in resting-state fMRI analysis. Magn Reson Imaging. (2019) 64:101–21. doi: 10.1016/j.mri.2019.05.031
12. Rolls, ET. Automated anatomical labelling atlas 3. Automated anatomical labelling atlas. (2020) 206:116189. doi: 10.1016/j.neuroimage.2019.116189
13. Mori, S, Oishi, K, Jiang, H, Jiang, L, Li, X, Akhter, K, et al. Stereotaxic white matter atlas based on diffusion tensor imaging in an ICBM template. NeuroImage. (2008) 40:570–82. doi: 10.1016/j.neuroimage.2007.12.035
14. van Griethuysen, JJM, Fedorov, A, Parmar, C, Hosny, A, Aucoin, N, Narayan, V, et al. Computational Radiomics system to decode the radiographic phenotype. Cancer Res. (2017) 77:e104–7. doi: 10.1158/0008-5472.CAN-17-0339
15. Federico, A, Kern, J, Varelas, X, and Monti, S. Structure learning for gene regulatory networks. PLoS Comput Biol. (2023) 19:e1011118. doi: 10.1371/journal.pcbi.1011118
16. Song, S, Zhan, Z, Long, Z, Zhang, J, and Yao, L. Comparative study of SVM methods combined with voxel selection for object category classification on fMRI data. PLoS One. (2011) 6:e17191. doi: 10.1371/journal.pone.0017191
18. Liu, D, Ghosh, D, and Lin, X. Estimation and testing for the effect of a genetic pathway on a disease outcome using logistic kernel machine regression via logistic mixed models. BMC Bioinformatics. (2008) 9:292. doi: 10.1186/1471-2105-9-292
20. Hinton, GE, and Salakhutdinov, RR. Reducing the dimensionality of data with neural networks. Science. (2006) 313:504–7. doi: 10.1126/science.1127647
21. Zarogianni, E, Storkey, AJ, Johnstone, EC, Owens, DGC, and Lawrie, SM. Improved individualized prediction of schizophrenia in subjects at familial high risk, based on neuroanatomical data, schizotypal and neurocognitive features. Schizophr Res. (2017) 181:6–12. doi: 10.1016/j.schres.2016.08.027
22. Harrell, FE, Lee, KL, and Mark, DB. Multivariable prognostic models: issues in developing models, evaluating assumptions and adequacy, and measuring and reducing errors. Stat Med. (1996) 15:361–87. doi: 10.1002/(SICI)1097-0258(19960229)15:4<361::AID-SIM168>3.0.CO;2-4
23. Nielsen, AN, Barch, DM, Petersen, SE, Schlaggar, BL, and Greene, DJ. Machine learning with neuroimaging: evaluating its applications in psychiatry. Biol Psychiatry Cogn Neurosci Neuroimaging. (2020) 5:791–8. doi: 10.1016/j.bpsc.2019.11.007
24. Skinner, JW, Lee, HK, and Hass, CJ. Evaluation of gait termination strategy in individuals with essential tremor and Parkinson’s disease. Gait Posture. (2022) 92:338–42. doi: 10.1016/j.gaitpost.2021.12.007
25. Suppa, A, Asci, F, Saggio, G, Di Leo, P, Zarezadeh, Z, Ferrazzano, G, et al. Voice analysis with machine learning: one step closer to an objective diagnosis of essential tremor. Mov Disord. (2021) 36:1401–10. doi: 10.1002/mds.28508
26. Lopez-de-Ipina, K, Solé-Casals, J, Faúndez-Zanuy, M, Calvo, PM, Sesa, E, Roure, J, et al. Automatic analysis of Archimedes’ spiral for characterization of genetic essential tremor based on Shannon’s entropy and fractal dimension. Entropy (Basel). (2018) 20:531. doi: 10.3390/e20070531
27. Lin, S, Gao, C, Li, H, Huang, P, Ling, Y, Chen, Z, et al. Wearable sensor-based gait analysis to discriminate early Parkinson’s disease from essential tremor. J Neurol. (2023) 270:2283–301. doi: 10.1007/s00415-023-11577-6
28. Zhang, X, Chen, H, Zhang, X, Wang, H, Tao, L, He, W, et al. Identification of essential tremor based on resting-state functional connectivity. Hum Brain Mapp. (2022) 44:1407–16. doi: 10.1002/hbm.26124
29. Jia, L, Jia-lin, S, Qin, D, Qing, L, and Yan, Z. A diffusion tensor imaging study in essential tremor. J Neuroimaging. (2011) 21:370–4. doi: 10.1111/j.1552-6569.2010.00535.x
30. Prasad, S, Pandey, U, Saini, J, Ingalhalikar, M, and Pal, PK. Atrophy of cerebellar peduncles in essential tremor: a machine learning–based volumetric analysis. Eur Radiol. (2019) 29:7037–46. doi: 10.1007/s00330-019-06269-7
32. Sun, H, Chen, Y, Huang, Q, Lui, S, Huang, X, Shi, Y, et al. Psychoradiologic utility of MR imaging for diagnosis of attention deficit hyperactivity disorder: a Radiomics analysis. Radiology. (2018) 287:620–30. doi: 10.1148/radiol.2017170226
33. Su, JH, Choi, EY, Tourdias, T, Saranathan, M, Halpern, CH, Henderson, JM, et al. Improved vim targeting for focused ultrasound ablation treatment of essential tremor: a probabilistic and patient-specific approach. Hum Brain Mapp. (2020) 41:4769–88. doi: 10.1002/hbm.25157
34. Outcomes from Stereotactic Surgery for Essential Tremor. Available at: https://pubmed.ncbi.nlm.nih.gov/30337440/ (Accessed November 27, 2023).
35. Koller, WC, Lyons, KE, Wilkinson, SB, Troster, AI, and Pahwa, R. Long-term safety and efficacy of unilateral deep brain stimulation of the thalamus in essential tremor. Mov Disord. (2001) 16:464–8. doi: 10.1002/mds.1089
36. Young, RF, Li, F, Vermeulen, S, and Meier, R. Gamma knife thalamotomy for treatment of essential tremor: long-term results. J Neurosurg. (2010) 112:1311–7. doi: 10.3171/2009.10.JNS09332
37. Louis, ED. Essential tremor: evolving clinicopathological concepts in an era of intensive post-mortem enquiry. Lancet Neurol. (2010) 9:613–22. doi: 10.1016/S1474-4422(10)70090-9
38. Coenen, VA, Allert, N, Paus, S, Kronenbürger, M, Urbach, H, and Mädler, B. Modulation of the cerebello-thalamo-cortical network in thalamic deep brain stimulation for tremor: a diffusion tensor imaging study. Neurosurgery. (2014) 75:657–69. doi: 10.1227/NEU.0000000000000540
39. Boscolo Galazzo, I, Magrinelli, F, Pizzini, FB, Storti, SF, Agosta, F, Filippi, M, et al. Voxel-based morphometry and task functional magnetic resonance imaging in essential tremor: evidence for a disrupted brain network. Sci Rep. (2020) 10:15061. doi: 10.1038/s41598-020-69514-w
40. Nicoletti, V, Cecchi, P, Pesaresi, I, Frosini, D, Cosottini, M, and Ceravolo, R. Cerebello-thalamo-cortical network is intrinsically altered in essential tremor: evidence from a resting state functional MRI study. Sci Rep. (2020) 10:16661. doi: 10.1038/s41598-020-73714-9
41. Boecker, H, Weindl, A, Brooks, DJ, Ceballos-Baumann, AO, Liedtke, C, Miederer, M, et al. GABAergic dysfunction in essential tremor: an 11C-flumazenil PET study. J Nucl Med. (2010) 51:1030–5. doi: 10.2967/jnumed.109.074120
42. Archer, DB, Coombes, SA, Chu, WT, Chung, JW, Burciu, RG, Okun, MS, et al. A widespread visually-sensitive functional network relates to symptoms in essential tremor. Brain. (2018) 141:472–85. doi: 10.1093/brain/awx338
43. Tuleasca, C, Witjas, T, Najdenovska, E, Verger, A, Girard, N, Champoudry, J, et al. Assessing the clinical outcome of vim radiosurgery with voxel-based morphometry: visual areas are linked with tremor arrest! Acta Neurochir. (2017) 159:2139–44. doi: 10.1007/s00701-017-3317-7
44. Bolton, TAW, Van De Ville, D, Régis, J, Witjas, T, Girard, N, Levivier, M, et al. Graph theoretical analysis of structural covariance reveals the relevance of visuospatial and attentional areas in essential tremor recovery after stereotactic Radiosurgical Thalamotomy. Front Aging Neurosci. (2022) 14:873605. doi: 10.3389/fnagi.2022.873605
Keywords: essential tremor, machine learning, radiomics, diffusion tensor imaging, 3D T1-weighted MRI
Citation: Xu B, Tao L, Gui H, Xiao P, Zhao X, Wang H, Chen H, Wang H, Lv F, Luo T, Cheng O, Luo J, Man Y, Xiao Z and Fang W (2024) Radiomics based on diffusion tensor imaging and 3D T1-weighted MRI for essential tremor diagnosis. Front. Neurol. 15:1460041. doi: 10.3389/fneur.2024.1460041
Edited by:
Alessia Sarica, University of Magna Graecia, ItalyReviewed by:
Benedetta Tafuri, University of Bari Aldo Moro, ItalyZhenyu Shu, Zhejiang Provincial People’s Hospital, China
Copyright © 2024 Xu, Tao, Gui, Xiao, Zhao, Wang, Chen, Wang, Lv, Luo, Cheng, Luo, Man, Xiao and Fang. This is an open-access article distributed under the terms of the Creative Commons Attribution License (CC BY). The use, distribution or reproduction in other forums is permitted, provided the original author(s) and the copyright owner(s) are credited and that the original publication in this journal is cited, in accordance with accepted academic practice. No use, distribution or reproduction is permitted which does not comply with these terms.
*Correspondence: Weidong Fang, ZndkOTcwN0BzaW5hLmNvbQ==
†These authors have contributed equally to this work and share first authorship