 Zhiyong Tang
 Canlin Liao
 Zerui Zhuang
 Zhennan Xu1
 Mingfa Liu
 Haixiong Xu
- 1Department of Neurosurgery, Shantou Central Hospital, Shantou, Guangdong, China
- 2Department of Neurosurgery, Sun Yat-sen Memorial Hospital, Sun Yat-sen University, Guangzhou, Guangdong, China
Background: Some studies have shown a strong link between the central nervous system and peripheral immune system, but the prognostic implications of dynamic peripheral immune-inflammatory responses in patients with traumatic brain injury (TBI) remain unclear. This study aimed to determine the dynamic trajectory patterns of the Systemic Immune Inflammation Index (SII) in patients with TBI and assess its association with all-cause hospital mortality.
Methods: This retrospective cohort study utilized a large public database of patients with TBI sourced from the eICU Collaborative Research Database (eICU-CRD). Group-Based Trajectory Modeling (GBTM) was used to analyze daily SII trajectories during the initial 0–7 days of hospitalization. Logistic regression was employed to assess the relationship between different SII trajectory groups and hospital mortality. Receiver Operating Characteristic (ROC) curves were generated based on the logistic regression model.
Results: A total of 312 patients were included in this study, 52 of whom died during hospitalization. Using GBTM, three distinct SII trajectories were identified: Group 1 (low-level, rapid decline; 18.90%), Group 2 (moderate-level, slow decline; 60.20%), and Group 3 (sustained high-level; 20.80%). Compared to patients in Group 1, those in Groups 2 and 3 had a higher risk of all-cause hospital mortality (odds ratio [OR] 4.09; 95% confidence interval [CI] 1.21, 19.75) and (OR 5.84; 95% CI 1.52, 30.67), respectively. ROC analysis revealed an area under the curve (AUC) of 0.838, sensitivity: 75.0%, and specificity: 83.8% for mortality in this cohort.
Conclusion: This study identified three distinct SII trajectories, suggesting that post-TBI SII trajectories are heterogeneous patterns associated with mortality. The sustained high-level SII trajectory may serve as a marker of disease deterioration, highlighting the need for targeted interventions. Describing the evolution of SII through GBTM and its correlation with clinical outcomes can enhance our understanding of the link between neuroinflammation and the peripheral immune system.
1 Introduction
TBI is a significant cause of mortality and disability globally (1). According to surveillance conducted by the Centers for Disease Control and Prevention (CDC) in the United States, the annual rates of TBI-related emergency department visits and hospitalizations are 403 per 100,000 people and 85 per 100,000 people, respectively (2). The mortality rate for patients with moderate TBI is estimated to be approximately 10%, whereas for patients with severe TBI, it can be as high as 50% (1, 3, 4). To develop personalized treatment plans and minimize the misuse of medical resources, accurate identification of patients with poor prognosis is essential to guide clinical decision-making (5). In the past few decades, TBI research has made rapid progress in the field of biomarkers. These biomarkers play a key role in elucidating pathophysiological processes by examining concentration changes associated with cell damage. Examples of such biomarkers include neuron specific enolase, S100 calcium binding protein B, neurofilament light, and myelin basic protein (6). Currently, there is a high demand for technology to determine low concentrations of routine TBI biomarkers in body fluids, and not all hospitals have the ability to perform these tests. Therefore, it is still imperative to identify and develop novel biomarkers that are easy to obtain and related to the prognosis of TBI.
TBI can be classified into primary and secondary brain injury (7). Secondary injury mechanisms are pivotal in worsening patients’ conditions, with neuroinflammation being recognized as a primary contributing factor (8). Neuroinflammation after TBI is a complex pathophysiological process that involves both resident and peripheral immune cells. Primary traumatic brain injury initiates damage-associated molecular patterns (DAMPs), promoting the production of cytokines and chemokines, and further accelerating the infiltration of peripheral immune cells (9). Following TBI, disruption of the blood–brain barrier (BBB) at the injury site allows direct exchange between the bloodstream and brain. This exchange facilitates the accumulation of platelets and leukocytes in the injured brain tissue, triggering inflammation and immune responses that lead to secondary brain injury (10). Changes in the blood–brain barrier enable neutrophils to migrate to the injury site within the first hour of brain injury (11). Another study indicated that platelet activation correlates with early pro-inflammatory responses following TBI (11, 12). Patients with TBI often show significantly higher absolute numbers and proportions of circulating neutrophils than healthy individuals, with neutrophil counts doubling within 3–4.5 h post-injury (13). Recent studies have explored the predictive ability of systemic inflammatory biomarkers such as the platelet-to-lymphocyte ratio (PLR) and neutrophil-to-lymphocyte ratio (NLR), among others, for prognosis following TBI. These biomarkers have demonstrated promising predictive capabilities (14, 15). Increasing evidence suggests a strong connection and interaction between the central nervous system and the peripheral immune system (16). So, after traumatic brain injury, systemic inflammatory biomarkers may reflect the severity of neuroinflammation and predict the prognosis of TBI patients. However, the previous biomarkers of inflammation were calculated based on two types of immune cells, but this does not fully indicate the role of inflammation in traumatic brain injury. SII, as a ratio calculated based on platelets, neutrophils, and lymphocytes, includes three different types of peripheral blood inflammatory cells compared to other common inflammatory parameters such as NLR, lymphocyte to monocyte ratio (LMR), and PLR. This parameter can more accurately and comprehensively reflect the balance between inflammation and immune response in patients (17).
Recent research has shown that the SII has superior predictive performance compared to NLR, PLR, and LMR in the context of TBI (18, 19). Vascular dysfunction and BBB breakdown after TBI are at the core of thrombosis and immunopathological mechanism development. Platelets play a crucial role in BBB dysfunction, as their activation and aggregation are necessary steps in the process of microthrombus formation, which is closely related to microvascular occlusion and neuronal death (20). Considering the crucial role of platelet activation and aggregation after TBI, as well as their interaction with neutrophils, the SII index can more accurately and comprehensively evaluate the pathological and physiological status after TBI. So that is why SII was chosen as the main focus, and SII may be superior to other inflammatory markers. In these studies, researchers primarily focused on the relationship between a single time point SII and the outcomes of patients with TBI, overlooking the dynamic assessment of systemic inflammation. There has been less emphasis on evaluating the relationship between neuroinflammation over time and prognosis, as well as the diversity and heterogeneity of secondary injuries (21). The SII at a certain time point may not reflect the pathological and physiological changes after early TBI well. GBTM is a statistical method used to identify clusters of individuals with similar longitudinal patterns of biomarker progression over time (22). By estimating changes in repeated measurements over time, GBTM can identify distinct clusters of individuals exhibiting similar longitudinal change patterns. This modeling approach involves finite mixture models of unobserved subpopulations, with assumptions about trajectory shapes, allowing for the testing of different trajectory groups through maximum likelihood estimation (23).
The trajectory of the SII has not yet been studied in TBI, and dynamic SII trajectories could reflect the pathophysiological changes in disease progression. Exploring SII trajectory patterns can help uncover the heterogeneity of the inflammatory response and dynamic changes of SII during the early stages of TBI, identify individuals at high risk of mortality, and provide new insights into treatment strategies. This study aimed to utilize GBTM to identify SII trajectories in patients with moderate-to-severe TBI and further evaluate the association between SII trajectories and the risk of in-hospital all-cause mortality.
2 Methods
2.1 Data source and ethics compliance
This study utilized a large-scale publicly available database, specifically the eICU-CRD version 2.0 (24). The eICU-CRD is a large multicenter database comprising data covering over 200,000 ICU admissions from 2014 to 2015 in the United States. Patients were admitted to one of 335 units at 208 hospitals located throughout the US. The database is deidentified, and includes vital sign measurements, care plan documentation, severity of illness measures, diagnosis information, laboratory measurements, patient history, treatment information, and more. Access to this database was granted to one (TZY) of the authors upon completion of the collaborative institutional training initiative exam (Certification ID: 50723731), who was responsible for data extraction. This was an observational study. Data were extracted from the eICU-CRD version 2.0. Ethical approval and informed consent were waived because all information was anonymized and the re-identification risk was certified as meeting safe harbor standards by an independent privacy expert (Privacert, Cambridge, MA; Health Insurance Portability and Accountability Act Certification No. 1031219–2).
2.2 Population selection criteria
The inclusion criteria were patients with TBI as their primary or major diagnosis. For patients with multiple admissions, data from their initial hospitalization were used. Patients with a Glasgow Coma Scale (GCS) score > 12, aged <16 or > 89 years, diagnosed with infectious diseases or hematologic malignancies, undergoing chemotherapy, using medications severely affecting blood cell counts, or those with missing survival data were excluded. Additionally, patients with less than 3 days of SII data were excluded from the GBTM analysis.
2.3 Clinical data collection
We used PostgreSQL software (version 15) and Navicate Premium software (version 15.0.29) with structured query language (SQL) to extract data from the eICU-CRD for the years 2014 to 2015. All the codes for computing demographic features, laboratory tests, comorbidities, and severity scores were obtained from the GitHub website.1 This study gathered demographic and clinical data as well as comorbidities, and then calculated the Charlson Comorbidity Index (CCI). Demographic information included age, sex, race, and body mass index (BMI). The study also recorded specific injury types (such as skull fractures, epidural hematoma, subarachnoid hemorrhage, subdural hematoma, contusion or laceration, and intracerebral hemorrhage) alongside multiple scoring systems [including GCS, Sequential Organ Failure Assessment (SOFA), and Acute Physiology Score III (APS III)]. Data also encompassed medication treatments, laboratory indicators, vital signs, length of hospital stay, neurosurgical interventions, and outcome indicators (hospital mortality). Based on previous studies (25, 26), some variables were repeatedly measured within the initial 24 h of admission, and the value that best reflected the severity of the disease was used. The primary outcome of this study was all-cause hospital mortality, with the exposure factor being the longitudinal trajectory of SII. Variables with a missing proportion exceeding 10% were excluded from our analysis. Missing values are processed using Multiple Imputation by Chained Equations (MICE) algorithm (Supplementary Table S1). Complete blood counts for the initial 7 days post-admission were included in our analysis. SII = platelet × neutrophil/lymphocyte.
2.4 Statistical analysis
Continuous variables were presented as either medians with interquartile ranges (IQR) or means with standard deviations (SD), while categorical variables were described as counts and percentages. The normality of variables was assessed using the Shapiro–Wilk test. For comparisons involving categorical variables, either the chi-square test or Fisher’s exact test was employed. At the same time, analysis of variance was utilized for continuous variables following a normal distribution to compare different SII trajectory patterns. The Kruskal–Wallis test was used for continuous variables with non-normal distributions to compare the different trajectory patterns.
GBTM is a semi-parametric finite mixture model capable of identifying groups of individuals with similar biomarker progression (22). This method assumes that the population consists of a finite number of distinct groups defined by their biomarker trajectories. PROC TRAJ is a SAS program suitable for GBTM (27). It provides the ability to model three different data distributions for the variable of interest: (1) counts; (2) continuous data; and (3) dichotomous data. Since SII is a continuous variable and biomarkers typically exhibit skewed distributions, we log-transformed SII. We then used GBTM with a censored normal distribution (CNORM) to identify subgroups of participants with different SII trajectories within the first 7 days post-trauma. One key decision when identifying trajectory groups in a population is determining the optimal number of groups to best fit the data. One must also decide on the highest polynomial order that best describes the trajectory of the biomarker over time for each group. The polynomial order relates to the shape of the trajectory. Models with different numbers of groups and shapes must be compared to identify the model that best fits the biomarker data. Several model fit indices can help determine the best model, but one commonly used measure is the Bayesian Information Criterion (BIC). When comparing two possible trajectory models (e.g., with different numbers of groups and/or trajectory shapes [polynomial orders]), the model with the higher BIC value is selected. If two models fit the data similarly, but one is more complex (i.e., has more groups or higher-order polynomials) than the other, the simpler model should be chosen (28). Akaike Information Criterion (AIC) and log-likelihood (LL) also assist in selecting the optimal model, and like BIC, the model with the highest AIC and LL values is preferred. Average posterior probability (AvePP): If individuals are unambiguously assigned to different groups, the AvePP for each group would be 1. Therefore, the closer the AvePP is to 1, the better the model fit. It is generally recommended that the AvePP for all groups be greater than 0.7. Odds of Correct Classification (OCC): For a model that fits the data well, the OCC values should be significantly greater than 1. It is generally recommended that the OCC for all groups be 5 or higher (29). We employed the standard approach provided by the BIC to determine the optimal number of trajectory groups. We iteratively refined the model by eliminating non-significant polynomial terms, reducing polynomial levels to achieve a simplified final model, where the significance level for each trajectory group was set at α ≤ 0.05 (23, 30). Models ranging from two to six trajectory groups were fitted using linear, quadratic, and cubic polynomial terms. Typically, we started with a model consisting of two groups with cubic polynomials, then progressively eliminated non-significant polynomial terms, reducing the polynomial order until the highest-order polynomial for each group was significant at a confidence level of α ≤ 0.05. We then increased the number of groups and repeated this process for models with three to six groups. The selection of the best trajectory was based on various parameters, including the AvePP, Occ, BIC, AIC, and LL. We selected models with higher BIC, AIC, and LL values and AvePP ≥0.7, Occ >5, while also favoring simpler models (31, 32) (Supplementary Figure S1, Table S2).
After identifying the optimal SII trajectory groups, we used logistic regression models to examine the association between SII trajectory and all-cause hospital mortality. Initially, a crude logistic regression model was established with the first group as the reference. Subsequently, we constructed a multivariable logistic regression model. In the process of constructing a multivariable logistic regression model, we first performed univariable logistic regression analysis on variables including demographics, Charlson Comorbidity Index, injury type, medication, laboratory indicators, vital signs, length of hospital stay, neurosurgical interventions, and scoring systems. Variables with a significance level of p < 0.05 from the univariable analysis were then included in the multivariable logistic regression model. To reduce model complexity, avoid overfitting, and ensure that only variables with a significant effect on the outcome variable were included in the model, stepwise regression was used to further select variables. This helped identify the optimal model and ensure minimal multicollinearity. Variables with p < 0.05 in the stepwise regression were incorporated into the final multivariable logistic regression model for adjustment of confounding factors. Additionally, other commonly recognized risk factors, such as age, GCS, and surgical treatment, were also included in the final multivariable logistic regression model. If variance inflation factor (VIF) ≥ 10, it is considered that there is collinearity between variables. In this analysis, all VIF values were below 10, suggesting that no significant multicollinearity was detected. Consequently, no variables were excluded from the model. ROC curve analysis was conducted based on multivariable logistic regression model. Sensitivity analysis was performed based on the severity of traumatic brain injury, excluding patients with moderate TBI and reconstructing the sensitivity analysis cohort. An additional GBTM model was developed to explore the association between subgroups in this model and all-cause hospital mortality.
Two-sided p-value <0.05 was considered statistical significance. We did all analyses with SAS version 9.4 software and R version 4.2.2 software.
3 Results
3.1 Study cohort
Initially, a total of 200,859 ICU admission records were retrieved from the eICU-CRD database. After applying exclusion criteria, 312 patients were included in the study cohort, with a total of 1,757 SII measurements conducted within 7 days post-trauma (Figure 1). Among them, 52 cases (16.7%) died during hospitalization. The median age of the patients was 54 years (IQR 32.80–70.00), with males comprising 66.7% of the cohort. The median Min GCS score was 6 (IQR 3.00–8.00), and the primary TBI type was subdural hematoma (40.01%). Compared to survivors, non-survivors had higher Max creatinine and Max glucose levels [1.09 mg/dL (IQR 0.84, 1.43) vs. 0.90 mg/dL (IQR 0.77, 1.10); 188 mmol/L (IQR 157, 244) vs. 156 mmol/L (IQR 133, 195)], elevated Max white blood cell count (WBC) [17.80 (IQR 11.8, 23.8) vs. 15.00 (IQR 10.6, 18.2)], lower Min systolic blood pressure (SBP) and Min diastolic blood pressure (DBP) [(86.2 mmHg, SD ± 23.6) vs. (99.7 mmHg, SD ± 20.8); (45.6 mmHg, SD ± 15.5) vs. (51.5 mmHg, SD ± 12.6)], and reduced Min GCS (3.00 [IQR 3.00, 6.00] vs. 6.00 [IQR 3.00, 8.00]). Additionally, a higher proportion of non-survivors received mannitol (23.1% vs. 6.15%) and underwent ventriculostomy (23.1% vs. 10.4%; Supplementary Table S3).
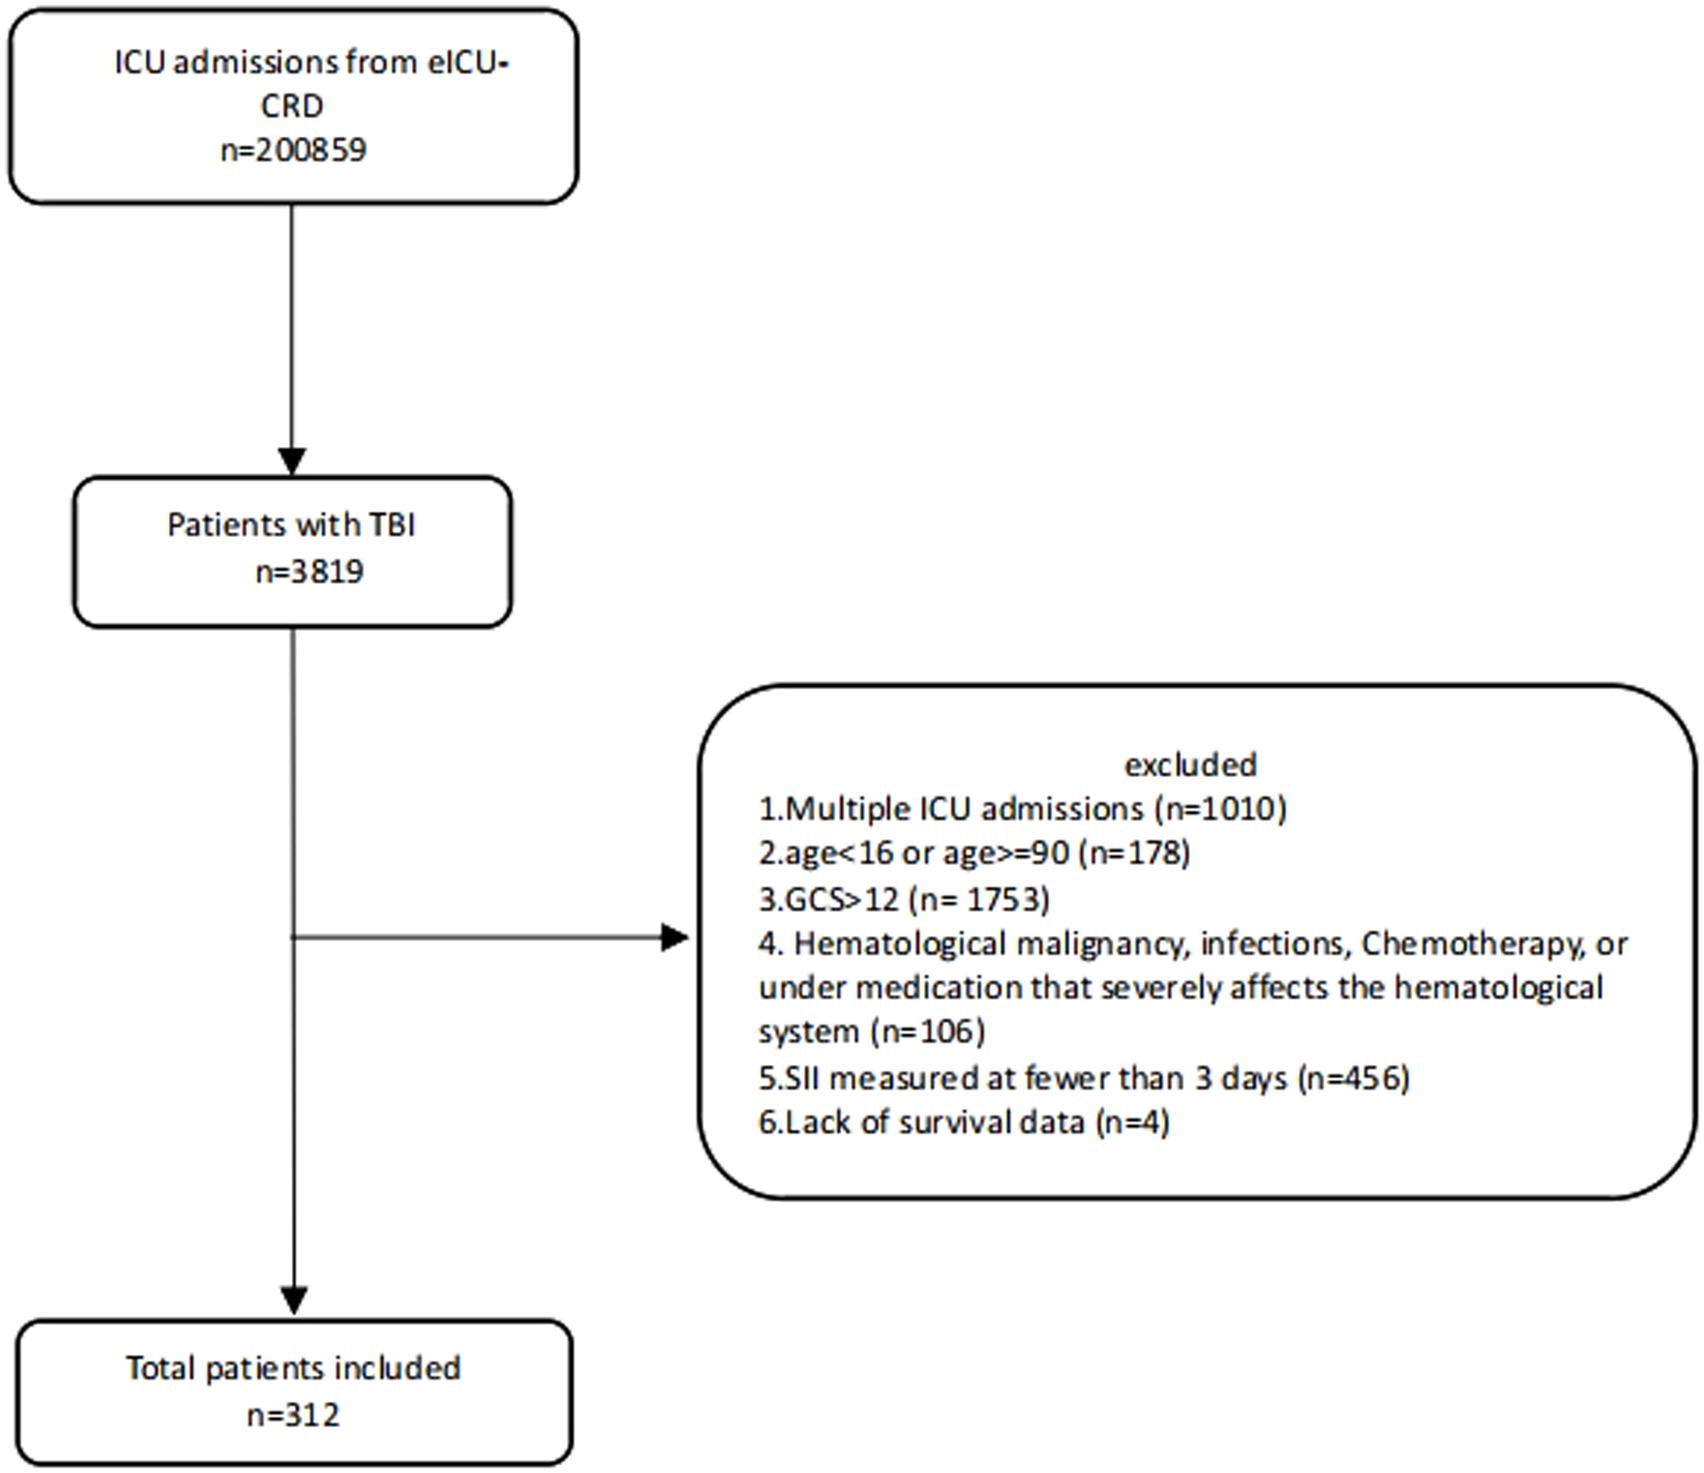
Figure 1. Flowchart of eligible participants.
3.2 Characterization of SII trajectories
Our model identified three distinct longitudinal trajectories of daily maximum SII (Figure 2). The AvePP for each group exceeded 0.85, and the proportion of the population was greater than 5%. These three trajectory groups reflected different patterns of daily maximum SII values post-trauma. Group 1 (n = 59, 18.90%) represents the low-level rapid decline group, initially characterized by the low level, sharply decreasing to its minimum around the 4th day, followed by a slight rebound. Group 2 (n = 188, 60.20%) represented the moderate-level slow decline group, being the largest cohort, exhibiting an initial gradual decline, followed by a rebound, and ultimately stabilizing. Group 3 (n = 65, 20.80%) represents the sustained high-level group, displaying the highest Log SII values and maintaining consistently elevated levels without a clear declining pattern.

Figure 2. SII trajectories within the first 7 days post-admission following trauma. Trajectories were defined using group-based trajectory modeling. Day 0 was defined as the day of admission. Group 1: “Low-Level Rapid Decline” (18.90%) exhibited the lowest mortality rate. Group 2: “Moderate-Level Slow Decline” (60.20%) demonstrated a moderate risk of mortality. Group 3: “Sustained High-Level” (20.80%) was associated with the highest mortality rate.
3.3 Clinical characteristics
Table 1 presents the differences in demographic and clinical characteristics among different SII trajectory groups. Group 2 has the highest proportion of males (70.70%), which is higher than in the other two groups. There were no differences in age, race, and BMI among the three groups, and the maximum WBC and platelet counts were higher in Group 2 and Group 3 than in Group 1 (Max WBC: 15.40 [IQR 10.70, 19.00] and 15.40 [IQR 11.50, 20.60]; Max platelets: 226.00 [IQR 176.00, 282.00] and 260.00 [IQR 241.00, 320.00] for Groups 2 and 3, respectively). There were differences in the types of TBI among the three trajectory groups, with subdural hematoma being predominant in Group 3 (50.80%). Additionally, the proportion of patients undergoing surgical treatment and receiving mannitol was highest in Group 3 (24.60 and 13.80%, respectively), but these differences were not statistically significant. Differences were observed in the maximum, minimum, and mean values of SII among the three groups, with Group 3 exhibiting higher than the other two groups.
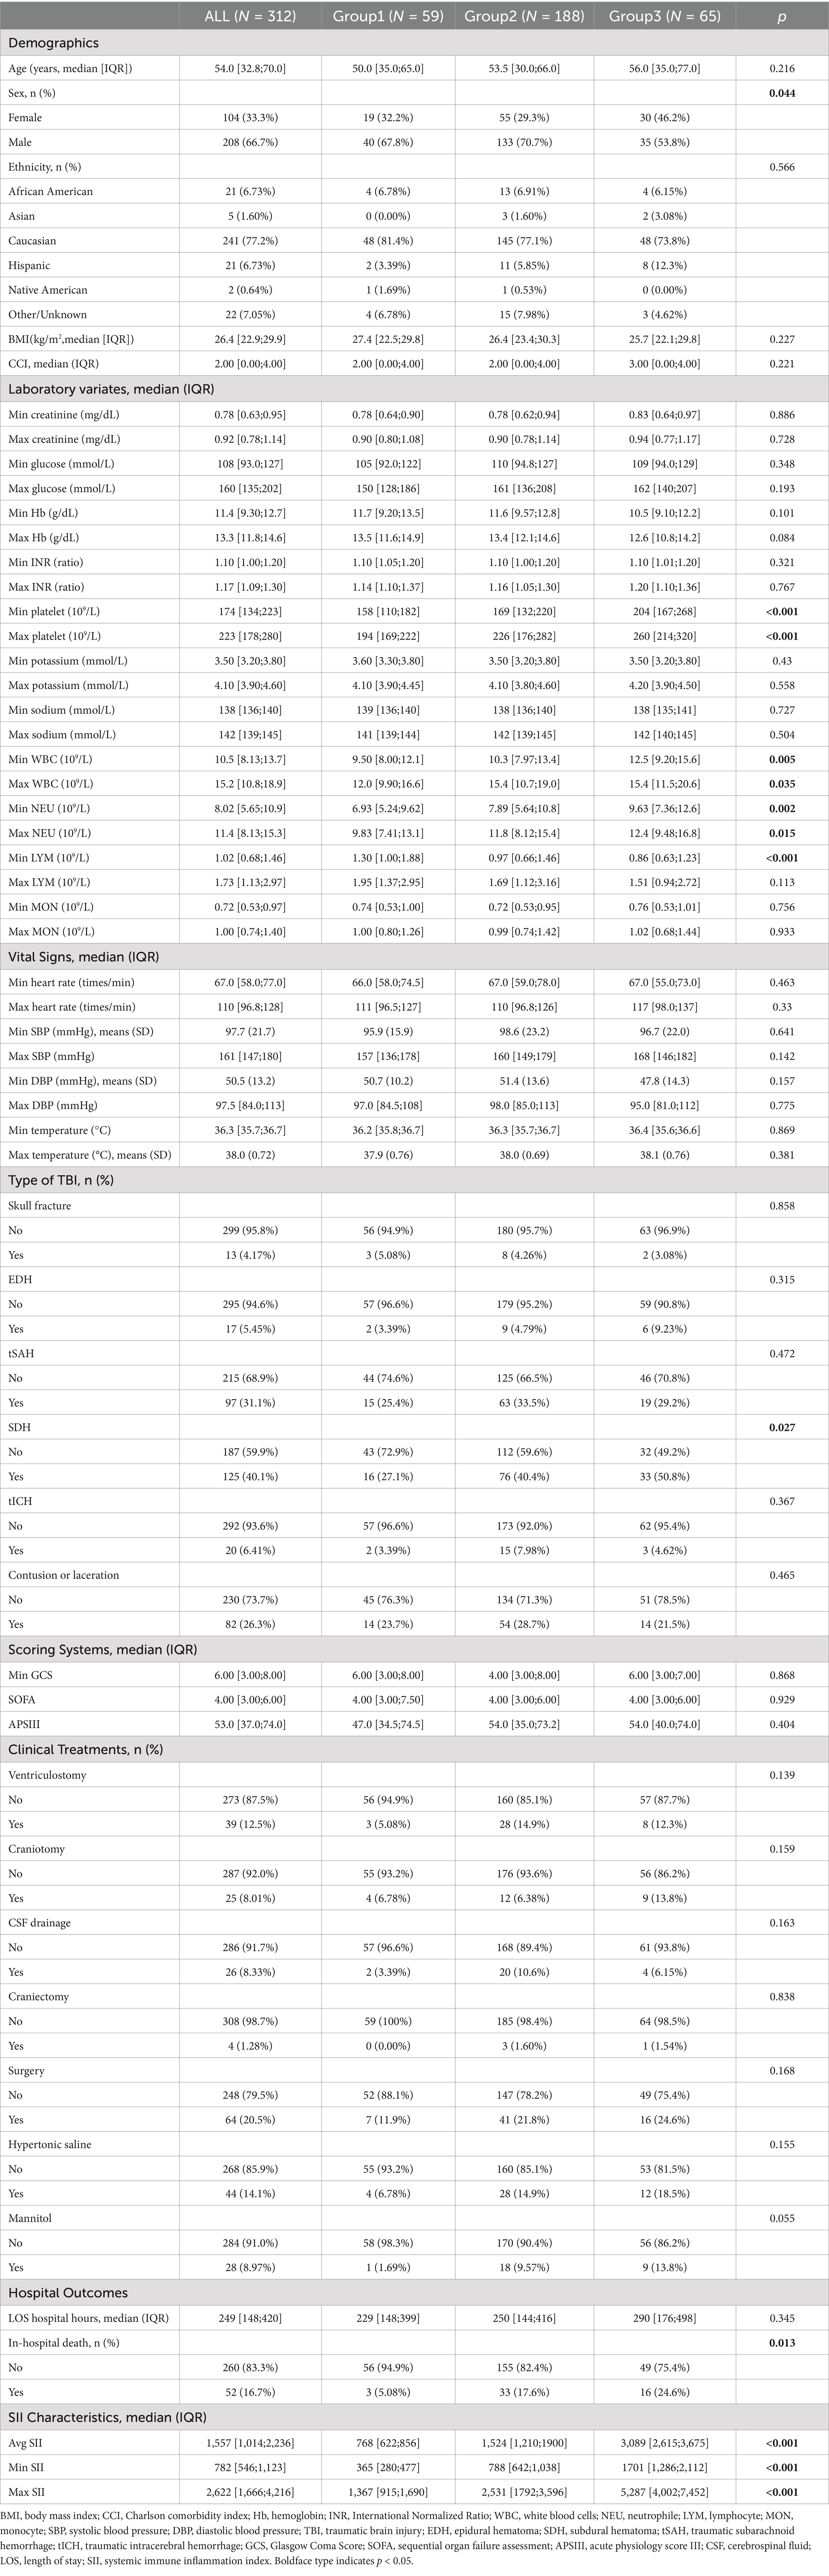
Table 1. Characteristics among trajectory groups.
3.4 Association of SII trajectories and all-cause hospital mortality
There was a significant difference in all-cause hospital mortality rates among the different trajectory groups (p = 0.013), with Group 3 showing a higher mortality rate than the other two groups. The mortality rates for Groups 1, 2, and 3 were 5.08, 17.55, and 24.62%, respectively. In the unadjusted model, compared to Group 1, belonging to Groups 2 and 3 was associated with increased mortality (OR 3.97, 95% CI 1.36–16.97; OR 6.01, 95% CI 1.89–27.33). After adjusting for potential confounders (APSIII, Max creatinine, Min SBP, Mannitol, Age, Min GCS, Surgery), the multivariable logistic regression model yielded similar results, showing an increased risk of mortality in Groups 2 and 3 (OR 4.09, 95% CI 1.21–19.75; OR 5.84, 95% CI 1.52–30.67; Table 2). Subsequently, we calculated the model’s AUC to be 0.838, sensitivity: 75.0%, and specificity: 83.8% (Figure 3).
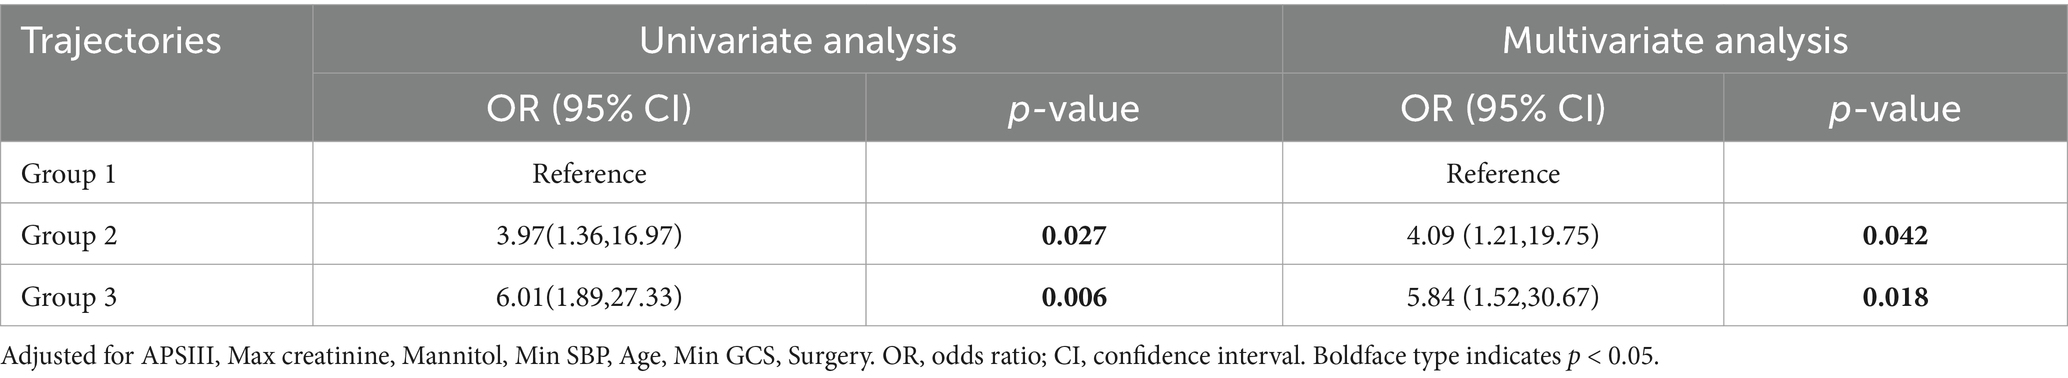
Table 2. Association between SII trajectories and all-cause hospital mortality.
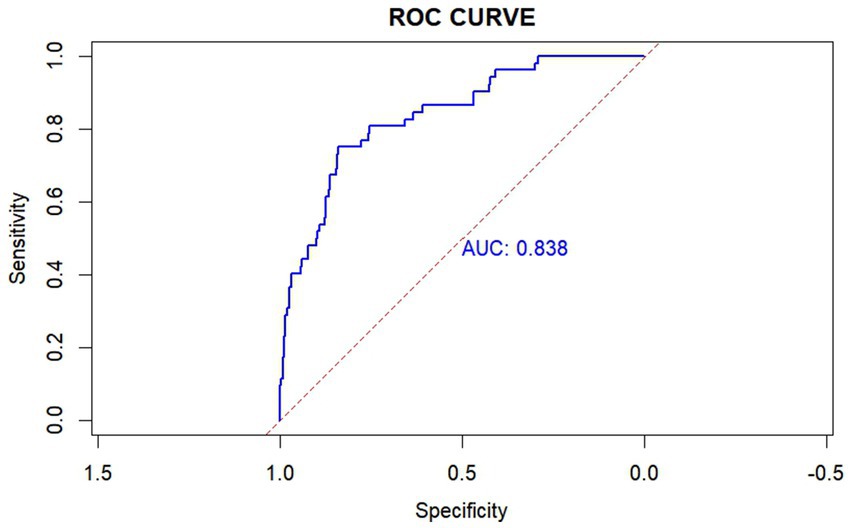
Figure 3. Receiver operating characteristic (ROC) curve of the SII trajectory model. This ROC curve achieved an area under the curve (AUC) of 0.838, with a sensitivity of 75.0% and a specificity of 83.8%. The SII trajectory model was adjusted using APSIII, Max creatinine, Min SBP, Mannitol, Age, Min GCS, Surgery. AUC: the area under the receiver-operating-characteristics curve.
3.5 Sensitivity analysis
After excluding patients with moderate TBI, we remodeled and identified a Log SII trajectory plot that closely mirrored the number and evolution patterns of the original cohort. We conducted a rough comparison of the three Log SII trajectory groups and used a logistic regression model to explore the relationship between these trajectory groups and all-cause hospital mortality. The results were consistent with those of the original cohort. Using Group 1 as a reference, the risk of death increased in Group 3 (OR 3.10, 95% CI 0.56, 29.33). Refer to the Supplementary Materials (Supplementary Figure S2, Table S4) for further details.
4 Discussion
Post-traumatic brain injury secondary damage has long been a focal point, particularly with neuroinflammation playing a pivotal role. In this study, we employed GBTM to examine dynamic SII patterns following TBI. We identified three distinct trajectory groups based on daily maximum SII levels. Compared to the “low-level rapid decline” and “moderate-level slow decline” groups, the group exhibiting a “sustained high-level” trajectory pattern showed a significantly increased risk of in-hospital mortality. This relationship was confirmed in a multivariable logistic regression model.
Neuroinflammation in the secondary injury following TBI is recognized as one of the important factors influencing disease progression, becoming a major focus of research in recent years (16). In response to brain injury, inflammatory cells from both the central nervous system and periphery rapidly react and may aid in the healing process (33). This inflammatory response is triggered by damaged neuronal tissue, leading to the production of pro-inflammatory cytokines and angiogenic factors (34). Increased levels of cytokines and chemokines, such as tumor necrosis factor (TNF), interleukin (IL)-1β, and IL-6, may serve as signals of the inflammatory response. Their release and production leads to local immune reactions in the brain tissue and systemic immune responses. These cytokines and chemokines result in the recruitment of neutrophils, activation of monocytes, and polarization of microglia and astrocytes (13). In this process, the production of proteases, metalloproteinases, TNF, and reactive oxygen species (ROS) further breaks the BBB, allowing neutrophils to enter the central nervous system (35). Platelets play a critical role in blood–brain barrier dysfunction through their activation and aggregation, which are essential for microthrombus formation associated with microvascular occlusion and neuronal death. Platelets and leukocytes can form microvascular thrombi around the injury site and adjacent brain tissue by forming activated vascular hemophilia factor polymers (36). Therefore, the infiltration of inflammatory cells following TBI plays an indispensable role in traumatic brain injury.
Previous studies have highlighted numerous biomarkers for TBI diagnosis and prognosis, including protein biomarkers for astroglial cell injury (GFAP, S100B), neuronal cell body injury (UCH-L1, NSE), markers of post-injury neurodegeneration (total Tau and phosphorylated Tau), neuronal cell death (alpha-II spectrin breakdown products), axonal injury (NF protein), white matter injury (MBP), and markers of post-injury autoimmune response (brain-targeted autoantibodies). However, these biomarkers may not be universally accessible across all hospitals (37). Therefore, researchers have been striving to identify simple, readily available, and relatively reliable biomarkers. The SII may be associated with adverse outcomes in neurological diseases, such as the severity of pneumonia in patients with intracerebral hemorrhage, the prognosis of patients with acute ischemic stroke, and delayed cerebral vasospasm following aneurysmal subarachnoid hemorrhage (38–40). Studies focusing on patients with TBI have also shown that elevated SII levels upon admission are correlated with poor outcomes. Notably, SII demonstrates superior predictive performance compared to other ratios like PLR, NLR, and LMR (18, 19).
In this study, we focused on patients with a GCS score of ≤12 upon admission, aiming to explore the relationship between inflammatory biomarker trajectories and mortality of patients with moderate-to-severe TBI. Compared to the static assessments of the SII, our research underscores the importance of SII trajectory patterns in patients with TBI. Previous studies have demonstrated that elevated SII levels correlate with poor outcomes upon admission in patients with TBI (18, 19). However, these studies solely examined the association between SII at a single time point and prognosis. Single-time-point assessments of SII may introduce bias owing to varying disease time frames and offer limited insights into disease progression post-TBI. A one-time SII measurement may not fully capture the comprehensive pattern of inflammatory changes during hospitalization. Clinical treatment options for patients with TBI are often limited, as the lack of treatment options stems from the diversity of injury types and an incomplete understanding of secondary brain injury mechanisms (1, 41, 42). Hence, there is an urgent need for methods to explore inflammatory changes following TBI. This exploration can aid in comprehending the pathophysiological mechanisms of inflammation-related secondary injuries and identifying patient heterogeneity post-TBI. By gaining insights into inflammation progression after TBI, clinicians can better comprehend patient conditions, tailor clinical interventions more precisely to individual patients, enhance patient outcomes, and provide a research roadmap for pathophysiological investigation.
Through clinical characteristics and dynamic changes in SII trajectories, we can gain insights into the complex mechanisms of neuroinflammation progression in patients with TBI. For example, patients in Group 3, as opposed to those in Groups 1 and 2, demonstrated higher SII measurements during the first 7 days after admission, with no downward trend. This subgroup exhibited the highest mortality rates, a higher APSIII, and a greater incidence of subdural hematoma, along with increased rates of surgical treatment and mannitol usage. Traumatic acute subdural hematoma (ASDH) is the most severe subtype of TBI due to its high rates of disability and mortality. The lethality of traumatic ASDH primarily arises from its frequent association with primary and/or secondary brain injuries, including contusions, lacerations, edema, or swelling (43). Following traumatic brain injury, the release of molecular patterns associated with primary and secondary injuries triggers an immune response, leading to BBB disruption and vasogenic edema following TBI. These reactions can cause further increases in intracranial pressure (ICP) (44). In our study, Group 3, which exhibited sustained high SII levels, was associated with higher rates of mannitol use, a greater proportion of subdural hematomas, and higher surgical intervention rates. These patients likely had more severe conditions, exhibiting a stronger inflammatory response and cerebral edema, suggesting that they were more prone to severe complications such as increased ICP. The differences in mannitol usage, proportion of subdural hematomas, and surgical interventions indicate that SII trajectories may reflect the severity of the patient’s condition, as well as the need for ICP management and surgical treatment. This aligns with our conclusion that patients with sustained high SII levels had the highest all-cause in-hospital mortality. These patients may require more aggressive treatment and ICP monitoring to control cerebral edema and intracranial pressure. The APS III score measures the severity of a patient’s acute physiological state, with higher scores reflecting worsening clinical conditions (45). In Groups 2 and 3, APS III scores were higher than in Group 1, and SII levels remained elevated in Group 3. The differences in APS III scores suggest that patients with different SII trajectories not only differ in their inflammatory responses but also show significant variations in the severity of their acute physiological conditions. Patients with sustained high SII levels and higher APS III scores are likely to face a higher risk of in-hospital mortality, highlighting the need for closer monitoring and more aggressive interventions in clinical practice. Patients in Group 1 exhibited a rapid decline in SII after injury and consistently maintained low SII levels. This cohort had the lowest mortality rate, indicating that patients in this category may experience minimal secondary neuroinflammation-related damage post-injury, and their inflammation may resolve more rapidly.
The pathophysiological mechanisms of TBI are heterogeneous and dynamic (21). Neuroinflammation is an important and modifiable cause of secondary injury after TBI, driven by both central and peripheral immune responses (46). After TBI, the body initiates a systemic immune response, leading to significant changes in various immune cells and inflammatory markers (47). There is a strong connection and interaction between the central nervous system and the peripheral immune system (16). Therefore, changes in SII may be driven by the complex interactions between the central nervous system (CNS) and the peripheral immune system. Elevated SII after TBI may indicate an exacerbation of neuroinflammation and systemic inflammatory responses, leading to poor outcomes. The impact of TBI is not limited to the brain; it can cause multi-organ damage and trigger a systemic immune response, including the production of cytokines and chemokines (48). Current potential therapies targeting peripheral immune responses to CNS injury include anti-HMGB1 monoclonal antibodies, which reduce blood–brain barrier disruption, decrease cerebral edema, and limit inflammatory cascades; metformin, which exhibits anti-inflammatory effects by reducing neutrophilia and normalizing the neutrophil-to-lymphocyte ratio; and dexamethasone/hydrocortisone, which reduce the intensity of immune responses through various cells (16). Therefore, aggressive targeted anti-inflammatory treatment, intracranial pressure management, and timely adjustment of surgical strategies are expected to alter SII trajectories, allowing for a rapid decrease in SII levels. In this study, the model demonstrated an AUC of 0.838, indicating good discriminative ability in predicting mortality in patients with moderate to severe TBI. Compared to two recent models using admission SII levels to predict the prognosis of moderate to severe TBI patients (18, 49), our model’s AUC is higher, highlighting the model’s advantages in prognostic prediction and the importance of dynamic SII monitoring. The model’s sensitivity was 75.0%, meaning that in clinical practice, most patients at risk of death could be identified, facilitating early intervention. The specificity was 83.8%, indicating that the model could effectively exclude non-critical cases, reducing unnecessary treatment burdens. Compared to models in the existing literature (75.0%, 83.8% vs. 64.1%, 92.1% and 48.3%, 84.2%), these metrics are at relatively high levels, demonstrating the potential of this model for application in TBI patients. This model will help clinicians identify high-risk patients early after admission and predict the prognosis of patients with TBI. Such identification could prompt surgeons to expedite necessary interventions, implement stratified management, and provide personalized treatments, such as aggressive pharmacological interventions, targeted anti-inflammatory treatment, intracranial pressure management and timely adjustments in surgical strategies. By combining the model’s predictions with other clinical assessment methods, treatment decisions can be further optimized, ultimately improving patient outcomes.
This study has some limitations that are common in large-scale public database studies. First, data missingness and outliers are common owing to routine clinical electronic records, resulting in inconsistent data density when collecting clinical records of SII. Second, variables were extracted using ICD-9 and ICD-10 diagnostic codes, inevitably leading to coding errors or misclassification biases. Third, the sample size limited significant statistical comparisons of mortality rates among groups in sensitivity analyses. Finally, the database did not include neuroimaging data, therefore, this study was unable to extract neuroimaging data for analysis. Although these limitations may somewhat affect the generalizability of the results, we have taken various measures to minimize their impact. For example, we used multiple imputation methods to handle missing data, applied strict inclusion and exclusion criteria as well as sensitivity analyses to enhance the validity and generalizability of the findings, and adjusted for potential confounding factors in the multivariable regression models to reduce bias. Therefore, despite its limitations, the results of this study still hold significant clinical relevance and generalizability to some extent. However, to further validate our conclusions, future research could conduct larger-scale prospective cohort studies, incorporating more comprehensive clinical and imaging data to enhance the validity and generalizability of the findings.
5 Conclusion
In summary, this study employed GBTM to identify three dynamic SII trajectories after TBI, offering fresh insights into the interactions between peripheral immune system and secondary brain injury following trauma. Patients in the “sustained high-level” group exhibited the highest risk of all-cause hospital mortality. Early monitoring of the dynamic changes of SII helps identify subtypes with high mortality risk and enhances treatment strategies. SII trajectory modeling contributes to our understanding of the pathology of post-traumatic neuroinflammation and enables more targeted treatment approaches.
Data availability statement
Publicly available datasets were analyzed in this study. This data can be found at: eICU Collaborative Research Database v2.0 https://physionet.org/content/eicu-crd/2.0/.
Ethics statement
The study is exempt from institutional review board approval because all the information was anonymized and the re-identification risk was certified as meeting safe harbor standards by an independent privacy expert (Privacert, Cambridge, MA) (Health Insurance Portability and Accountability Act Certification No. 1031219-2).
Author contributions
ZT: Data curation, Formal analysis, Methodology, Project administration, Writing – original draft. CL: Data curation, Methodology, Writing – original draft, Writing – review & editing. ZZ: Data curation, Formal analysis, Writing – original draft. ZX: Data curation, Writing – original draft. ML: Writing – review & editing. HX: Writing – review & editing.
Funding
The author(s) declare that no financial support was received for the research, authorship, and/or publication of this article.
Acknowledgments
We would like to thank Editage (www.editage.cn) for English language editing and Philips Healthcare and collaborators at MIT Laboratory for Computational Physiology for providing the eICU Collaborative Research Database.
Conflict of interest
The authors declare that the research was conducted in the absence of any commercial or financial relationships that could be construed as a potential conflict of interest.
Publisher’s note
All claims expressed in this article are solely those of the authors and do not necessarily represent those of their affiliated organizations, or those of the publisher, the editors and the reviewers. Any product that may be evaluated in this article, or claim that may be made by its manufacturer, is not guaranteed or endorsed by the publisher.
Supplementary material
The Supplementary material for this article can be found online at: https://www.frontiersin.org/articles/10.3389/fneur.2024.1439318/full#supplementary-material
Footnotes
References
1. Roozenbeek, B, Maas, AIR, and Menon, DK. Changing patterns in the epidemiology of traumatic brain injury. Nat Rev Neurol. (2013) 9:231–6. doi: 10.1038/nrneurol.2013.22
2. Faul, M, Xu, L, Wald, MM, and Coronado, VG. Traumatic brain injury in the United States: Emergency department visits, hospitalizations and deaths 2002–2006. Atlanta (GA): Centers for Disease Control and Prevention, National Center for Injury Prevention and Control (2010).
3. Salehpour, F, Bazzazi, AM, Aghazadeh, J, Hasanloei, AV, Pasban, K, Mirzaei, F, et al. What do you expect from patients with severe head trauma? Asian J Neurosurg. (2018) 13:660–3. doi: 10.4103/ajns.AJNS_260_16
4. Salehpour, F, Bazzazi, AM, Aghazadeh, J, Abbasivash, R, Forouhideh, Y, Mirzaei, F, et al. Can serum glucose level in early admission predict outcome in patients with severe head trauma? World Neurosurg. (2016) 87:132–5. doi: 10.1016/j.wneu.2015.11.048
5. Stevens, RD, and Sutter, R. Prognosis in severe brain injury. Crit Care Med. (2013) 41:1104–23. doi: 10.1097/CCM.0b013e318287ee79
6. Ghaith, HS, Nawar, AA, and Gabra, MD. A literature review of traumatic brain injury biomarkers. Mol Neurobiol. (2022) 59:4141–4158. doi: 10.1007/s12035-022-02822-6
7. Corps, KN, Roth, TL, and McGavern, DB. Inflammation and neuroprotection in traumatic brain injury. JAMA Neurol. (2015) 72:355–62. doi: 10.1001/jamaneurol.2014.3558
8. Lassarén, P, Lindblad, C, Frostell, A, Carpenter, KLH, Guilfoyle, MR, Hutchinson, PJA, et al. Systemic inflammation alters the neuroinflammatory response: a prospective clinical trial in traumatic brain injury. J Neuroinflammation. (2021) 18:221. doi: 10.1186/s12974-021-02264-2
9. Russo, MV, and McGavern, DB. Inflammatory neuroprotection following traumatic brain injury. Science. (2016) 353:783–5. doi: 10.1126/science.aaf6260
10. Hubbard, WB, Dong, J-F, Cruz, MA, and Rumbaut, RE. Links between thrombosis and inflammation in traumatic brain injury. Thromb Res. (2021) 198:62–71. doi: 10.1016/j.thromres.2020.10.041
11. Roth, TL, Nayak, D, Atanasijevic, T, Koretsky, AP, Latour, LL, and McGavern, DB. Transcranial amelioration of inflammation and cell death after brain injury. Nature. (2014) 505:223–8. doi: 10.1038/nature12808
12. Martin, GE, Xia, B, Kim, Y, Johnson, MD, Veile, R, Friend, LA, et al. Platelet function changes in a time-dependent manner following traumatic brain injury in a murine model. Shock. (2018) 50:551–6. doi: 10.1097/SHK.0000000000001056
13. Alam, A, Thelin, EP, Tajsic, T, Khan, DZ, Khellaf, A, Patani, R, et al. Cellular infiltration in traumatic brain injury. J Neuroinflammation. (2020) 17:328. doi: 10.1186/s12974-020-02005-x
14. Ge, X, Zhu, L, Li, M, Li, W, Chen, F, Li, Y, et al. A novel blood inflammatory Indicator for predicting deterioration risk of mild traumatic brain injury. Front Aging Neurosci. (2022) 14:878484. doi: 10.3389/fnagi.2022.878484
15. Li, W, and Deng, W. Platelet-to-lymphocyte ratio predicts short-term mortality in patients with moderate to severe traumatic brain injury. Sci Rep. (2022) 12:13976. doi: 10.1038/s41598-022-18242-4
16. Duan, M, Xu, Y, Li, Y, Feng, H, and Chen, Y. Targeting brain-peripheral immune responses for secondary brain injury after ischemic and hemorrhagic stroke. J Neuroinflammation. (2024) 21:102. doi: 10.1186/s12974-024-03101-y
17. Hu, B, Yang, X-R, Xu, Y, Sun, Y-F, Sun, C, Guo, W, et al. Systemic immune-inflammation index predicts prognosis of patients after curative resection for hepatocellular carcinoma. Clin Cancer Res. (2014) 20:6212–22. doi: 10.1158/1078-0432.CCR-14-0442
18. Chen, L, Xia, S, Zuo, Y, Lin, Y, Qiu, X, Chen, Q, et al. Systemic immune inflammation index and peripheral blood carbon dioxide concentration at admission predict poor prognosis in patients with severe traumatic brain injury. Front Immunol. (2022) 13:1034916. doi: 10.3389/fimmu.2022.1034916
19. Xu, H, Wu, W, Zhu, Q, Wang, J, Ding, P, Zhuang, Z, et al. Systemic immune-inflammation index predicts the prognosis of traumatic brain injury. World Neurosurg. (2024) 183:e22–7. doi: 10.1016/j.wneu.2023.10.081
20. Sulhan, S, Lyon, KA, and Shapiro, LA. Neuroinflammation and blood-brain barrier disruption following traumatic brain injury: pathophysiology and potential therapeutic targets. J Neurosci Res. (2020) 98:19–28. doi: 10.1002/jnr.24331
21. Sabouri, E, Majdi, A, Jangjui, P, Rahigh Aghsan, S, and Naseri Alavi, SA. Neutrophil-to-lymphocyte ratio and traumatic brain injury: A review study. World Neurosurg. (2020) 140:142–7. doi: 10.1016/j.wneu.2020.04.185
22. Nagin, DS, and Odgers, CL. Group-based trajectory modeling in clinical research. Annu Rev Clin Psychol. (2010) 6:109–38. doi: 10.1146/annurev.clinpsy.121208.131413
24. Pollard, TJ, Johnson, AEW, Raffa, JD, Celi, LA, Mark, RG, and Badawi, O. The eICU collaborative research database, a freely available multi-center database for critical care research. Sci Data. (2018) 5:180178. doi: 10.1038/sdata.2018.178
25. Cai, W, Xu, J, Wu, X, Chen, Z, Zeng, L, Song, X, et al. Association between triglyceride-glucose index and all-cause mortality in critically ill patients with ischemic stroke: analysis of the MIMIC-IV database. Cardiovasc Diabetol. (2023) 22:138. doi: 10.1186/s12933-023-01864-x
26. Zhao, G-J, Xu, C, Ying, J-C, Lü, W-B, Hong, G-L, Li, M-F, et al. Association between furosemide administration and outcomes in critically ill patients with acute kidney injury. Crit Care. (2020) 24:75. doi: 10.1186/s13054-020-2798-6
27. Jones, BL, Nagin, DS, and Roeder, K. A SAS procedure based on mixture models for estimating developmental trajectories. Sociol Methods Res. (2001) 29:374–93. doi: 10.1177/0049124101029003005
28. Kass, RE, and Raftery, AE. Bayes factors. J Am Stat Assoc. (1995) 90:773–95. doi: 10.1080/01621459.1995.10476572
29. Niyonkuru, C, Wagner, AK, Ozawa, H, Amin, K, Goyal, A, and Fabio, A. Group-based trajectory analysis applications for prognostic biomarker model development in severe TBI: a practical example. J Neurotrauma. (2013) 30:938–45. doi: 10.1089/neu.2012.2578
30. Jha, RM, Elmer, J, Zusman, BE, Desai, S, Puccio, AM, Okonkwo, DO, et al. Intracranial pressure trajectories: A novel approach to informing severe traumatic brain injury phenotypes. Crit Care Med. (2018) 46:1792–802. doi: 10.1097/CCM.0000000000003361
31. Kim, S-Y. Determining the number of latent classes in single- and multi-phase growth mixture models. Struct Equ Model. (2014) 21:263–79. doi: 10.1080/10705511.2014.882690
32. Herle, M, Micali, N, Abdulkadir, M, Loos, R, Bryant-Waugh, R, Hübel, C, et al. Identifying typical trajectories in longitudinal data: modelling strategies and interpretations. Eur J Epidemiol. (2020) 35:205–22. doi: 10.1007/s10654-020-00615-6
33. von Leden, RE, Parker, KN, Bates, AA, Noble-Haeusslein, LJ, and Donovan, MH. The emerging role of neutrophils as modifiers of recovery after traumatic injury to the developing brain. Exp Neurol. (2019) 317:144–54. doi: 10.1016/j.expneurol.2019.03.004
34. McGovern, AJ, and Barreto, GE. Mitochondria dysfunction and inflammation in traumatic brain injury: androgens to the battlefront. Androgens: Clin Res Therapeutics. (2021) 2:304–15. doi: 10.1089/andro.2021.0017
35. Pun, PBL, Lu, J, and Moochhala, S. Involvement of ROS in BBB dysfunction. Free Radic Res. (2009) 43:348–64. doi: 10.1080/10715760902751902
36. Xu, X, Kozar, R, Zhang, J, and Dong, J-F. Diverse activities of von Willebrand factor in traumatic brain injury and associated coagulopathy. J Thromb Haemost. (2020) 18:3154–62. doi: 10.1111/jth.15096
37. Wang, KK, Yang, Z, Zhu, T, Shi, Y, Rubenstein, R, Tyndall, JA, et al. An update on diagnostic and prognostic biomarkers for traumatic brain injury. Expert Rev Mol Diagn. (2018) 18:165–80. doi: 10.1080/14737159.2018.1428089
38. Ma, F, Li, L, Xu, L, Wu, J, Zhang, A, Liao, J, et al. The relationship between systemic inflammation index, systemic immune-inflammatory index, and inflammatory prognostic index and 90-day outcomes in acute ischemic stroke patients treated with intravenous thrombolysis. J Neuroinflammation. (2023) 20:220. doi: 10.1186/s12974-023-02890-y
39. Wang, R-H, Wen, W-X, Jiang, Z-P, Du, Z-P, Ma, Z-H, Lu, A-L, et al. The clinical value of neutrophil-to-lymphocyte ratio (NLR), systemic immune-inflammation index (SII), platelet-to-lymphocyte ratio (PLR) and systemic inflammation response index (SIRI) for predicting the occurrence and severity of pneumonia in patients with intracerebral hemorrhage. Front Immunol. (2023) 14:1115031. doi: 10.3389/fimmu.2023.1115031
40. Geraghty, JR, Lung, TJ, Hirsch, Y, Katz, EA, Cheng, T, Saini, NS, et al. Systemic immune-inflammation index predicts delayed cerebral vasospasm after aneurysmal subarachnoid hemorrhage. Neurosurgery. (2021) 89:1071–9. doi: 10.1093/neuros/nyab354
41. Stocchetti, N, Carbonara, M, Citerio, G, Ercole, A, Skrifvars, MB, Smielewski, P, et al. Severe traumatic brain injury: targeted management in the intensive care unit. Lancet Neurol. (2017) 16:452–64. doi: 10.1016/S1474-4422(17)30118-7
42. Blennow, K, Brody, DL, Kochanek, PM, Levin, H, McKee, A, Ribbers, GM, et al. Traumatic brain injuries. Nat Rev Dis Primers. (2016) 2:16084. doi: 10.1038/nrdp.2016.84
43. Fu, S, Liu, H, Wang, G, Hu, X, and Wang, S. Incidence, risk factors, and clinical outcomes of acute brain swelling associated with traumatic acute subdural hematoma: a retrospective study utilizing novel diagnostic criteria. Ther Adv Neurol Disord. (2024) 17:17562864241242944. doi: 10.1177/17562864241242944
44. Jha, RM, and Kochanek, PM. A precision medicine approach to cerebral edema and intracranial hypertension after severe traumatic brain injury: quo Vadis? Curr Neurol Neurosci Rep. (2018) 18:105. doi: 10.1007/s11910-018-0912-9
45. Knaus, WA, Wagner, DP, Draper, EA, Zimmerman, JE, Bergner, M, Bastos, PG, et al. The APACHE III prognostic system. risk prediction of hospital mortality for critically ill hospitalized adults. Chest. (1991) 100:1619–36. doi: 10.1378/chest.100.6.1619
46. Duchniewicz, M, Lee, JYW, Menon, DK, and Needham, EJ. Candidate genetic and molecular drivers of dysregulated adaptive immune responses after traumatic brain injury. J Neurotrauma. (2024) 41:3–12. doi: 10.1089/neu.2023.0187
47. Rhind, SG, Crnko, NT, Baker, AJ, Morrison, LJ, Shek, PN, Scarpelini, S, et al. Prehospital resuscitation with hypertonic saline-dextran modulates inflammatory, coagulation and endothelial activation marker profiles in severe traumatic brain injured patients. J Neuroinflammation. (2010) 7:5. doi: 10.1186/1742-2094-7-5
48. Das, M, Mohapatra, S, and Mohapatra, SS. New perspectives on central and peripheral immune responses to acute traumatic brain injury. J Neuroinflammation. (2012) 9:1–12. doi: 10.1186/1742-2094-9-236
Keywords: traumatic brain injury (TBI), neuroinflammation, group-based trajectory modeling (GBTM), inflammatory biomarkers, systemic immune inflammation index (SII), all-cause hospital mortality
Citation: Tang Z, Liao C, Zhuang Z, Xu Z, Liu M and Xu H (2025) Trajectories of systemic immune inflammation index and mortality risk in patients with moderate-to-severe traumatic brain injury: a retrospective cohort study. Front. Neurol. 15:1439318. doi: 10.3389/fneur.2024.1439318
Edited by:
Subhas K. Konar, National Institute of Mental Health and Neurosciences (NIMHANS), IndiaReviewed by:
Naushad Ahmad Khan, Hamad Medical Corporation, QatarYi Chen, Xinjiang Medical University, China
Copyright © 2025 Tang, Liao, Zhuang, Xu, Liu and Xu. This is an open-access article distributed under the terms of the Creative Commons Attribution License (CC BY). The use, distribution or reproduction in other forums is permitted, provided the original author(s) and the copyright owner(s) are credited and that the original publication in this journal is cited, in accordance with accepted academic practice. No use, distribution or reproduction is permitted which does not comply with these terms.
*Correspondence: Haixiong Xu, eHVoYWl4QDEyNi5jb20=; Mingfa Liu, c3RsbWYxMTYzQHNpbmEuY29t
†These authors have contributed equally to this work