 Dongsheng Liu1,2,3†
 Nan Wang4,5,6†
 Ming Song7,8,9
 Xiaoke Chai4,6
 Qiheng He4
 Tianqing Cao4Dawei Kong3
 Zhuhuan Song3Guangming Zhang3Lei Liu3Xiaosong Wang3*Guoqiang Chen3*Shaoya Yin1,2,10*
 Yi Yang4,6,11,12,13,14,15,16*
 Jizong Zhao4,6
- 1Clinical College of Neurology, Neurosurgery and Neurorehabilitation, Tianjin Medical University, Tianjin, China
- 2Department of Neurosurgery, Tianjin Huanhu Hospital, Tianjin, China
- 3Department of Neurosurgery, Aviation General Hospital, Beijing, China
- 4Department of Neurosurgery, Beijing Tiantan Hospital, Capital Medical University, Beijing, China
- 5Department of Neurosurgery, Peking Union Medical College Hospital, Chinese Academy of Medical Sciences and Peking Union Medical College, Beijing, China
- 6China National Clinical Research Center for Neurological Diseases, Beijing, China
- 7National Laboratory of Pattern Recognition, Institute of Automation, The Chinese Academy of Sciences, Beijing, China
- 8Brainnetome Center, Institute of Automation, The Chinese Academy of Sciences, Beijing, China
- 9University of the Chinese Academy of Sciences, Beijing, China
- 10Tianjin Key Laboratory of Cerebral Vascular and Neurodegenerative Diseases, Tianjin Neurosurgical Institute, Tianjin Huanhu Hospital, Tianjin, China
- 11Brain-Computer Interface Transitional Research Center, Beijing Tiantan Hospital, Capital Medical University, Beijing, China
- 12China National Center for Neurological Disorders, Beijing, China
- 13National Research Center for Rehabilitation Technical Aids, Beijing, China
- 14Chinese Institute for Brain Research Beijing, Beijing, China
- 15Beijing Institute of Brain Disorders, Beijing, China
- 16Nuffield Department of Clinical Neurosciences, University of Oxford, Oxford, United Kingdom
Objective: This study was to employ 18F-flurodeoxyglucose (FDG-PET) to evaluate the resting-state brain glucose metabolism in a sample of 46 patients diagnosed with disorders of consciousness (DoC). The aim was to identify objective quantitative metabolic indicators and predictors that could potentially indicate the level of awareness in these patients.
Methods: A cohort of 46 patients underwent Coma Recovery Scale-Revised (CRS-R) assessments in order to distinguish between the minimally conscious state (MCS) and the unresponsive wakefulness syndrome (UWS). Additionally, resting-state FDG-PET data were acquired from both the patient group and a control group consisting of 10 healthy individuals. The FDG-PET data underwent reorientation, spatial normalization to a stereotaxic space, and smoothing. The normalization procedure utilized a customized template following the methodology outlined by Phillips et al. Mean cortical metabolism of the overall sample was utilized for distinguishing between UWS and MCS, as well as for predicting the outcome at a 1-year follow-up through the application of receiver operating characteristic (ROC) analysis.
Results: We used Global Glucose Metabolism as the Diagnostic Marker. A one-way ANOVA revealed that there was a statistically significant difference in cortical metabolic index between two groups (F(2, 53) = 7.26, p < 0.001). Multiple comparisons found that the mean of cortical metabolic index was significantly different between MCS (M = 4.19, SD = 0.64) and UWS group (M = 2.74, SD = 0.94,p < 0.001). Also, the mean of cortical metabolic index was significantly different between MCS and healthy group (M = 7.88, SD = 0.80,p < 0.001). Using the above diagnostic criterion, the diagnostic accuracy yielded an area under the curve (AUC) of 0.89 across the pooled cohort (95%CI 0.79–0.99). There was an 85% correct classification between MCS and UWS, with 88% sensitivity and 81% specificity for MCS. The best classification rate in the derivation cohort was achieved at a metabolic index of 3.32 (41% of the mean cortical metabolic index in healthy controls).
Conclusion: Our findings demonstrate that conscious awareness requires a minimum of 41% of normal cortical activity, as indicated by metabolic rates.
1 Introduction
Minimal conscious disorder (MCS) is distinguished from the vegetative state/unresponsive wakefulness syndrome (VS/UWS) by the behavioral manifestations associated with consciousness, and this distinction between MCS and VS poses a significant challenge for clinicians responsible for managing patients with disorders of consciousness (DoC). Coma Recovery Scale-Revised (CRS-R), is regarded as the reference standard for clinical assessment of consciousness and is supported by international guidelines (1, 2). However, even with careful behavioral testing, the potential for misdiagnosis remains (3). Prior research has indicated that a range of 37 to 43% of patients who have been diagnosed with VS exhibit indications of consciousness. The misdiagnosis of such patients can have severe repercussions, particularly when it comes to making decisions regarding end-of-life care (4, 5). Clinical consensus methods have been found to misdiagnose patients with unresponsive wakefulness syndrome at a rate as high as 40% (5–7).
Neuroimaging techniques are currently being developed that are important for exploring the presence of brain activity indicated by patient consciousness, such as functional magnetic resonance imaging (fMRI), positron emission tomography (PET), electroencephalogram (EEG), and functional near-infrared spectroscopy (fNIRS) (8). These imaging techniques provide objectivity in the assessment of cerebral awareness, both in terms of intrinsic brain activity during periods of rest and in terms of specific cognitive responses to cerebral tasks. It is important to note that some individuals diagnosed with unresponsive arousal syndrome may possess the ability to consciously regulate their thoughts, thus implying the presence of at least some degree of consciousness (3, 9, 10). The identification and assessment of cognitive motor dissociation (CMD) present significant challenges in DoC. CMD patients retain intrinsic awareness but are unable to communicate it due to motor or communication impairments. This limitation exposes the inadequacies of conventional clinical evaluations, particularly when patients appear unresponsive. Accurate CMD diagnosis requires not only behavioral assessments but also objective biomarkers from advanced neuroimaging modalities (11). Functional neuroimaging techniques, including PET and fMRI, are pivotal in detecting CMD. These methods provide critical insights into brain activity and connectivity patterns, offering evidence of residual consciousness. For instance, Owen et al. demonstrated that some vegetative state patients exhibited fMRI-detected brain activity akin to healthy individuals during mental imagery tasks, indicating retained consciousness (9). Furthermore, studies have revealed diverse connectivity patterns across brain regions in CMD patients, underscoring the necessity of imaging for precise diagnosis and prognosis (12). In addition, 18F-FDG PET imaging can be used to help confirm the diagnosis of cognitive-motor dissociation, and an accurate diagnosis can help in the development of a long-term neurorehabilitation program, which can help to improve the patient’s prognosis (13).
Clinical use of PET-CT in China began in September 2002 (14). Resting-state 18F-flurodeoxyglucose (FDG-PET) assessment appears to have greater sensitivity in assisting in the clinical diagnosis of patients with DoC compared to fMRI (15). FDG-PET studies have confirmed the importance of the fronto-parietal network as it relates to consciousness, as evidenced by correlations between behavioral metrics and metabolic retention within this network. It has been shown that patients in a vegetative state who exhibit some degree of frontoparietal metabolic protection tend to have more favorable treatment outcomes compared to patients with low frontoparietal metabolism. FDG-PET shows promise in improving the clinical diagnosis of DoCs, but previous research has predominantly utilized intricate analytical approaches to distinguish between patients in MCS and those in unresponsive wakefulness states UWS. The current methods lack quantitative accuracy and are constrained by the constraints of visually guided assessments of changes in brain metabolism (15). In the present study, we conducted a cross-sectional multimodal investigation to quantify all glucose metabolic rate as a diagnostic indicator of patients with disorders of consciousness in order to explore the differences in prognosis and characteristic regional brain metabolism between patients with VS/UWS and those with MCS.
The preservation of specific behavioral or perceptual functions in patients with MCS is correlated with relative regional variations in metabolism, providing evidence for the assertion that network activations lead to localized increases in energy metabolism even in DoCs (16–18). The correlation between the functionality of distinct brain regions or networks and indicators of glucose metabolism holds more importance in gauging the extent of consciousness and is pivotal in the restoration of consciousness (19). Our hypothesis posits that the metabolic activity of allo-glucose serves as a predictor for the maintenance of conscious awareness, while variations in regional activity indicate the preservation of specific perceptual or cognitive functions. Our study aimed to assess the hypothesis regarding the preservation or recovery of consciousness following a 1-year follow-up through the measurement of overall brain metabolic rate. Utilizing resting-state PET scans, we analyzed patients with disorders of consciousness stemming from various etiologies such as traumatic brain injury, ischemic hypoxic encephalopathy, cerebral hemorrhage, and brainstem hemorrhage (20, 21).
2 Materials and methods
2.1 Participants
We retrospectively studied the clinical data of patients with DoC admitted to Beijing Tiantan Hospital of Capital Medical University between 2021 and 2023. Inclusion criteria: patients aged 18 ~ 60 years old who met the diagnosis of DoC and had undergone FDG-PET. Exclusion criteria: Patients under the age of 16, acute patients within 28 days of onset at the time of the PET scan, patients with fewer than five CRS-R assessments conducted within a specified time frame [as this is the recommended number for an accurate diagnosis (22)], patients diagnosed with coma or emergence from MCS, or those with an unclear diagnosis, were excluded from our analysis performed on the FDG-PET data we collected. 46 patients were finally identified for inclusion in the experimental group.
The 46 patients in the experimental group were patients between the ages of 18 and 57 years (including 27 males). The 46 patients included 21 patients with traumatic brain injury, 8 patients with hypoxic–ischemic encephalopathy, 10 patients with supratentorial intracerebral hemorrhage, and 7 patients with brainstem hemorrhage. All 46 patients underwent PET/CT within 2 to 4 months after the onset of the disease (Table 1). Another 10 healthy controls, aged 19 ~ 70 years, including 5 females, were selected.

Table 1. Patient demographics.
The procedure to split the population in derivation/validation sets is based on the enrollment time, and among patients enrolled earlier, 23 patients entered derivation after exclusion criteria. Using the same approach, an additional 23 patients were enrolled in validation.
The study was approved by the Biology Research Ethics Review Committee of the Institute of Automation, Chinese Academy of Sciences (IA-202130). This cross-sectional study adheres to the STROBE statement, which requires written informed consent from healthy controls and patients’ legal representatives.
2.2 Clinical assessments
CRS-R evaluations were all performed by experienced neurosurgical clinicians. Subsequently, clinical outcomes encompassing mortality, UWS or MCS from minimally conscious state were obtained through structured telephone interviews with either the patients’ physicians or their relatives, precisely one year following FDG-PET. These outcomes were derived from the six subscales of the CRS-R (23, 24). All CRS-R assessments were performed by trained and experienced clinicians. Clinical outcomes were collected (death, VS/UWS, MCS or EMCS) via structured telephone interviews with the patients’ physician or relatives after the FDG-PET within 1 year. This phone interview is based on the six subscales of the CRS-R. Outcomes were grouped in three categories: (1) patients who died, (2) patients who maintained a VS/UWS diagnosis or worsened their diagnosis (ie, “poor outcome”), and (3) patients who remained in a MCS or improved their diagnosis such as emerging from MCS (ie, “good outcome”).
2.3 FDG-pet
All patients in this study underwent brain 18F-FDG PET/CT using Biograph mCT 52-ring PET/CT manufactured by Siemens AG, Germany, and the contrast agent was 18F-FDG (15). All subjects were asked to fast for at least 6 h. The injected dose was controlled according to the patient’s body mass, and the dose was controlled at 3.7 MBq/kg of 18F-FDG, and then the patients were allowed to rest in a place protected from light for about 1 h. The patient was placed in the supine position, and the brain was scanned using the program provided by the manufacturer, and the time was controlled to be about 3 min. Image reconstruction and post-processing were performed using the manufacturer-supplied program to obtain transverse tomography, coronal tomography, sagittal tomography, and 3-dimensional images. The imaging data were digitally registered to a computer disk to create a tomographic image of the patient’s brain. The distribution of 18F-FDG in the brain was analyzed based on the imaging results, the patient’s brain regions of interest were outlined, and 18F-FDG uptake was observed based on the brain regions of interest (25).
2.4 Statistical analysis
Analysis according to clinical research procedures, data were preprocessed and analyzed (15). The data were reoriented and spatially normalized to a stereotaxic space and smoothed with a 14 mm full width Gaussian kernel at half maximum. In order to overcome the problem of big deformations caused by brain lesions as well as the fact that SPM has a default template based on H152O data, we used a customized template described by Phillips et al. for normalization (26). The statistical analyses were conducted using Statistical Parametric Mapping (SPM121). Using the voxel values for each contrast, the statistical parametric map of the t-statistics [SPM (23)], was transformed to the unit normal distribution [SPM (23)] and thresholded at voxel-wise 0.05 FDR at the whole-brain level. Statistical analysis of UWS vs. MCS groups we compared the differences between the two groups by SPM12, which in turn gave us the hypometabolic regions.
Using Advanced Normalization Tools (ANTs version 2.0.3), affine and non-linear transformations were employed to register individual images to a common template in Montreal Neurological Institute (MNI) space. This registration process aimed to determine the metabolic index of the best-preserved hemisphere (MIBH). Subsequently, the images were segmented into left and right cortex, and the extracerebral tissue was normalized based on its metabolism. Finally, the metabolic activity was scaled by setting the mean extracerebral activity to a value of 1, with all values ranging from 0 to 1. MIBH was calculated as the highest mean metabolic activity of the two hemispheres. Stender et al. set the cut-off at 3.18 (27). Covariance analysis was used to analyze the effect of age and gender on Mean cortical metabolic index.
2.5 Analysis flow chart
We followed the flow chart in Figure 1 for data acquisition and further analysis.

Figure 1. Flow chart of this study.
3 Results
3.1 Clinical data
To perform the normalization, a reference distribution was calculated from the extracerebral tissue intensity distributions of the 10 control subjects. Each individual image of the study population was subsequently normalized, by selecting a global scaling factor of the image intensity such that the Jensen-Shannon divergence between the reference distribution and the subject’s extracerebral intensity distribution was minimized (28). We used the mean cortical metabolism to classify between UWS and MCS and predict outcome at 1-year follow-up, using ROC analysis.
3.2 Global glucose metabolism rate as diagnostic marker
ANCOVA analysis was used to analyze the effect of age and gender on Mean cortical metabolic index. There was no interaction between age and gender [F(1,42) = 0.56, p = 0.46] and there was no significant effect of age [F(1,42) = 1.72, p = 0.20] and gender [F(1,42) = 0.81, p = 0.37] on Mean cortical metabolic index.
A one-way ANOVA was performed to compare the mean cortical metabolic index of three different group UWS, MCS and healthy controls. A one-way ANOVA revealed that there was a statistically significant difference in cortical metabolic index between at least two groups [F(2, 53) = 7.26, p < 0.001]. Tukey’s HSD Test for multiple comparisons found that the mean value of cortical metabolic index was significantly different between MCS group (M = 4.19, SD = 0.64) and UWS group (M = 2.74, SD = 0.94, p < 0.001). Tukey’s HSD Test for multiple comparisons found that the mean value of cortical metabolic index was significantly different between MCS group and healthy group (M = 7.88, SD = 0.80, p < 0.001).
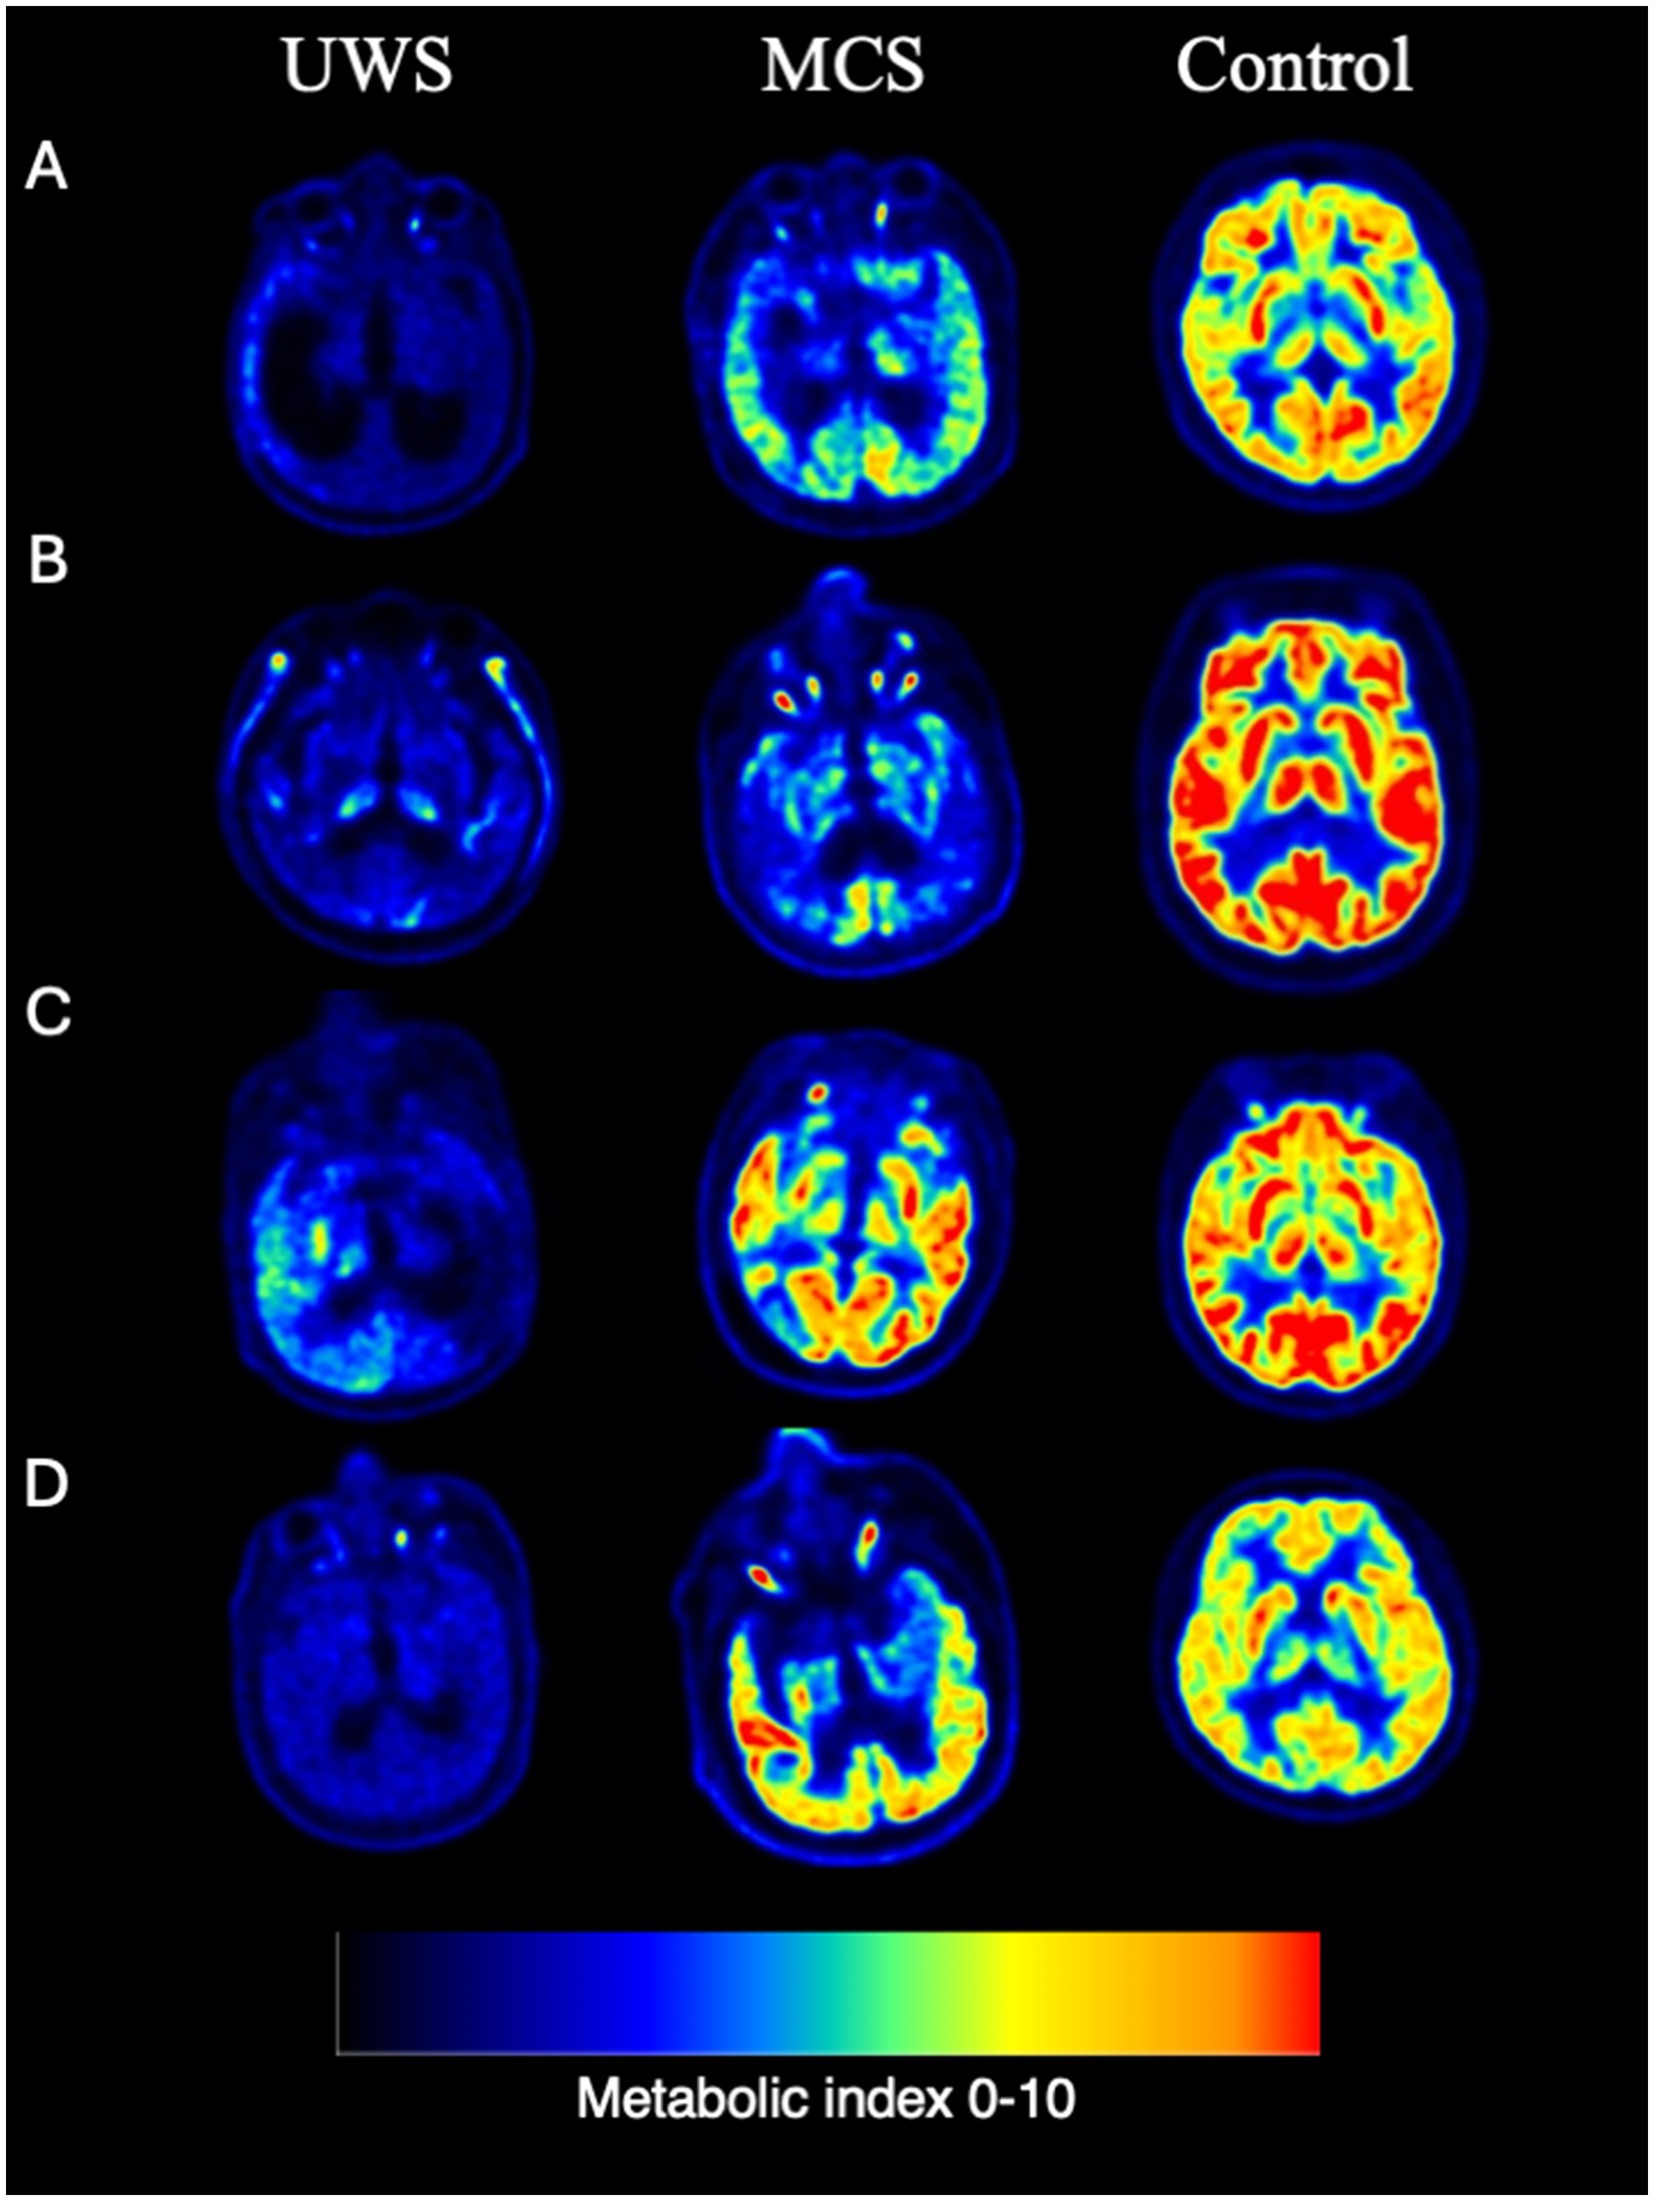
Figure 2. Representative individual FDG PET examples. (A) Cerebral trauma. (B) Ischemic hypoxic encephalopathy. (C) Cerebral hemorrhage. (D) Brain stem hemorrhage.
Average cortical glucose metabolism gave diagnostic discrimination between MCS and UWS at an area under the ROC-curve (AUC) of 0.86 (95% CI [0.68–1.0]) in the derivation cohort and 0.93 (95% CI [0.82–1.0]) in the validation cohort. The performance of the classifier did not significantly differ between the two cohorts by ROC Analysis (p = 0.64). The best classification rate in the derivation cohort was achieved at a metabolic index of 3.11 (39% of normal activity; Figure 2), resulting in 87% correct classification between UWS and MCS, with 92% sensitivity and 80% specificity to MCS, thus satisfying reasonable requirements for a clinically useful diagnostic criterion. In the validation cohort, this diagnostic threshold provided an 83% correct classification rate between UWS and MCS, with 83% sensitivity and 82% specificity to MCS. Post hoc inference suggested an optimal metabolic cutoff at a metabolic index of 3.34 (42% of normal) in the validation cohort; all patient classifications at this level remained unchanged compared to the derivation cohort threshold, i.e., performance of the diagnostic model was similar in the derivation and validation cohorts (Table 2).
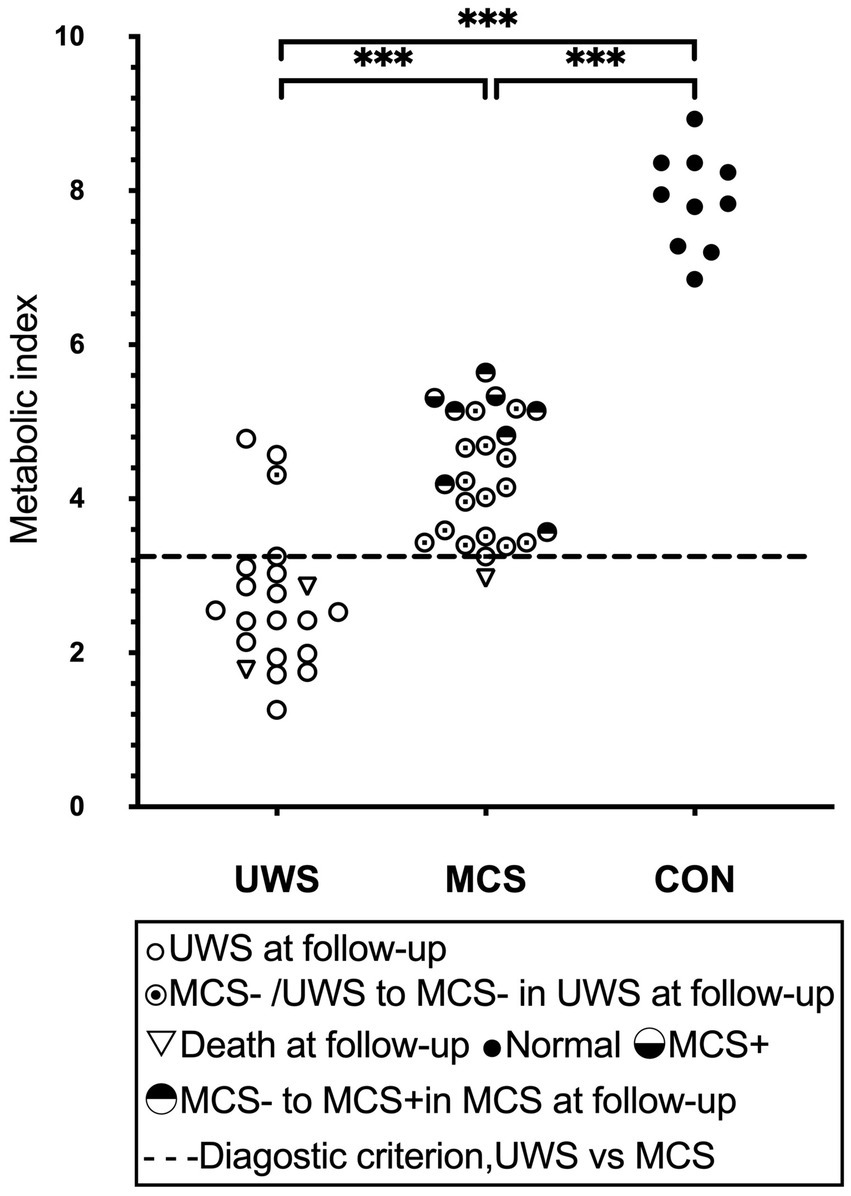
Figure 3. Global brain glucose metabolism. The distribution of quantified cortical metabolic values for all individual subjects in the pooled cohort, with emphasis on the best-preserved hemisphere, is depicted. A dashed line denotes the optimal diagnostic cutoff distinguishing patients in a vegetative state (UWS) from those in a minimally conscious state (MCS). Horizontal lines represent group averages. Metabolic values are expressed as a unitless index, with the average activity in the scaling reference area (extracerebral tissue) standardized to 1. MCS+, high-level behavioral responses; MCS-, low-level behavioral responses.
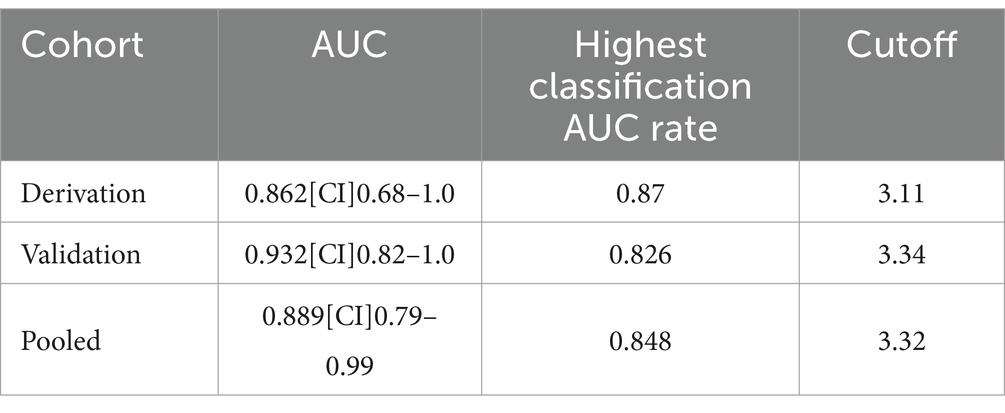
Table 2. Diagnostic threshold for VS and MCS.
The diagnostic criterion outlined above yielded a diagnostic accuracy of 0.89 (95% CI [0.79–0.99]) as measured by the AUC across the combined cohort. The classification accuracy between MCS and UWS was 85%, with sensitivity and specificity rates of 88 and 81%, respectively, for MCS. The optimal metabolic cutoff point, determined to be a metabolic index of 3.32 (equivalent to 41% of normal), was identified within the pooled cohort. Furthermore, all healthy controls were correctly identified as conscious.
3.3 Outcome prediction
Group discrimination by the metabolic criterion correctly predicted 88% of all known patient outcomes, with 95% sensitivity and 76% specificity to manifest consciousness at follow up (Figure 3). A total of 3 UWS patients had brain metabolism above the 41% diagnostic threshold. Of these, 1 had recovered consciousness at follow-up, 2 UWS patients with sub-threshold metabolism died. 6 MCS-patient with over-threshold metabolism progressed to MCS+ on follow-up. There was statistically significant difference in SUV values between the 6 patients (M = 4.75, SD = 0.75) who progressed to MCS+ and the 16 patients who maintained MCS-in Independent samples T-Test (M = 4.03, SD = 0.65), t(20) = 2.22, p = 0.038. No one UWS patient with sub-threshold metabolism progressed to MCS on follow-up. 1 MCS patients with near-threshold metabolism died (Figure 3).
3.4 Regional metabolic activity
The cerebral glucose metabolic rate was generally lower in all patients with impaired consciousness compared to healthy controls, and by comparing and analyzing the cases in the UWS and MCS groups, we found significant differences between the two groups in the left occipital lobe and the left precuneus, with the lower metabolic rate in the UWS group, which may be related to the suggestion of the importance of certain important regions for consciousness (Figure 4).
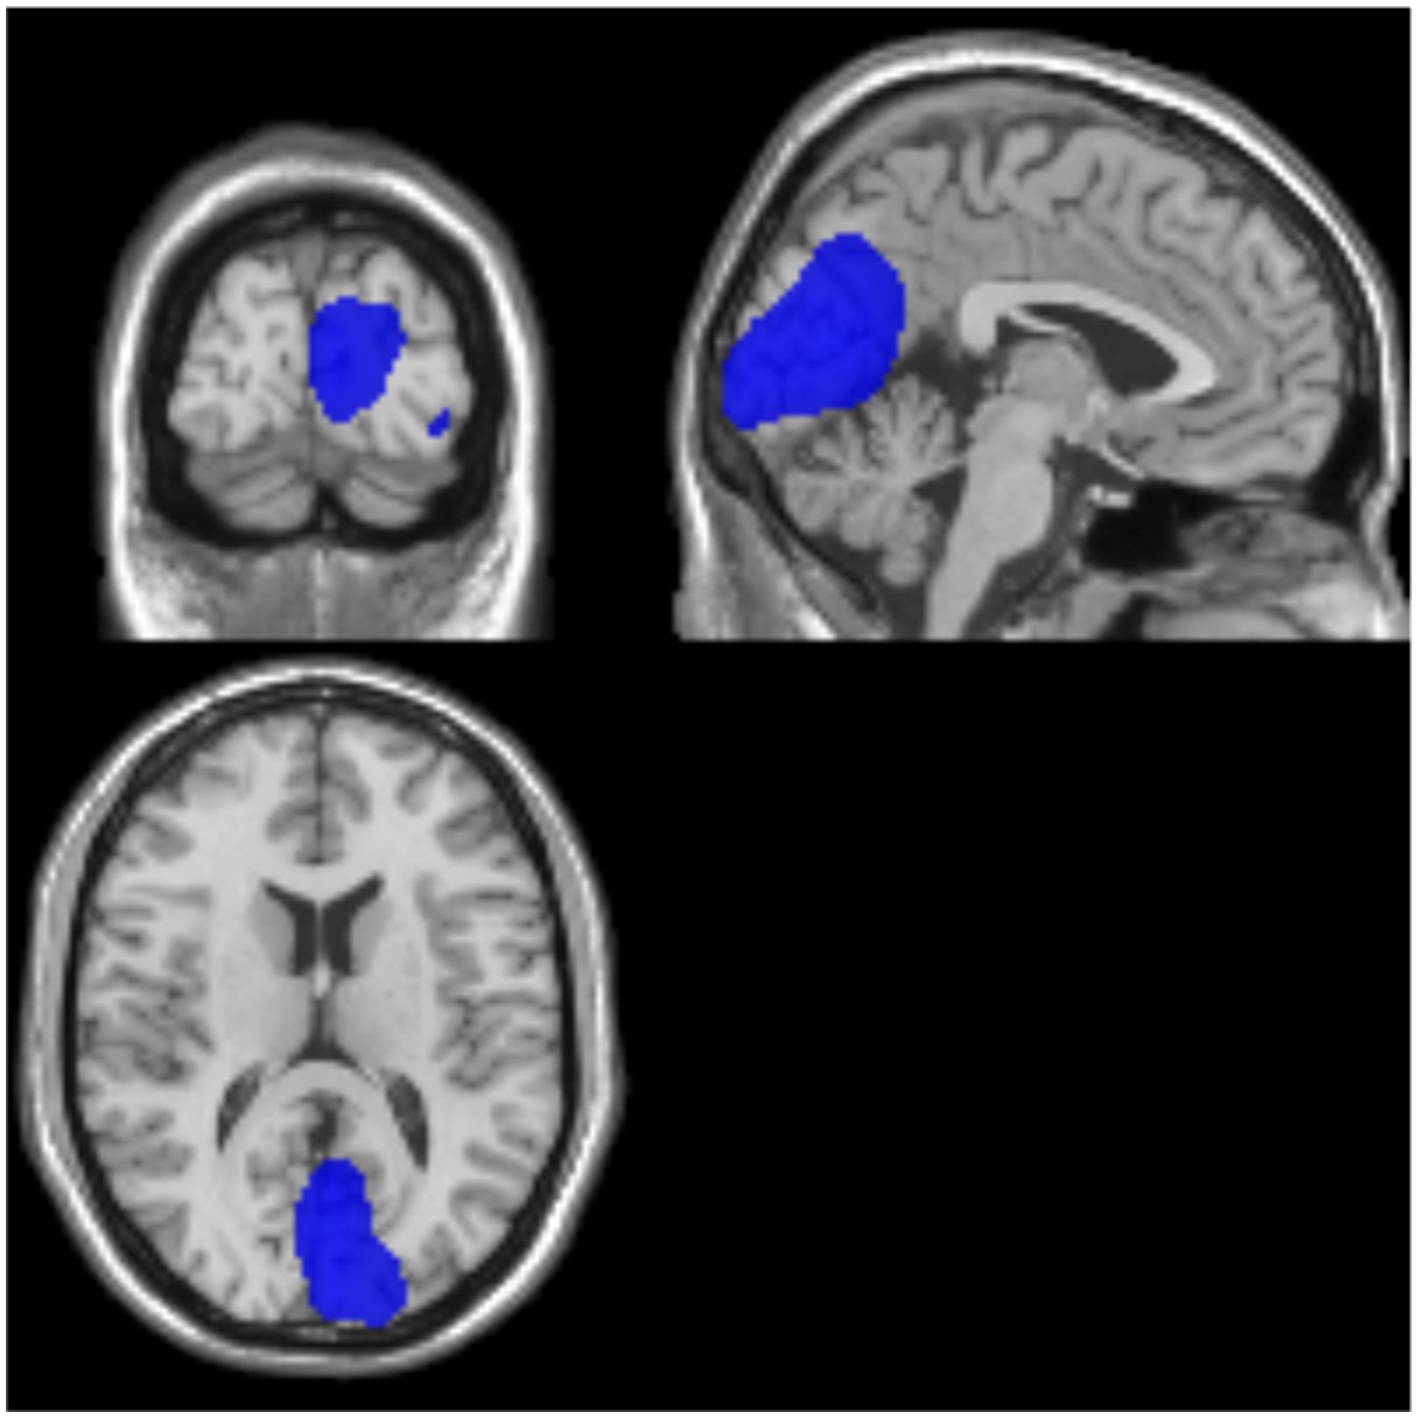
Figure 4. Examples of representative SUV for UWS/MCS. Blue color represents a high brain metabolism. Areas where activity in MCS is significantly higher than in VS/UWS (p < 0.001). MCS, minimally conscious state; UWS, unresponsive wakefulness syndrome.
3.5 Regional glucose metabolism
The patients’ condition did not exhibit any discernible regional drivers, as metabolic group differences were observed across all volumes of interest (VOIs) (Figure 5). We conducted a comparative analysis of Few-corrected cluster percentages in various disease states to examine hypometabolic brain regions. Our findings indicate that patients with TBI exhibit significant hypometabolism in the thalamus, with subsequent reductions in metabolism observed in the superior frontal gyrus (SFG), middle frontal gyrus (MFG), and angular gyrus. In individuals presenting with cerebral hemorrhage, positron emission tomography (PET) revealed notable hypometabolism in specific brain regions such as the posterior cingulate gyrus, external cerebellum, and thalamus. Conversely, metabolic alterations in other cerebral areas were less pronounced. Conversely, patients with brainstem hemorrhage exhibited reduced metabolism in the cerebellum exterior as well as the middle frontal gyrus (MFG). The observed variations in metabolic activity can be attributed to differing etiologies.
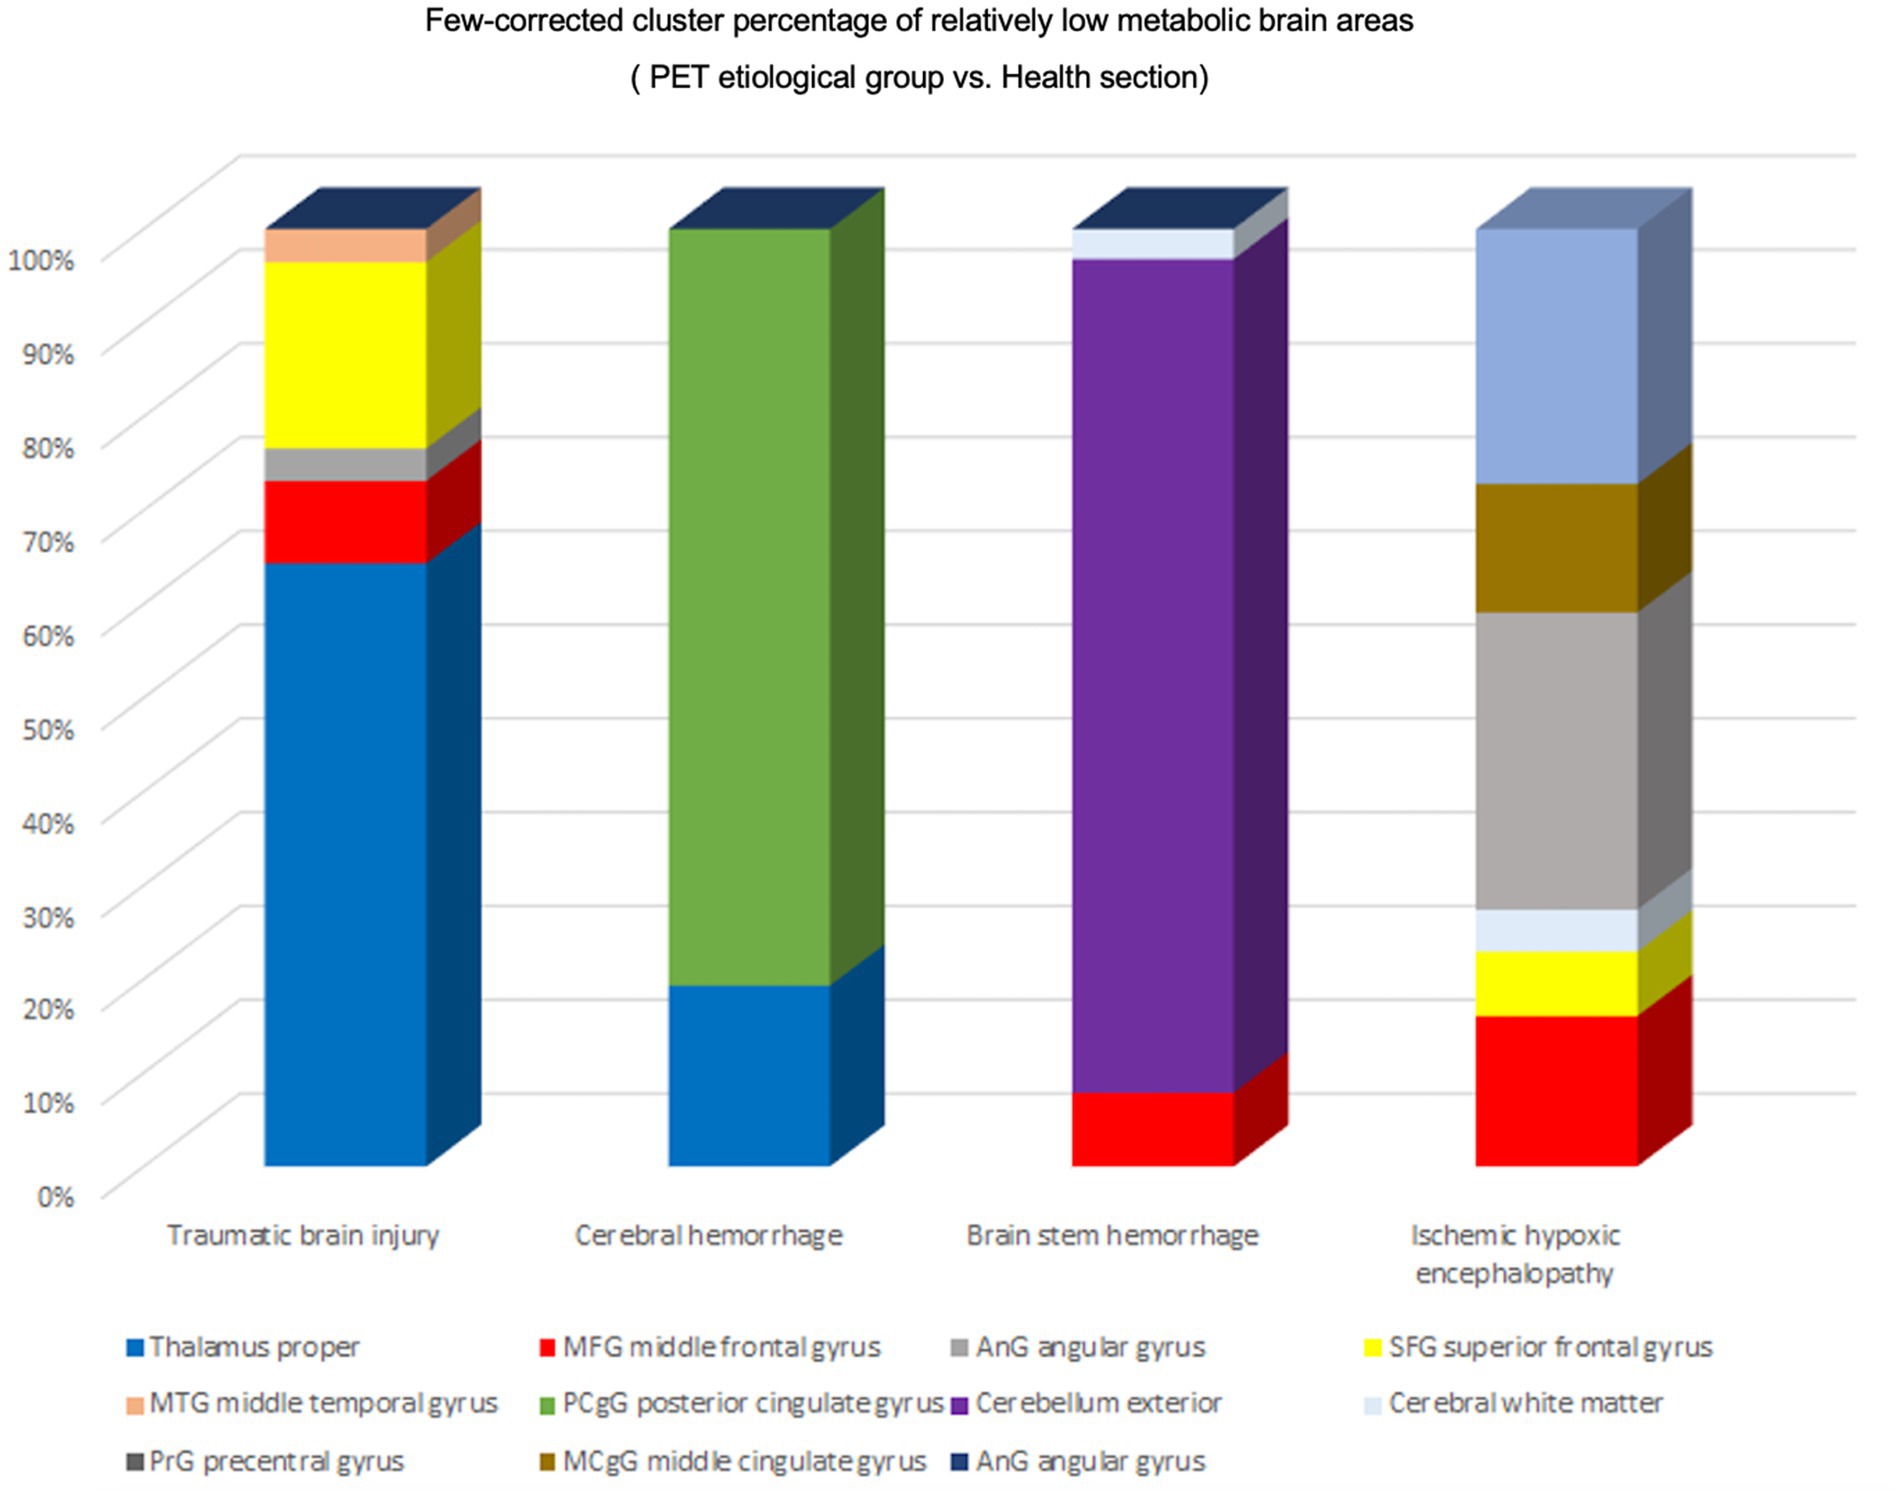
Figure 5. Regional activation of different etiologies. Percentage of Few-corrected clusters of relatively hypometabolic brain regions in the PET etiology group versus the healthy group. TBI Relatively hypometabolic brain regions were predominantly Thalamus proper, Cerebral hemorrhage Relatively hypometabolic brain regions were predominantly posterior cingulate gyrus (PCgG), Brain stem hemorrhage relative hypometabolic brain region is mainly Cerebellum exterior, Ischemic hypoxic encephalopathy relative hypometabolic brain region is mainly angular gyrus (AnG).
4 Discussion
This study illustrates the practicality of quantifying FDG-PET glucose uptake and its effectiveness in accurately diagnosing prolonged DoC. In our study population, we noted that the metabolic threshold that differentiated MCS from UWS was approximately 41% of normal metabolism, a result that aligns with the findings of Stender et al. (27). This inconsistency may be ascribed to protocol-specific variables; nevertheless, our results align with previous studies conducted on individuals with disorders of consciousness, particularly in the context of sleep and anesthesia (29–34). This observation suggests that increased consciousness, starting from the minimally conscious state, may require enhanced activity in particular networks or regions rather than an increase in energy consumption. Additionally, the average cortical glucose metabolic index was determined to be unaffected by etiology or potential confounding variables such as age or gender. Taken together, these findings suggest a significant correlation between cerebral glucose metabolism and the presence of consciousness, irrespective of the etiology of injury or the time elapsed since its occurrence.
Cerebral metabolic activity emerged as a dependable marker for assessing levels of consciousness at the 1-year follow-up. Utilizing a diagnostic threshold of 41% to categorize patients, an 85% accuracy rate was achieved in prognosticating outcomes for the combined cohort of patients with MCS and UWS. This discovery is significant, especially considering the potential limitations in predictive accuracy caused by the elevated mortality rate observed over an extended follow-up period. The model’s precision was evaluated in two distinct cohorts, using behavioral diagnosis and outcomes at a 1-year follow-up as reference points. The results suggest that our assessment of cerebral metabolic activity successfully discriminates between patients in a UWS and those in a MCS, thereby functioning as a dependable diagnostic and prognostic tool for individuals with chronic DoC.
The diagnostic performance of this method was found to be equally effective in both the derivation and validation samples, suggesting its validity across independent cohorts. The ROC analysis of the classification between MCS and UWS revealed a consistent “optimal” diagnostic threshold of 41% of normal metabolic activity, leading to high sensitivity and satisfactory specificity for MCS. Additionally, the method accurately identified healthy controls as conscious individuals. In conclusion, the established FDG-PET diagnostic threshold reliably distinguishes between conscious and unconscious subjects, striking a favorable balance between type I and type II error risks.
In addition, it was found that Occipital Lob and Precuneus hypometabolism may be important points of differentiation. This is consistent with previous studies (19, 35). Precuneus connectivity has demonstrated the ability to effectively distinguish between minimally conscious and unconscious patients, indicating a robust correlation between the activity of this brain region and the patients’ level of consciousness (34, 36). The metabolic level’s specificity in relation to diagnosis and prognosis implies that the classification threshold signifies the minimum energetic demands for sustained consciousness. Our findings notably demonstrate that the shift from unconsciousness to consciousness occurs beyond a clearly delineated global (or hemispheric) metabolic boundary, indicating a global energetic threshold phenomenon that facilitates the restoration of consciousness following brain injury. This discovery aligns with previous assertions that consciousness cannot be solely ascribed to activity in particular networks or regions, but rather is linked to a heightened energetic state encompassing the entire brain. Consequently, the maintenance of glucose metabolic rate in at least one hemisphere emerges as an essential prerequisite (though not the sole determinant) for the restoration of awareness following brain injury. In aggregate, the cortical metabolic level accounted for the present condition or impending recuperation in 94% of patients diagnosed with UWS and MCS.
Clinical studies have shown that 18F-FDG PET/CT can effectively visualize brain cell metabolism and accurately reflect the functional state of the brain. The recovery of consciousness in patients with disorders of consciousness is often mainly transformed from a vegetative state to a minimally conscious state through the neuronal activities of various tissues in the brain to form a complete neural system. The recovery of the higher central nervous system cannot be separated from the neuronal movements in the brain, and all brain tissue activities need to be labeled by glucose metabolism. In this study, we quantified 18F-FDG uptake in DoC patients as a diagnostic index, and used data from a single-center study for statistical analysis, but a multi-center statistical study is more important for reference. In this study, a single modality study was taken, and then, a multimodal study is more helpful for the comprehensive analysis and evaluation of doc patients, such as pet-eeg, which has more important reference value for EEG-metabolic coupling, which will be the direction of future research (15, 37, 38).
5 Limitations
Although this study presents an overview of PET imaging’s application in diagnosing DoC and achieves a quantitative analysis of DoC patients, several limitations remain. First, a primary limitation is the relatively small sample size of DoC patients included. Due to the challenges of recruiting patients with stable yet specific levels of consciousness impairment, alongside the high costs associated with PET imaging, patient enrollment was limited. Consequently, our findings may lack broad generalizability. Expanding the sample size in future studies could help enhance the robustness of our results and improve applicability across diverse DoC population sent face-to-face clinical assessment of consciousness levels across all patients proved challenging (39). CRS-R, commonly used to evaluate consciousness, relies significantly on the clinician’s experience and subjective interpretation, which can vary. In-hospital follow-up assessments often provide valuable insights that complement imaging findings, especially when distinguishing between vegetative states and minimally conscious states. Our dependence le clinical records introduces variability in the interpretation of consciousness levels and potentially affects the reliability of these assessments. Additionally, the retroature of data collection introduces a risk of selection bias, which may influence the composition of the patient cohort (40). As this study is a single-center investigation, the patient sample may not represent the broader DoC population, given that it includes only patients for whom PET imaging was clinically indicated. This potential bias may impact the external validity of our findings and restricts the generalizability of our conclusions to a wider DoC population. Lastly, it is essential to ackno complexity of consciousness as a multidimensional construct. While PET imaging provides valuable insights into metabolic activity patterns associated with DoC, it may not capture all facets of consciousness, such as structural connectivity and electrophysiological properties, which are critical for a comprehensive assessment of DoC (33). Thus, PET imaging should ideally be integrother diagnostic tools to ensure a thorough evaluation, as multimodal imaging approaches may offer a more holistic view of consciousness. These limitations highlight the need for continuation, ideally with multicenter collaborations and the integration of additional diagnostic modalities, to enhance our understanding of PET imaging’s role in DoC diagnosis (41).
6 Conclusion
In conclusion, 18F-FDG PET/CT can effectively display 18F-FDG activity in brain tissues of patients with disorders of consciousness, which is of positive significance for the assessment of brain function and is worthwhile to be promoted for use in clinical practice. The preservation of hemispheric brain glucose metabolism is indicative of the presence or potential recovery of consciousness in patients with brain injuries. Specific cognitive and sensory functions are supported by regions with preserved metabolic activity. A threshold of 41% of normal cortical hemispheric metabolic activity is necessary for regaining consciousness. FDG-PET serves as a reliable diagnostic and prognostic tool for disorders of consciousness resulting from brain injuries, regardless of their underlying causes.
Data availability statement
The original contributions presented in the study are included in the article/supplementary material, further inquiries can be directed to the corresponding authors.
Ethics statement
The study was approved by the Biology Research Ethics Review Committee of the Institute of Automation, Chinese Academy of Sciences (IA-202130). The studies were conducted in accordance with the local legislation and institutional requirements. The participants provided their written informed consent to participate in this study.
Author contributions
DL: Conceptualization, Writing – original draft. NW: Conceptualization, Writing – original draft. MS: Writing – review & editing. XC: Writing – review & editing. QH: Writing – review & editing. TC: Investigation, Writing – review & editing. DK: Investigation, Writing – review & editing. ZS: Investigation, Writing – review & editing. GZ: Formal analysis, Writing – review & editing. LL: Formal analysis, Writing – review & editing. XW: Conceptualization, Data curation, Writing – review & editing. GC: Conceptualization, Data curation, Writing – review & editing. SY: Writing – review & editing. YY: Conceptualization, Data curation, Writing – review & editing. JZ: Conceptualization, Data curation, Writing – review & editing.
Funding
The author(s) declare that financial support was received for the research, authorship, and/or publication of this article. This article was partially supported by the Science and Technology Innovation 2030-Brain Science and Brain-Inspired Intelligence Project (Grant No. 2021ZD0200200), Beijing Natural Science Foundation project (7232049), International (Hong Kong, Macao, and Taiwan) Science and Technology Cooperation Project (Z221100002722014), 2022 Open Project of Key Laboratory and Engineering Technology Research Center in the Rehabilitation Field of the Ministry of Civil Affairs (2022GKZS0003), and Chinese Institute for Brain Research Youth Scholar Program (2022-NKX-XM-02).
Conflict of interest
The authors declare that the research was conducted in the absence of any commercial or financial relationships that could be construed as a potential conflict of interest.
The reviewer ZC declared a shared affiliation with the author YY to the handling editor at the time of review.
Publisher’s note
All claims expressed in this article are solely those of the authors and do not necessarily represent those of their affiliated organizations, or those of the publisher, the editors and the reviewers. Any product that may be evaluated in this article, or claim that may be made by its manufacturer, is not guaranteed or endorsed by the publisher.
Footnotes
References
1. Giacino, JT, Katz, DI, Schiff, ND, Whyte, J, Ashman, EJ, Ashwal, S, et al. Practice guideline update recommendations summary: disorders of consciousness: report of the guideline development, dissemination, and implementation Subcommittee of the American Academy of neurology; the American congress of rehabilitation medicine; and the National Institute on Disability, Independent Living, and Rehabilitation Research. Neurology. (2018) 91:450–60. doi: 10.1212/WNL.0000000000005926
2. Kondziella, D, Bender, A, Diserens, K, van Erp, W, Estraneo, A, Formisano, R, et al. European academy of neurology guideline on the diagnosis of coma and other disorders of consciousness. Eur J Neurol. (2020) 27:741–56. doi: 10.1111/ene.14151
3. Sun, F, and Zhou, G. Willful modulation of brain activity in disorders of consciousness. N Engl J Med. (2010) 362:1937. author reply-8
4. Childs, NL, Mercer, WN, and Childs, HW. Accuracy of diagnosis of persistent vegetative state. Neurology. (1993) 43:1465–7. doi: 10.1212/WNL.43.8.1465
5. Andrews, K, Murphy, L, Munday, R, and Littlewood, C. Misdiagnosis of the vegetative state: retrospective study in a rehabilitation unit. BMJ. (1996) 313:13–6. doi: 10.1136/bmj.313.7048.13
6. Schnakers, C, Vanhaudenhuyse, A, Giacino, J, Ventura, M, Boly, M, Majerus, S, et al. Diagnostic accuracy of the vegetative and minimally conscious state: clinical consensus versus standardized neurobehavioral assessment. BMC Neurol. (2009) 9:35. doi: 10.1186/1471-2377-9-35
7. Childs, NL, and Mercer, WN. Misdiagnosing the persistent vegetative state. Misdiagnosis Certainly Occurs BMJ. (1996) 313:944. doi: 10.1136/bmj.313.7062.944
8. Hermann, P, Weiss, B, Knakker, B, Madurka, P, Manga, A, Nárai, Á, et al. Neural basis of distractor resistance during visual working memory maintenance. NeuroImage. (2021) 245:118650. doi: 10.1016/j.neuroimage.2021.118650
9. Owen, AM, Coleman, MR, Boly, M, Davis, MH, Laureys, S, and Pickard, JD. Detecting awareness in the vegetative state. Science. (2006) 313:1402. doi: 10.1126/science.1130197
10. Cruse, D, Chennu, S, Chatelle, C, Bekinschtein, TA, Fernández-Espejo, D, Pickard, JD, et al. Bedside detection of awareness in the vegetative state: a cohort study. Lancet. (2011) 378:2088–94. doi: 10.1016/S0140-6736(11)61224-5
11. Monti, MM, Vanhaudenhuyse, A, Coleman, MR, Boly, M, Pickard, JD, Tshibanda, L, et al. Willful modulation of brain activity in disorders of consciousness. N Engl J Med. (2010) 362:579–89. doi: 10.1056/NEJMoa0905370
12. Bodien, YG, Allanson, J, Cardone, P, Bonhomme, A, Carmona, J, Chatelle, C, et al. Cognitive motor dissociation in disorders of consciousness. N Engl J Med. (2024) 391:598–608. doi: 10.1056/NEJMoa2400645
13. Vijiala, S, Epiney, JB, Jöhr, J, Pincherle, A, Meyer, MM, Du Pasquier, R, et al. Case report: behavioral unresponsiveness in acute COVID-19 patients: the utility of the motor behavior tool-revised and (18) F-FDG PET/CT. Front Neurol. (2021) 12:644848. doi: 10.3389/fneur.2021.644848
15. Stender, J, Gosseries, O, Bruno, MA, Charland-Verville, V, Vanhaudenhuyse, A, Demertzi, A, et al. Diagnostic precision of PET imaging and functional MRI in disorders of consciousness: a clinical validation study. Lancet. (2014) 384:514–22. doi: 10.1016/S0140-6736(14)60042-8
16. Bruno, MA, Majerus, S, Boly, M, Vanhaudenhuyse, A, Schnakers, C, Gosseries, O, et al. Functional neuroanatomy underlying the clinical subcategorization of minimally conscious state patients. J Neurol. (2012) 259:1087–98. doi: 10.1007/s00415-011-6303-7
17. Bruno, MA, Vanhaudenhuyse, A, Schnakers, C, Boly, M, Gosseries, O, Demertzi, A, et al. Visual fixation in the vegetative state: an observational case series PET study. BMC Neurol. (2010) 10:35. doi: 10.1186/1471-2377-10-35
18. Shulman, RG, Rothman, DL, and Hyder, F. Stimulated changes in localized cerebral energy consumption under anesthesia. Proc Natl Acad Sci USA. (1999) 96:3245–50. doi: 10.1073/pnas.96.6.3245
19. He, Z, Lu, R, Guan, Y, Wu, Y, Ge, J, Liu, G, et al. Brain metabolic connectivity patterns in patients with prolonged disorder of consciousness after hypoxic-ischemic injury: a preliminary study. Brain Sci. (2022) 12:892. doi: 10.3390/brainsci12070892
20. Laureys, S, Goldman, S, Phillips, C, Van Bogaert, P, Aerts, J, Luxen, A, et al. Impaired effective cortical connectivity in vegetative state: preliminary investigation using PET. NeuroImage. (1999) 9:377–82. doi: 10.1006/nimg.1998.0414
21. Mortensen, KN, Gjedde, A, Thompson, GJ, Herman, P, Parent, MJ, Rothman, DL, et al. Impact of global mean normalization on regional glucose metabolism in the human brain. Neural Plast. (2018) 2018:1–16. doi: 10.1155/2018/6120925
22. Wannez, S, Heine, L, Thonnard, M, Gosseries, O, and Laureys, S. The repetition of behavioral assessments in diagnosis of disorders of consciousness. Ann Neurol. (2017) 81:883–9. doi: 10.1002/ana.24962
23. Thibaut, A, Panda, R, Annen, J, Sanz, LRD, Naccache, L, Martial, C, et al. Preservation of brain activity in unresponsive patients identifies MCS star. Ann Neurol. (2021) 90:89–100. doi: 10.1002/ana.26095
24. Giacino, JT, Kalmar, K, and Whyte, J. The JFK coma recovery scale-revised: measurement characteristics and diagnostic utility. Arch Phys Med Rehabil. (2004) 85:2020–9. doi: 10.1016/j.apmr.2004.02.033
25. Paszkiel, S, and Szpulak, P. Methods of acquisition, archiving and biomedical data analysis of brain functioning. Cham: Springer International Publishing (2018).
26. Phillips, CL, Bruno, MA, Maquet, P, Boly, M, Noirhomme, Q, Schnakers, C, et al. "Relevance vector machine" consciousness classifier applied to cerebral metabolism of vegetative and locked-in patients. NeuroImage. (2011) 56:797–808. doi: 10.1016/j.neuroimage.2010.05.083
27. Stender, J, Mortensen, KN, Thibaut, A, Darkner, S, Laureys, S, Gjedde, A, et al. The minimal energetic requirement of sustained awareness after brain injury. Curr Biol. (2016) 26:1494–9. doi: 10.1016/j.cub.2016.04.024
28. Lin, J. Divergence measures based on the Shannon entropy. IEEE Trans Inf Theory. (1991) 37:145–51. doi: 10.1109/18.61115
29. Braun, AR, Balkin, TJ, Wesenten, NJ, Carson, RE, Varga, M, Baldwin, P, et al. Regional cerebral blood flow throughout the sleep-wake cycle. An H2 (15) O PET study. Brain. (1997) 120:1173–97. doi: 10.1093/brain/120.7.1173
30. Maquet, P, Degueldre, C, Delfiore, G, Aerts, J, Péters, JM, Luxen, A, et al. Functional neuroanatomy of human slow wave sleep. J Neurosci. (1997) 17:2807–12. doi: 10.1523/JNEUROSCI.17-08-02807.1997
31. Nofzinger, EA, Buysse, DJ, Miewald, JM, Meltzer, CC, Price, JC, Sembrat, RC, et al. Human regional cerebral glucose metabolism during non-rapid eye movement sleep in relation to waking. Brain. (2002) 125:1105–15. doi: 10.1093/brain/awf103
32. Shulman, RG, Hyder, F, and Rothman, DL. Baseline brain energy supports the state of consciousness. Proc Natl Acad Sci USA. (2009) 106:11096–101. doi: 10.1073/pnas.0903941106
33. Laureys, S, and Schiff, ND. Coma and consciousness: paradigms (re) framed by neuroimaging. NeuroImage. (2012) 61:478–91. doi: 10.1016/j.neuroimage.2011.12.041
34. Laureys, S, Owen, AM, and Schiff, ND. Brain function in coma, vegetative state, and related disorders. Lancet Neurol. (2004) 3:537–46. doi: 10.1016/S1474-4422(04)00852-X
35. Bodart, O, Gosseries, O, Wannez, S, Thibaut, A, Annen, J, Boly, M, et al. Measures of metabolism and complexity in the brain of patients with disorders of consciousness. Neuroimage Clin. (2017) 14:354–62. doi: 10.1016/j.nicl.2017.02.002
36. Cavanna, AE, and Trimble, MR. The precuneus: a review of its functional anatomy and behavioural correlates. Brain. (2006) 129:564–83. doi: 10.1093/brain/awl004
37. Annen, J, Frasso, G, van der Lande, GJM, Bonin, EAC, Vitello, MM, Panda, R, et al. Cerebral electrometabolic coupling in disordered and normal states of consciousness. Cell Rep. (2023) 42:112854. doi: 10.1016/j.celrep.2023.112854
38. Golkowski, D, Merz, K, Mlynarcik, C, Kiel, T, Schorr, B, Lopez-Rolon, A, et al. Simultaneous EEG-PET-fMRI measurements in disorders of consciousness: an exploratory study on diagnosis and prognosis. J Neurol. (2017) 264:1986–95. doi: 10.1007/s00415-017-8591-z
39. Edlow, BL, Claassen, J, Schiff, ND, and Greer, DM. Recovery from disorders of consciousness: mechanisms, prognosis and emerging therapies. Nat Rev Neurol. (2021) 17:135–56. doi: 10.1038/s41582-020-00428-x
Keywords: FDG-PET, disorders of consciousness, global glucose metabolism rate, diagnostic marker, CRS-R
Citation: Liu D, Wang N, Song M, Chai X, He Q, Cao T, Kong D, Song Z, Zhang G, Liu L, Wang X, Chen G, Yin S, Yang Y and Zhao J (2025) Global glucose metabolism rate as diagnostic marker for disorder of consciousness of patients: quantitative FDG-PET study. Front. Neurol. 15:1425271. doi: 10.3389/fneur.2024.1425271
Edited by:
Jitka Annen, University of Liège, BelgiumReviewed by:
Zaixu Cui, Chinese Institute for Brain Research, Beijing (CIBR), ChinaBertrand Hermann, Institut National de la Santé et de la Recherche Médicale (INSERM), France
Eren Toplutaş, Istanbul Medipol University, Türkiye
Copyright © 2025 Liu, Wang, Song, Chai, He, Cao, Kong, Song, Zhang, Liu, Wang, Chen, Yin, Yang and Zhao. This is an open-access article distributed under the terms of the Creative Commons Attribution License (CC BY). The use, distribution or reproduction in other forums is permitted, provided the original author(s) and the copyright owner(s) are credited and that the original publication in this journal is cited, in accordance with accepted academic practice. No use, distribution or reproduction is permitted which does not comply with these terms.
*Correspondence: Xiaosong Wang, d2F4aXNvQDEyNi5jb20=; Guoqiang Chen, Z3VvcV9jaGVuQHRvbS5jb20=; Shaoya Yin, eWluc3lAMTYzLmNvbQ==; Yi Yang, eWFuZ3lpXzgxbmtAMTYzLmNvbQ==
†These authors have contributed equally to this work