 Mingzhu Deng1†
 Kangping Song2†
 Wei Xu2†
 Guohua He2Jue Hu2Hui Xiao2Nina Zhou1Sufen Chen2Guilan Xu2
 Yangping Tong2Dan Zhang2
 Zhen Wang2*
 Fangyi Li2*
- 1Department of Neurology, Brain Hospital of Hunan Province, The Second People’s Hospital of Hunan Province, Changsha, China
- 2Department of Neurology, The Affiliated Changsha Central Hospital, Hengyang Medical School, University of South China, Changsha, China
Background: Insulin resistance (IR) can predict the prognosis of patients suffering from cerebrovascular disorders. The triglyceride–glucose (TyG) index and triglyceride-to-high-density lipoprotein cholesterol (TG/HDL-C) ratio have been confirmed to be easy and reliable indicators of IR. However, the relationships between the TyG index or TG/HDL-C ratio and early neurological deterioration (END) after thrombolysis in patients with acute ischemic stroke (AIS) are uncertain.
Methods: A retrospective analysis of 1,187 patients diagnosed with AIS who underwent intravenous thrombolysis between January 2018 and February 2024 was performed. Post-thrombolysis END was defined as an increase in the National Institutes of Health Stroke Scale (NIHSS) score of ≥4 within 24 h after thrombolysis. Logistic regression analysis was performed to explore the relationships of the TyG index and TG/HDL-C ratio with post-thrombolysis END. Receiver operating characteristic (ROC) analysis was used to assess the ability of the TyG index and TG/HDL-C ratio to discriminate post-thrombolysis END.
Results: Among the 1,187 recruited patients, 179 (15.08%) were diagnosed with post-thrombolysis END, and 1,008 (84.92%) were diagnosed with non-END. A binary logistic regression model indicated that the TyG index (odds ratio [OR], 2.015; 95% confidence interval [CI] 1.964–2.414, p = 0.015) and TG/HDL-C ratio (OR, 1.542; 95% CI, 1.160–2.049, p = 0.004) were independent factors for post-thrombolysis END. The area under the curve (AUC) values for the TyG index, TG/HDL-C ratio, and TyG index combined with the TG/HDL-C ratio for post-thrombolysis END were 0.704, 0.674, and 0.755, respectively.
Conclusion: This study indicates that the TyG index and TG/HDL-C ratio can be used as prognostic factors to predict post-thrombolysis END.
Introduction
Acute ischemic stroke (AIS), which is caused by sudden arterial blockage and results in neuronal damage, is the most common type of stroke (1, 2). The preferred treatment for AIS is intravenous recombinant tissue plasminogen activator in the early phase (≤4.5 h) (3, 4). Nevertheless, a minority of patients continue to experience early neurological deterioration (END) in which neurological impairments and symptoms intensify within 24 h after thrombolysis (5). END is associated with an increased risk of mortality and morbidity, and previous studies have shown that END is relevant to unfavorable long-term outcomes in AIS patients (6, 7). Therefore, it is important to investigate the risk factors and measurable indicators of post-thrombolysis END in AIS patients.
Insulin resistance (IR) is considered the primary pathophysiology of metabolic syndrome (8), which is involved in the pathogenesis of cerebrovascular diseases, mainly through endogenous fibrinolytic dysfunction, thrombosis, elevated platelet activation, and inflammation (9). The hyperinsulinemic–euglycemic clamp test is the gold standard for assessing IR. However, the high cost of this measurement limits its wide-scale clinical applicability (10). In recent years, the triglyceride–glucose (TyG) index and triglyceride-to-high-density lipoprotein cholesterol (TG/HDL-C) ratio have been established as reliable, cost-effective, and easily accessible surrogate markers for IR (11–15). According to large cohort studies, the TyG index might be a useful IR biomarker for predicting the prognosis of stroke patients (16). A higher TyG index is associated with more severe END in AIS patients (11). Moreover, prior research has demonstrated that an elevated TyG index is associated with poor outcomes after thrombolysis (9, 17, 18). However, there are conflicting relationships between metabolic syndrome and outcomes after thrombolysis (19, 20). Therefore, the relationship between the TyG index and post-thrombolysis END deserves further investigation. The TG/HDL-C ratio is an easily accessible serum biomarker and may be utilized for assessing IR (13). Previous studies have shown significant associations between the TG/HDL-C ratio and incident cardiovascular disease (13, 21). Nevertheless, a recent large-scale cohort study revealed that there was no significant correlation between TG/HDL-C and worse cardiovascular disease outcomes (12). Furthermore, few studies have investigated the correlation between the TG/HDL-C ratio and post-thrombolysis END.
The early neurological outcome after thrombolysis is related to the long-term prognosis of patients (7, 22). The correlation between the TyG index or HDL-C ratio and post-thrombolysis END remains unclear. Therefore, we investigated the associations of the TyG index and TG/HDL-C ratio with the risk of post-thrombolysis END.
Materials and methods
Study design and participants
Patients with AIS who received intravenous thrombolysis within 4.5 h were selected from Changsha Central Hospital and Hunan Province Second People’s Hospital. AIS was diagnosed using head imaging techniques, including CT and MRI, based on the 2018 Chinese guidelines for the diagnosis and treatment of acute ischemic stroke. The diagnostic criteria were as follows: (1) acute onset; (2) focal neurological deficits (weakness or numbness of one side of the face or limb, language disorder, etc.), a few of which are global neurological deficits; (3) imaging liability lesions or symptoms/signs for more than 24 h; (4) exclusion of non-vascular causes; and (5) brain CT/MRI exclusion of cerebral hemorrhage (23). The inclusion criteria were as follows: (1) admission within 4.5 h after onset, (2) treatment with intravenous thrombolysis with r-tPA, and (3) age 18 years or older. The exclusion criteria for patients were as follows: (1) discharged within 24 h, (2) intravenous thrombolysis was interrupted due to serious side effects, (3) incomplete clinical data, and (4) cerebral vascular interventional therapy. This study was approved by the Ethics Committee of Changsha Central Hospital and Hunan Province Second People’s Hospital. Between January 2018 and February 2024, 1,187 AIS patients were recruited. Figure 1 shows a detailed flow diagram for patient enrollment.
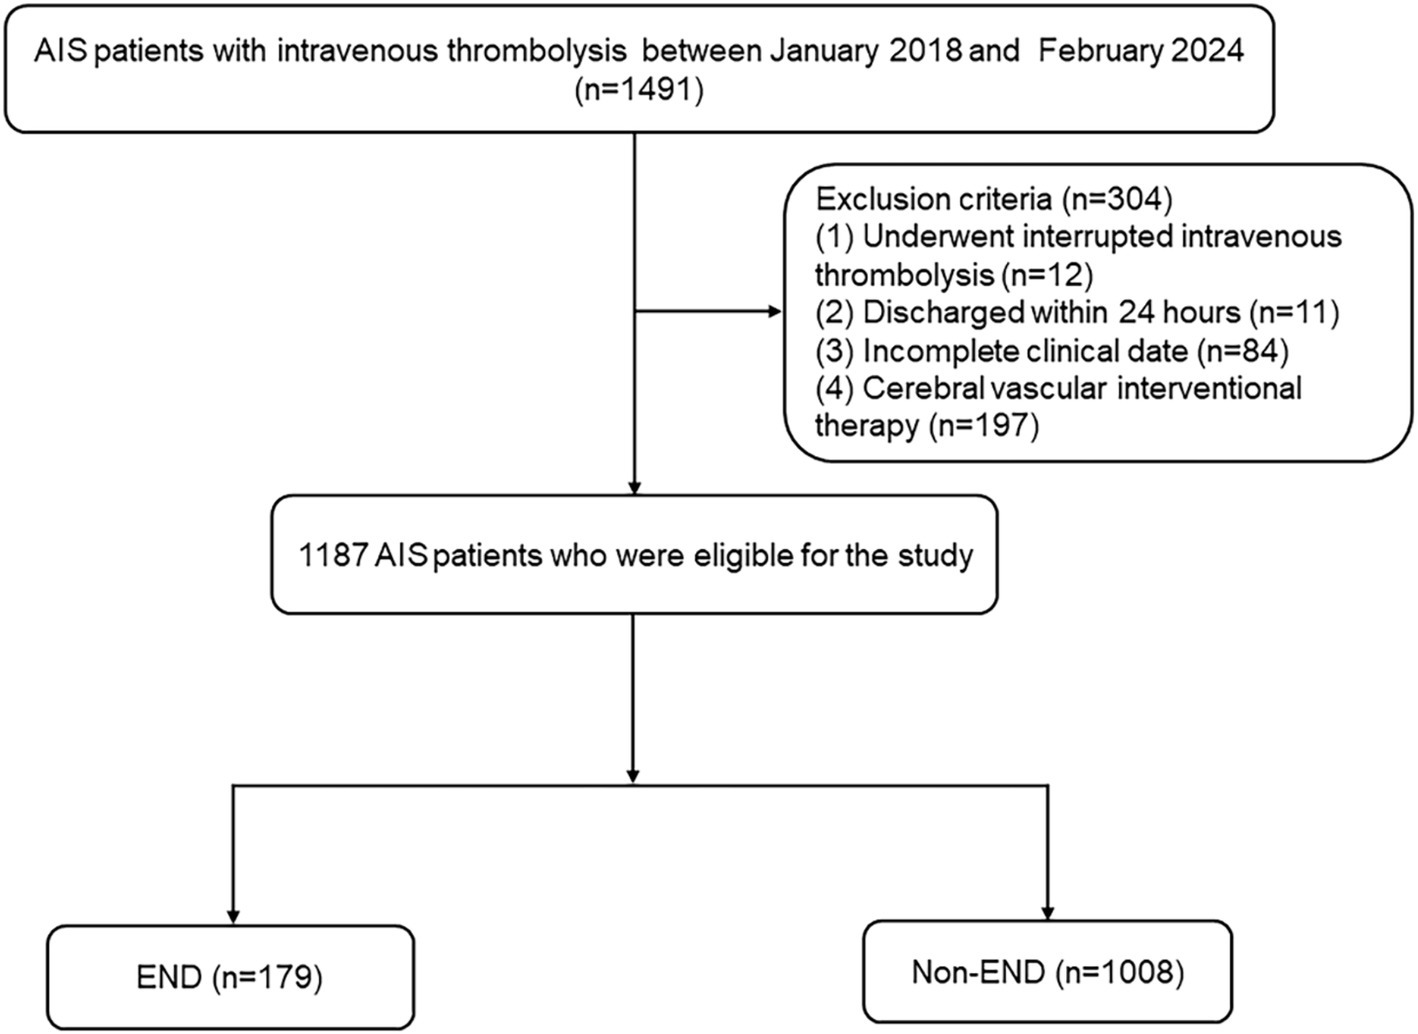
Figure 1. Study flow diagram. AIS, acute ischemic stroke; END, early neurological deterioration.
Data collection
Expert neurologists conducted the clinical evaluations in a blinded manner. The following information was collected from each participant: age, sex, body mass index, risk factors for stroke (hypertension, diabetes mellitus, atrial fibrillation, coronary artery disease, and current drinking and smoking), and clinical features (admission stroke onset severity, admission systolic blood pressure (SBP), diastolic blood pressure (DBP), onset to treatment time (OTT), and stroke subtypes). Computed tomography, magnetic resonance, electrocardiography, echocardiography, carotid ultrasonography, and transcranial Doppler were used to determine the stroke subtype. The stroke subtype was classified according to the Trial of Org 10172 in Acute Stroke Treatment criteria (24). Using a standardized case report form, the demographic information, baseline clinical parameters, clinical diagnoses, and treatment plans were meticulously gathered. The physicians or other healthcare professionals who had been in charge were consulted if any information was unclear.
Blood samples from all patients were collected at 6–7 a.m. on the day after the patients had fasted for at least 8 h. In total, 2 mL of EDTA-anticoagulated whole blood was used for routine blood tests (automated hematology analyzer, BZ6800, China). In total, 5 mL of coagulant-containing blood was used for standard biochemical examination (automatic analyzer, HITACHI 7600, Japan). Blood samples were evaluated for triglycerides (TG), total cholesterol (TC), low-density lipoprotein cholesterol (LDL-C), high-density lipoprotein cholesterol (HDL-C), and fasting blood glucose (FBG) levels. The TG/HDL-C ratio was calculated. Each blood test was conducted three times. The following formula was used to define the TyG index: Ln [TG (mg/dL) × FBG (mg/dL) ÷ 2] (25).
Definition of post-thrombolysis early neurological deterioration and symptomatic intracranial hemorrhage
The two centers’ certified neurologists were blinded to our investigation and received unified training for evaluating NIHSS scores. Post-thrombolysis END was defined as an increase in the National Institutes of Health Stroke Scale (NIHSS) score by ≥4 points in the total score within 24 h after thrombolysis (26, 27). Symptomatic intracranial hemorrhage (sICH) was defined as clinical worsening of at least 4 points on the National Institutes of Health Stroke Scale (NIHSS) score within 24 h after thrombolysis, attributed to parenchymal hematoma, subarachnoid, or intraventricular hemorrhage (28).
Statistical analysis
SPSS 25.0 (IBM SPSS Statistics software, Version 25.0) was used for data analysis. The Kolmogorov–Smirnov test was used to determine if all the data had a normal distribution. If the continuous variables were regularly distributed, they are shown as the means ± SDs; if not, they are shown as medians (quartiles). For categorical factors, the results are shown as percentages. The chi-square test or Fisher’s exact test was used for categorical variables, and Student’s t-test or the Mann–Whitney U test was used to evaluate differences in the baseline characteristics of continuous variables across groups. Logistic regression analysis was used to detect risk factors for post-thrombolysis END. A MedCalc 15.6.0 (MedCalc Software Acacialaan 22, B-8400 Ostend, Belgium) packet program was used to obtain a receiver operating characteristic (ROC) curve to test the overall ability of the TyG index and TG/HDL-C ratio to discriminate post-thrombolysis END. A two-tailed value of p < 0.05 was considered significant.
Results
Clinical and demographic characteristics of AIS patients with post-thrombolysis END and non-END
Table 1 shows the clinical and demographic characteristics of the patients in detail. The baseline characteristics of the AIS patients from the two hospitals are shown in Supplementary Table S1. In our study, post-thrombolysis END was observed in 179 patients (15.08%), and post-thrombolysis non-END was observed in 1008 patients (84.92%). In the post-thrombolysis END group, the NIHSS score after rt-PA for 24 h (p < 0.001), DBP (p = 0.026), diabetes mellitus (p = 0.014), FBG (p < 0.001), TG (P = <0.001), TC (p = 0.003), TyG index (p < 0.001), and TG/HDL-C ratio (p < 0.001) were significantly greater than those in the post-thrombolysis non-END group, whereas HDL-C (p = 0.012) was significantly lower than those in the post-thrombolysis non-END group. In the post-thrombolysis END group, the percentage of patients with symptomatic intracranial hemorrhage (sICH) was 26.82% (48/179). In addition, stroke subtype (p = 0.011) was significantly different between the two groups. Figure 2 shows the TyG index, TG/HDL-C ratio, FBG, TG, TC, and HDL-C for the two groups.
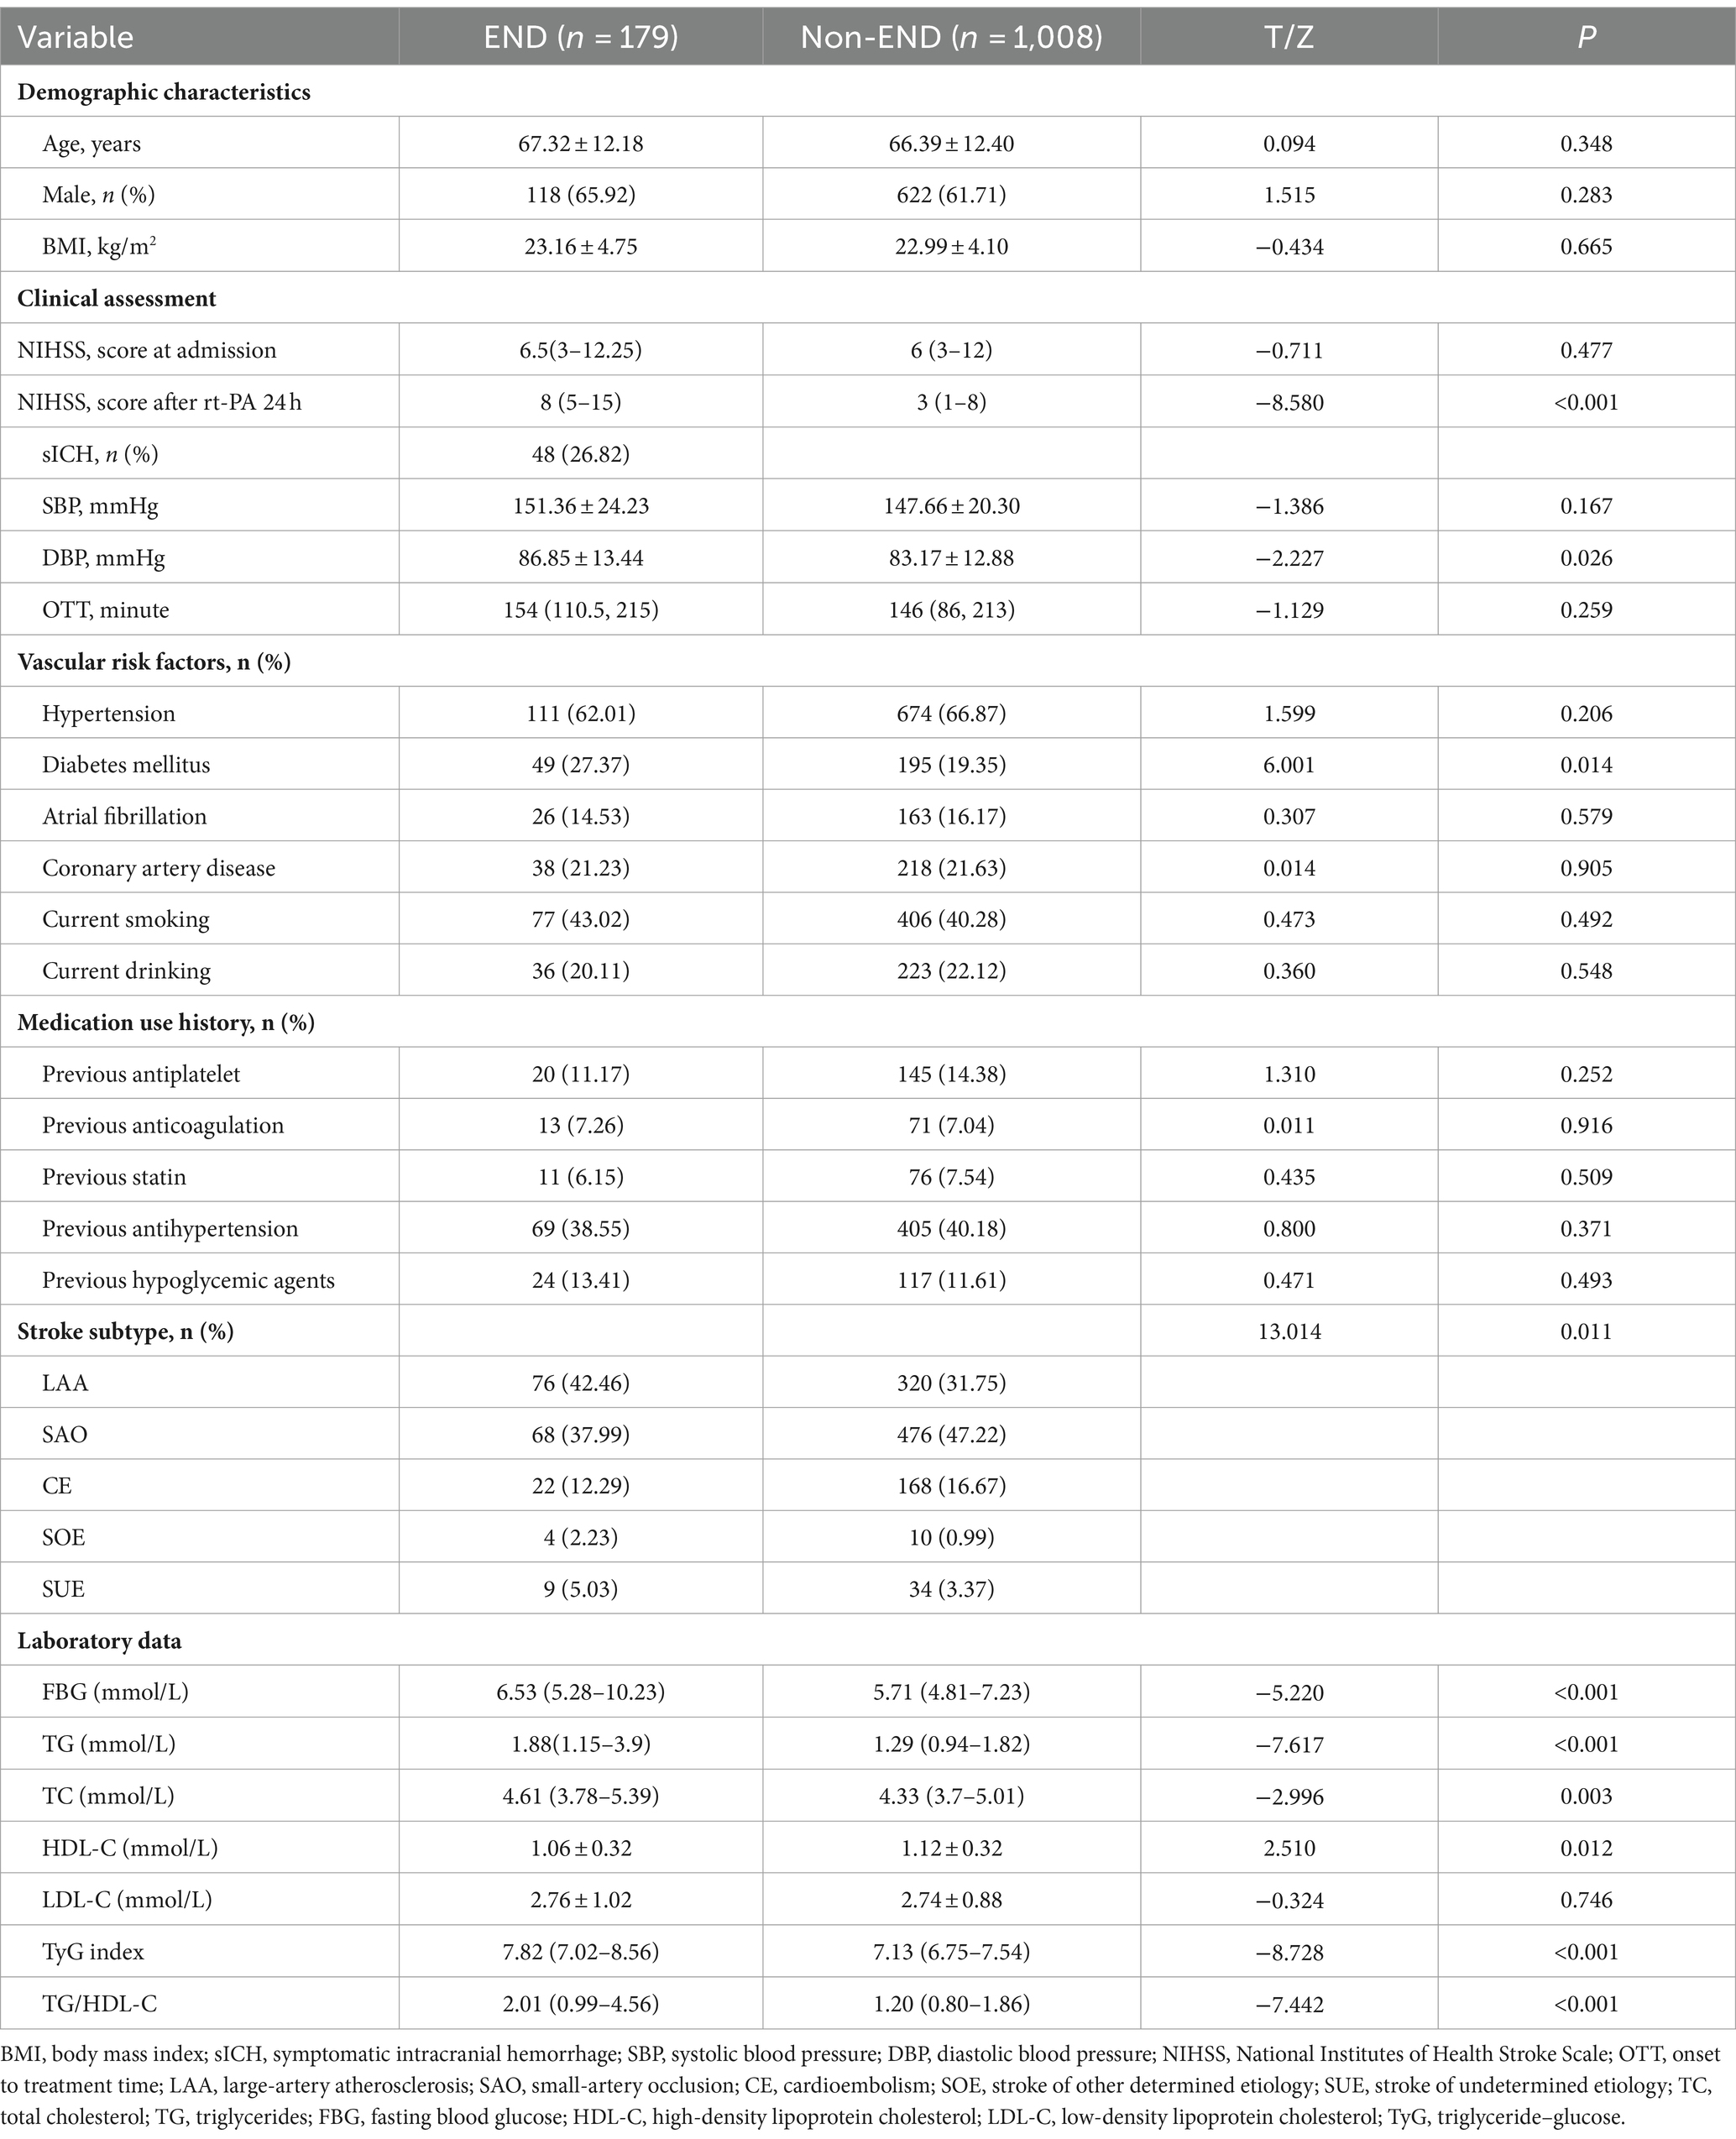
Table 1. Characteristics of AIS patients with post-thrombolysis END and non-END patients.
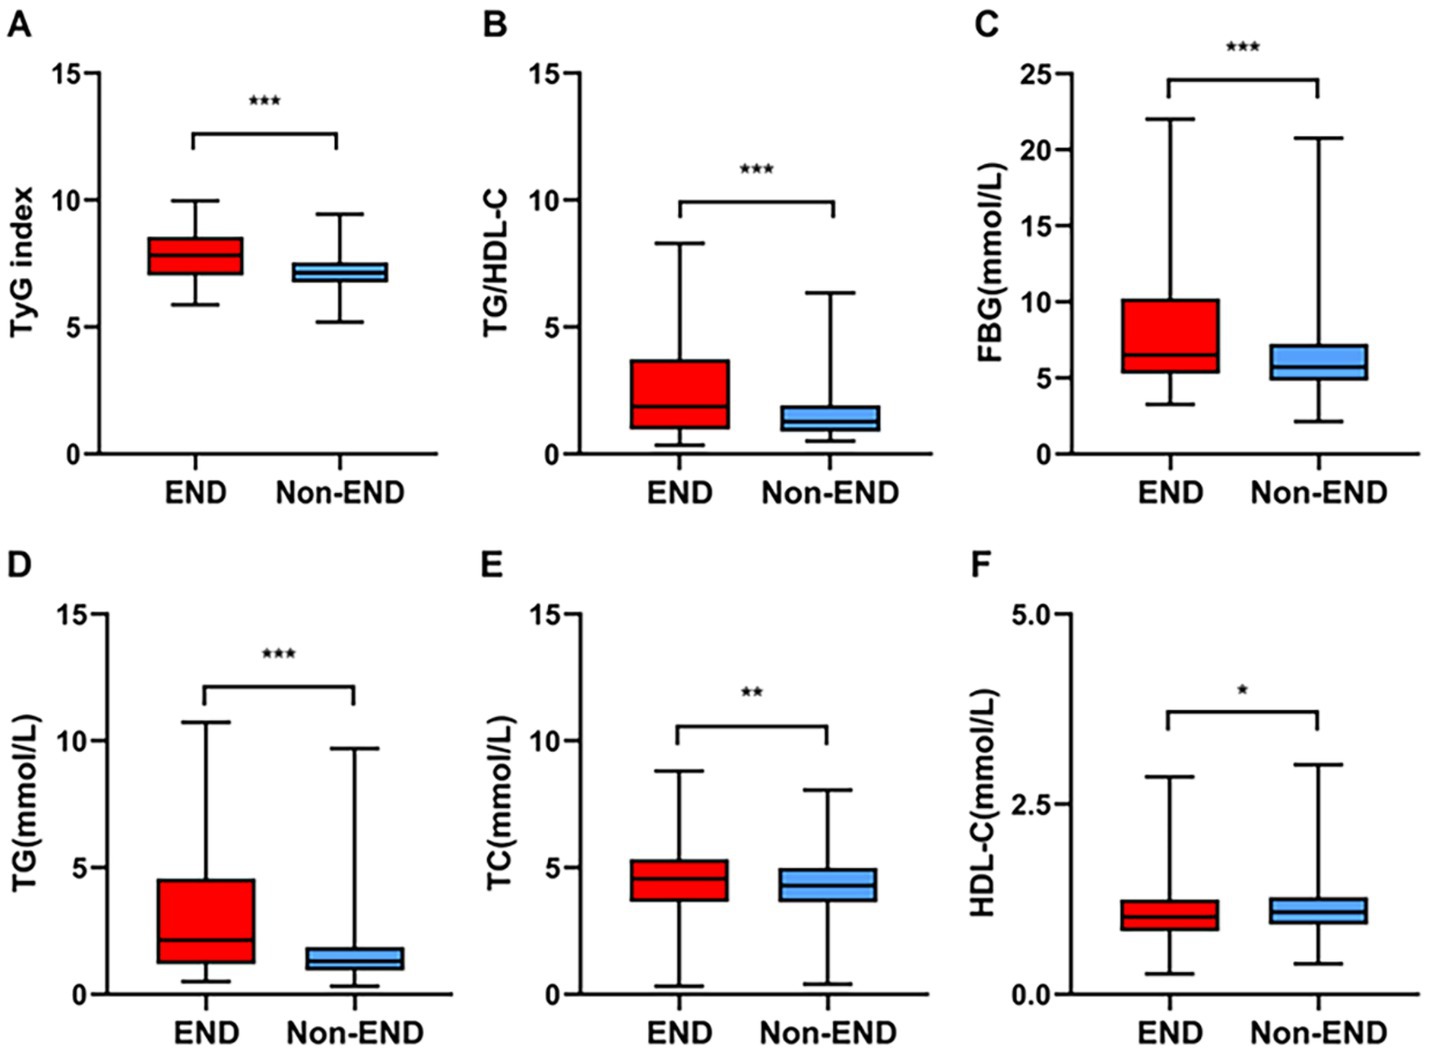
Figure 2. Comparisons of the TyG index (A), TG/HDL-C (B), FBG (C), TG (D), TC (E), and HDL-C (F) between the END and non-END groups. ***p < 0.001, **p < 0.01, *p < 0.05.
Logistic regression analysis for risk factors for post-thrombolysis END
The results of the crude models for post-thrombolysis END are displayed in Table 2. To identify independent risk factors for post-thrombolysis END, the binary logistic regression model included variables with statistical significance mentioned in Table 1. sICH, age, and the National Institutes of Health Stroke Scale (NIHSS) score are also important factors for post-thrombolysis END and should be included in multivariate analysis. There was no collinearity between the TyG index and the TG/HDL-C ratio. However, FBG, TG, and HDL-C were not included in the model because of collinearity with the TyG index and TG/HDL-C ratio. The TyG index (OR, 2.015; 95% CI 1.964–2.414, p = 0.015), TG/HDL-C ratio (OR, 1.542; 95% CI 1.160–2.049, p = 0.004), and sICH (OR, 1.815; 95% CI 1.515–2.231, p < 0.001) were identified as independent factors for post-thrombolysis END after adjustment for age, initial NIHSS score, DBP, stroke subtype, and TC (Figure 3). In addition, the TyG index (median = 7.17) and TG/HDL-C ratio (median = 1.26) were used as binary categorical variables. After adjusting for all confounding factors, the T2 subgroup was still significantly associated with post-thrombolysis END, compared to the T1 subgroup (Table 3).
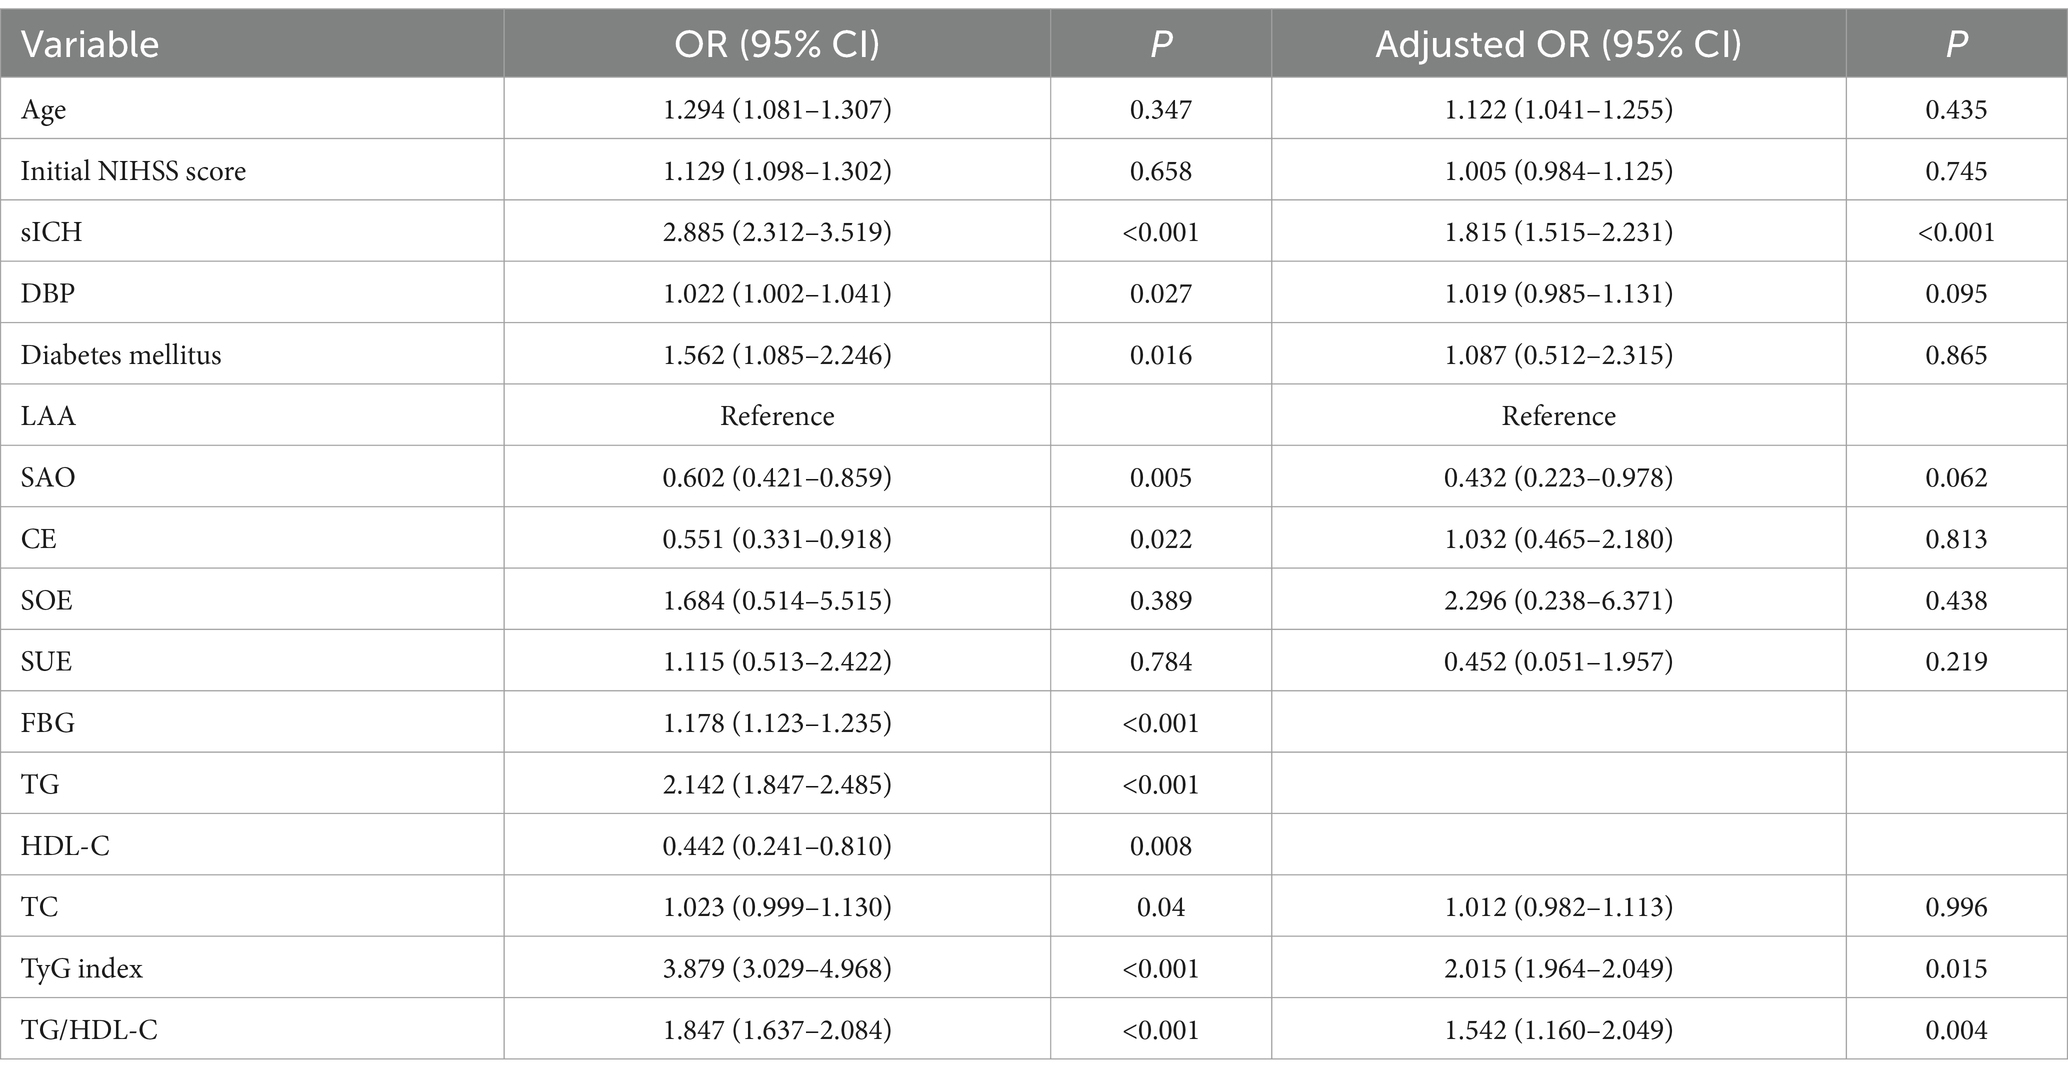
Table 2. Logistic regression analysis for risk factors for post-thrombolysis END.
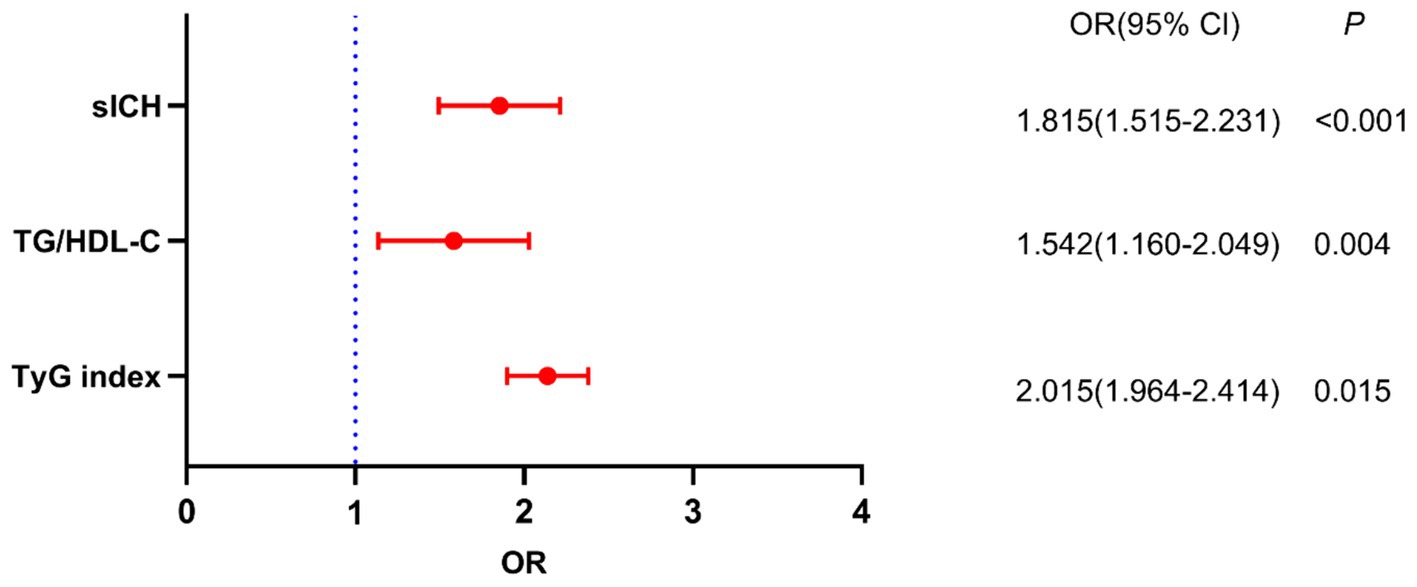
Figure 3. Binary logistic analysis of independent risk factors associated with post-thrombolysis END.

Table 3. Association of the TyG index and TG/HDL-C ratio with post-thrombolysis END.
ROC curve analysis to determine the overall ability to discriminate post-thrombolysis END
We used ROC curves to assess the overall ability of the TyG index and TG/HDL-C ratio to discriminate post-thrombolysis END (Figure 4). The TyG index’s area under the curve (AUC) for determining post-thrombolysis END was 0.704 (95% CI, 0.678–0.730; p < 0.001), and the cut-off value was 7.78, with a sensitivity of 53.1% and a specificity of 85.3%. For the TG/HDL-C ratio, the AUC was 0.674 (95% CI, 0.647–0.701; p < 0.001), and the cut-off value was 2.94, with a sensitivity of 36.3% and a specificity of 93.9%. In addition, we conducted an ROC curve analysis to assess the discriminatory power of the TyG index and TG/HDL-C ratio combination in distinguishing between the END group and the non-END group. The AUC for the combination of the TyG index and TG/HDL-C ratio was 0.755 (95% CI: 0.730–0.780, p < 0.001), and the cut-off value was 0.18, with a sensitivity of 62.6% and a specificity of 81.6%.
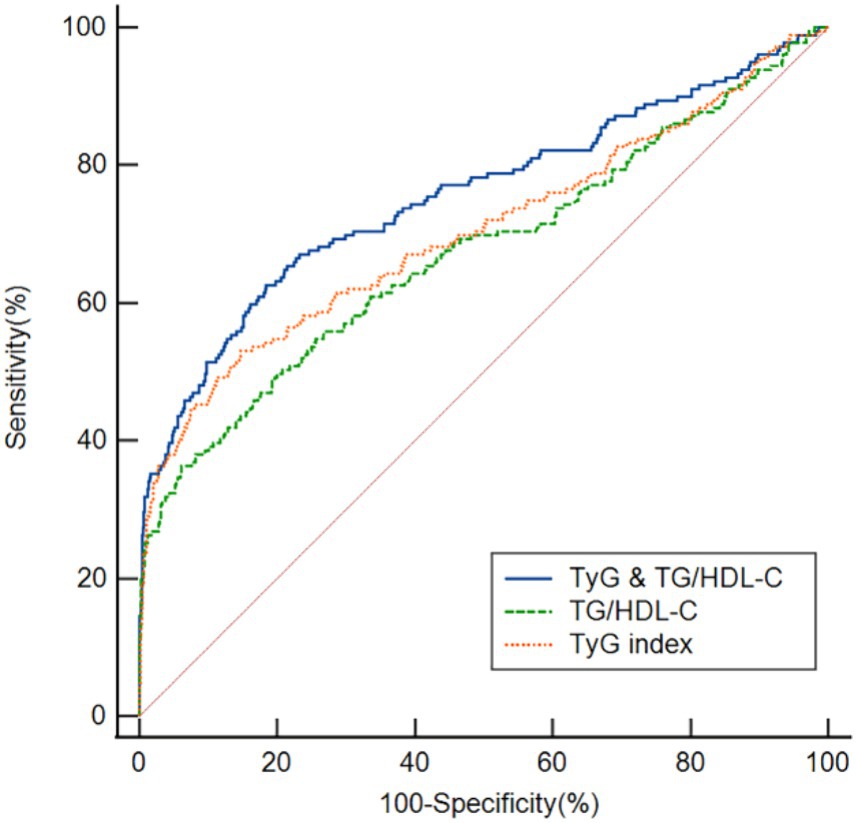
Figure 4. ROC analysis revealed that the TyG index, TG/HDL-C ratio, and TyG index and the TG/HDL-C ratio exhibited respectable post-thrombolysis END discriminating power, with AUC values of 0.704, 0.674, and 0.755, respectively.
Discussion
In our research, 179 patients (15.08%) experienced post-thrombolysis END, and the proportion was consistent with the results of previous studies (5, 9, 29). The results we obtained offer a number of fresh insights. First, we found that the TyG index and TG/HDL-C ratio in AIS patients with END were greater than those in AIS patients with non-END. Second, the binary logistic regression model indicated that the TyG index and TG/HDL-C ratio were independent factors for post-thrombolysis END. Finally, we employed ROC curves to test the overall ability of the TyG index and TG/HDL-C ratio to discriminate post-thrombolysis END. Together, these findings provide evidence that a higher TyG index and TG/HDL-C ratio are associated with post-thrombolysis END.
An increasing amount of research has demonstrated a relationship between the TyG index and the prognosis of AIS patients. The TyG index is related to arterial stiffness (30) and poor outcomes in cardiovascular and cerebrovascular diseases (31, 32). According to multicenter observational research, a higher TyG index was associated with 90-day unfavorable functional outcomes in AIS patients after thrombolysis (18). Additionally, the TyG index was related to a greater risk of in-hospital mortality in patients with severe stroke (33) and early stroke recurrence (34). In our study, the TyG index was significantly greater in the post-thrombolysis END group than in the non-END group. A binary logistic regression model indicated that the TyG index was an independent factor for post-thrombolysis END. In addition, when the TyG index was used as a categorical variable, after adjusting for confounding factors, our data revealed that a higher TyG index was associated with a greater probability of developing post-thrombolysis END, which is consistent with the findings of previous studies (9). These findings may indicate that the TyG index is a biomarker for END.
The associations between post-thrombolysis END and the TyG index can be explained by several mechanisms. First, IR may cause excessive platelet activation, exacerbate endothelial dysfunction, and cause biochemical imbalances (35, 36). Second, IR induces a variety of metabolic disorders, which promote atherosclerotic plaque rupture, leading to thrombosis (37). Third, IR can exacerbate oxidative stress, which can result in the accumulation of reactive oxygen species and mitochondrial dysfunction. Finally, IR can increase matrix metalloproteinase-9 activity, which exacerbates ischemia, reperfusion damage, and the inflammatory response (38, 39).
Based on a prior study, in the hypertensive population, an increased TG/HDL-C ratio was predictive of increased risk and advanced development of arterial stiffness (40). According to a longitudinal study, the TG/HDL-C ratio may be a significant and distinct biomarker for predicting cardiovascular disease outcomes and progression (41). Furthermore, data from the UK Biobank cohort revealed that an elevated TG/HDL-C ratio was associated with a greater risk of cardiovascular disease (13). However, the correlation between the TG/HDL-C ratio and post-thrombolysis END in patients with AIS remains unclear. In this study, in the post-thrombolysis END group, the TG/HDL-C ratio was significantly greater than that in the non-END group. Furthermore, the TG/HDL-C ratio was identified as an independent factor for post-thrombolysis END, after adjustment for potential confounders. Employing the TG/HDL-C ratio as a categorical variable, our results demonstrated that a higher TG/HDL-C ratio was related to an increased risk of post-thrombolysis END development. Our findings expand the understanding of the function of the TG/HDL-C ratio in cerebrovascular disease and provide fresh perspectives on therapeutic approaches.
In our study, the proportion of sICH in the END group was 26.82% (48/179), which is similar to the study by Yu et al. (27), and the overall percentage of patients with sICH was 4.04% (48/1,187) for all AIS patients after thrombolysis, which is consistent with earlier studies (1, 28). In this research, sICH was identified as an independent risk factor for post-thrombolysis END after adjustment for all potential confounders, which is similar to the earlier study (42). Age and the NIHSS score were also important factors for END (43). However, there was no significant correlation between age, the NIHSS score, and post-thrombolysis END in our research. We believe that the variances in the ethnicity of the research populations, the sample sizes, the medication status, and the severity of the condition may be the causes of the discrepancies between various studies.
We employed ROC curves to test the overall ability of the TyG index and TG/HDL-C ratio to discriminate post-thrombolysis END. Our research revealed that the TyG index and TG/HDL-C ratio had the ability to distinguish patients in the END group from those in the non-END group. The TyG index is more discriminative than the TG/HDL-C ratio, indicating that the TyG index might be a valuable instrument for predicting post-thrombolysis END. Moreover, our study revealed that the combination of the TyG index and TG/HDL-C ratio exhibited superior discriminatory power for post-thrombolysis END, with an AUC of 0.755. This value surpassed that of the individual markers, suggesting that the combination of these two indicators may be more beneficial in predicting post-thrombolysis END.
The limitations of this study are as follows: (1) This was a cross-sectional study with only Chinese patients receiving intravenous thrombolysis; thus, potential inherent biases exist. As a result, our findings need to be verified in non-Chinese populations, and future research may require larger-scale longitudinal cohort studies. (2) Owing to realistic limitations resulting from our clinical context, our research team did not employ a direct IR assessment tool. (3) Given that IR detection is reliant on time during the onset of AIS, early measurement may have overestimated the prevalence of IR. Future research needs to consider the effects of peripheral blood markers.
Conclusion
In conclusion, our study suggests that the TyG index and TG/HDL-C ratio can be used as prognostic factors to predict post-thrombolysis END. Additionally, the combination of the TyG index and TG/HDL-C ratio may provide greater predictive value. However, more research is needed to confirm these findings and clarify the pathophysiology of post-thrombolysis END.
Data availability statement
The raw data supporting the conclusions of this article will be made available by the authors, without undue reservation.
Ethics statement
The studies involving humans were approved by the Ethics Committee of Changsha Central Hospital and Hunan Province’s Second People’s Hospital. The studies were conducted in accordance with the local legislation and institutional requirements. Written informed consent for participation was not required from the participants or the participants’ legal guardians/next of kin in accordance with the national legislation and institutional requirements.
Author contributions
MD: Writing – original draft, Methodology, Investigation, Formal analysis, Data curation. KS: Writing – original draft, Methodology, Investigation, Funding acquisition, Formal analysis, Data curation. WX: Writing – original draft, Methodology, Funding acquisition, Formal analysis, Data curation. GH: Writing – review & editing, Supervision, Investigation, Formal analysis. JH: Writing – review & editing, Validation, Methodology, Formal analysis. HX: Writing – review & editing, Formal analysis, Data curation, Conceptualization. NZ: Writing – review & editing, Methodology, Formal analysis. SC: Writing – review & editing, Validation, Formal analysis, Conceptualization. GX: Writing – review & editing, Methodology, Data curation. YT: Writing – review & editing, Investigation, Data curation. DZ: Writing – review & editing, Data curation. ZW: Writing – review & editing, Validation, Supervision, Methodology, Formal analysis, Data curation, Conceptualization. FL: Writing – review & editing, Validation, Supervision, Resources, Project administration, Methodology, Investigation, Funding acquisition, Formal analysis, Data curation, Conceptualization.
Funding
The author(s) declare financial support was received for the research, authorship, and/or publication of this article. This study was funded by the Natural Science Foundation of Hunan Province (grant no. 2023JJ40072), the Science and Technology Planning Project of Hunan Health Committee (grant no. D202303076376), the Medical Clinical Research 4310 Project of University of South China (grant no. KJZX2021078), the Scientific Research Project of Hunan Provincial Health Commission (No. 202103070273), the Changsha Science and Technology Project (No. kzd2001068), and the Funded Project of the Affiliated Changsha Central Hospital, University of South China (No. YNKY202211).
Conflict of interest
The authors declare that the research was conducted in the absence of any commercial or financial relationships that could be construed as a potential conflict of interest.
Publisher’s note
All claims expressed in this article are solely those of the authors and do not necessarily represent those of their affiliated organizations, or those of the publisher, the editors and the reviewers. Any product that may be evaluated in this article, or claim that may be made by its manufacturer, is not guaranteed or endorsed by the publisher.
Supplementary material
The Supplementary material for this article can be found online at: https://www.frontiersin.org/articles/10.3389/fneur.2024.1421655/full#supplementary-material
References
1. Deng, M, Song, K, Tong, Y, Chen, S, Xu, W, He, G, et al. Higher fibrinogen and neutrophil-to-lymphocyte ratio are associated with the early poor response to intravenous thrombolysis in acute ischemic stroke. Front Neurol. (2024) 15:1291950. doi: 10.3389/fneur.2024.1291950
2. Campbell, BCV, and Khatri, P. Stroke. Lancet. (2020) 396:129–42. doi: 10.1016/s0140-6736(20)31179-x
3. Powers, WJ, Rabinstein, AA, Ackerson, T, Adeoye, OM, Bambakidis, NC, Becker, K, et al. Guidelines for the early Management of Patients with Acute Ischemic Stroke: 2019 update to the 2018 guidelines for the early Management of Acute Ischemic Stroke: a guideline for healthcare professionals from the American Heart Association/American Stroke Association. Stroke. (2019) 50:e344–418. doi: 10.1161/str.0000000000000211
4. Marko, M, Posekany, A, Szabo, S, Scharer, S, Kiechl, S, Knoflach, M, et al. Trends of r-tPA (recombinant tissue-type plasminogen activator) treatment and treatment-influencing factors in acute ischemic stroke. Stroke. (2020) 51:1240–7. doi: 10.1161/strokeaha.119.027921
5. Gong, P, Liu, Y, Gong, Y, Chen, G, Zhang, X, Wang, S, et al. The association of neutrophil to lymphocyte ratio, platelet to lymphocyte ratio, and lymphocyte to monocyte ratio with post-thrombolysis early neurological outcomes in patients with acute ischemic stroke. J Neuroinflammation. (2021) 18:51. doi: 10.1186/s12974-021-02090-6
6. Weyland, CS, Mokli, Y, Vey, JA, Kieser, M, Herweh, C, Schönenberger, S, et al. Predictors for failure of early neurological improvement after successful Thrombectomy in the anterior circulation. Stroke. (2021) 52:1291–8. doi: 10.1161/strokeaha.120.030519
7. Mori, M, Naganuma, M, Okada, Y, Hasegawa, Y, Shiokawa, Y, Nakagawara, J, et al. Early neurological deterioration within 24 hours after intravenous rt-PA therapy for stroke patients: the stroke acute management with urgent risk factor assessment and improvement rt-PA registry. Cerebrovasc Dis. (2012) 34:140–6. doi: 10.1159/000339759
8. Nagpal, M, De, D, Handa, S, Pal, A, and Sachdeva, N. Insulin resistance and metabolic syndrome in young Men with acne. JAMA Dermatol. (2016) 152:399–404. doi: 10.1001/jamadermatol.2015.4499
9. Zhang, B, Lei, H, Ambler, G, Werring, DJ, Fang, S, Li, H, et al. Association between triglyceride-glucose index and early neurological outcomes after thrombolysis in patients with acute ischemic stroke. J Clin Med. (2023) 12:3471. doi: 10.3390/jcm12103471
10. Tam, CS, Xie, W, Johnson, WD, Cefalu, WT, Redman, LM, and Ravussin, E. Defining insulin resistance from hyperinsulinemic-euglycemic clamps. Diabetes Care. (2012) 35:1605–10. doi: 10.2337/dc11-2339
11. Wang, J, Tang, H, Wang, X, Wu, J, Gao, J, Diao, S, et al. Association of triglyceride-glucose index with early neurological deterioration events in patients with acute ischemic stroke. Diabetol Metab Syndr. (2023) 15:112. doi: 10.1186/s13098-023-01091-0
12. He, J, Song, C, Yuan, S, Bian, X, Lin, Z, Yang, M, et al. Triglyceride-glucose index as a suitable non-insulin-based insulin resistance marker to predict cardiovascular events in patients undergoing complex coronary artery intervention: a large-scale cohort study. Cardiovasc Diabetol. (2024) 23:15. doi: 10.1186/s12933-023-02110-0
13. Che, B, Zhong, C, Zhang, R, Pu, L, Zhao, T, Zhang, Y, et al. Triglyceride-glucose index and triglyceride to high-density lipoprotein cholesterol ratio as potential cardiovascular disease risk factors: an analysis of UK biobank data. Cardiovasc Diabetol. (2023) 22:34. doi: 10.1186/s12933-023-01762-2
14. Wu, Z, Cui, H, Li, W, Zhang, Y, Liu, L, Liu, Z, et al. Comparison of three non-insulin-based insulin resistance indexes in predicting the presence and severity of coronary artery disease. Front Cardiovasc Med. (2022) 9:918359. doi: 10.3389/fcvm.2022.918359
15. Wu, Z, Cui, H, Zhang, Y, Liu, L, Zhang, W, Xiong, W, et al. The impact of the metabolic score for insulin resistance on cardiovascular disease: a 10-year follow-up cohort study. J Endocrinol Investig. (2023) 46:523–33. doi: 10.1007/s40618-022-01925-0
16. Si, S, Li, J, Li, Y, Li, W, Chen, X, Yuan, T, et al. Causal effect of the triglyceride-glucose index and the joint exposure of higher glucose and triglyceride with extensive cardio-cerebrovascular metabolic outcomes in the UK biobank: a Mendelian randomization study. Front Cardiovasc Med. (2020) 7:583473. doi: 10.3389/fcvm.2020.583473
17. Toh, EMS, Lim, AYL, Ming, C, Yeo, LLL, Sia, CH, Tan, BWQ, et al. Association of triglyceride-glucose index with clinical outcomes in patients with acute ischemic stroke receiving intravenous thrombolysis. Sci Rep. (2022) 12:1596. doi: 10.1038/s41598-022-05467-6
18. Lin, SF, Hu, HH, Chao, HL, Ho, BL, Chen, CH, Chan, L, et al. Triglyceride-glucose index and intravenous thrombolysis outcomes for acute ischemic stroke: a multicenter prospective-cohort study. Front Neurol. (2022) 13:737441. doi: 10.3389/fneur.2022.737441
19. Dorado, L, Arenillas, JF, López-Cancio, E, Hernández-Pérez, M, Pérez de la Ossa, N, Gomis, M, et al. Metabolic syndrome predicts refractoriness to intravenous thrombolysis in acute ischemic stroke. J Stroke Cerebrovasc Dis. (2015) 24:2605–12. doi: 10.1016/j.jstrokecerebrovasdis.2015.07.015
20. Bas, DF, and Ozdemir, AO. The effect of metabolic syndrome and obesity on outcomes of acute ischemic stroke patients treated with systemic thrombolysis. J Neurol Sci. (2017) 383:1–4. doi: 10.1016/j.jns.2017.10.012
21. Bertoluci, MC, Quadros, AS, Sarmento-Leite, R, and Schaan, BD. Insulin resistance and triglyceride/HDLc index are associated with coronary artery disease. Diabetol Metab Syndr. (2010) 2:11. doi: 10.1186/1758-5996-2-11
22. Yeo, LL, Paliwal, P, Teoh, HL, Seet, RC, Chan, BP, Wakerley, B, et al. Early and continuous neurologic improvements after intravenous thrombolysis are strong predictors of favorable long-term outcomes in acute ischemic stroke. J Stroke Cerebrovasc Dis. (2013) 22:e590–6. doi: 10.1016/j.jstrokecerebrovasdis.2013.07.024
23. Chinese Society of Neurology, Chinese Stroke Society . Chinese guidelines for diagnosis and treatment of acute ischemic stroke 2018. Chin J Neurol. (2018) 51:666–82. doi: 10.3760/cma.j.issn.1006-7876.2018.09.004
24. Adams, HP Jr, Bendixen, BH, Kappelle, LJ, Biller, J, Love, BB, Gordon, DL, et al. Classification of subtype of acute ischemic stroke. Definitions for use in a multicenter clinical trial. TOAST. Trial of org 10172 in acute stroke treatment. Stroke. (1993) 24:35–41. doi: 10.1161/01.str.24.1.35
25. Simental-Mendía, LE, Rodríguez-Morán, M, and Guerrero-Romero, F. The product of fasting glucose and triglycerides as surrogate for identifying insulin resistance in apparently healthy subjects. Metab Syndr Relat Disord. (2008) 6:299–304. doi: 10.1089/met.2008.0034
26. Seners, P, Ben Hassen, W, Lapergue, B, Arquizan, C, Heldner, MR, Henon, H, et al. Prediction of early neurological deterioration in individuals with minor stroke and large vessel occlusion intended for intravenous thrombolysis alone. JAMA Neurol. (2021) 78:321–8. doi: 10.1001/jamaneurol.2020.4557
27. Yu, WM, Abdul-Rahim, AH, Cameron, AC, Kõrv, J, Sevcik, P, Toni, D, et al. The incidence and associated factors of early neurological deterioration after thrombolysis: results from SITS registry. Stroke. (2020) 51:2705–14. doi: 10.1161/strokeaha.119.028287
28. Warach, SJ, Ranta, A, Kim, J, Song, SS, Wallace, A, Beharry, J, et al. Symptomatic intracranial hemorrhage with Tenecteplase vs Alteplase in patients with acute ischemic stroke: the comparative effectiveness of routine Tenecteplase vs Alteplase in acute ischemic stroke (CERTAIN) collaboration. JAMA Neurol. (2023) 80:732–8. doi: 10.1001/jamaneurol.2023.1449
29. Seners, P, Turc, G, Oppenheim, C, and Baron, JC. Incidence, causes and predictors of neurological deterioration occurring within 24 h following acute ischaemic stroke: a systematic review with pathophysiological implications. J Neurol Neurosurg Psychiatry. (2015) 86:87–94. doi: 10.1136/jnnp-2014-308327
30. Lee, SB, Ahn, CW, Lee, BK, Kang, S, Nam, JS, You, JH, et al. Association between triglyceride glucose index and arterial stiffness in Korean adults. Cardiovasc Diabetol. (2018) 17:41. doi: 10.1186/s12933-018-0692-1
31. Ma, X, Dong, L, Shao, Q, Cheng, Y, Lv, S, Sun, Y, et al. Triglyceride glucose index for predicting cardiovascular outcomes after percutaneous coronary intervention in patients with type 2 diabetes mellitus and acute coronary syndrome. Cardiovasc Diabetol. (2020) 19:31. doi: 10.1186/s12933-020-01006-7
32. Kim, J, Shin, SJ, and Kang, HT. The association between triglyceride-glucose index, cardio-cerebrovascular diseases, and death in Korean adults: a retrospective study based on the NHIS-HEALS cohort. PLoS One. (2021) 16:e0259212. doi: 10.1371/journal.pone.0259212
33. Zhang, B, Liu, L, Ruan, H, Zhu, Q, Yu, D, Yang, Y, et al. Triglyceride-glucose index linked to hospital mortality in critically ill stroke: an observational multicentre study on eICU database. Front Med (Lausanne). (2020) 7:591036. doi: 10.3389/fmed.2020.591036
34. Nam, KW, Kwon, HM, and Lee, YS. High triglyceride-glucose index is associated with early recurrent ischemic lesion in acute ischemic stroke. Sci Rep. (2021) 11:15335. doi: 10.1038/s41598-021-94631-5
35. Barale, C, and Russo, I. Influence of Cardiometabolic risk factors on platelet function. Int J Mol Sci. (2020) 21:623. doi: 10.3390/ijms21020623
36. Hill, MA, Jaisser, F, and Sowers, JR. Role of the vascular endothelial sodium channel activation in the genesis of pathologically increased cardiovascular stiffness. Cardiovasc Res. (2022) 118:130–40. doi: 10.1093/cvr/cvaa326
37. Yang, Y, Huang, X, Wang, Y, Leng, L, Xu, J, Feng, L, et al. The impact of triglyceride-glucose index on ischemic stroke: a systematic review and meta-analysis. Cardiovasc Diabetol. (2023) 22:2. doi: 10.1186/s12933-022-01732-0
38. Oh, J, Riek, AE, Darwech, I, Funai, K, Shao, J, Chin, K, et al. Deletion of macrophage vitamin D receptor promotes insulin resistance and monocyte cholesterol transport to accelerate atherosclerosis in mice. Cell Rep. (2015) 10:1872–86. doi: 10.1016/j.celrep.2015.02.043
39. Chen, W, Wang, S, Lv, W, and Pan, Y. Causal associations of insulin resistance with coronary artery disease and ischemic stroke: a Mendelian randomization analysis. BMJ Open Diabetes Res Care. (2020) 8:e001217. doi: 10.1136/bmjdrc-2020-001217
40. Wu, Z, Zhou, D, Liu, Y, Li, Z, Wang, J, Han, Z, et al. Association of TyG index and TG/HDL-C ratio with arterial stiffness progression in a non-normotensive population. Cardiovasc Diabetol. (2021) 20:134. doi: 10.1186/s12933-021-01330-6
41. Salazar, MR, Carbajal, HA, Espeche, WG, Aizpurúa, M, Dulbecco, CA, and Reaven, GM. Comparison of two surrogate estimates of insulin resistance to predict cardiovascular disease in apparently healthy individuals. Nutr Metab Cardiovasc Dis. (2017) 27:366–73. doi: 10.1016/j.numecd.2016.12.002
42. Mao, XL, He, SS, Lin, CD, Huang, XD, and Sun, J. Analysis of clinical characteristics and influencing factors of early neurological deterioration in patients with mild stroke by intravenous Alteplase therapy. Neurologist. (2024). doi: 10.1097/nrl.0000000000000553 [Epub ahead of print].
Keywords: acute ischemic stroke, intravenous thrombolysis, triglyceride–glucose index, triglyceride-to-high-density lipoprotein cholesterol ratio, early neurological deterioration
Citation: Deng M, Song K, Xu W, He G, Hu J, Xiao H, Zhou N, Chen S, Xu G, Tong Y, Zhang D, Wang Z and Li F (2024) Association of higher triglyceride–glucose index and triglyceride-to-high-density lipoprotein cholesterol ratio with early neurological deterioration after thrombolysis in acute ischemic stroke patients. Front. Neurol. 15:1421655. doi: 10.3389/fneur.2024.1421655
Edited by:
Raffaele Ornello, University of L’Aquila, ItalyCopyright © 2024 Deng, Song, Xu, He, Hu, Xiao, Zhou, Chen, Xu, Tong, Zhang, Wang and Li. This is an open-access article distributed under the terms of the Creative Commons Attribution License (CC BY). The use, distribution or reproduction in other forums is permitted, provided the original author(s) and the copyright owner(s) are credited and that the original publication in this journal is cited, in accordance with accepted academic practice. No use, distribution or reproduction is permitted which does not comply with these terms.
*Correspondence: Zhen Wang, ZG9jd3oyMDA3QDE2My5jb20=; Fangyi Li, NDc1MDQwOTQyQHFxLmNvbQ==
†These authors have contributed equally to this work and share first authorship