 Yijin Gang
 Tao Li1
 Weiping Wang
- 1School of Human Settlements and Civil Engineering, Xi'an Jiaotong University, Xi'an, China
- 2Department of Cardiovascular Medicine, Henan Province People's Hospital, Zhengzhou, Henan, China
- 3School of Computer and Communication Engineering, University of Science and Technology Beijing, Beijing, China
- 4Shunde Innovation School, University of Science and Technology Beijing, Foshan, China
Alpha rhythm slowing is an important electroencephalogram(EEG) feature associated with (AD). This study aims to understand the correlation between alpha band deceleration and molecular changes from the perspective of neural computing. Considering the effect of Aβ amyloid deposition on the inhibitory changes in the thalamic, a thalamic cortical model coupled with Aβ amyloid is established. The results show that Aβ amyloid deposition may induce neurotoxicity in thalamic reticular nucleus neurons, which results in inhibitory changes in the thalamus and slows the alpha rhythm of EEG output from the thalamus. In order to understand the pathogenesis more intuitively, some numerical simulations are provided to illustrate the obtained theories. This research is helpful to understand the pathogenesis of AD, so as to provide theoretical basis for the intervention and control of the disease.
1 Introduction
As a common degenerative neurological disease, Alzheimer's disease (AD) seriously threatens human health (1). Statistics show that about 50%–60% of dementia patients are related to AD. It is caused by many complex factors, and its phenomenon is mainly manifested in the decline of cognitive ability (2). Therefore, the early diagnosis and clinical intervention of AD have attracted great attention of the society. At present, the neuronal mechanisms related to the pathogenesis of AD remain unclear. Modeling can help to understand the temporal and spatial characteristics of various neurological diseases, so as to predict dynamic trends(3). To gain a clearer understanding of the biomolecular and neuron-related mechanisms of AD, many people are increasingly turning their attention to computational models related to neurological or psychiatric disorders(4).
The slowing of alpha band is a common biomarker of AD (5, 6). Therefore, many computational models based on neural field are proposed to simulate EEG signals (7, 8). Bhattacharya found that inhibitory neuronal population plays an important role in normal brain activity by using the computational model of thalamic cortical neuronal population loop related to AD (9). Recently, Stefanovski incorporated the effect of Aβ amyloid on neuronal population dynamics into the Jason Ritter network model through neural computing method,which linked Aβ amyloid related synaptic disinhibition to specific alpha rhythm slowing in EEG. The neurobiological processes more directly related to the pathogenesis can be identified by neural computing model (10). The inhibitory effect of thalamic reticular nucleus neuronal population (TRN) on thalamic relay nucleus neuronal population (TCR) and the deinhibitory effect of Aβ amyloid protein on inhibitory neuronal population provide ideas for the realization of inhibitory damage in this study.
The aggregated Aβ amyloid and its related intermediates cause damage to the inhibitory synaptic plasticity in the neural circuit (11–13). This suggests that the impairment of inhibitory neuronal populations in the brain network leads to Alzheimer's disease (14). In Stefanovski's study, only the disinhibition of Aβ protein deposition on the inhibitory interneuron population in the cortical module was considered, resulting in the overexcitation of excitatory pyramidal neuron population. However, some studies have shown that thalamic relay nucleus neurons have excitatory relay effects on pyramidal neurons (15). Based on the inhibitory effect of the inhibitory thalamic reticular nucleus on the thalamic relay nucleus (16), we decided to integrate the mapping function of Aβ amyloid protein in Stefanovski's study into the thalamic reticular nucleus of the thalamic module to achieve disinhibition.
According to the above effect of Aβ amyloid on inhibitory neurons, the ratio of excitability to inhibition time constant of thalamic cortical circuit model can also simulate the effect of Aβ amyloid on inhibitory neurons. All these make it possible to simulate the disinhibition affected by Aβ amyloid in the thalamic cortical circuit. Meanwhile,the model can well simulate EEG of brain. The specific steps of this study are as follows. First, we introduced a thalamic cortical model influenced by Aβ amyloid and obtained preliminary simulation results. Then the effects of Aβ amyloid and synaptic connection parameters on the power spectrum from the model output is discussed. Finally, this study is summarized.
2 Methods
According to the introduction, our goal is to map the effect of Aβ amyloid deposition to the thalamic cortical neural calculation model proposed by Bhattacharya (9). The model consists of TCR representing excitatory neuron population and TRN representing inhibitory neuron population. TRN neuron population has inhibitory projection to TCR neuron population. On the contrary, TCR neuron population has excitatory feedback to TRN neuron population and they communicate through synapses (17, 18) Based on Stefanovski's recent research (10), we tried to map the effect of Aβ amyloid deposition on the inhibition time constant to the inhibitory neuron population in the thalamic cortical neural calculation model. The thalamic cortical equation and the mapping function equation from Aβ amyloid to inhibition time constant are as follows.
In the model equation, xret,xtcr and xtrn are the state variables of retina, thalamic relay nucleus and thalamic reticular nucleus respectively. He,Hi represent the synaptic strength of excitatory and inhibitory postsynaptic potential. τe is the excitability time parameter. τi(βa) is the inhibitory time parameter affected by Aβ amyloid deposition. Each connectivity parameter Ci: i={1,2,3} represents the connectivity parameter generated by presynaptic neuron group. C1 represents the excitatory connection from relay nucleus to reticular nucleus Cnte, C2 represents the inhibitory connection from reticular nucleus to relay nucleus Ctni, and C3 represents the external excitatory input of relay nucleus Ctre. The exogenous input of thalamus module is represented by P(t). With mean μrand variance ϕr, Gaussian white noise is used to simulate P(t). The average potential of the post synaptic is converted into action potential pulse density by a sigmoid function S(·). the maximum discharge rate is 2e0 and s0 the discharge threshold. The slope of S(·) is ν. See Table 1 for specific parameter values.
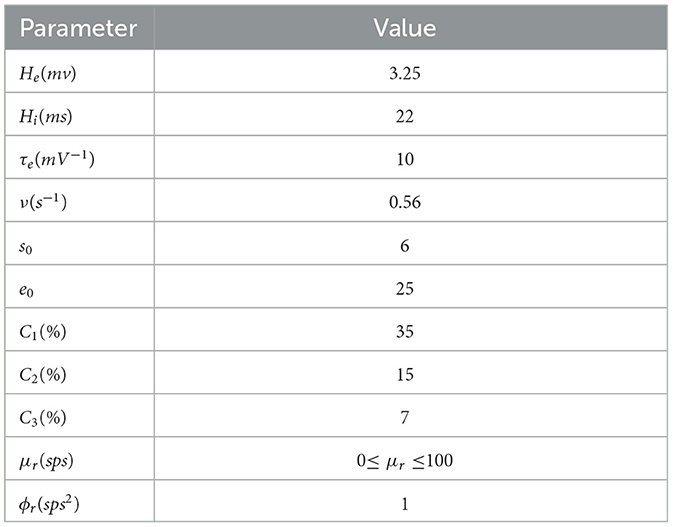
Table 1. The relevant parameters are defined in Equations (1)–(5), and all parameters are derived from the relevant work of Bhattacharya et al. (9).
The output is the post-synaptic potential of the TRN in the model, in which its equation is defined as:
The mapping function of amyloid Aβ to inhibitory time constant:
In the mapping function of Aβ amyloid to inhibitory time constant, βa is the current local Aβ amyloid load measured by PET. βa, off is the threshold cut-off value of Aβ amyloid, which is used to distinguish normal and pathological Abeta load. βa, max is the maximum possible load value of βa amyloid detected by PET in the population. Sigmoid function S1(·) is a continuously differentiable decreasing conversion function, which is used to convert the load value of βa detected by PET into inhibitory time constant τi(βa) and realize the mapping from Aβ amyloid to inhibitory time constant. rβa and β0 are the slope and midpoint of sigmoid function respectively. Aβ amyloid loading affects the inhibitory time constant, which follows the sigmoid function curve. The variation changes from Smin to Smax. Therefore, the inhibitory dendritic time constant τi(βa) varies from 1/Smax to 1/Smin. See Table 2 for specific parameter values.
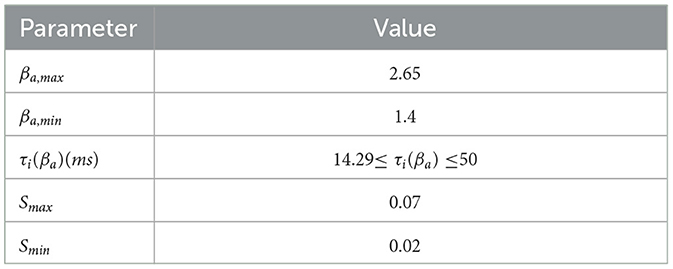
Table 2. The specific values of the parameters defined in Equations (6), (7), and the values of all parameters are derived from stefanovski's relevant work (10).
The related equations defined in the model are calculated in MATLAB by fourth-order/fifth-order Runge-Kutta method. The total simulation time is 30s. The parameter values of each population were repeated for 20 times to generate the membrane potential of thalamic relay nucleus neurons and the average value was taken to ensure the accuracy of statistics. It is necessary to better extract the features of EEG signal by computer technology analysis and other auxiliary techniques. The power spectrum analysis of EEG signals is an useful means to study Alzheimer's disease (19). To get the power spectral density of alpha (8–13Hz) frequency band of thalamic output, we analyzed the membrane potential of thalamic relay nucleus neuron population: (1) The membrane potential is sampled and bandpass filtered by a butterworth filter. (2) Welch period graph method is used to calculate the power spectrum (20).
3 Results
3.1 Regulate Aβ amyloid standardized uptake value ratio (SUVR) βa
Stefanovski showed that the standardized uptake value ratio (SUVR) of Aβ amyloid affects the inhibitory time constant of inhibitory neuron population. The SUVP is expressed as parameter βa in the above formula (10). In this study, the inhibitory time constant is affected by changing the deposition amount of Aβ amyloid in the thalamic cortical model. The alpha rhythm of the model output signal is observed.
When βa is lower than the clinical critical value of 1.4, the τi(βa) is not affected. the corresponding τi(βa) is 14.29ms(21). Therefore, we default that the τi(βa) = 14.29ms is not affected by Aβ amyloid. This study believes that there is no abnormal pathology in such brain regions. When βa is between 1.4 and 1.95, the corresponding τi(βa) is between 14.29ms and 20ms. In this state, these regions correspond to moderate plogical state of Aβ amyloid in the brain region. When βa is between 1.96 and 2.15, the corresponding τi(βa) is between 20ms and 28ms. At this time, these areas are moderate to severe Aβ amyloid pathological state (21). When there is a serious pathological state of Aβ amyloid in the brain region,the time constant is greater than 28ms. βa will be greater than 2.15.
When the mean value μr of input noise is arbitrarily selected, the power spectral density analysis is performed based on the signal output from the above model. Figure 1 demonstrates the influences of βa on the peak power of the signal output from the model. The change range of βa is 1.4-5.0, which corresponds to the state of normal to seriously abnormal pathological brain. The experimental results show that when the noise mean value μr is randomly selected, the peak power output from the calculation model decreases with the increase of βa, and finally tends to be relatively stable.

Figure 1. When μr={70,80,90,100}, the variation trend of the peak power of the signal output from the model with the change of βa.
This study further analyzes the effect of Aβ amyloid on thalamic cortical model. Figure 2 shows the time series of signals output under the influence of Aβ amyloid. Figure 3 demonstrates the power spectral of the model output signal corresponding to some values. It can be seen from the figure that with the increase of Aβ amyloid deposition in thalamus, the corresponding peak power and dominant frequency within alpha band decrease. It can also be seen from the figure that this change is very small in moderate diseases, but very significant in the pathology of severe diseases. As can be seen from Figure 4, with the increase of parameter related to Aβ amyloid in the model, the power of each frequency band within alpha band decreases. The result shows that when the parameter related to Aβ amyloid increased in the thalamic cortical model, the alpha rhythm output from the model slowed down.
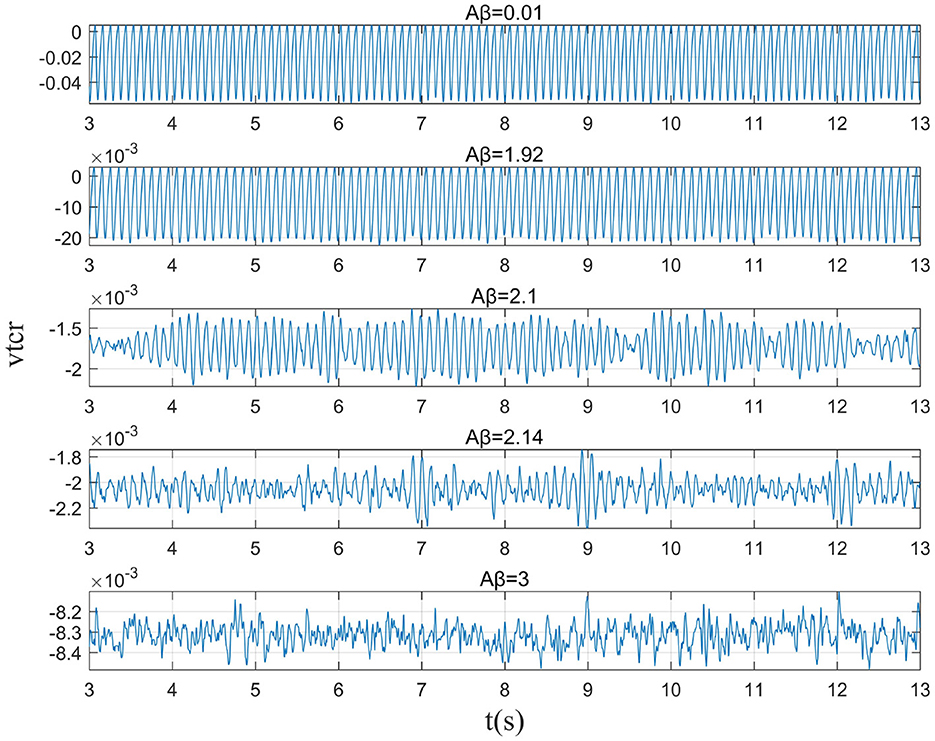
Figure 2. When μr=86, the time series of the signal output from the model when βa={0.001,1.92,2.10,2.14,3.00}.

Figure 3. When μr=86, power spectral density of the signal output from the model when βa={0.001,1.92,2.10,3.00}.
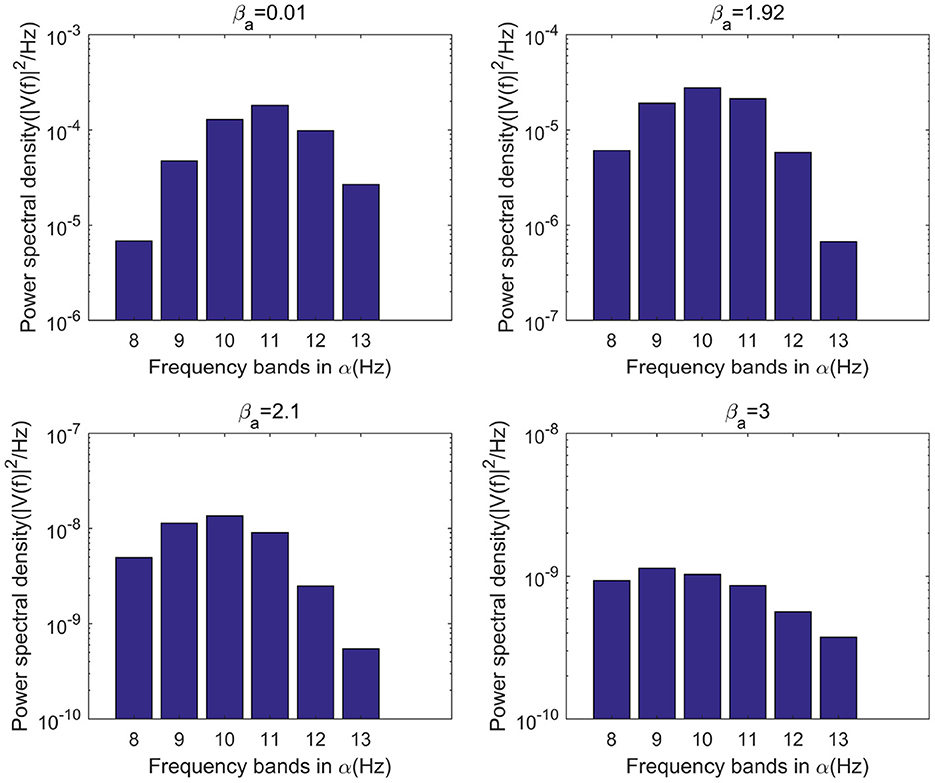
Figure 4. When μr=86, bar graph of power of each frequency band within α frequency band of the signal output from the model when βa={0.01,1.92,2.10,3.00}.
3.2 Regulate the synaptic connection parameter C1 from TCR to TRN
In Bhattacharya's study, the increase of excitability parameter C1 indicates that the synaptic activity of TCR neurons to TRN neurons is increased (22) In this section, the value of excitability parameter C1 was changed between 0 and 100 in the state of moderate to severe disease. Then the effect on the alpha band was observed through power spectrum analysis.
In moderate to severe illness, C1 value is increased on the basis of excitability parameter C1 = 35. Alpha band power is analyzed through power spectrum analysis. It can be observed from Figure 5 that with the increase of C1 value, the corresponding alpha band peak power in the power spectrum increases significantly. The time series corresponding to the EEG signal output from the model is shown in Figure 6. The results showed that in moderate to severe disease, the increase of the excitatory synaptic activity in the afferent pathway from TCR neuron population to TRN neuron population can lead to peak power within alpha band increase significantly. This may indicate that when Aβ amyloid deposition destroys the inhibitory of TRN neuron population, excitatory synaptic activity of TRN neuron population afferent pathway can enhance the inhibitory of TRN neuron population.
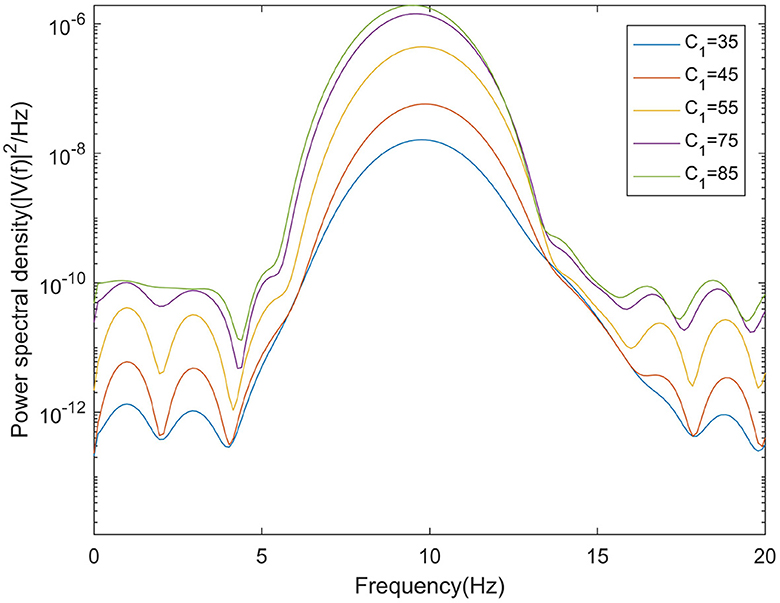
Figure 5. When μr = 86, βa = {2.10}, the power spectral of the signal output from the model varying with C1.

Figure 6. When μr = 86,βa = {2.10}, the time series of the signal output from the model varying with C1.
3.3 Regulate Gaussian white noise mean μr
The mean μr of Gaussian white noise is a key parameter in the sensory pathway of thalamic cortical model. Higher input value means that the activity of sensory pathway increases, which may indicate the recovery of sensory information related to eye opening. Therefore, this section explores the effect of μr on the peak power of the alpha band by adjusting the mean μr of Gaussian white noise in the moderately to severely ill states.
This section mainly simulates the enhancement of external stimuli by increasing the mean value of Gaussian white noise based on μr = 86. The corresponding changes of EEG signal and peak power spectrum is observed under different mean values μr. With the increase of μr, the growth of the peak power in the alpha band can be seen from Figure 7. The result shows that in moderate to severe diseases, the increase of external stimulation of TCR neurons could significantly increase the peak power spectrum of alpha band. It can be observed in Figure 8 that the time series corresponding to the mean values of different input noise.
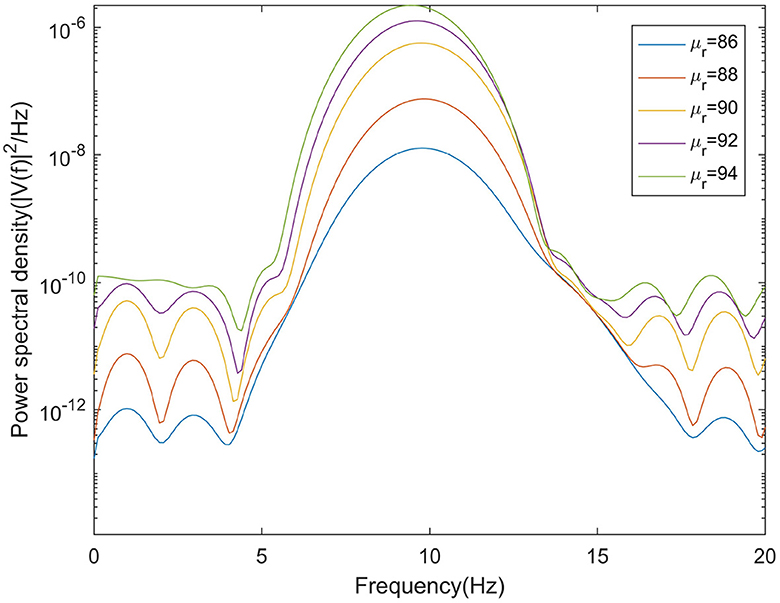
Figure 7. When βa = {2.10}, the power spectral of the signal output from the model varying with μr.
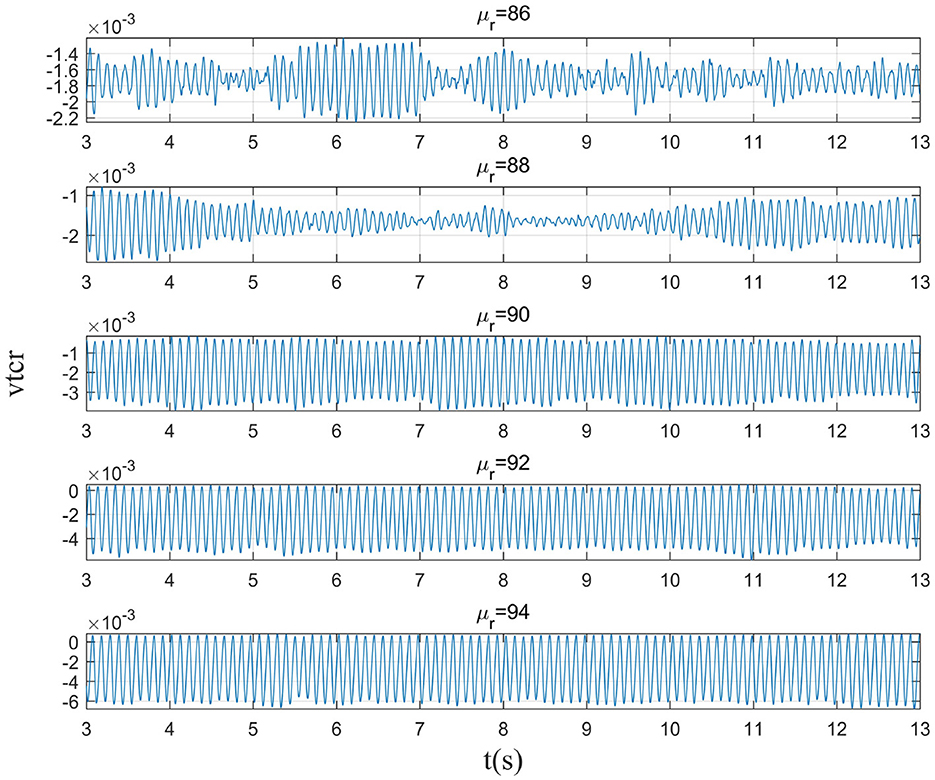
Figure 8. When βa = {2.10}, the time series of the signal output from the model varying with μr.
4 Conclusions
This study mainly consideres the neurotoxicity of Aβ amyloid deposition to thalamic reticular nucleus, giving rise to damage on TRN inhibitory function. This study firstly consideres the effect of Aβ amyloid deposition on the inhibition time constant of thalamic reticular nucleus, and integrated it into the thalamic cortical circuit model. By increasing the parameter βa related to the content of Aβ amyloid deposition, the disinhibitory neuropathology of Alzheimer's disease caused by Aβ amyloid deposition is simulated. Then the power spectrum of the signal output from the thalamus is analyzed to explore the potential neural mechanism related to the abnormal changes of alpha band.
The results show that thalamic reticular nucleus neuron population play an important role in maintaining normal thalamic concussion. Aβ amyloid deposition will produce neurotoxicity to thalamic reticular nucleus neuron population, resulting in inhibitory damage. The peak power spectral as well as dominant frequency in the α band are reduced.
In addition, in moderate to severe disease, the increase of excitatory synaptic activity in the afferent pathway from TCR to TRN promotes the increase of the peak power in the α band. This may indicate that increasing the excitatory input in the afferent pathway of TRN neuron population can enhance the inhibitory function of TRN neuron population. By increasing the mean value μr of excitatory input in the sensory pathway, the power spectral in the α band also increased significantly.
5 Despite the notable findings, the study has limitations
This study investigates the impact of Aβ amyloid deposition on the inhibition time constant of the thalamic reticular nucleus (TRN) and utilizes power spectrum analysis to explore the potential neural mechanisms related to abnormal changes in the alpha band, providing a valuable perspective for understanding the neuropathology of Alzheimer's disease (AD). Although this research offers important insights into the role of Aβ amyloid deposition in AD, the pathology of AD involves a broader range of factors, including tau protein aggregation, neuroinflammation, and oxidative stress. This study focuses on the effects of Aβ amyloid and does not account for these factors that could offer additional insights into the causes of AD. In future research, a more comprehensive model will be developed that includes key factors beyond Aβ amyloid deposition to more fully simulate the complex pathology of AD. The development of such an integrated model will aid in a deeper understanding of the multifactorial pathological mechanisms of AD and in exploring new therapeutic strategies.
Data availability statement
The original contributions presented in the study are included in the article/supplementary material, further inquiries can be directed to the corresponding author.
Author contributions
YG: Investigation, Writing—review & editing. TL: Writing—review & editing. XX: Writing—review & editing. QZ: Writing—original draft, Writing—review & editing. WW: Writing—review & editing.
Funding
The author(s) declare financial support was received for the research, authorship, and/or publication of this article. This work was supported in part by Ministry of Industry and Information Technology High Quality Special Project under Grant TC220A04A-182, in part by the National Natural Science Foundation of China under Grant 62271045.
Conflict of interest
The authors declare that the research was conducted in the absence of any commercial or financial relationships that could be construed as a potential conflict of interest.
Publisher's note
All claims expressed in this article are solely those of the authors and do not necessarily represent those of their affiliated organizations, or those of the publisher, the editors and the reviewers. Any product that may be evaluated in this article, or claim that may be made by its manufacturer, is not guaranteed or endorsed by the publisher.
References
1. Peng Y, Chang X, Lang M. Iron homeostasis disorder and Alzheimer's disease. Int J Mol Sci. (2021) 22:12442. doi: 10.3390/ijms222212442
2. Trejo-Lopez JA, Yachnis AT, Prokop S. Neuropathology of Alzheimer's disease. Neurotherapeutics. (2023) 19:173–85. doi: 10.1007/s13311-021-01146-y
3. Gao C, Liu J. Network-based modeling for characterizing human collective behaviors during extreme events. IEEE Trans Syst Man Cybern. (2016) 47:171–83. doi: 10.1109/TSMC.2016.2608658
4. Sperling RA, Donohue MC, Raman R, Rafii MS, Johnson K, Masters CL, et al. Trial of solanezumab in preclinical Alzheimer's disease. N Engl J Med. (2023) 389:1096–107. doi: 10.1056/NEJMoa2305032
5. Namazi H. Information-based classification of electroencephalography (EEG) signals for healthy adolescents and adolescents with symptoms of Schizophrenia. Fluctuat Noise Lett. (2020) 19:2050033. doi: 10.1142/S0219477520500339
6. Hsu CF, Chao HH, Yang AC, Yeh CW, Hsu L, Chi S. Discrimination of severity of Alzheimer's disease with multiscale entropy analysis of EEG dynamics. Appl Sci. (2020) 10:1244. doi: 10.3390/app10041244
7. Glomb K, Cabral J, Cattani A, Mazzoni A, Raj A, Franceschiello B. Computational models in electroencephalography. Brain Topograp. (2021) 35:142–61. doi: 10.1007/s10548-021-00828-2
8. Ruiz-Gómez SJ, Hornero R, Poza J, Maturana-Candelas A, Pinto N, Gómez C. Computational modeling of the effects of EEG volume conduction on functional connectivity metrics. Application to Alzheimer's disease continuum. J Neural Eng. (2019) 16:066019. doi: 10.1088/1741-2552/ab4024
9. Bhattacharya BS, Cakir Y, Serap-Sengor N, Maguire L, Coyle D. Model-based bifurcation and power spectral analyses of thalamocortical alpha rhythm slowing in Alzheimer's Disease. Neurocomputing. (2013) 115:11–22. doi: 10.1016/j.neucom.2012.10.023
10. Stefanovski L, Triebkorn P, Spiegler A, Diaz-Cortes MA, Solodkin A, Jirsa V, et al. Linking molecular pathways and large-scale computational modeling to assess candidate disease mechanisms and pharmacodynamics in Alzheimer's disease. Front Comput Neurosci. (2019) 13:54. doi: 10.3389/fncom.2019.00054
11. Xu Y, Zhao M, Han Y, Zhang H. GABAergic inhibitory interneuron deficits in Alzheimer's disease: implications for treatment. Front Neurosci. (2020) 14:660. doi: 10.3389/fnins.2020.00660
12. Mucke L, Selkoe DJ. Neurotoxicity of amyloid β-protein: synaptic and network dysfunction. Cold Spring Harb Perspect Med. (2012) 2:a006338. doi: 10.1101/cshperspect.a006338
13. Poddar MK, Banerjee S, Chakraborty A, Dutta D. Metabolic disorder in Alzheimer's disease. Metab Brain Dis. (2021) 36:781–813. doi: 10.1007/s11011-021-00673-z
14. Rayaprolu S, Higginbotham L, Bagchi P, Watson CM, Zhang T, Levey AI, et al. Systems-based proteomics to resolve the biology of Alzheimer's disease beyond amyloid and tau. Neuropsychopharmacology. (2021) 46:98–115. doi: 10.1038/s41386-020-00840-3
15. Cona F, Lacanna M, Ursino M, A. thalamo-cortical neural mass model for the simulation of brain rhythms during sleep. J Comput Neurosci. (2014) 37:125–48. doi: 10.1007/s10827-013-0493-1
16. Wolff M, Morceau S, Folkard R, Martin-Cortecero J, Groh A, A. thalamic bridge from sensory perception to cognition. Neurosci Biobehav Rev. (2021) 120:222–35. doi: 10.1016/j.neubiorev.2020.11.013
17. Sen Bhattacharya B, Durrant SJ. A neural mass computational framework to study synaptic mechanisms underlying alpha and theta rhythms. In: Computational Neurology and Psychiatry. Cham: Springer. (2017). p. 405–427.
18. Bhattacharya BS, Coyle D, Maguire LP, A. thalamo-cortico-thalamic neural mass model to study alpha rhythms in Alzheimer's disease. Neural networks. (2011) 24:631–45. doi: 10.1016/j.neunet.2011.02.009
19. Elgandelwar SM, Bairagi VK. Power analysis of EEG bands for diagnosis of Alzheimer disease. Int J Med Eng Inform. (2021) 13:376–85. doi: 10.1504/IJMEI.2021.117728
20. Khosla A, Khandnor P, Chand T. A comparative analysis of signal processing and classification methods for different applications based on EEG signals. Biocybernet Biomed Eng. (2020) 40:649–90. doi: 10.1016/j.bbe.2020.02.002
21. Murray ME, Lowe VJ, Graff-Radford NR, Liesinger AM, Cannon A, Przybelski SA, et al. Clinicopathologic and 11C-Pittsburgh compound B implications of Thal amyloid phase across the Alzheimer's disease spectrum. Brain. (2015) 138:1370–81. doi: 10.1093/brain/awv050
Keywords: Aβ amyloid protein, Alzheimer's disease, inhibitory neuron population, alpha rhythm, EEG
Citation: Gang Y, Li T, Xu X, Zheng Q and Wang W (2024) Research on the pathogenesis of Alzheimer's disease based on thalamocortical computational model. Front. Neurol. 15:1353305. doi: 10.3389/fneur.2024.1353305
Received: 10 December 2023; Accepted: 11 April 2024;
Published: 24 April 2024.
Edited by:
Keping Yu, Hosei University, JapanReviewed by:
Yuan Wang, Beijing Normal University, ChinaHui Zhao, University of Jinan, China
Sijia Li, Beijing Information Technology College, China
Copyright © 2024 Gang, Li, Xu, Zheng and Wang. This is an open-access article distributed under the terms of the Creative Commons Attribution License (CC BY). The use, distribution or reproduction in other forums is permitted, provided the original author(s) and the copyright owner(s) are credited and that the original publication in this journal is cited, in accordance with accepted academic practice. No use, distribution or reproduction is permitted which does not comply with these terms.
*Correspondence: Weiping Wang, d2VpcGluZ3dhbmdqdEB1c3RiLmVkdS5jbg==