
94% of researchers rate our articles as excellent or good
Learn more about the work of our research integrity team to safeguard the quality of each article we publish.
Find out more
ORIGINAL RESEARCH article
Front. Neurol., 14 February 2024
Sec. Sleep Disorders
Volume 15 - 2024 | https://doi.org/10.3389/fneur.2024.1303978
This article is part of the Research TopicRising Stars in Insomnia 2023View all 3 articles
 Trevor Winger1,2
 Vidhya Chellamuthu1Dmytro Guzenko3Mark Aloia4,5Shawn Barr1Susan DeFranco4Brandon Gorski4Faisal Mushtaq1
 Gary Garcia-Molina1,6*
Introduction: Insomnia causes serious adverse health effects and is estimated to affect 10–30% of the worldwide population. This study leverages personalized fine-tuned machine learning algorithms to detect insomnia risk based on questionnaire and longitudinal objective sleep data collected by a smart bed platform.
Methods: Users of the Sleep Number smart bed were invited to participate in an IRB approved study which required them to respond to four questionnaires (which included the Insomnia Severity Index; ISI) administered 6 weeks apart from each other in the period from November 2021 to March 2022. For 1,489 participants who completed at least 3 questionnaires, objective data (which includes sleep/wake and cardio-respiratory metrics) collected by the platform were queried for analysis. An incremental, passive-aggressive machine learning model was used to detect insomnia risk which was defined by the ISI exceeding a given threshold. Three ISI thresholds (8, 10, and 15) were considered. The incremental model is advantageous because it allows personalized fine-tuning by adding individual training data to a generic model.
Results: The generic model, without personalizing, resulted in an area under the receiving-operating curve (AUC) of about 0.5 for each ISI threshold. The personalized fine-tuning with the data of just five sleep sessions from the individual for whom the model is being personalized resulted in AUCs exceeding 0.8 for all ISI thresholds. Interestingly, no further AUC enhancements resulted by adding personalized data exceeding ten sessions.
Discussion: These are encouraging results motivating further investigation into the application of personalized fine tuning machine learning to detect insomnia risk based on longitudinal sleep data and the extension of this paradigm to sleep medicine.
Insomnia is a highly prevalent sleep disorder, affecting 10–30% of the general population (1), which is characterized by difficulty with sleep initiation, weakened sleep maintenance, and/or waking-up too early (1). Insomnia can cause significant distress for those who experience symptoms and has been bidirectionally associated with adverse health consequences such as heart disease, elevated blood pressure, neurological conditions, chronic pain, gastrointestinal problems (2), depression, and anxiety (2). Insomnia can be intermittent, i.e., it is interspersed with occasional good rebound nights. This can give the patient a false sense of remission which may cause low reporting of insomnia to the healthcare system.
Despite its high prevalence, insomnia is underrecognized, underdiagnosed, and undertreated (3). Latest progress in machine learning and the use of consumer sleep technologies may be helpful to alleviate underdiagnosis of multiple sleep disorders including insomnia.
Previous categorization of insomnia into primary and secondary (or comorbid) insomnia has been abandoned (4). Instead, the phenotypes of sleep onset insomnia (difficulty falling asleep), sleep maintenance insomnia (difficulty staying asleep), early morning awakening insomnia, and a combination of those are considered. Another categorization considers the duration of insomnia symptoms and identifies three categories acute (shorter than a month), subacute (1 to 3 months), and chronic insomnia (longer than 3 months) (5).
The Insomnia Severity Index (ISI) is the only instrument currently in use that allows for severity classification depending on a numerical score (6). The ISI has not yet been validated to identify a specific insomnia phenotype, but the identification of insomnia risk can be defined as the ISI exceeding a threshold (7).
Table 1 summarizes some of the approaches in the state-of-the-art to detect insomnia. Park et al. (8) used actigraphy and demographic data with neural-net based clustering techniques to identify five clusters associated with distinct Insomnia endotypes. Rodríguez-Morilla et al. (9) used physiological and body position data along with environmental light exposure to predict primary insomnia using a decision tree model. MRI data were used by Spiegelhalder et al. (10) and Li et al. (11), with a Support Vector Machine classifier. Andrillon et al. (12) leveraged Polysomnography (PSG) to detect chronic insomnia, achieving a high Cohen's κ score of 0.87 using a CaRET (Classification and Regression Training) model. Shahin et al. (13) used EEG data and Support Vector Machines, achieving a high F1 score (0.88) in predicting primary insomnia.
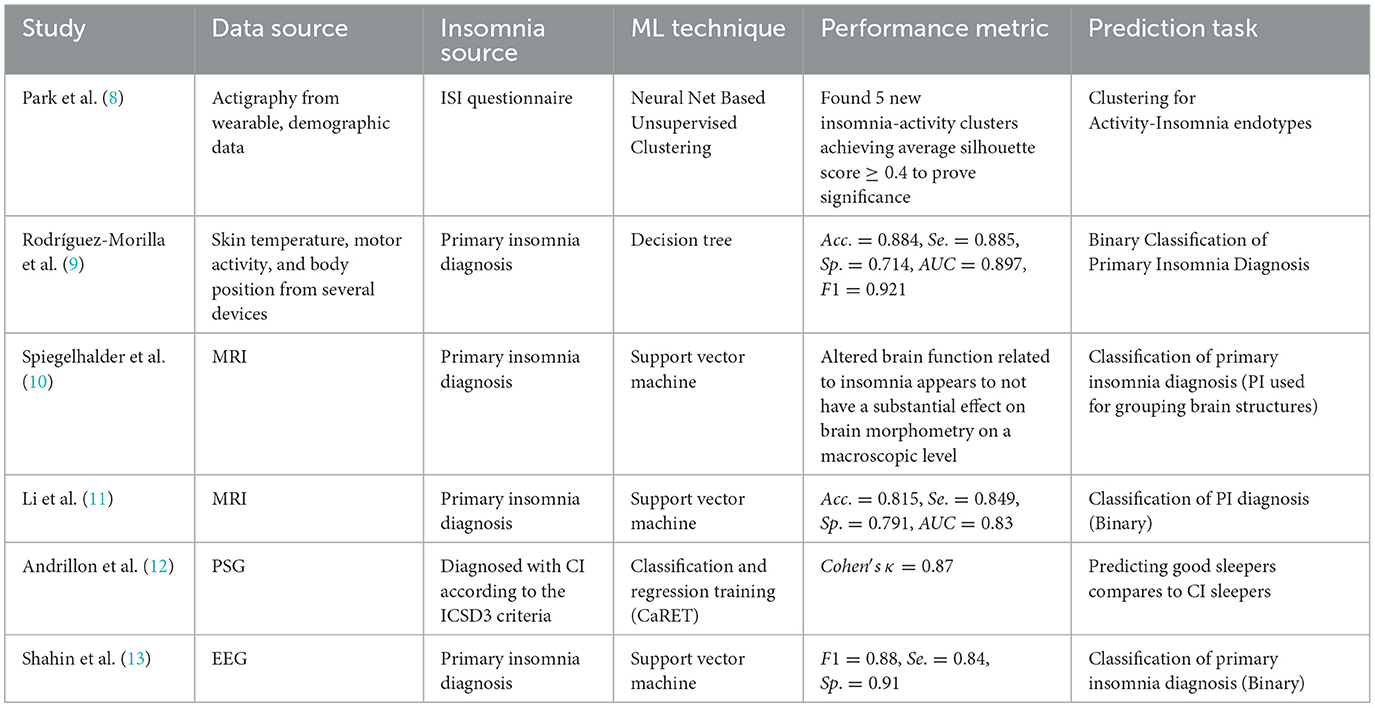
Table 1. State-of-the-art of machine learning algorithms applied to insomnia.
Among the various consumer sleep technologies, it is reasonable to assume that “nearables” which do not require the sleeper to wear any monitor (14) have the potential to reflect real-life longitudinal sleep trends enabling the detection of sleep disturbances and early interventions. This study leveraged the capabilities of a smart bed platform to unobtrusively collect longitudinal objective sleep data and questionnaire responses from a large cohort of individuals to build personalized machine learning models to detect insomnia risk.
Individuals enrolled in the study are owners of a Sleep Number smart bed who consented to participate in an IRB approved study which consisted in responding to four electronically delivered questionnaires and allowing the use of objective sleep data collected by the smart bed platform. The four questionnaires were presented to the enrolled participants on November 22, 2021, January 3, 2022, February 14, 2022, and March 28, 2022 respectively. Each questionnaire was active for two weeks. The objective sleep data were collected between October 21, 2021 and March 31, 2022.
Demographic information including age and gender were collected in the first questionnaire. Each questionnaire was composed of five validated instruments, insomnia severity index (6), Epworth sleepiness scale (ESS) (15), reduced morningness-eveningness questionnaire (16), general anxiety disorder GAD-7 (17), and the patient health questionnaire PHQ-8 (18). The ISI and ESS were administered under a utilization license provided by Mapi Research Trust.
To quantify insomnia risk, we focused on the ISI which is a seven-question instrument designed to assess the severity of both daytime and nighttime components of insomnia. The responses to the 7 ISI questions in a scale from 0 to 4, are added up to obtain a total score which indicates, no clinical significant insomnia if the score is lower than 8, subthreshold insomnia if the score is between 8 and 14, clinical insomnia if the score is between 15 and 21, and severe clinical insomnia if the score is between 22 and 28 (6). For convenience, the total ISI score is simply referred to as ISI in the rest of the paper.
Sleep session data are collected on a daily basis by the smart bed using the technology and algorithms described in Siyahjani et al. (19). The smart bed, validated against polysomnography (19), uses a pressure sensor to capture high-resolution full body ballistocardiography to accurately measure breathing rate, heart rate and movements to derive session data. The smart bed uses a pressure sensor for each sleeper on the bed.
Sleep session data include (see Table 2) the session duration which corresponds to time in bed, the number of bed exits, sleep duration, duration of restful sleep (which was detected based on the level of motion), time to fall asleep (TTFA) once the participant entered the bed, the percentage of time with high (above a given threshold) level motion, sleep quality score, sleep debt which is the difference (if positive) between and individual's sleep duration goal minus their actual sleep duration, sleep regularity which characterizes the probability of an individual of being awake or asleep at any given two points in time separated 24 h apart [using an adaptation of the procedure presented in Lunsford-Avery et al. (20)], and mean cardiorespiratory metrics such as respiratory rate, heart rate, and heart rate variability. The feature vector used to train the machine learning model has 14 components listed in Table 2 (see also Figure 3).

Table 2. Features and description.
On a daily basis, the smart bed consolidated sleep sessions whose end and begin times were not separated by more than two hours. Sleep sessions separated by more than two hours were considered as individual sessions. For each day, only the longest sleep session was kept for analysis.
Starting from 5,444 enrolled participants, the number of respondents to questionnaires 1 to 4 were 3,729, 3,743, 3,596, and 3,273 respectively. The number of participants that responded to at least three surveys was 2,986. The final dataset for analysis consisted of the data from 1,489 participants [mean age 51.72 (SD: 12.77) years-old; 669 Men and 811 Women] who had at least 120 sessions in the period from October 21, 2021 to March 31, 2022. This process is illustrated in Figure 1.
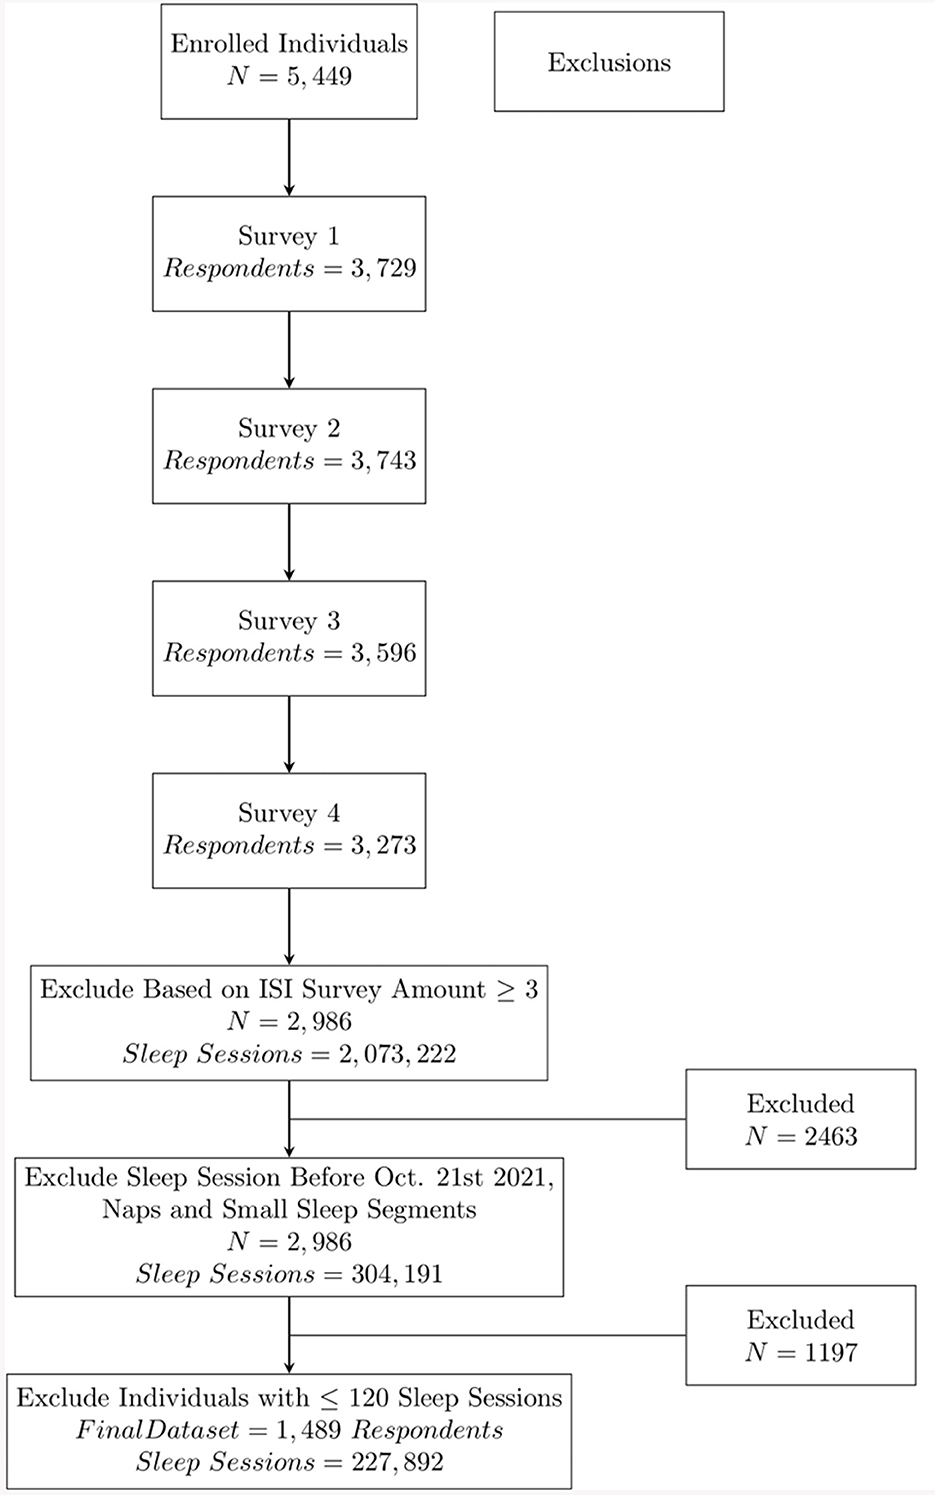
Figure 1. Data inclusion procedure.
To detect insomnia risk, three thresholds on the ISI (8, 10, and 15) were considered. As mentioned in Section 2.1, the thresholds 8 and 15 distinguish no insomnia vs. any level of insomnia and non-severe insomnia vs. severe insomnia respectively. The ISI threshold of 10 was used by Oh et al. (7) to quantify insomnia risk.
Each sleep session had an ISI value assigned according to the following criteria (see also Figure 2). For each session before the second questionnaire, the ISI is that of the first questionnaire. If the response to the first questionnaire is missing, then all sessions before the second session have the ISI value of the second questionnaire. For each sleep session after the last questionnaire answered by the participant, the score is the ISI of the last questionnaire. In-between, the sleep sessions between the n-th questionnaire and the (n+1)-th questionnaire have the ISI corresponding to that of the n-th questionnaire.
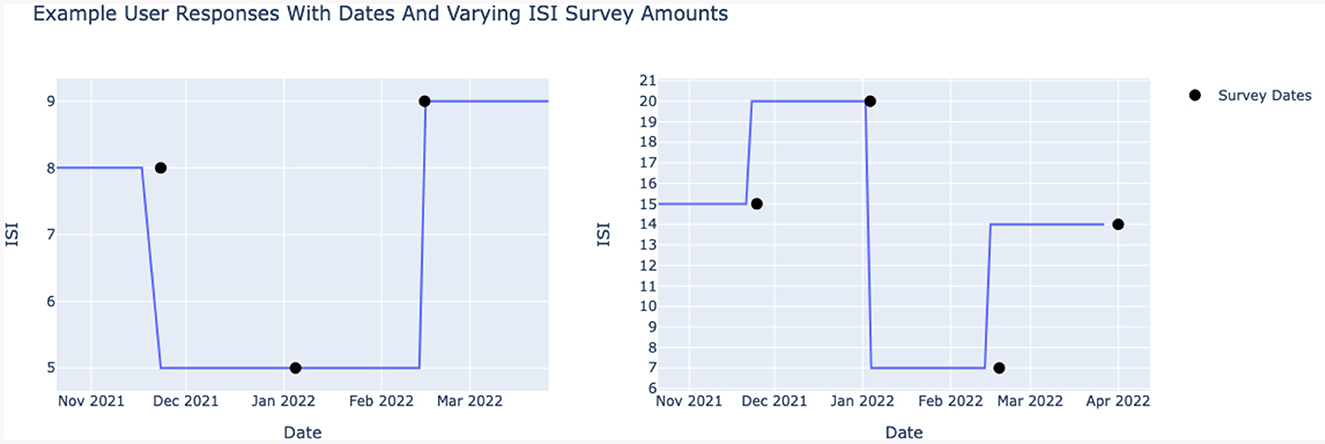
Figure 2. Example of respondent ISI score assignment to sleep sessions.
In machine learning, the idea of improving a model by transferring information from a related domain is referred to as transfer learning (21). A related concept is that of fine tuning where a generic model is incrementally trained to optimally perform in specific scenarios. The incremental training uses a small amount of training data from the targeted specific scenario.
We leveraged the transfer learning idea along with the leave-one-subject-out cross-validation (LOOCV) technique where the data from all but one subject are used to train a model which is tested on the data from the left-out subject. For each of the 1480 subjects in our dataset, we trained a generic passive-aggressive model (see Section 2.6) using the data from all other subjects, and we personalized the model using sleep session data from 1, 5, 10, 20, 30, 40, 50, and 60 days of the left-out subject (see also Figure 3). This is illustrated in Figure 4. The rest of the data from the left-out subject was used to evaluate the model performance.
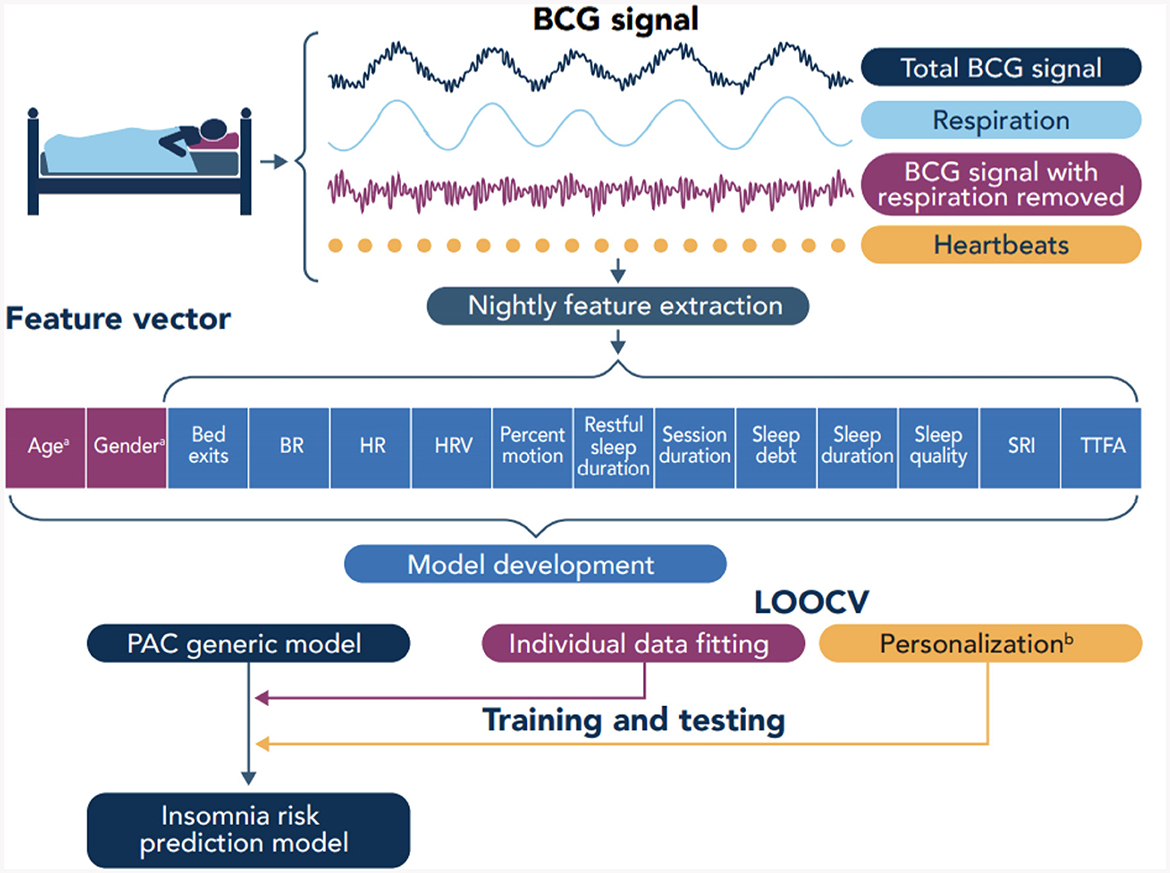
Figure 3. Overview of data collection and model development. BCG, Ballistocardiography; BR, Breathing rate; HR, Heart rate; HRV, Heart rate variability; SRI, Sleep regularity index; TTFA, Time to fall asleep; PAC, Passive agressive classifier; LOOCV, Leave-one-out cross-validation.
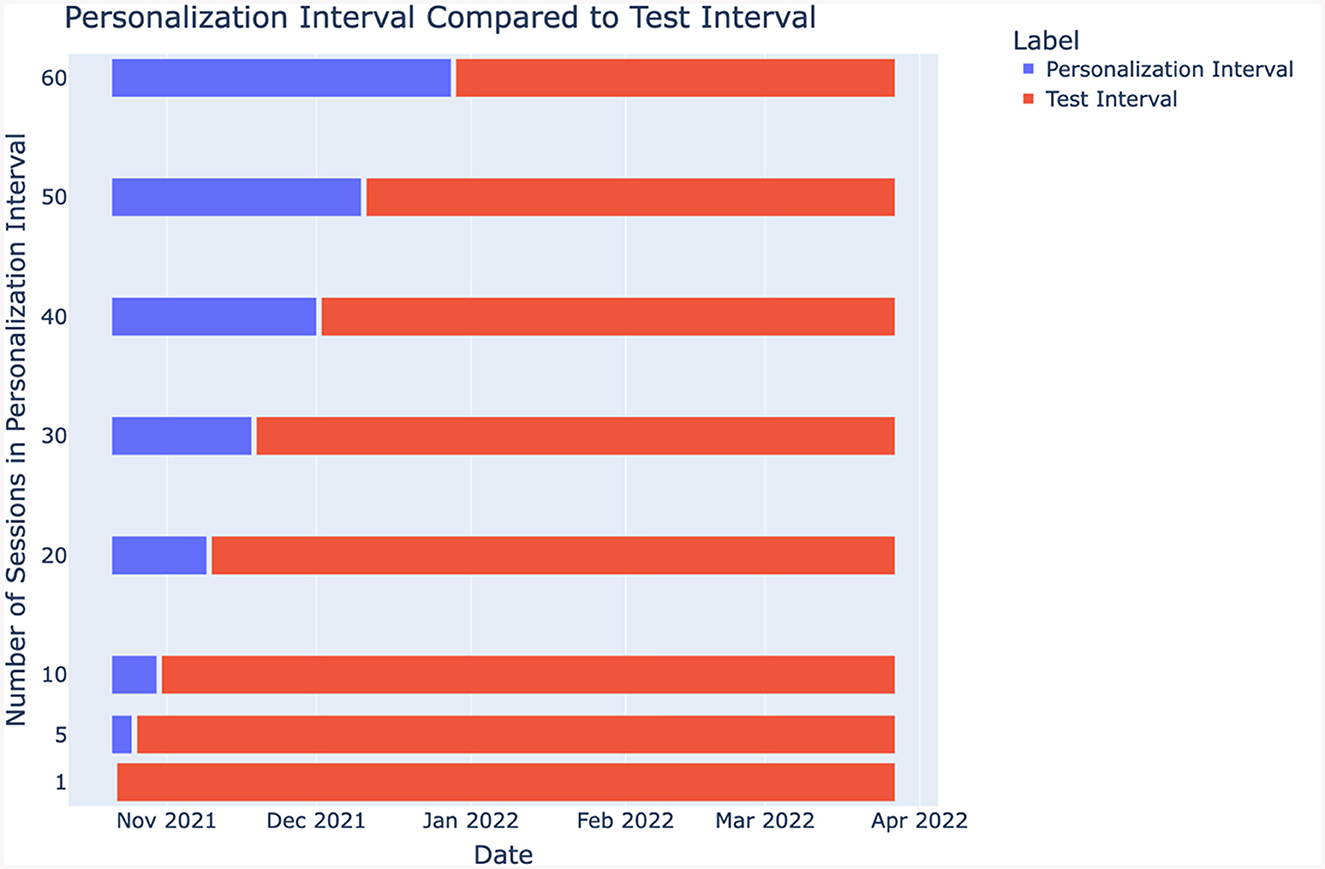
Figure 4. Personalization interval illustration.
This is a binary online learning algorithm that makes predictions based on the error function's gradient, allowing it to adjust its predictions as new data are introduced (22). The passive-aggressive classifier updates its parameters incrementally and at the individual training sample level rather than at a batch (updates parameters after exposure to a fixed set of training samples) or epoch level (updates model parameters after a full pass over the entire training dataset). This makes the passive-aggressive approach ideal for the implementation of the personalized fine-tuning strategy described in the previous section. This classifier is passive in that it does not update its parameters when training samples are correctly classified and is aggressive in that it does update when incorrectly classifying training samples (22).
The passive-aggressive classifier has several hyper-parameters that can be adjusted to adjust its performance. In our implementation, we used a hinge loss which is zero for correct classifications and in case of misclassification increases proportionally to the distance from the sample to the decision boundary. The proportionality hyper-parameter controls the degree of aggressiveness in the updates to the decision boundary in the face of misclassification.
We evaluated the performance of the personalized model using accuracy (Equation 1), precision (Equation 2), recall (Equation 3), and F1 score (Equation 4). In Equations 1–4, TP and TN represent the number of true positives and true negatives respectively. For each ISI threshold and personalization interval, we computed the average and standard deviation for each metric. As it is usually done with binary classifiers (23), we have also calculated the area under the receiving-operator curve (AUC) which characterizes the trade-off between true positive and false positive rate.
The demographic information for the final dataset of 1,489 respondents is reported in Table 3. In addition, the mean ISI values per questionnaire are also reported.
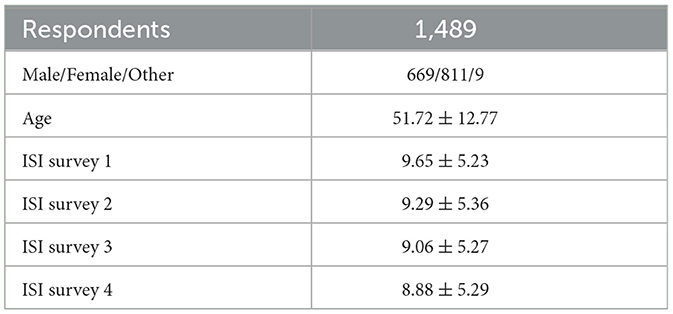
Table 3. Respondent statistics & ISI scores.
The model's performance without personalization, i.e., the duration of the personalization interval is zero, serves as baseline for comparison. The metrics for all ISI thresholds and personalization interval are reported in Table 4. Figure 5 shows the mean AUC for each ISI threshold and personalization interval.
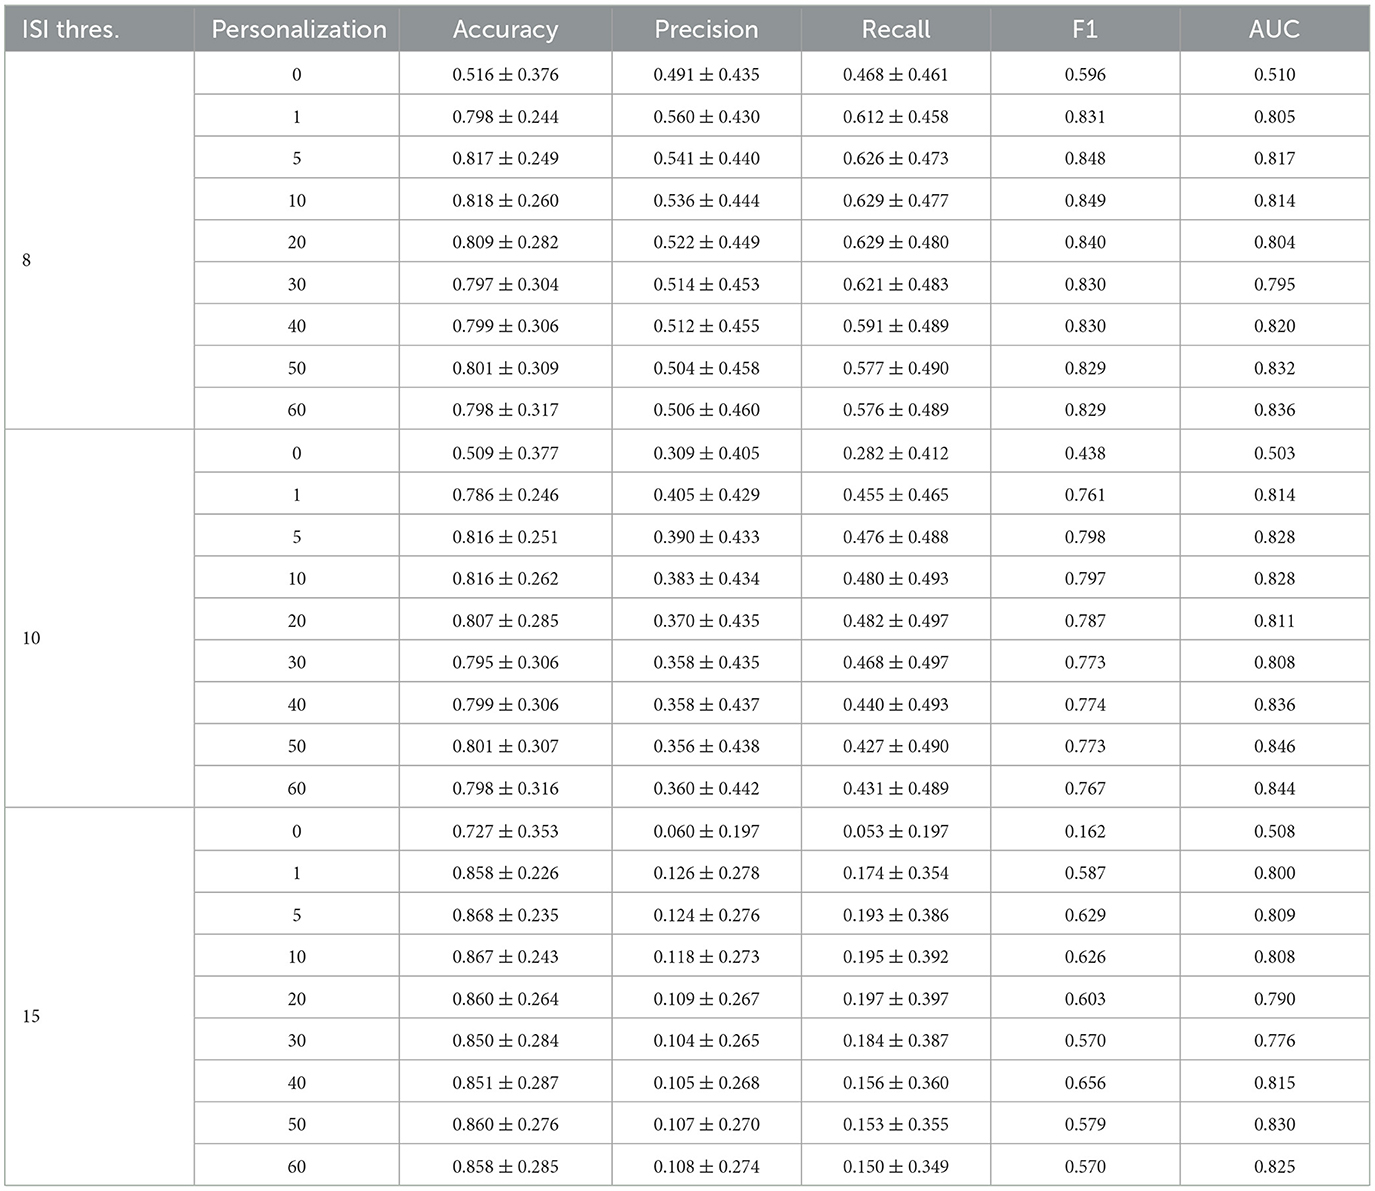
Table 4. Results for each ISI threshold and personalization interval duration.
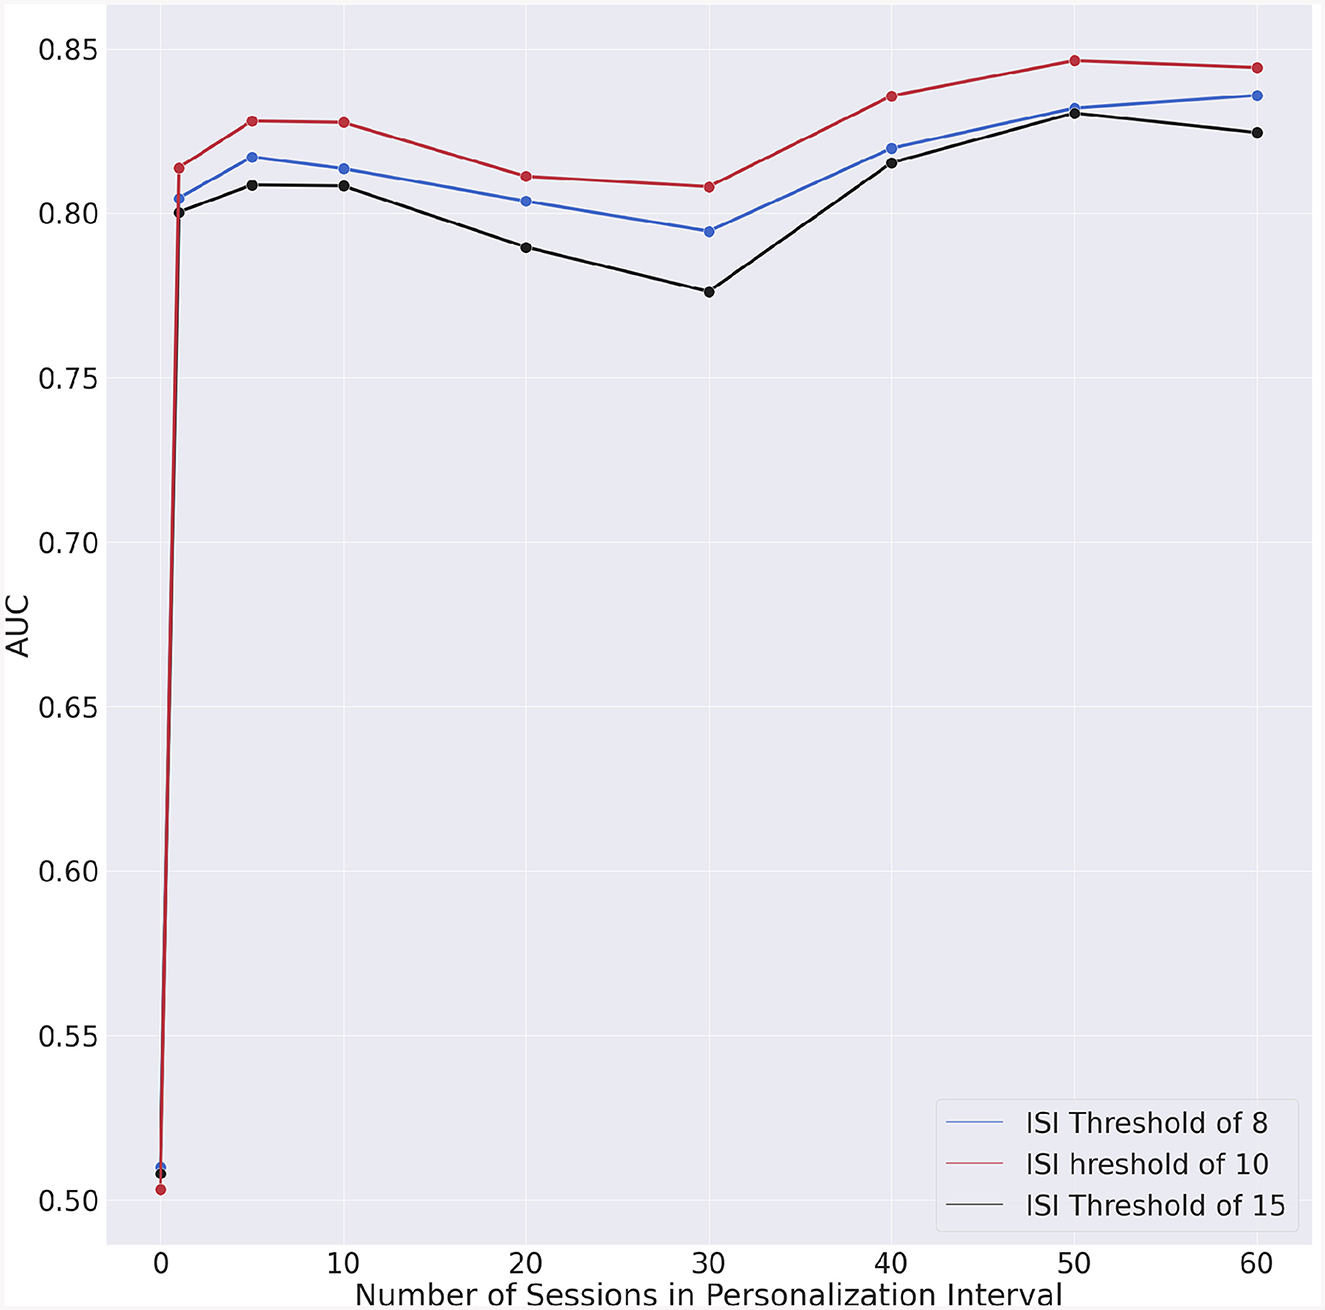
Figure 5. Area under the receiving-operator curves (AUC) vs. personalization interval for each ISI threshold.
The incremental AUC (iAUC) values for each ISI threshold are shown in Table 5 and Figure 6. These emphasize AUC improvements associated with the increase in the personalization interval. Improvements can already be observed when the personalization interval increases from 0 to 1 day, highlighting the immediate impact of incorporating even minimal personalized data into the model. Following the initial improvement, the iAUC values tend to diminish with some negative values recorded. This “diminishing return” trend suggests that personalization continues to contribute positively to the model's performance, the marginal gains decrease as more personalization data are incorporated.
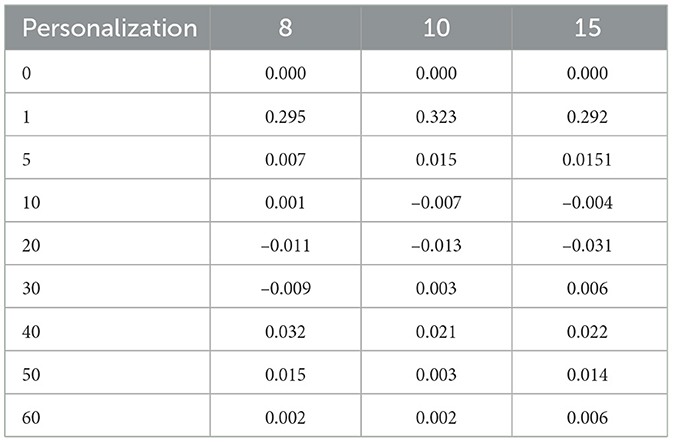
Table 5. Incremental AUC.
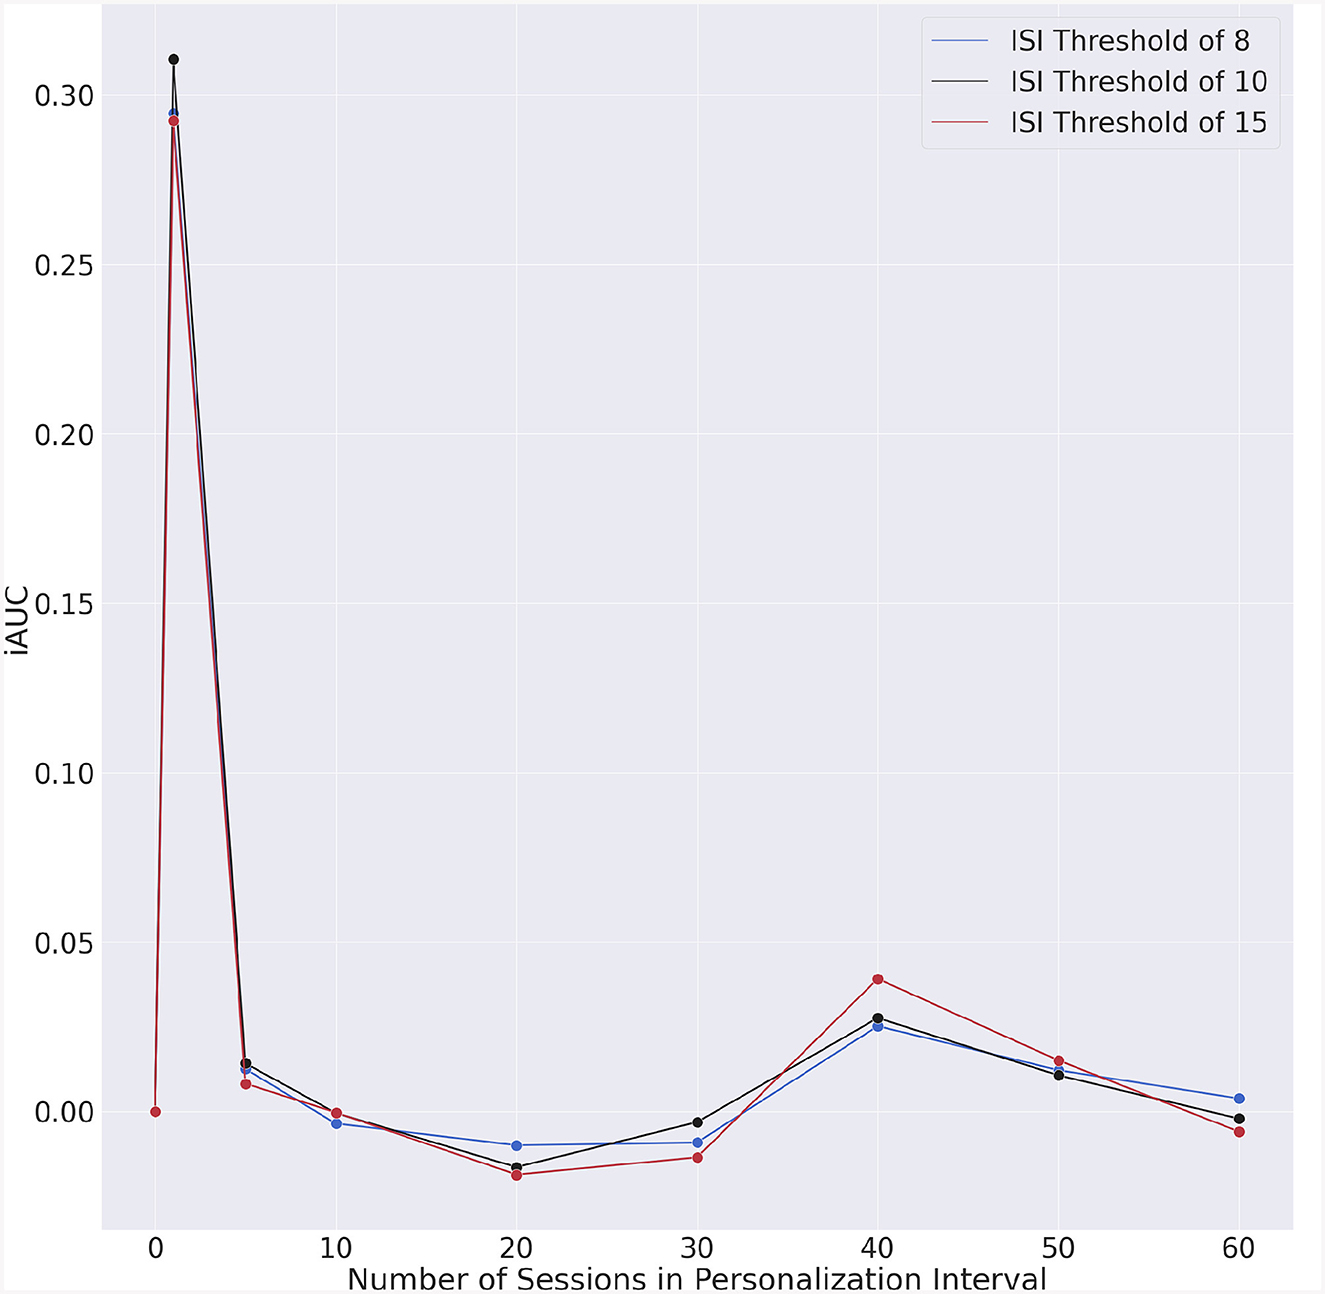
Figure 6. Incremental AUC vs. personalization interval for each ISI threshold.
The difference in iAUC for all possible pairs of ISI threshold was also statistically evaluated. The statistical significance of these differences are shown in Table 6.
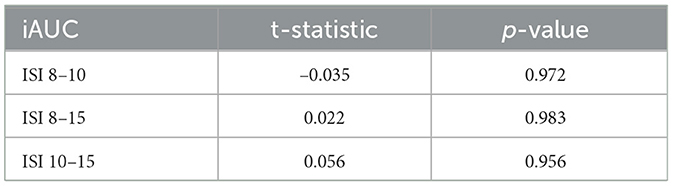
Table 6. Statistical testing for iAUC values.
Our results suggest that significant accuracy improvement can be achieved by integrating longitudinal individual-specific data into an insomnia risk detection model. Such improvement may be due to the fact that insomnia symptoms impact sleep in an individualized manner. Indeed, the results across different personalization intervals and ISI thresholds show the difficulties of predicting insomnia risk; with near random results for a generalized model that does not account for individual differences. Even a modest amount of personalization was already sufficient to increase the AUC by 0.3 which represented a 60% improvement over the generic model which provided quasi-random results.
We could also observe that the AUC (Figure 5) exhibits a slight degradation for approximately 30 days of personalization data. To understand whether this degradation is intrinsic to our model, we performed a test consisting in randomizing the data. In this manner, the chronologic information is no longer present in the data and if the degradation persists, then the specific machine learning algorithm would have caused that. The outcome of this experiment is shown in Figure 7. The fact that no AUC degradation can be observed in Figure 7 suggests that the decrease in AUC observed in Figure 5 may be due to the properties of the data. A plausible explanation for this degradation may be the proximity to the second questionnaire. However, no degradation could be observed for dates that are in the vicinity of the dates for the second or fourth questionnaires.
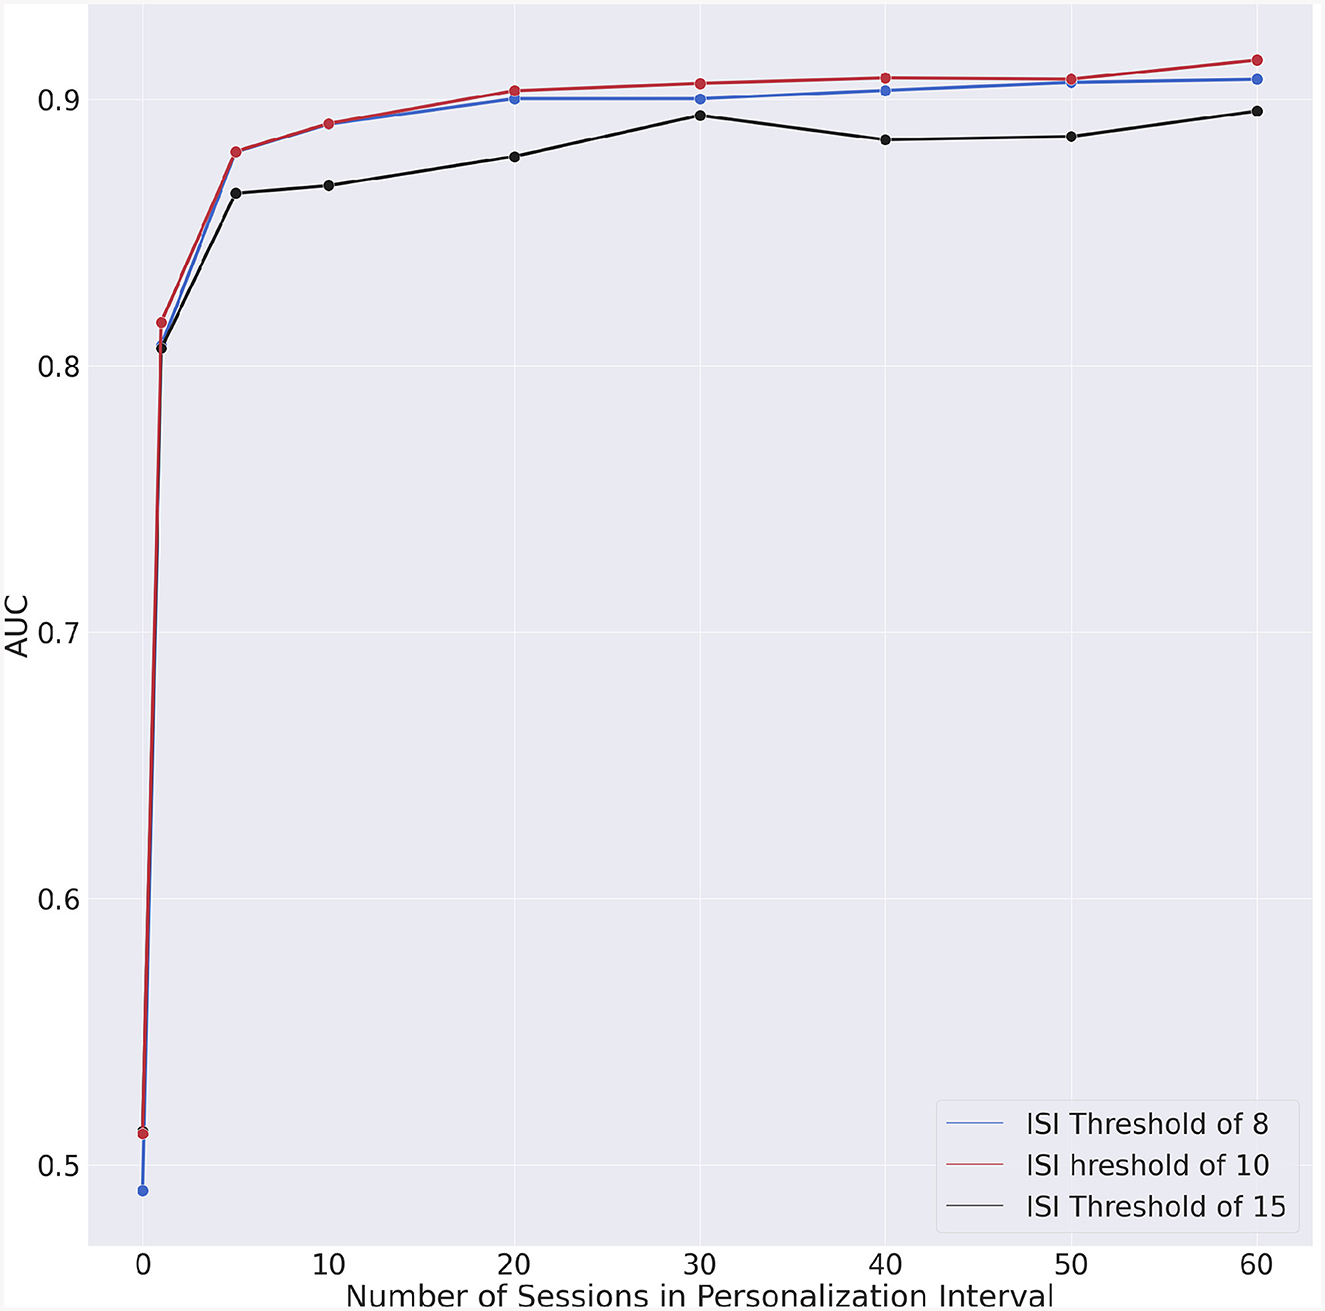
Figure 7. Experiment with chronologically randomized data. Incremental AUC vs. personalization interval for each ISI threshold.
We considered three ISI thresholds in this research. The results in Table 4, Figures 5, 6 show similar trends for all considered thresholds. We performed a statistical comparison between the iAUC curves for all possible pairs of ISI thresholds (see Table 6). We did not find any statistically significant difference between any of the comparisons which suggests that there could be an equivalence in detecting insomnia risk by considering any of the three ISI thresholds we tested in this research. An appropriate threshold for insomnia risk is 10 which coincides with the choice by Oh et al. (7) and may better reflect the high prevalence of insomnia.
Our study has some limitations which are listed below.
• The population drawn from Sleep Number customers is not representative of the broader US population. This is reflected by the relatively older age of respondents reported in Table 3. Thus, the results reported in this research and the relevance of model personalization may not apply to the general population.
• The analysis reported in this research based on ISI threshold to reflect insomnia risk does not permit to identify a specific insomnia phenotype or the presence of comorbid sleep disorders such as sleep disordered breathing or restless leg syndrome. Comorbid conditions can influence the ISI and the features we consider in our model such as heart rate variability, heart rate, breathing rate, sleep quality, and sleep debt.
• Self-reporting insomnia and the electronic delivery cannot be considered as equivalent to diagnostics. Indeed, the respondent engagement and interaction with the electronic delivery method may be lower compared to in-clinic, and in-person questionnaire administration.
• The responses to multiple delivery of the same questionnaire even if done multiple weeks apart, may not necessarily be independent.
• While the smart bed has a pressure sensor for each sleeper on the bed, the nature of BCG is such that some minimal contribution of the signal produced by one bed user can reflect on that from the bed partner.
An opportunity to expand this research consists in considering insomnia phenotypes such as difficulty of falling asleep but normal sleep duration or normal sleep latency but difficulties of staying asleep. Indeed, the advantage of personalization may apply to insomnia phenotypes which could be easier to apply at a scale instead of individual level. An additional area for expansion is the prediction of insomnia over shorter intervals to enable detection of acute insomnia which if not treated early enough can convert into chronic insomnia.
The combination of longitudinally and unobtrusively acquired sleep data with personalized machine learning models constitutes a paradigm that may be generalized across sleep medicine from early detection, endotype, and phenotype identification to enable treatment optimization, and recovery monitoring. This research presents early encouraging results supporting that vision.
The datasets presented in this article are not readily available because the approved consent form prevent us from making the survey data publicly available. Requests to access the datasets should be directed to the corresponding author.
The studies involving humans were approved by Western Institutional Review Board WCG-IRB. The studies were conducted in accordance with the local legislation and institutional requirements. The participants provided their written informed consent to participate in this study.
TW: Conceptualization, Data curation, Formal analysis, Methodology, Software, Validation, Visualization, Writing – original draft. VC: Data curation, Software, Writing – review & editing. DG: Conceptualization, Data curation, Formal analysis, Investigation, Methodology, Software, Writing – review & editing. MA: Conceptualization, Investigation, Methodology, Supervision, Validation, Writing – original draft, Writing – review & editing. SB: Data curation, Methodology, Software, Writing – review & editing. SD: Conceptualization, Funding acquisition, Methodology, Project administration, Writing – review & editing. BG: Data curation, Formal analysis, Software, Writing – review & editing. FM: Funding acquisition, Project administration, Resources, Writing – review & editing. GG-M: Conceptualization, Investigation, Methodology, Project administration, Resources, Supervision, Writing – original draft, Writing – review & editing.
The author(s) declare financial support was received for the research, authorship, and/or publication of this article. This study was funded by Sleep Number Corporation.
The authors are grateful for the comments provided by Sleep Number colleagues Raj Mills, Cesar Palerm, Suraj Bhat, and Saeed Babaeizadeh to improve this manuscript.
All authors of this study are directly and indirectly employed by Sleep Number Corporation. As employees of Sleep Number, the authors have both financial and professional interest in the success of the company's products. The authors, some of which have academic affiliations, have adhered to high ethical standards to ensure the accuracy, objectivity, and scientific integrity of the findings and conclusions. DG was employed by GlobalLogic.
The author(s) declared that they were an editorial board member of Frontiers, at the time of submission. This had no impact on the peer review process and the final decision.
All claims expressed in this article are solely those of the authors and do not necessarily represent those of their affiliated organizations, or those of the publisher, the editors and the reviewers. Any product that may be evaluated in this article, or claim that may be made by its manufacturer, is not guaranteed or endorsed by the publisher.
1. Irwin MR. Why sleep is important for health: a psychoneuroimmunology perspective. Annu Rev Psychol. (2015) 66, 143–72. doi: 10.1146/annurev-psych-010213-115205
2. Taylor DJ, Mallory LJ, Lichstein KL, Durrence HH, Riedel BW, Bush AJ. Comorbidity of chronic insomnia with medical problems. Sleep. (2007) 30, 213–8. doi: 10.1093/sleep/30.2.213
3. Benca RM. Diagnosis and treatment of chronic insomnia: a review. Psychiatr Serv. (2005) 56, 332–43. doi: 10.1176/appi.ps.56.3.332
4. Fietze I, Laharnar N, Koellner V, Penzel T. The different faces of insomnia. Front Psychiat. (2021) 12:683943. doi: 10.3389/fpsyt.2021.683943
5. AASM. International Classification of Sleep Disorders. Third edit ed. Darien, IL: American Academy of Sleep Medicine (2014).
6. Bastien CH, Vallires A, Morin CM. Validation of the insomnia severity index as an outcome measure for insomnia research. Sleep Med. (2001) 2, 297–307. doi: 10.1016/S1389-9457(00)00065-4
7. Oh CM, Kim HY, Na HK, Cho KH, Chu MK. The effect of anxiety and depression on sleep quality of individuals with high risk for insomnia: a population-based study. Front Neurol. (2019) 10:849. doi: 10.3389/fneur.2019.00849
8. Park S, Lee SW, Han S, Cha M. Clustering insomnia patterns by data from wearable devices: algorithm development and validation study. JMIR mHealth uHealth. (2019) 7:e14473. doi: 10.2196/14473
9. Rodrí-guez-Morilla B, Estivill E, Estivill-Domnech C, Albares J, Segarra F, Campos M, et al. Application of machine learning methods to ambulatory circadian monitoring (ACM) for the discrimination of sleep and circadian disorders. 14th World Sleep Congr. (2017) 40:e280. doi: 10.1016/j.sleep.2017.11.822
10. Spiegelhalder K, Regen W, Baglioni C, Klöppel S, Abdulkadir A, Hennig J, et al. Insomnia does not appear to be associated with substantial structural brain changes. Sleep. (2013) 36, 731–7. doi: 10.5665/sleep.2638
11. Li C, Mai Y, Dong M, Yin Y, Hua K, Fu S, et al. Multivariate pattern classification of primary insomnia using three types of functional connectivity features. Front Neurol. (2019) 10:1037. doi: 10.3389/fneur.2019.01037
12. Andrillon T, Solelhac G, Bouchequet P, Romano F, Le Brun MP, Brigham M, et al. Revisiting the value of polysomnographic data in insomnia: more than meets the eye. Sleep Med. (2020) 66, 184–200. doi: 10.1016/j.sleep.2019.12.002
13. Shahin M, Mulaffer L, Penzel T, Ahmed B. A two stage approach for the automatic detection of insomnia. In: 2018 40th Annual International Conference of the IEEE Engineering in Medicine and Biology Society (EMBC), IEEE (2018). p. 466–469. doi: 10.1109/EMBC.2018.8512360
14. Bianchi MT. Sleep devices: wearables and nearables, informational and interventional, consumer and clinical. Metabolism. (2018) 84, 99–108. doi: 10.1016/j.metabol.2017.10.008
15. Johns MW, A. new method for measuring daytime sleepiness: the Epworth sleepiness scale. Sleep. (1991) 14, 540–5. doi: 10.1093/sleep/14.6.540
16. Danielsson K, Sakarya A, Jansson-Fröjmark M. The reduced morningnesseveningness questionnaire: psychometric properties and related factors in a young Swedish population. Chronobiol Int. (2019) 36, 530–40. doi: 10.1080/07420528.2018.1564322
17. Spitzer RL, Kroenke K, Williams JBW, Löwe B. A brief measure for assessing generalized anxiety disorder: The GAD-7. Arch Intern Med. (2006) 166, 1092–7. doi: 10.1001/archinte.166.10.1092
18. Kroenke K, Spitzer RL, Williams JBW. The PHQ-9 validity of a brief depression severity measure. J Gen Intern Med. (2001) 46202, 606–13. doi: 10.1046/j.1525-1497.2001.016009606.x
19. Siyahjani F, Molina GG, Barr S, Mushtaq F. Performance evaluation of a smart bed technology against polysomnography. Sensors. (2022) 22, 1–17. doi: 10.3390/s22072605
20. Lunsford-Avery JR, Engelhard MM, Navar AM, Kollins SH. Validation of the sleep regularity index in older adults and associations with cardiometabolic risk. Sci Rep. (2018) 8, 1–11. doi: 10.1038/s41598-018-32402-5
21. Weiss K, Khoshgoftaar TM, Wang DD. A survey of transfer learning. J Big Data. (2016) 12:3. doi: 10.1186/s40537-016-0043-6
22. Crammer K, Dekel O, Keshet J, Shalev-Shwartz S, Singer Y. Online passive aggressive algorithms. J Mach Learn Res. (2006) 7, 551–585. doi: 10.5555/1248547.1248566
Keywords: insomnia risk, personalized machine learning, incremental learning, fine tuning, passive-aggressive learning
Citation: Winger T, Chellamuthu V, Guzenko D, Aloia M, Barr S, DeFranco S, Gorski B, Mushtaq F and Garcia-Molina G (2024) Fine tuned personalized machine learning models to detect insomnia risk based on data from a smart bed platform. Front. Neurol. 15:1303978. doi: 10.3389/fneur.2024.1303978
Received: 28 September 2023; Accepted: 24 January 2024;
Published: 14 February 2024.
Edited by:
Miguel Meira E. Cruz, Centro Cardiovascular da Faculdade de Medicina da Universidade de Lisboa, PortugalReviewed by:
Jung Bin Kim, Korea University Anam Hospital, Republic of KoreaCopyright © 2024 Winger, Chellamuthu, Guzenko, Aloia, Barr, DeFranco, Gorski, Mushtaq and Garcia-Molina. This is an open-access article distributed under the terms of the Creative Commons Attribution License (CC BY). The use, distribution or reproduction in other forums is permitted, provided the original author(s) and the copyright owner(s) are credited and that the original publication in this journal is cited, in accordance with accepted academic practice. No use, distribution or reproduction is permitted which does not comply with these terms.
*Correspondence: Gary Garcia-Molina, Z2FyeS5nYXJjaWFtb2xpbmFAc2xlZXBudW1iZXIuY29t; Z21nYXJjaWFAd2lzYy5lZHU=
Disclaimer: All claims expressed in this article are solely those of the authors and do not necessarily represent those of their affiliated organizations, or those of the publisher, the editors and the reviewers. Any product that may be evaluated in this article or claim that may be made by its manufacturer is not guaranteed or endorsed by the publisher.
Research integrity at Frontiers
Learn more about the work of our research integrity team to safeguard the quality of each article we publish.