 Ahmad A. Abujaber1†
 Ibraheem M. Alkhawaldeh2†
 Yahia Imam3†
 Abdulqadir J. Nashwan1*†
 Naveed Akhtar4
 Ahmed Own4Ahmad S. Tarawneh5†
 Ahmad B. Hassanat5†
- 1Nursing Department, Hamad Medical Corporation (HMC), Doha, Qatar
- 2Faculty of Medicine, Mutah University, Al-Karak, Jordan
- 3Neurology Section, Neuroscience Institute, Hamad Medical Corporation (HMC), Doha, Qatar
- 4Neuroradiology Department, Neuroscience Institute, Hamad Medical Corporation (HMC), Doha, Qatar
- 5Faculty of Information Technology, Mutah University, Al-Karak, Jordan
Background: Stroke is a significant global health burden and ranks as the second leading cause of death worldwide.
Objective: This study aims to develop and evaluate a machine learning-based predictive tool for forecasting the 90-day prognosis of stroke patients after discharge as measured by the modified Rankin Score.
Methods: The study utilized data from a large national multiethnic stroke registry comprising 15,859 adult patients diagnosed with ischemic or hemorrhagic stroke. Of these, 7,452 patients satisfied the study’s inclusion criteria. Feature selection was performed using the correlation and permutation importance methods. Six classifiers, including Random Forest (RF), Classification and Regression Tree, Linear Discriminant Analysis, Support Vector Machine, and k-Nearest Neighbors, were employed for prediction.
Results: The RF model demonstrated superior performance, achieving the highest accuracy (0.823) and excellent discrimination power (AUC 0.893). Notably, stroke type, hospital acquired infections, admission location, and hospital length of stay emerged as the top-ranked predictors.
Conclusion: The RF model shows promise in predicting stroke prognosis, enabling personalized care plans and enhanced preventive measures for stroke patients. Prospective validation is essential to assess its real-world clinical performance and ensure successful implementation across diverse healthcare settings.
Background
Stroke is a global health concern, recognized as the second leading cause of death and a prominent contributor to long-term disability worldwide (1). The World Health Organization estimates that annually, 13.7 million people suffer a stroke, and approximately 5.5 million succumb to death due to its complications (1). Furthermore, stroke is a primary cause of significant, persistent disability. Over half of the stroke survivors aged 65 and over experience reduced mobility due Stroke (2, 3). In Qatar, Hamad General Hospital (HGH), the country’s main tertiary hospital, offers specialized stroke services under the umbrella of the Neuroscience Institute and maintains the stroke registry. This center covers more than 90% of all stroke admissions. The registry provides a comprehensive insight into the incidence and management of stroke disease in the country. Qatar is home known for its multiethnic population with a large young able-bodied South/Southeastern Asian presence. Whereas the local Qatari population have an average incidence of stroke is 92.04 per 100,000 adult population (4). The mean age is around 64 years, and the average age for the first cerebrovascular event is approximately 63 years (4). The most common type of stroke was ischemic stroke (IS), accounting for 73.7% of cases, primarily caused by small vessel disease (4). Hypertension and diabetes were particularly common in this group, affecting 82.7 and 71.6% of patients, respectively (4). Compared to their male counterparts, Qatari females were older at the time of stroke onset, experienced higher rates of hypertension and diabetes, and had a greater likelihood of disability or death at 90 days (4). The Registry is a prospective one that captures important clinicodemographic characteristics of stroke patients and their complications and outcomes (5).
This substantial global and national burden emphasizes the urgency to optimize stroke management strategies, including the identification of robust prognostic factors that could inform therapeutic decisions and patient care pathways.
Literature review
The research community has made substantial strides in examining the factors contributing to stroke outcomes. These encompass patient demographics, clinical characteristics, and treatment modalities, as well as the exploration of machine learning models to predict prognosis. Age, gender, and pre-stroke health status, such as the pre-admission modified Rankin Score (mRS), were frequently noted as significant factors in the prognosis of patients post-thrombectomy (6). Similarly, lifestyle habits, like smoking, were found to influence outcomes, with non-smokers more likely to have a favorable recovery (7).
Clinical indicators are another common factor in predicting stroke outcomes. Infarct volume, for instance, has been linked to clinical outcomes following IS. Smaller infarct growths, as well as better initial perfusion, have been associated with better patient outcomes (8). Likewise, post-thrombectomy National Institutes of Health Stroke Scale (NIHSS) scores and the requirement for a decompressive hemicraniectomy were identified as significant predictors of functional outcomes (6). Furthermore, stroke severity, indicated by NIHSS scores, along with alteplase treatment, was noted as significant in determining functional changes in mild IS patients from 30 to 90 days post-stroke (9).
The predictability of various scoring systems was examined, and the modified SOAR (mSOAR) score was reported to be effective in predicting post-stroke disability (10). Similarly, the impact of factors such as age, stroke history, heart rate, and TOAST classification on the prognosis of transient ischemic attack (TIA) or minor stroke patients was discussed, and they were integrated into machine learning models for predictive purposes (11).
The application of machine learning algorithms for predicting stroke outcomes is promising. These algorithms were found to have comparable, if not superior, performance in predicting the 90-day prognosis of TIA and minor stroke patients compared to traditional logistic regression models. Similarly, explainable machine learning methodologies have been developed to predict functional outcomes at discharge, showing high levels of accuracy (11).
Predicting outcomes post-stroke is paramount for clinical planning and patient care. A common measure of disability and independence in patients after suffering a stroke is the mRS (11, 12). An analysis of acute IS patients found significant changes in mRS scores from 30 to 90 days post-discharge (11). The mRS score at discharge and non-home discharge disposition were deemed good individual predictors of the 90-day mRS score, providing a tool for assessing likely patient outcomes (11). Accurate prediction of mRS scores can guide patient expectations and clinical trial analyses. A model developed using data from multi-center prospective studies predicted the 90-day mRS score based on variables available during the stroke hospitalization (13). This model found age and NIHSS score at discharge as significant independent predictors of the 90-day mRS, with an accuracy of 78% in predicting the mRS score within one point in the validation cohort (13).
Further to this, machine learning models have been shown to offer promising results in predicting patient outcomes. With the ability to analyze a vast amount of clinical, laboratory, and imaging data, these models can provide nuanced insight. In one study, different machine learning algorithms, including XGBoost, LightGBM, CatBoost, and Random Forest (RF), were used to predict short- and medium-term functional outcomes in acute IS patients (14, 15). The LightGBM and Random Forest algorithms demonstrated the highest predictive power for functional outcomes (14).
Despite a mild onset, patients with IS can still exhibit substantial disability rates at 90 days, often due to early neurological worsening (16). A prospective cohort study found that early worsening and acute infarct growth from baseline to 5 days were more common among those with poor outcomes (16). On the other hand, studies on thrombectomy in late time windows have reported improved patient outcomes. In the DEFUSE 3 study, patients who exhibited rapid neurological improvement (RNI) 24 h after thrombectomy were more likely to have a favorable clinical outcome (17). RNI was associated with a favorable shift in the mRS at day 90 and lower rates of mortality (17).
Stroke outcome prediction is a multifaceted process that integrates a range of factors, from demographic and clinical characteristics to the incorporation of machine learning models. These advancements have the potential to refine the prognostic process, enabling personalized therapeutic strategies, improving patient outcomes, and mitigating the global burden of stroke. Therefore, this study aims at designing a machine learning based model to help predict the stroke patient’s prognosis 90 days post discharge using mRS.
Materials and methods
The study received approval from the institutional research board (IRB) of Hamad Medical Corporation, Qatar, with reference MRC-01-22-594. The study methodology followed a specific sequence of steps as summarized in Figure 1.
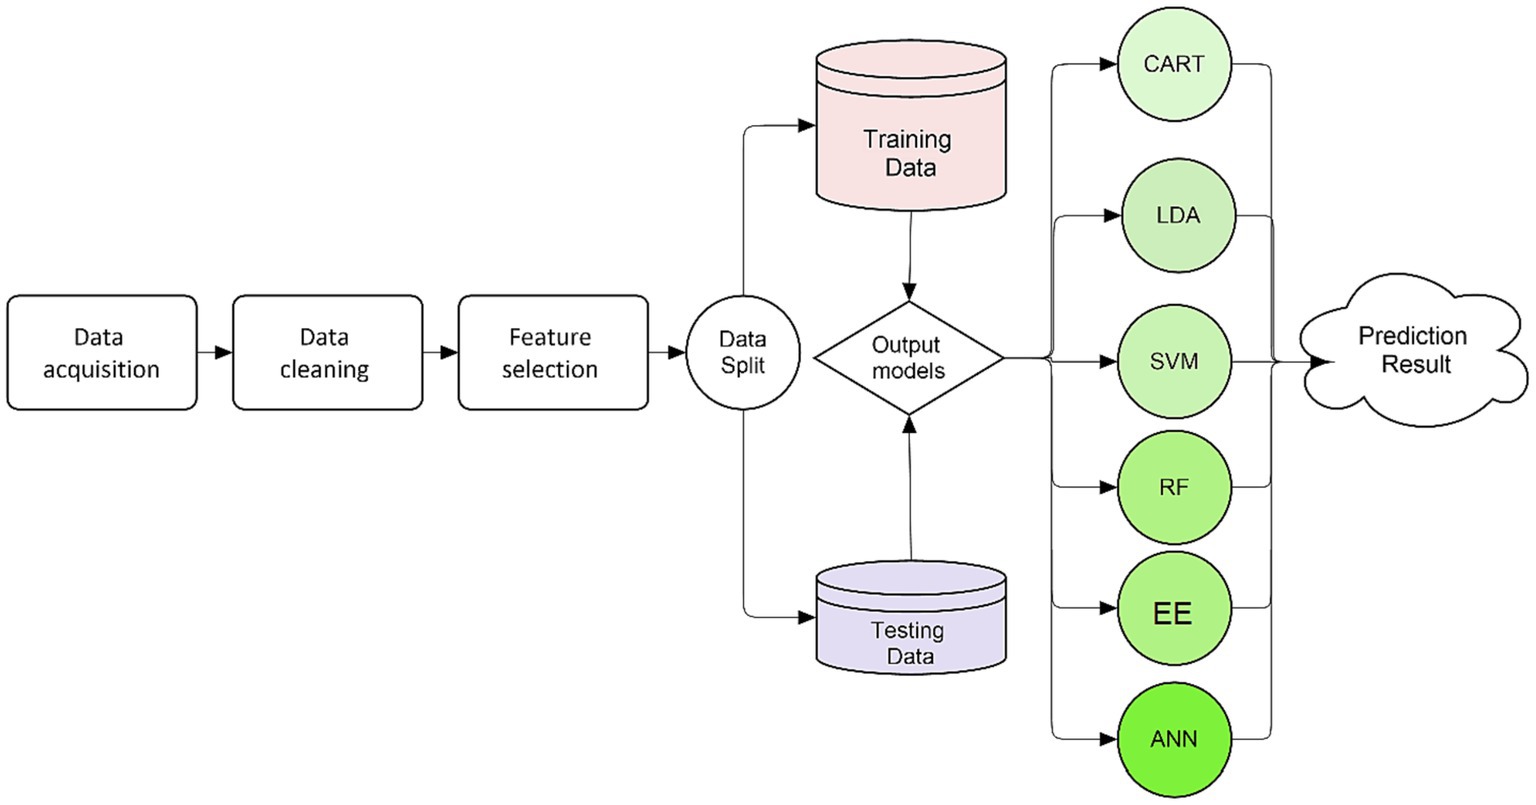
Figure 1. Summary of study’s methodology.
Data collection
Data were collected from the Stroke Registry of Hamad General Hospital (HGH), covering the period from January 2014 to July 2022. The dataset includes all adults aged 18 years and above, who were admitted to HGH with a primary diagnosis of stroke, comprising cases of IS, transient ischemic attack (TIA), hemorrhagic stroke (ICH), and stroke mimics. In total, 15,859 patients sought specialized stroke care at the hospital since the establishment of the stroke registry in Qatar.
Baseline variables
The extracted variables covered diverse aspects of the patients, including demographic information, ethnicity, stroke risk factors, known comorbidities, admission location, hospitalization outcomes [i.e., length of stay (LOS) and hospital-acquired infections like pneumonia and urinary tract infection (UTI)], mortality, and stroke severity. The severity of stroke at admission was classified into five categories using the National Institute of Health Stroke Score (NIHSS) (18, 19). At the time of admission, the mRS was collected, which captures the patient’s pre-stroke condition as reported by family members, graded on a 0–6 scale (11). IS etiology was determined using the Trial of Org 10,172 in Acute Stroke Treatment (TOAST) classification (20). A stroke type variable was created by combining the five TOAST categories under IS, with ICH forming another category, providing a comparative perspective between the two stroke types. To identify Body Mass Index (BMI) categories, the CDC’s 5-class definition for adult overweight and obesity was adopted (21).
Regarding ethnicity, patients were classified into five groups based on their declared nationality: Qatari, Middle East and North Africa (MENA) region, South Asia region, South East Asia region (as defined by the United Nations geo-scheme), and all other nationalities categorized as “other” (22, 23). Notably, the Qatari patients were placed in a separate category to facilitate a meaningful comparative perspective, considering the unique demographic structure of the country, where the majority of the population comprises expatriates (4, 24). This approach has been consistently employed in previous publications studying stroke in Qatar (5, 22). All included risk factors, such as comorbidities and smoking history, were reliably confirmed during the patient’s hospital stay and verified by the stroke registry personnel by accessing the patient’s electronic medical records. Table 1 summarizes the data.
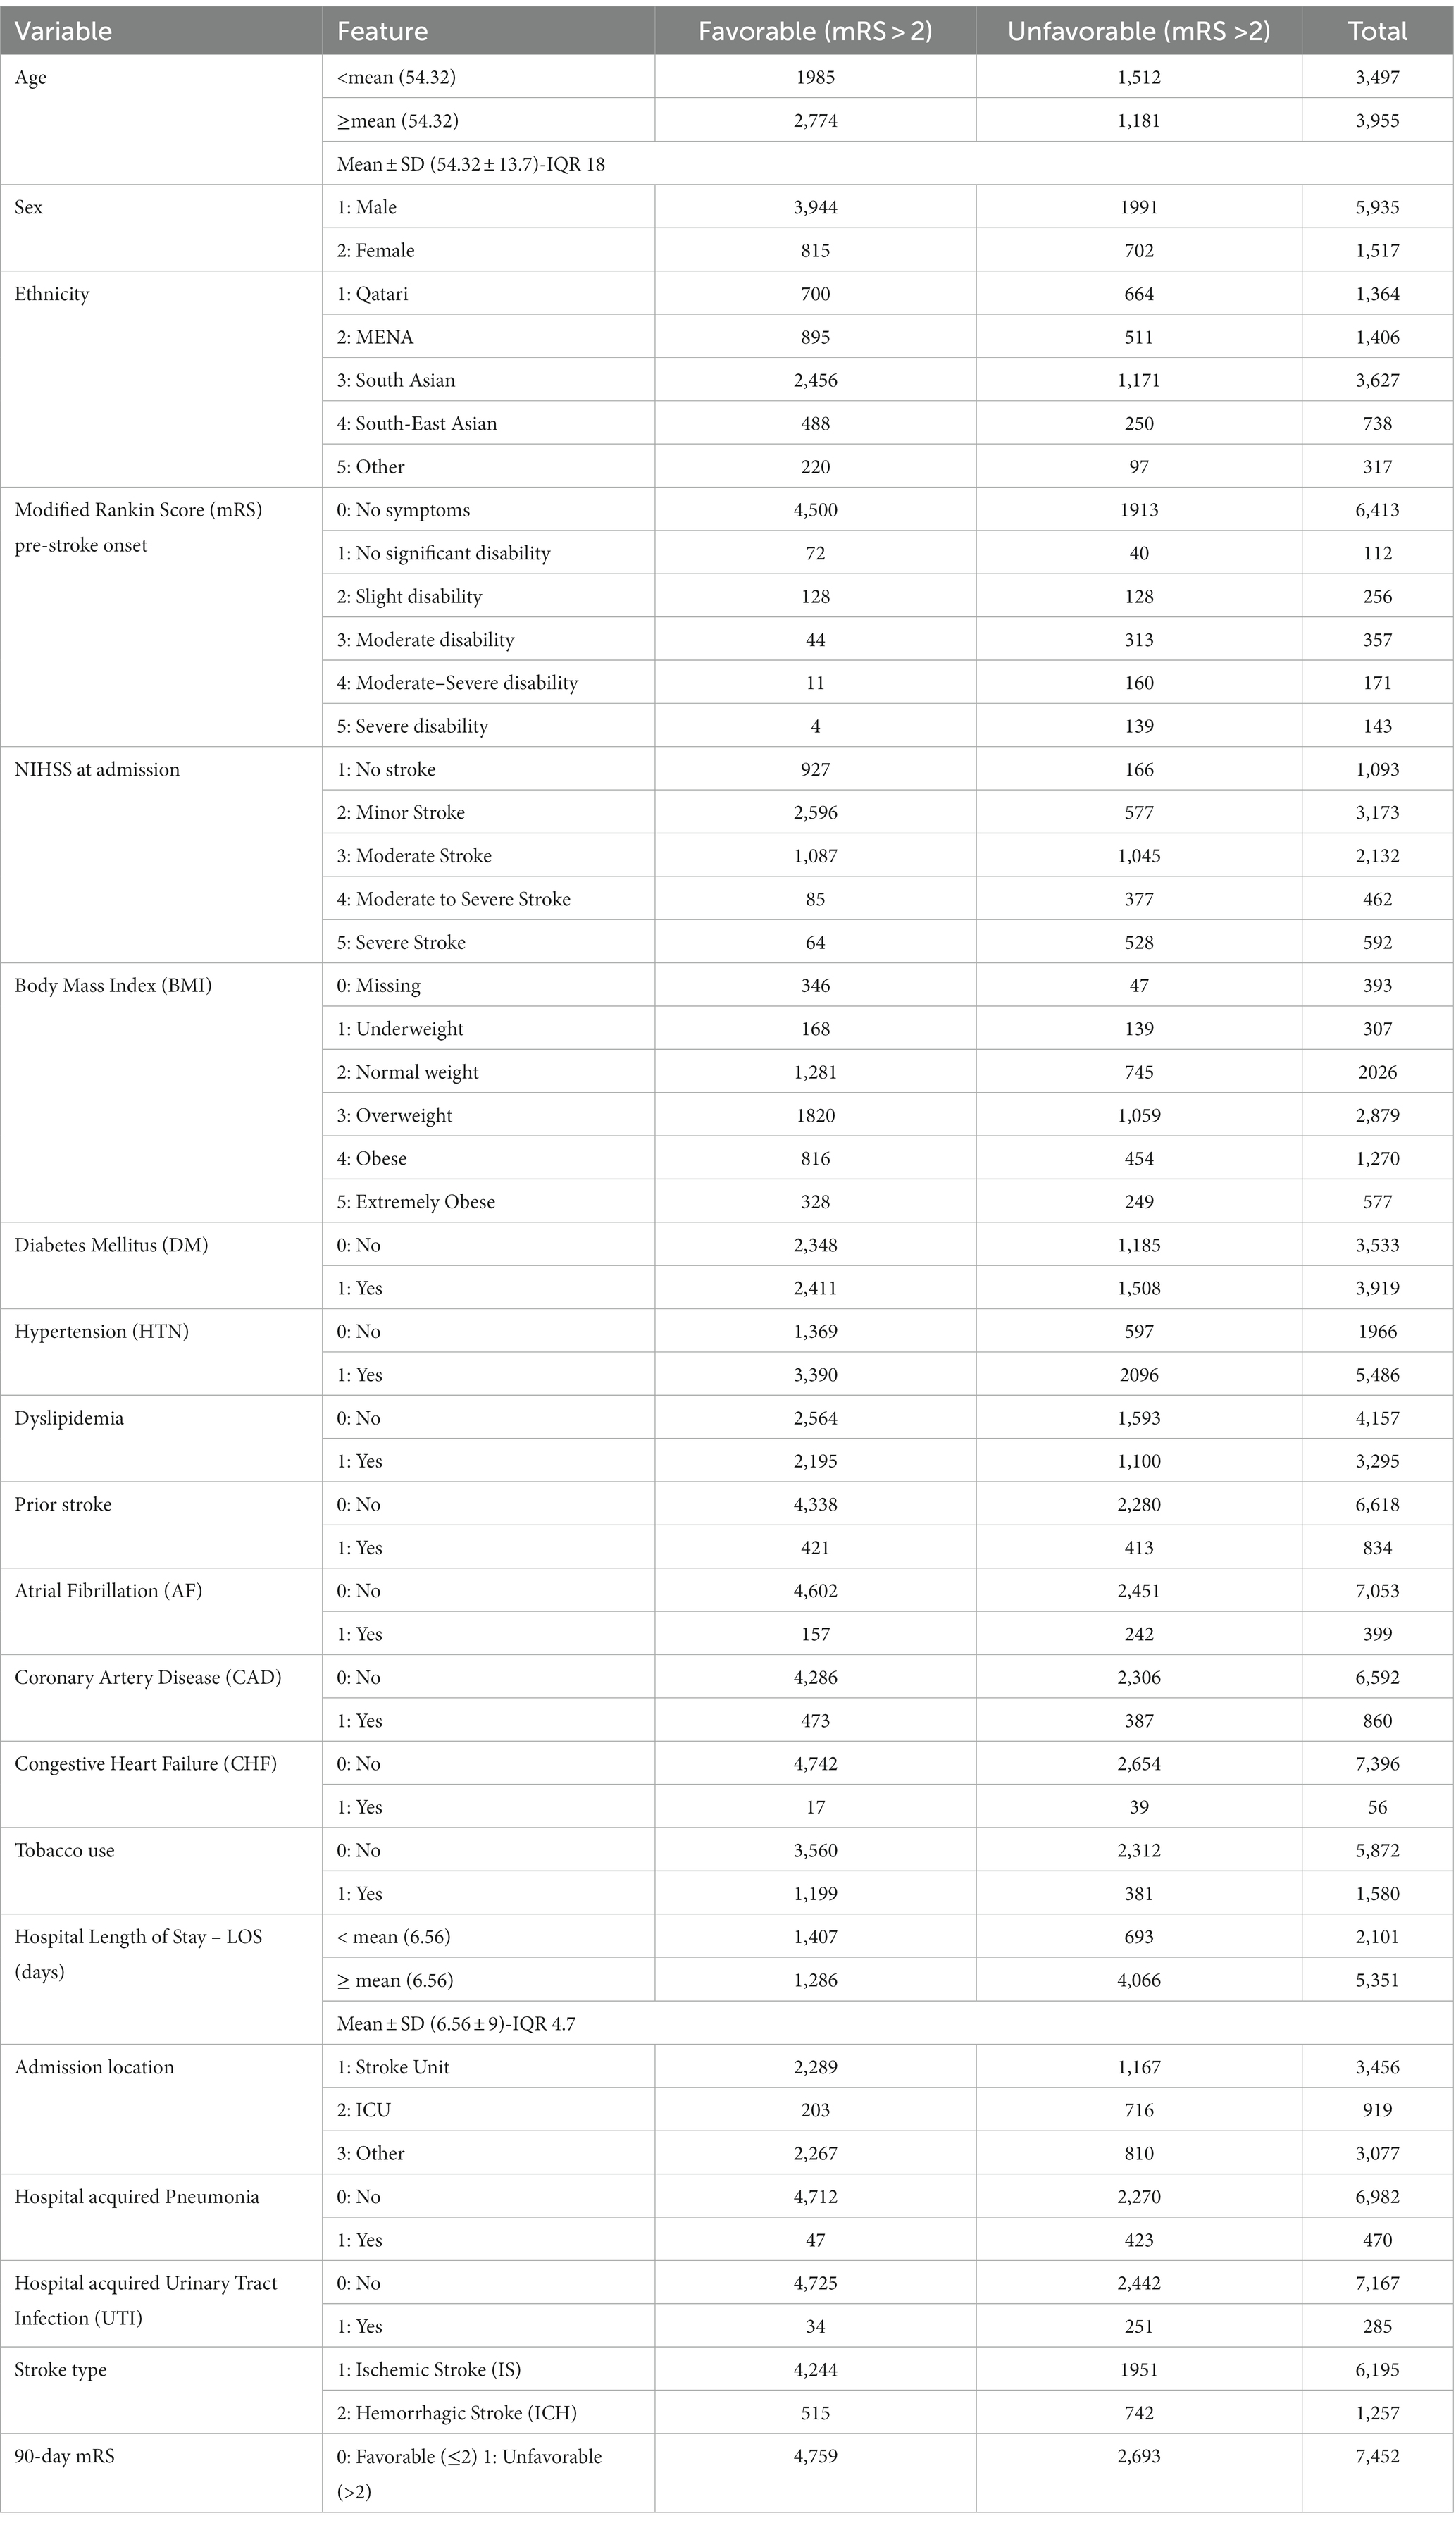
Table 1. Statistical characteristics of the collected stroke dataset.
Outcome variable
The mRS, collected at the 90-day post-discharge follow-up visit, was simplified into a binary variable. An mRS score of ≤2 was categorized as favorable, indicating a good prognosis while mRS score > 2 was categorized as unfavorable, representing a poor prognosis (4, 11, 25).
Inclusion/exclusion criteria
From initial 15,859 patients, 9,840 adults (≥18) diagnosed with IS or ICH were included. Excluded: TIA and mimic cases (6,019), in-hospital deaths (334), unstandardized (0–6) 90-day mRS score (207) and missed 90-day follow-up (1847). Finally, 7,452 patients were included in the study. See Figure 2 for details.
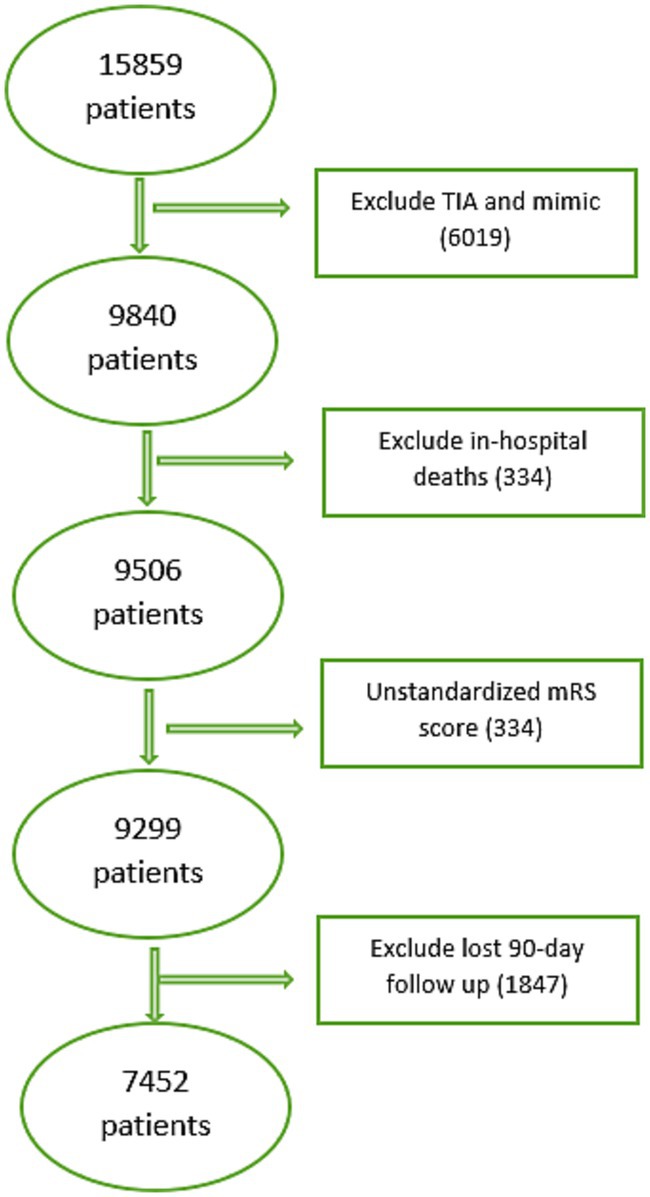
Figure 2. Data inclusion/exclusion process.
Data cleaning and preprocessing
Out of the 19 variables included in the study, 18 had no missing values. However, Body Mass Index had missing values in 393 records (5%). Addressing data missingness in predictive models is crucial, and various approaches exist, such as eliminating incomplete records or imputing the missing data (26, 27). In this study, the missing values were substituted with a value of (zero). It is worth noting that, as stated by Markey et al. (28), substituting a value of zero for missing values in Body Mass Index is not recommended. However, this substitution was done merely to compare the performance of different classifiers in order to find the most effective alternative for our prediction system. The inclusion of this variable was assessed based on the results of the feature selection methods, and the whole feature is removed as can be seen from the feature selection analysis.
Feature selection
This study used feature correlation (29) and Permutation importance (30) with RF, Easy Ensemble (EE), and Artificial Neural Network (ANN) for feature selection. Features were categorized based on correlation coefficients: weak, moderate, and strong (31, 32). Easy Ensemble identified 13 out of 19 variable (69%) and ranked them based on importance while and ANN and RF ranked all the variables based on importance (Figure 3). Finally, cross-analysis of the best features across the four approaches (EE, RF, ANN, and correlation) was done to assess the consistency and reliability of the features chosen across different methods.
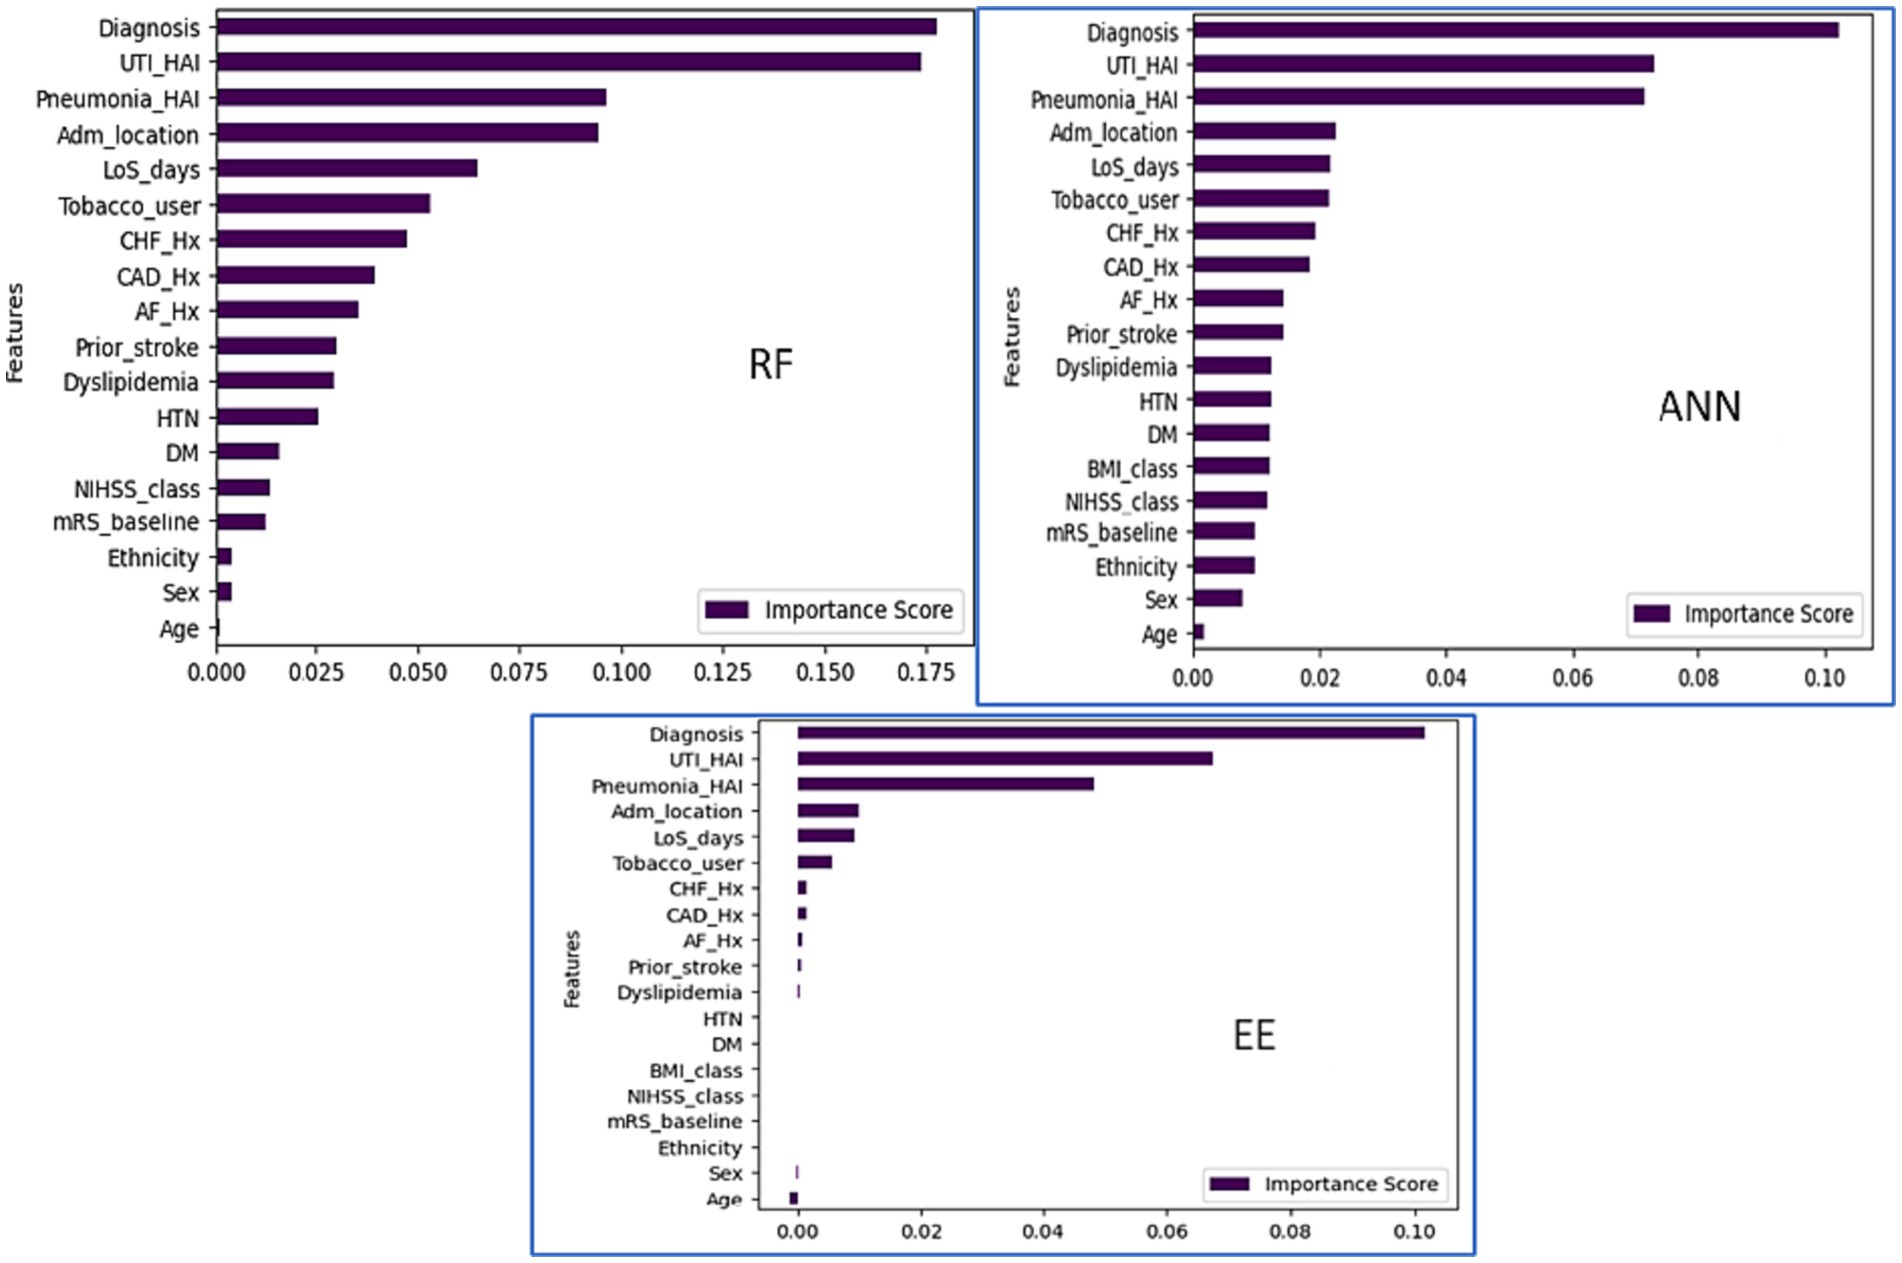
Figure 3. Feature importance (RF, ANN and EE classifiers).
Trained models
Six classifiers were employed as follows and the training and testing process involves 5-fold cross-validation.
• Classification and Regression Tree (CART) uses decision trees to recursively split data based on feature values (33). Parameters: minimum split = 20, maximum depth = 6, complexity parameter = 0.01.
• Linear Discriminant Analysis (LDA) focuses on linear decision boundaries, maximizing separability through linear transformations (34). Parameters: prior probabilities = NULL, shrinkage coefficient = 1.
• Support Vector Machine (SVM) constructs a hyperplane with support vectors to separate classes, maximizing data point margins (35). Parameters: kernel function = “radial,” gamma = 0.2, cost: 1.
• Random Forest (RF) combines decision trees trained on random data subsets, aggregating predictions (36). Parameters: number of trees = 500, number of features = square root of all = 4, node size = 100.
• Artificial Neural Network (ANN) mimics biological neural networks, processing information through interconnected nodes with activation functions (37). Parameters: size = one hidden layer with 5 nodes, maximum number of iterations = 100, activation function = “logistic.”
• k-Nearest Neighbors (KNN) assigns a data point to the majority class among its k nearest neighbors in the feature space (38). Parameters: k = 5, distance function = “euclidean.”
• Naïve Bayes calculates the probability of each class given the values of the features independently (39). Parameters: Laplace smoothing parameter (default = 1).
• AdaBoost combines the predictions multiple weak learners (decision trees). Parameters: The type of base learner = “rpart,” the number of base learners =100, the learning rate = 0.5.
• Easy Ensemble (EE) trains multiple base learners (decision trees) on different subsets of the training data successively. It uses a weighted sampling strategy to select a portion of the training data at each iteration. Weights are assigned to training samples based on their difficulty, with heavier weights assigned to more difficult examples (40). Parameters: The number of base learners = 100, maximum depth = 3, weighting = “balanced,” sampling strategy = “random,” and learning rate = 0.5.
Data imbalance, encoding and performance evaluation
Utilizing 5-fold validation, the study determined the best performing algorithm based on average accuracy. However, the dataset is class-imbalanced, with unfavorable mRS accounting for 36% compared to 64% favorable. To assess classifiers’ true efficacy despite class imbalance, F1-score and area under the curve (AUC) were used (41). Both factorized and one-hot encoding methods were tested to determine which method enhances the learning process and improve data representation and understanding (32). Then, a final experiment was conducted to identify the best performing algorithm using the superior encoding method.
Results
Table 1 presents the study population’s characteristics, with an average age of 54.32 ± 13.7 years. Approximately 80% of the participants are male, and 14% were admitted with NIHSS >16. IS was diagnosed in 83% of patients, and the average LOS was 6.56 ± 9 days. At the 90-day follow-up, 36% of patients reported an unfavorable mRS score.
Correlation feature selection resulted in three feature categories based on the correlation coefficient. We classify influences as weak, moderate, or strong. Specifically, characteristics with correlation coefficients close to 1 or − 1 are deemed to have a strong positive or strong negative correlation. Furthermore, features with correlation coefficients greater than 0.20 or less than −0.20 are classified as having strong or moderate correlations. See Table 2 and Figure 4.
• Weak Influence: Sex, ethnicity, BMI, DM, HTN, dyslipidemia, prior stroke, AF, CAD, CHF, tobacco use, and admission location.
• Moderate Influence: Age, pneumonia, pre-stroke mRS, LOS, UTI, stroke type.
• Strong Influence: NIHSS.
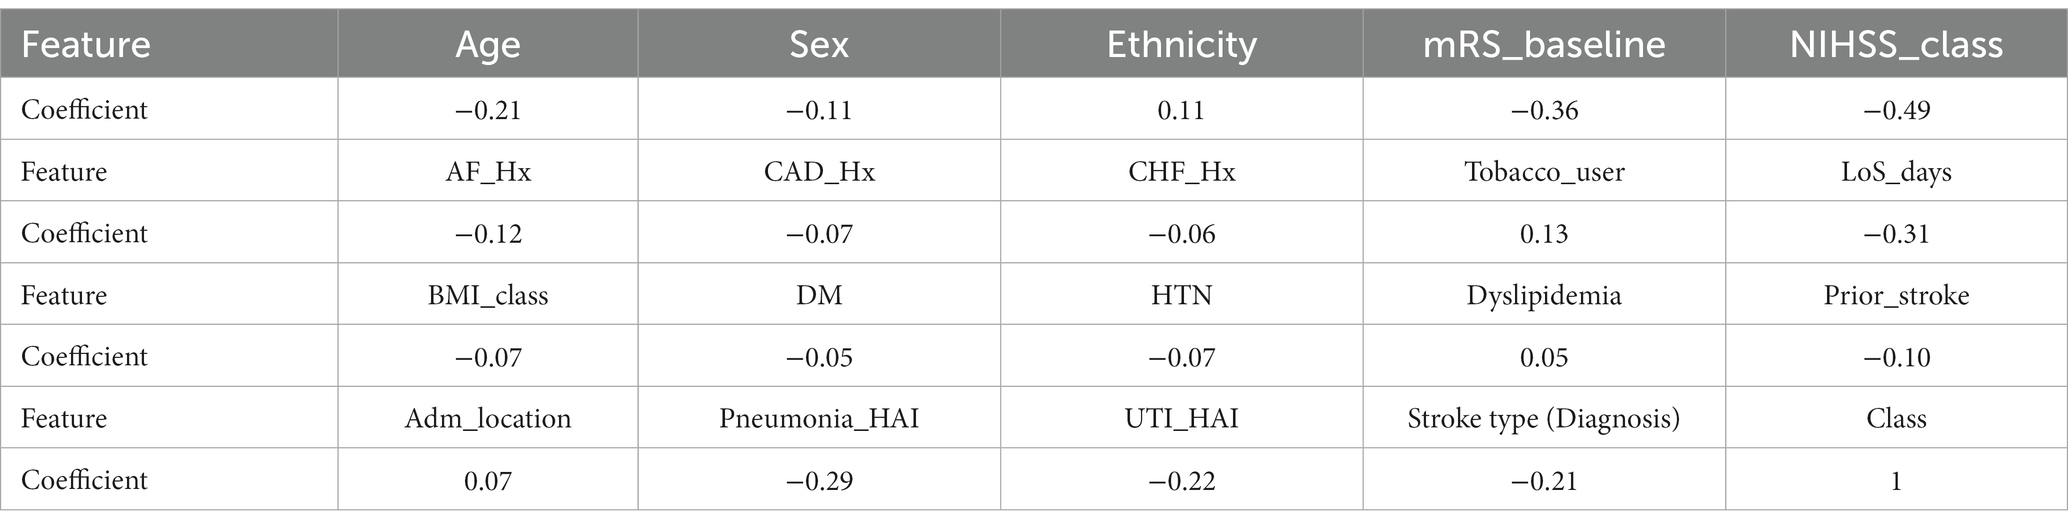
Table 2. The correlation coefficient of each feature with the other features and the class (90 mRS).
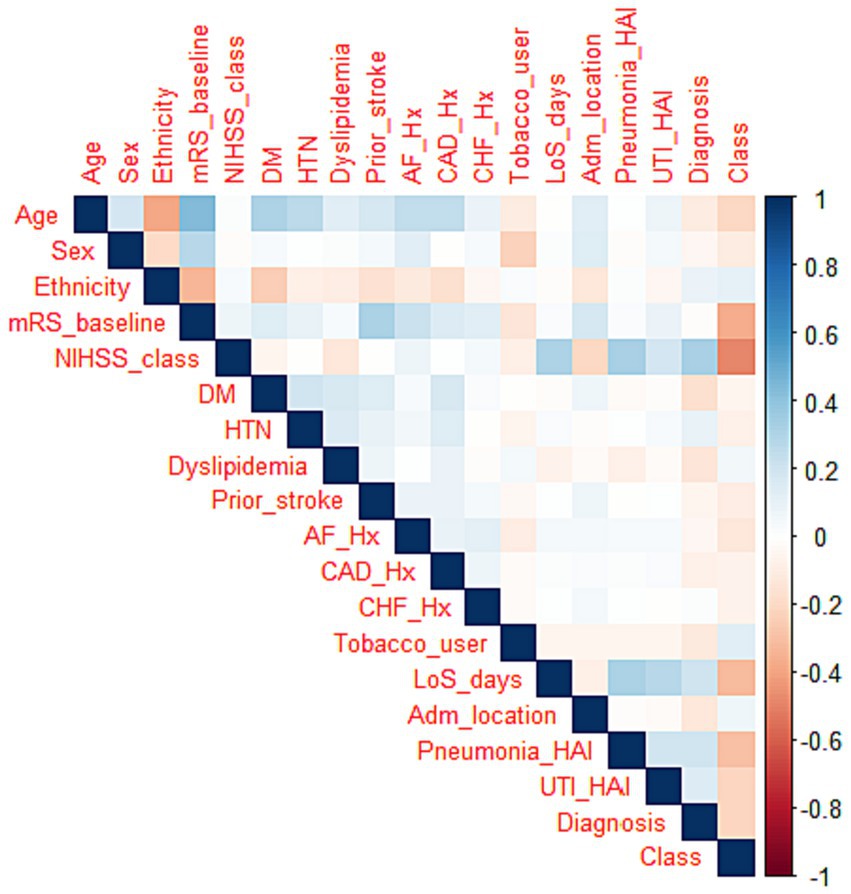
Figure 4. Correlation heat map. Strong positive correlation is represented by blue, strong negative correlation by red, and a lack of color denotes a weak correlation.
Based on Permutation/ feature importance, the classifiers ranked variables based on their importance to the prediction accuracy (Figure 3). The cross-analysis resulted in four sets of features (Table 3):
• Strong features with full agreements (SFA4): These features were identified as strong by all four methods, including pneumonia, LOS, stroke type, and NIHSS that has highest correlation coefficient in feature correlation method.
• Strong features with at least three agreements (SFA3): These features were identified as strong by at least three methods, comprising the SFA4 features and adding UTI, dyslipidemia, prior stroke, AF, CAD, CHF, tobacco use, and admission location.
• Weak features (WF12): These features were recognized as strong by only one or two methods, including age, pre-stroke mRS, sex, DM, and HTN.
• Weakest features (WF0): These features were classified as weak by all four feature selection methods, consisting of ethnicity and BMI.
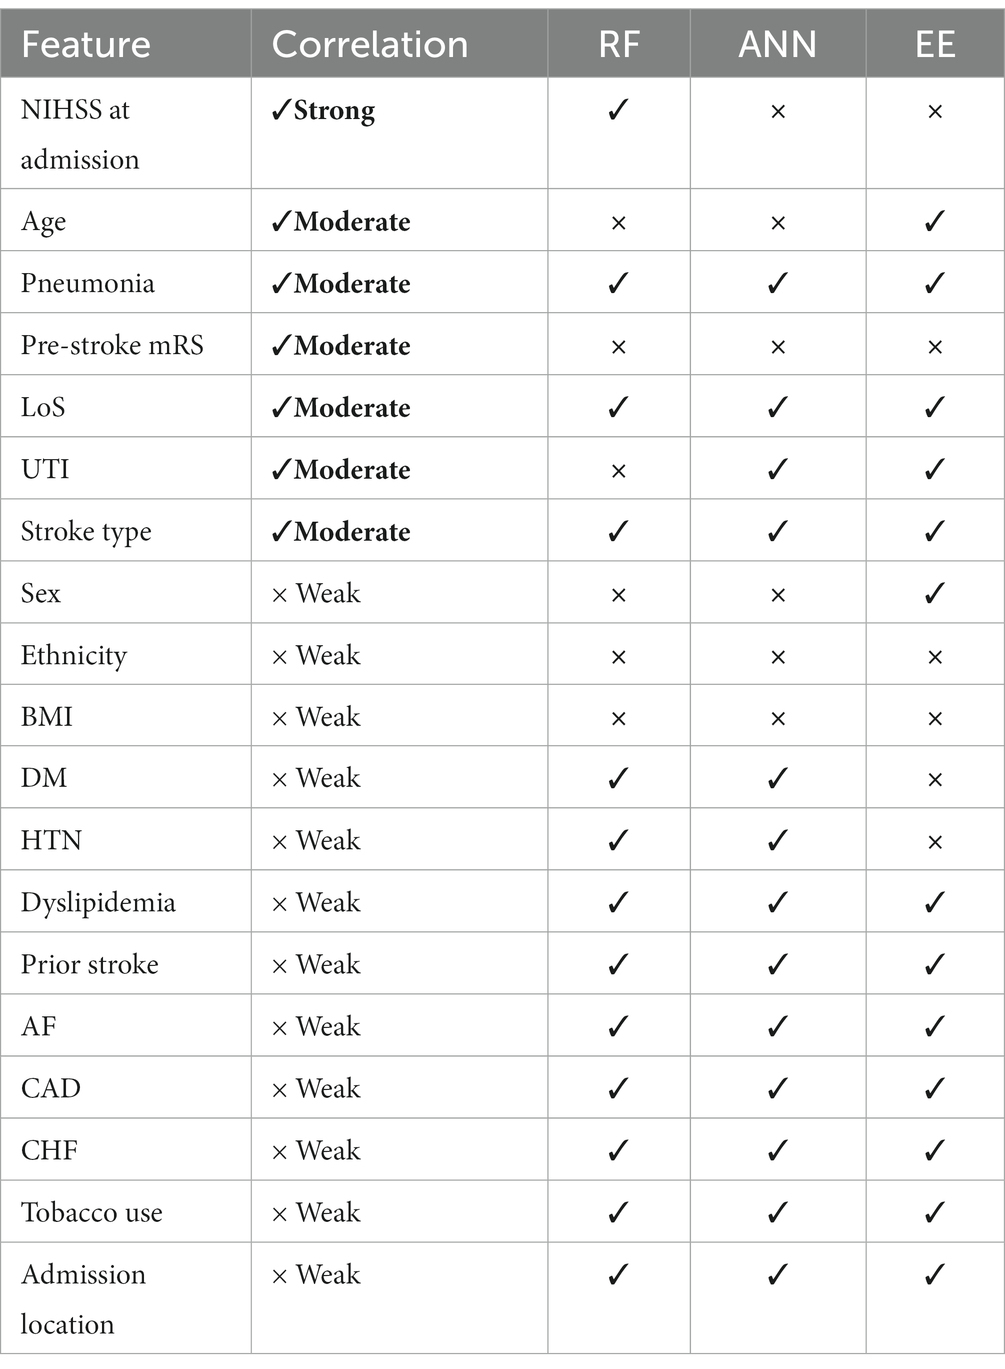
Table 3. Cross-analysis of the best features’ qualities of four feature selection methods, (✓) means the feature is selected by the method, and (×) otherwise.
Evaluation of the trained models
As demonstrated by Scrutinio and colleagues (42). Choosing the most effective machine learning model is a formidable task. This process demands the consideration of numerous performance parameters while simultaneously weighing the insights derived from the results and their relevance to the clinical field. Therefore, several experiments were conducted on the stroke data to identify the optimal machine learning model for predicting stroke prognosis. Table 4 demonstrates that RF achieved the highest performance, with an average accuracy of 82.9%, consistently showing good results. ANN followed RF in performance. Figure 5 visually confirms RF and ANN’s superiority, as their accuracy boxes are positioned toward the highest values, indicating narrower widths. Additionally, the KAPPA plots show that both classifiers approach 0.65, closer to 1 than other classifiers, signifying excellent consistency and stability over the five runs.
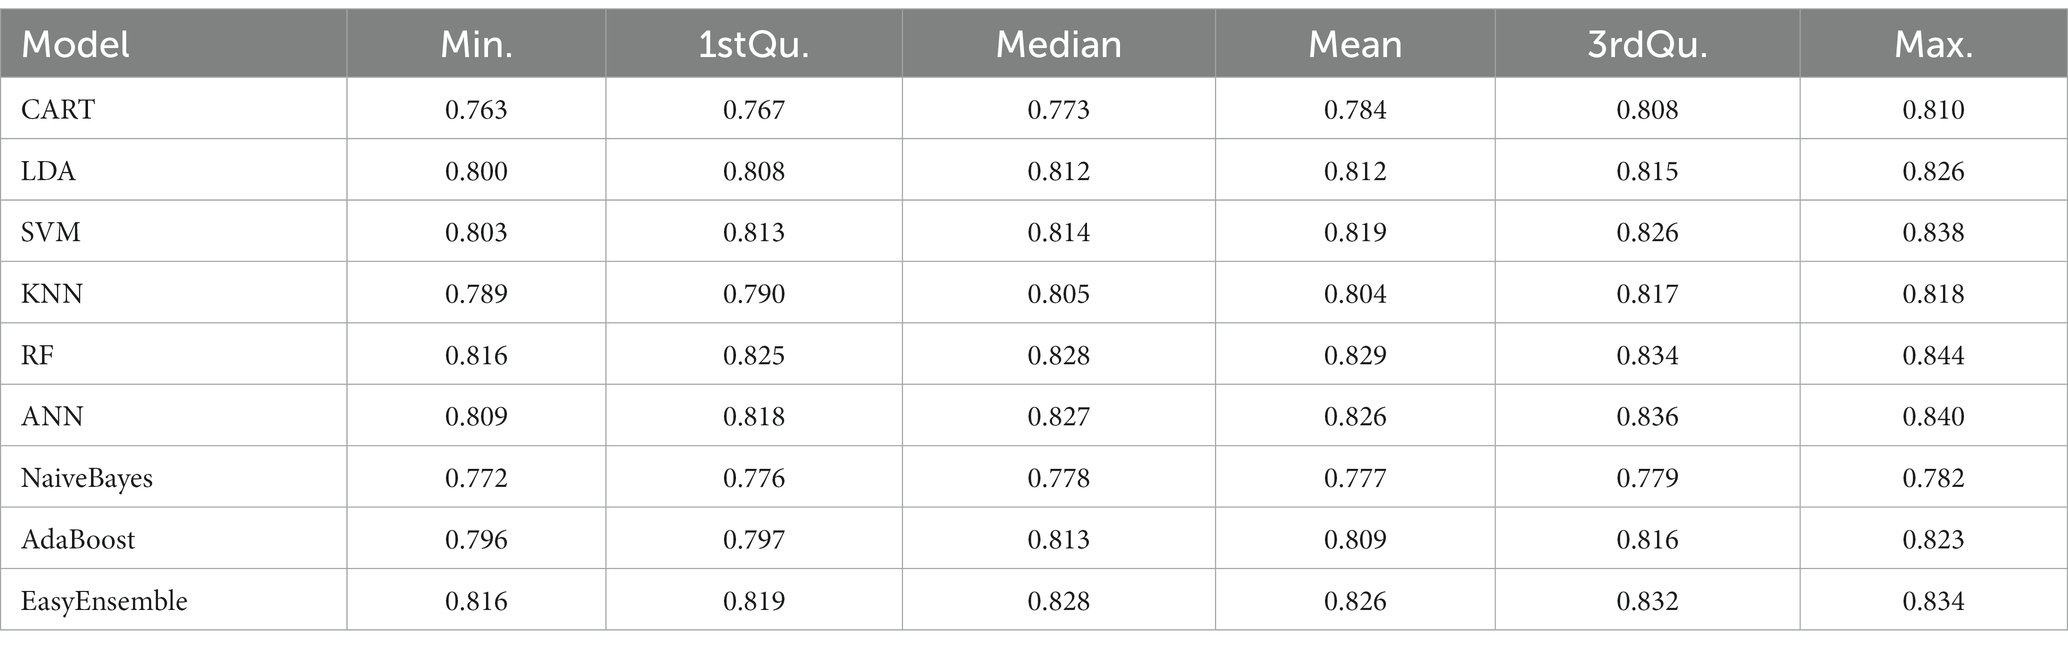
Table 4. Accuracy results of different models, using 5-fold cross-validation,
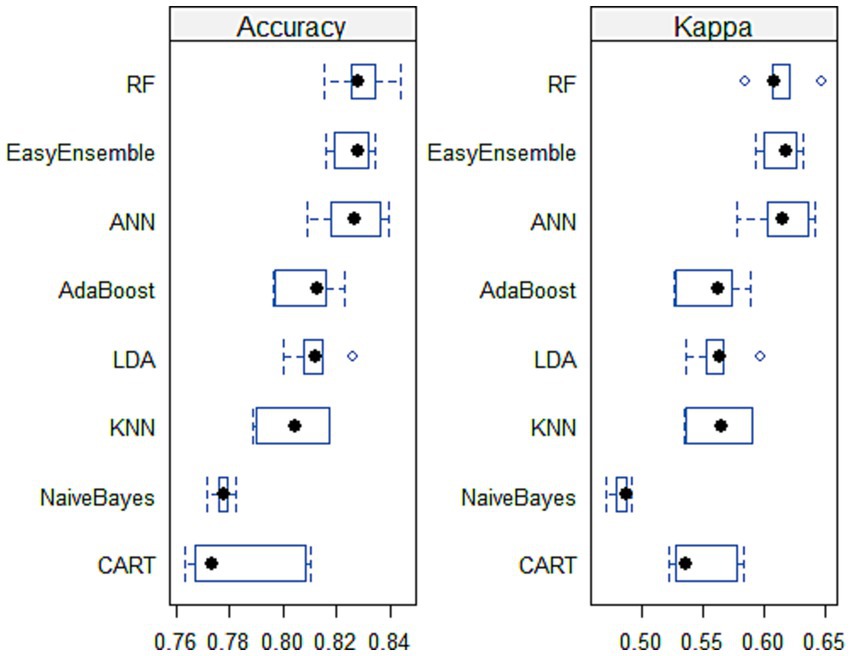
Figure 5. Box and whisker plots for classifiers’ comparison across 5-fold cross-validation.
The best performing model, RF, was evaluated using one-hot and factorized encoding. Its performance was compared with ANN in terms of F-score and AUC (Table 5 and Figure 6). Additionally, the findings of the EE classifier were studied and compared to the top performers, RF and ANN, while recording F-score and AUC measures.

Table 5. prediction results using 5-fold cross validation,
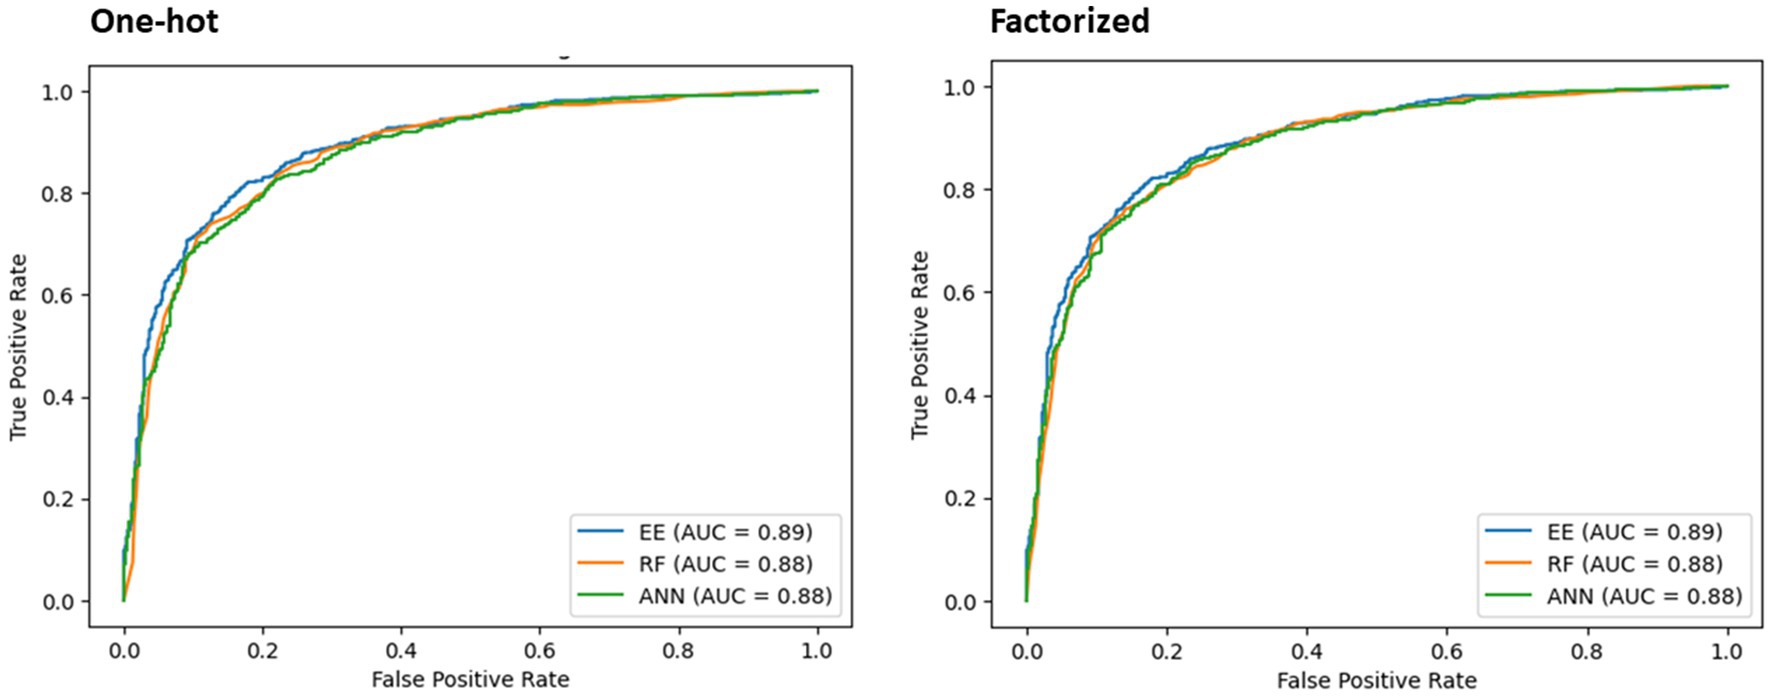
Figure 6. AUC results of the chosen classifiers using one-hot encoding and factorized encoding.
As displayed in Table 5, the classifiers’ performance using one-hot vs. factorized encoding did not exhibit significant differences. Therefore, factorized method was chosen as it helps maintain a smaller size for the training model. Taking into account the average accuracy, F-score, and AUC combined, RF demonstrated superior performance compared to the other models, making it a suitable choice for deployment.
In the final phase of this study, a third set of experiments using RF was conducted to explore the features for incorporation into the proposed system (Table 6). Surprisingly, utilizing only the strongest subsets of features (SFA4 and SFA3) hindered the system’s performance. Similarly, when weak and weakest features (WF12&WF0) or the weakest feature (WF0) were removed (as shown in Table 5), most metrics declined, except for a marginal increase in AUC when ethnicity was removed. Eliminating any feature led to a drop in the F1 measure. Based on these findings, the proposed mRS-90 prediction system includes all variables listed in Table 1, except BMI. Table 7 provides a comprehensive overview of the RF model’s performance and Figure 7 presents the significance of predictors.
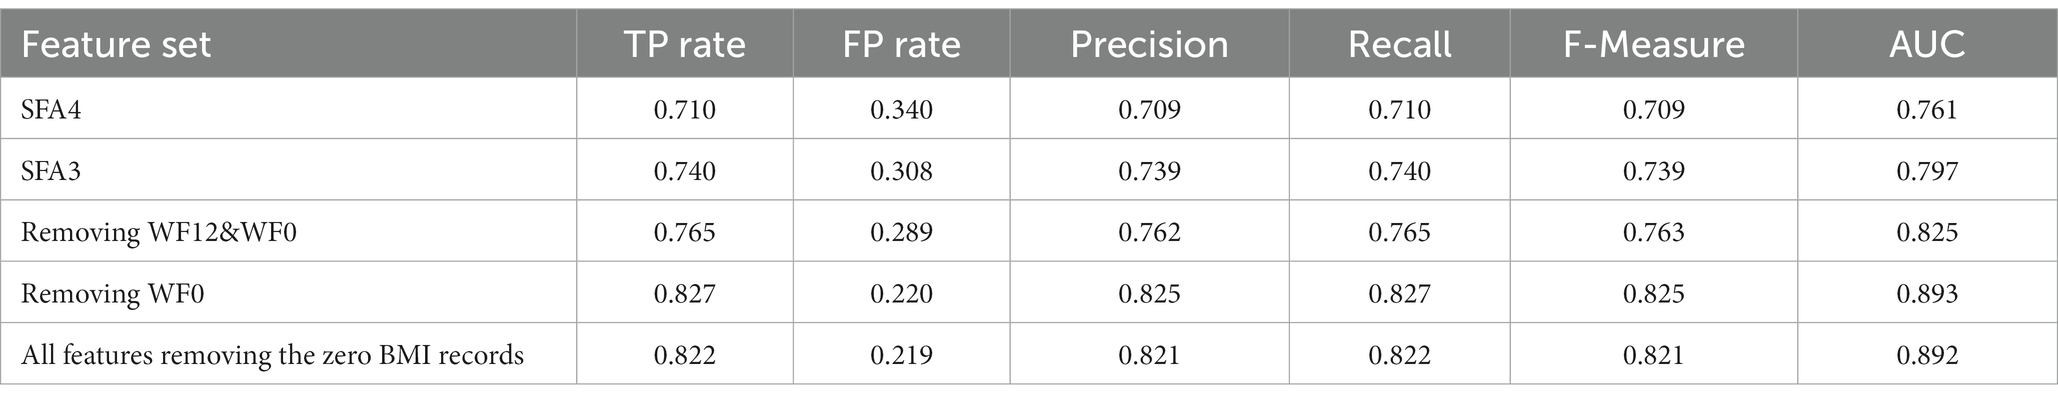
Table 6. The RF prediction results on different subsets of features.

Table 7. RF algorithm performance (the average of 5-folds).
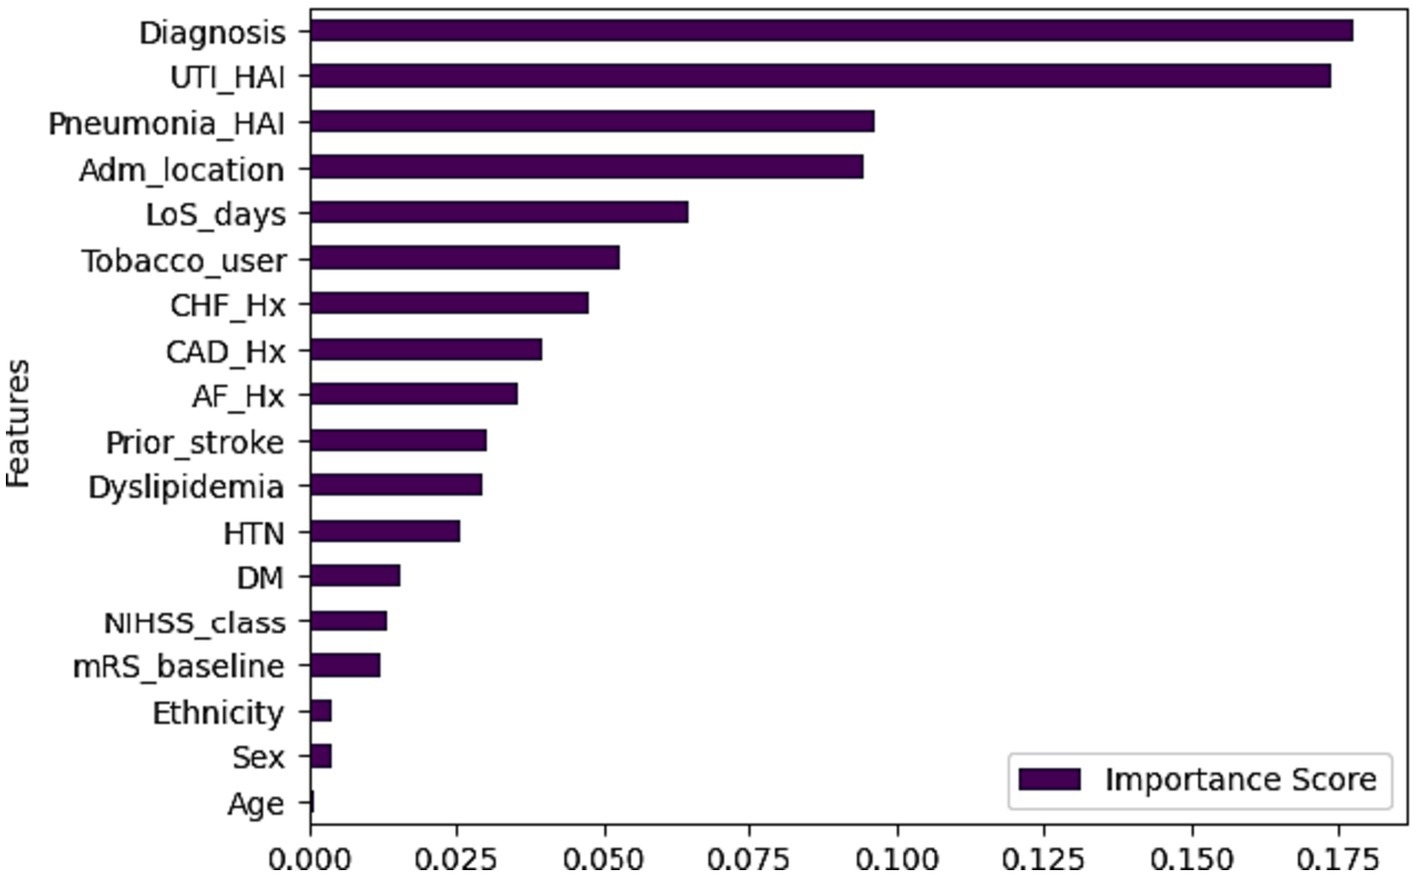
Figure 7. Predictor importance in RF.
The Random Forrest model identified a set of key predictors that help clinicians early predict the 90-day prognosis of stroke patients. The important predictors are illustrated in ascending order (Figure 3) based on their importance on predicting the target outcome.
Discussion
The use of machine learning (ML) in medical research has expanded significantly, with applications in screening, diagnosis, and prognosis (43). In this study, we aimed to devise a predictive tool based on ML to help clinicians forecast the 90-day prognosis of stroke patients after hospital discharge. Several algorithms were compared for predictive performance, and the RF algorithm emerged as the best performing classifier. Consequently, the discussion section focuses on the insights derived from the RF algorithm’s output.
Two key findings emerged from this study; firstly, feature selection revealed several variables with significant predictive power for the 90-day prognosis, including stroke type, hospital-acquired infections (UTI and pneumonia), admission location, known comorbidities, and other risk factors such as smoking. Secondly, the discrimination power (AUC) of all the models was excellent (0.893) (44), providing a high degree of confidence in the accuracy of the model’s predictions. Also, the RF model’s performance surpassed conventional statistical methods heavily relying on logistic regression to predict disease outcomes, where AUC is typically <0.8 (11, 45, 46).
Past studies have shown that predicting the 90-day prognosis is influenced by factors such as stroke severity, sex, age, stroke type, mRS and NIHSS scores at admission and discharge, body mass index (BMI), comorbidities, smoking history, and in-hospital length of stay (9, 11, 12, 14). In this study, we identified several predictors and ranked them based on their importance, as presented in Figure 7. Predictor importance is determined by the variable’s impact on the model’s ability to predict the outcome, with the most influential predictor ranked first. Subsequently, other variables are ranked relative to the most influential predictor (47).
This study identified the stroke type as the strongest predictor for the 90-day prognosis. In our secondary analysis, we found that 59% of patients with ICH had unfavorable mRS at the 90-day follow-up, while only 31.5% of patients with IS had unfavorable outcomes (value of p < 0.05). This indicates that ICH serves as an early predictor of an unfavorable prognosis, aligning with previous research that associates ICH with adverse outcomes, particularly mortality, when compared to IS (48). Furthermore, the severity of presentation at the hospital was higher for patients diagnosed with ICH. Only 8.9% of IS patients presented with an NIHSS score greater than 16, whereas 39.8% of ICH patients had a higher severity score (value of p < 0.05). Moreover, the occurrence of hospital-acquired UTI and pneumonia emerged as strong predictors for stroke patient prognosis. Stroke patients are known to be at significant risk of infections during hospitalization, which can worsen their functional outcomes (49). The study revealed that 88.1% of patients who experienced hospital-acquired UTI and 90% of those who developed hospital-acquired pneumonia had an unfavorable 90-day mRS (value of p < 0.05).
Admission location significantly influenced the 90-day prognosis. Among patients admitted to the critical care unit, 77.9% had an unfavorable prognosis, contrasting with 33.8 and 26.3% in the stroke unit and other units, respectively (value of p < 0.05). This relationship might be associated with factors like the severity of presentation, leading to critical care unit admissions. 64% of critical care unit patients had NIHSS score > 16 compared to 8.3 and 5.8% in the stroke unit and general scope units, respectively (value of p < 0.05). Additionally, a majority of critical care unit patients were diagnosed with ICH (61.6% vs. 38.4%), explaining the worse prognosis compared to other admission locations. The literature supports that specialized stroke units lead to favorable outcomes (50, 51), but patients in critical care units tend to have poorer prognoses (52).
Similar to previous research, the LOS was significantly correlated with the 90-day mRS (12). Patients with unfavorable 90-day mRS had an average LOS of 10.3 days, compared to 4.4 days for those with favorable outcomes (value of p < 0.05).
The study revealed that smoking history plays a role in predicting the 90-day prognosis. Surprisingly, individuals with a history of tobacco consumption had a more favorable prognosis compared to non-smokers. Only 24.1% of tobacco users had an unfavorable 90-day mRS, while 39.4% of non-smokers had unfavorable outcomes (value of p < 0.05). This interesting phenomenon is known as the tobacco paradox in stroke, where smokers exhibit more favorable outcomes than non-smokers (53). Some researchers attribute this paradox to the age difference between the smoker and non-smoker groups. In other words, “the more you smoke, the earlier you stroke and the longer you have to cope” (53). Consistent with previous research, this study found that tobacco consumers had a mean age of 51, whereas non-smokers had a mean age of 55 (value of p < 0.05). This finding shed light on the complex relationship between smoking history, age, and stroke prognosis.
Regarding comorbidities, the study found that, apart from dyslipidemia, patients with CHF, CAD, AF, prior stroke, HTN, and DM were more prone to poorer 90-day prognosis (69.6% vs. 35.9, 45% vs. 35, 60.7% vs. 34.8, 49.5% vs. 34.5, 38.2% vs. 30.4, 38.5% vs. 33.5% respectively) with a value of p < 0.05. These findings align with much of the past research (11, 14, 48). Dyslipidemia, known as a major risk factor for developing stroke and affecting stroke outcomes (54), showed an interesting result in this study. Patients with dyslipidemia were found to be less prone to unfavorable 90-day mRS, with 33.4% compared to 38.4% for non-dyslipidemia patients (value of p < 0.05). In a meta-analysis that studied the impact of several comorbidities on stroke outcomes, particularly recurrence, dyslipidemia turned to have insignificant relationship (55). It’s important to consider the specific characteristics and interactions within the study population when interpreting the impact of dyslipidemia on stroke outcomes.
Consistent with existing literature, the severity of stroke, as measured by NIHSS, is a strong predictor of stroke outcomes and prognosis (9, 11, 14). This study corroborates these findings, revealing that higher admission NIHSS scores are associated with an elevated risk of unfavorable 90-day mRS. Specifically, 85.4% of patients with severe NIHSS scores (>16) had unfavorable 90-day mRS, in contrast to 27.5% of those with NIHSS scores <16 (value of p < 0.05). Furthermore, the mRS prior to stroke onset, collected from family members and calculated by treating physicians, plays a significant role in predicting prognosis. Patients with mRS > 2 before the latest stroke onset were more likely to have an unfavorable 90-day mRS. Notably, 92.8% of patients with mRS > 2 prior to stroke onset had unfavorable mRS at 90 days, compared to 38.5% of those with mRS ≤ 2 (10, 12).
Ethnicity also imposes a significant risk of stroke development among certain groups (56). In this study, patients belonging to the MENA region had a 42.5% risk of unfavorable 90-day mRS, whereas patients from South-Asia, South-East Asia, and other ethnicities had percentages of 32.3, 33.9, and 30.6%, respectively, (value of p < 0.05). Interestingly, Qatari patients had the highest risk of unfavorable 90-day mRS compared to all other patients, with 48.7% versus 33.3% (value of p < 0.05). This observation may be attributed to Qatar’s unique demographic structure, where the majority of the population comprises, expatriates living and working in Qatar (4, 24). Consequently, they tend to be significantly younger than Qatari patients at the time of stroke presentation, with a mean age of 64 ± 14 years compared to 52.8 ± 12 years (value of p < 0.05).
Patient sex plays a significant role in predicting stroke prognosis (9, 12). This study found that 46.3% of female patients had unfavorable 90-day mRS, compared to 33.5% of male patients (value of p < 0.05). Although there was no significant difference in stroke severity between male and female patients, the mean age of female patients was significantly higher than that of male patients (59.5 ± 16 years vs. 53 ± 13 years, value of p < 0.05). This finding is consistent with previous research conducted in Qatar (57). Age, as in previous studies, was found to significantly predict stroke prognosis (11). The study found that the average age of stroke patients with unfavorable 90-day mRS was significantly higher than the average age of those with a favorable mRS; 58 ± 15 years vs. 52 ± 12 years (value of p < 0.05). This further emphasizes the importance of considering age as a relevant factor in early predicting stroke outcomes.
Body Mass Index (BMI) was excluded in the model training and testing phase as it ranked as one of the weakest features (WF0) and was not prioritized by any feature selection methods. Including BMI led to a significant decline in system performance. Additionally, around 5% of included records had missing BMI values, and training models on approximate or hypothesized data in the medical field can distort predictive performance, impacting clinical decision-making (58, 59). Thus, BMI was not considered in the final predictive model. Another option is to exclude all the instances where the BMI is missing. Here we eliminated 393 instances with BMI = 0 from the dataset. We found that the predictive performance, as shown in Table 6, was marginally lower than when the full feature was excluded. We acknowledge the significance of quantifying the influence of data handling decisions on model performance, and we have recorded these findings to demonstrate the trade-off between removing the feature that has missing data and preserving predictive accuracy. However, this could be a dilemma: which to remove? the missing data instances? Or the entire feature? The first option eliminates a number of instances that may be significant to the learning process, whereas the second option eliminates a feature that may be important to the learning process. As a result, we believe that answering such a question is primarily dependent on the dataset investigated; in our dataset, we found that it is preferable to delete the entire feature from the final prediction system.
From another angle, this study demonstrates that the Random Forest (RF) model outperformed the other tested models, achieving maximum accuracy and excellent discrimination power (AUC > 0.8). This promising finding suggests that the RF model can be deployed in clinical settings to early predict the 90-day prognosis, enabling care providers to devise personalized plans that enhance preventive measures and ensure better quality of life for stroke patients.
The RF model demonstrated superior performance compared to conventional statistical methods, which often rely on logistic regression with AUCs typically <0.8 (11, 45, 46). The powerful predictive capacity of machine learning makes prospective validation of the RF algorithm essential to assess its real-world performance in clinical settings (60). External validation remains a critical step for clinical implementation of recent machine learning models. This study lays the groundwork for further validation and potential real-world deployment of the RF model, opening new avenues for stroke prognosis prediction and patient care. Future prospective deployment and validation should prioritize high-quality, well-described databases with sufficient sample sizes, comprehensive patient tracking, and clinically significant endpoints.
Limitations
The study has several limitations that may present opportunities for future research in this field. The study’s predictive model demonstrated impressive performance in predicting stroke outcomes, providing valuable insights into prognosis prediction. However, to ensure the reliability and applicability of the model, external validation in diverse patient populations is crucial. This external validation will test the model’s robustness and verify its effectiveness across different healthcare settings and stroke cases.
Data quality issues led to the exclusion of certain variables from the prediction system. While this was necessary to maintain data integrity, it is important to recognize that excluding BMI, that has been found in previous research to play a significant role in predicting stroke outcomes. Exploring ways to address data quality and incorporate important variables like BMI in future studies may enhance the model’s predictive capabilities.
Moreover, the study’s context in Qatar might limit its generalizability to other regions with different demographic and healthcare characteristics. To increase the model’s applicability worldwide, similar studies should be conducted in diverse populations, considering regional variations in stroke risk factors and healthcare practices.
In summary, despite its promising performance, the study’s predictive model needs further validation, inclusion of imaging data, and consideration of variables excluded due to data quality issues to ensure its effectiveness and applicability in diverse clinical settings and populations. Addressing these limitations will contribute to the advancement of stroke prognosis prediction, ultimately leading to improved patient care and outcomes.
Conclusion
The results of this study highlight the superiority of the Random Forest (RF) model over other tested models, showcasing its remarkable accuracy and discrimination power (AUC 0.893). This promising finding opens avenues for deploying the RF model in clinical settings to early predict 90-day prognosis, enabling personalized care plans that enhance preventive measures and improve the quality of life for stroke patients.
The RF model’s performance surpasses conventional statistical methods, such as logistic regression, commonly yielding lower AUC values. Embracing the powerful predictive capacity of machine learning, it is imperative to prospectively validate the RF algorithm to assess its real-world clinical performance. This validation process will provide essential insights into the model’s effectiveness, reliability, and potential for practical implementation in clinical settings. By rigorously examining its predictive capabilities, full potential of the RF model can be unlocked, advancing stroke prognosis prediction and enhancing patient care outcomes.
The study lays the foundation for further validation and potential real-world deployment of the RF model, representing a significant step forward in stroke prognosis prediction and patient care. By embracing machine learning predictive capacity, healthcare providers can better tailor interventions and optimize outcomes for stroke patients, ultimately advancing the field of stroke research and treatment.
Data availability statement
The raw data supporting the conclusions of this article will be made available by the authors, without undue reservation.
Ethics statement
The studies involving humans were approved by the Institutional Review Board (IRB) at the Medical Research Center, Hamad Medical Corporation, Doha, Qatar (MRC-01-22-594). The studies were conducted in accordance with the local legislation and institutional requirements. Written informed consent for participation was not required from the participants or the participants’ legal guardians/next of kin in accordance with the national legislation and institutional requirements.
Author contributions
AA: Conceptualization, Data curation, Formal analysis, Methodology, Writing – original draft, Writing – review & editing. IA: Data curation, Formal analysis, Methodology, Writing – original draft, Writing – review & editing. YI: Conceptualization, Data curation, Methodology, Writing – original draft, Writing – review & editing. AN: Data curation, Methodology, Writing – original draft, Writing – review & editing. NA: Data curation, Methodology, Writing – original draft, Writing – review & editing. OA: Data curation, Methodology, Writing – original draft, Writing – review & editing. AT: Data curation, Formal analysis, Methodology, Writing – original draft, Writing – review & editing. AH: Data curation, Formal analysis, Methodology, Writing – original draft, Writing – review & editing.
Funding
The author(s) declare financial support was received for the research, authorship, and/or publication of this article. This study has been funded by the Medical Research Center at Hamad Medical Corporation, Qatar (Grant No. MRC-01-22-594).
Conflict of interest
The authors declare that the research was conducted in the absence of any commercial or financial relationships that could be construed as a potential conflict of interest.
Publisher’s note
All claims expressed in this article are solely those of the authors and do not necessarily represent those of their affiliated organizations, or those of the publisher, the editors and the reviewers. Any product that may be evaluated in this article, or claim that may be made by its manufacturer, is not guaranteed or endorsed by the publisher.
References
1. Zhang, R, Liu, H, Pu, L, Zhao, T, Zhang, S, Han, K, et al. Global burden of ischemic stroke in young adults in 204 countries and territories. Neurology. (2023) 100:e422–34. doi: 10.1212/WNL.0000000000201467
2. Rana, JS, Khan, SS, Lloyd-Jones, DM, and Sidney, S. Changes in mortality in top 10 causes of death from 2011 to 2018. J Gen Intern Med. (2021) 36:2517–8. doi: 10.1007/s11606-020-06070-z
3. Feigin, VL, Brainin, M, Norrving, B, Martins, S, Sacco, RL, Hacke, W, et al. World stroke organization (WSO): global stroke fact sheet 2022. Int J Stroke. (2022) 17:18–29. doi: 10.1177/17474930211065917
4. Imam, YZ, Kamran, S, Saqqur, M, Ibrahim, F, Chandra, P, Perkins, JD, et al. Stroke in the adult Qatari population (Q-stroke) a hospital-based retrospective cohort study. PloS One. (2020) 15:e0238865. doi: 10.1371/journal.pone.0238865
5. Imam, Y, Kamran, S, Akhtar, N, Deleu, D, Singh, R, Malik, R, et al. Incidence, clinical features and outcomes of atrial fibrillation and stroke in Qatar. Int J Stroke. (2020) 15:85–9. doi: 10.1177/1747493019830577
6. Haranhalli, N, Javed, K, Boyke, A, Dardick, J, Naidu, I, Ryvlin, J, et al. A predictive model for functional outcome in patients with acute ischemic stroke undergoing endovascular Thrombectomy. J Stroke Cerebrovasc Dis. (2021) 30:106054. doi: 10.1016/j.jstrokecerebrovasdis.2021.106054
7. Matsuo, R, Ago, T, Kiyuna, F, Sato, N, Nakamura, K, Kuroda, J, et al. Smoking status and functional outcomes after acute ischemic stroke. Stroke. (2020) 51:846–52. doi: 10.1161/STROKEAHA.119.027230
8. Deng, W, Teng, J, Liebeskind, D, Miao, W, and Du, R. Predictors of infarct growth measured by apparent diffusion coefficient quantification in patients with acute ischemic stroke. World Neurosurg. (2019) 123:e797–802. doi: 10.1016/j.wneu.2018.12.051
9. Gardener, H, Romano, LA, Smith, EE, Campo-Bustillo, I, Khan, Y, Tai, S, et al. Functional status at 30 and 90 days after mild ischaemic stroke. Stroke and vascular neurology. (2022) 7:375–80. doi: 10.1136/svn-2021-001333
10. Abdelghany, H, Elsayed, M, Elmeligy, A, and Hatem, G. Prediction of acute cerebrovascular stroke disability using mSOAR score (stroke subtype, Oxfordshire community stroke project, age, mRS and NIHSS). Egyptian J Neurol, Psychiatry and Neurosurgery. (2023) 59:21. doi: 10.1186/s41983-023-00626-6
11. Chen, S, You, J, Yang, X, Gu, H, Huang, X, Liu, H, et al. Machine learning is an effective method to predict the 90-day prognosis of patients with transient ischemic attack and minor stroke. BMC Med Res Methodol. (2022) 22:195. doi: 10.1186/s12874-022-01672-z
12. ElHabr, AK, Katz, JM, Wang, J, Bastani, M, Martinez, G, Gribko, M, et al. Predicting 90-day modified Rankin scale score with discharge information in acute ischaemic stroke patients following treatment. BMJ Neurol Open. (2021) 3:e000177. doi: 10.1136/bmjno-2021-000177
13. Zhang, MY, Mlynash, M, Sainani, KL, Albers, GW, and Lansberg, MG. Ordinal prediction model of 90-day modified Rankin scale in ischemic stroke. Front Neurol. (2021) 12:727171. doi: 10.3389/fneur.2021.727171
14. Ozkara, BB, Karabacak, M, Hamam, O, Wang, R, Kotha, A, Khalili, N, et al. Prediction of functional outcome in stroke patients with proximal middle cerebral artery occlusions using machine learning models. J Clin Med. (2023) 12:839. doi: 10.3390/jcm12030839
15. Holodinsky, JK, Yu, AY, Kapral, MK, and Austin, PC. Using random forests to model 90-day hometime in people with stroke. BMC Med Res Methodol. (2021) 21:102. doi: 10.1186/s12874-021-01289-8
16. Khatri, P, Conaway, MR, Johnston, KC, and Investigators, ASAPS. Ninety-day outcome rates of a prospective cohort of consecutive patients with mild ischemic stroke. Stroke. (2012) 43:560–2. doi: 10.1161/STROKEAHA.110.593897
17. Heit, JJ, Mlynash, M, Kemp, SM, Lansberg, MG, Christensen, S, Marks, MP, et al. Rapid neurologic improvement predicts favorable outcome 90 days after thrombectomy in the DEFUSE 3 study. Stroke. (2019) 50:1172–7. doi: 10.1161/STROKEAHA.119.024928
18. Purrucker, J, Hametner, C, Engelbrecht, A, Bruckner, T, Popp, E, and Poli, S. Comparison of stroke recognition and stroke severity scores for stroke detection in a single cohort. J Neurol Neurosurg Psychiatry. (2015) 86:1021–8. doi: 10.1136/jnnp-2014-309260
19. Brott, T, Adams, HP, Olinger, CP, Marler, JR, Barsan, WG, Biller, J, et al. Measurements of acute cerebral infarction: a clinical examination scale. Stroke. (1989) 20:864–70. doi: 10.1161/01.STR.20.7.864
20. Adams, H, Bendixen, B, Kappelle, L, Biller, J, Love, B, Gordon, D, et al. Classification of subtype of acute ischemic stroke. Definitions for use in a multicenter clinical trial. TOAST. Trial of org 10172 in acute stroke treatment. Stroke. (1993) 24:35–41. doi: 10.1161/01.STR.24.1.35
21. Center of Disease Control (CDC). Defining Adult Overweight & Obesity. (2022). Available at: https://www.cdc.gov/obesity/basics/adult-defining.html
22. Saqqur, M, Salam, A, Ayyad, A, Akhtar, N, Ali, M, Khan, A, et al. The prevalence, mortality rate and functional outcome of intracerebral hemorrhage according to age sex and ethnic Group in the State of Qatar. Clin Neurol Neurosurg. (2020) 199:106255. doi: 10.1016/j.clineuro.2020.106255
23. UNICEF. Seizing the opportunity: Ending AIDS in the Middle East and North Africa. Amman: United Nations Children’s Fund (UNICEF). (2019).
24. Gulli, G, Rutten-Jacobs, L, Kalra, L, Rudd, A, Wolfe, C, and Markus, H. Differences in the distribution of stroke subtypes in a UK black stroke population - final results from the South London ethnicity and stroke study. BMC Med. (2016) 14:77. doi: 10.1186/s12916-016-0618-2
25. Banks, J, and Marotta, C. Outcomes validity and reliability of the modified Rankin scale: implications for stroke clinical trials: a literature review and synthesis. Stroke. (2007) 38:1091–6. doi: 10.1161/01.STR.0000258355.23810.c6
26. Garcia-Laencina, P, Abreu, P, Abreu, M, and Afonoso, N. Missing data imputation on the 5-year survival prediction of breast Cancer patients with unknown discrete values. Comput Biol Med. (2015) 59:125–33. doi: 10.1016/j.compbiomed.2015.02.006
27. Abujaber, A, Fadlalla, A, Gammoh, D, Al-Thani, H, and El-Menyar, A. Machine learning model to predict ventilator associated pneumonia in patients with traumatic brain injury: the C.5 decision tree approach. Brain Inj. (2021) 35:1095–102. doi: 10.1080/02699052.2021.1959060
28. Markey, MK, Tourassi, GD, Margolis, M, and DeLong, DM. Impact of missing data in evaluating artificial neural networks trained on complete data. Comput Biol Med. (2006) 36:516–25. doi: 10.1016/j.compbiomed.2005.02.001
29. Hall, M. Correlation-based feature selection for machine learning (Doctoral dissertation, The University of Waikato). (1999).
30. Altmann, A, Toloşi, L, Sander, O, and Lengauer, T. Permutation importance: a corrected feature importance measure. Bioinformatics. (2010) 26:1340–7. doi: 10.1093/bioinformatics/btq134
31. Yang, G, Liu, S, Li, Y, and He, L. Short-term prediction method of blood glucose based on temporal multi-head attention mechanism for diabetic patients. Biomedical Signal Processing and Control. (2023) 82:104552. doi: 10.1016/j.bspc.2022.104552
32. Alkhawaldeh, I, Al-Jafari, M, Abdelgalil, M, Tarawneh, A, and Hassanat, A. P-358 a machine learning approach for predicting bone metastases and its three-month prognostic risk factors in hepatocellular carcinoma patients using SEER data. Ann Oncol. (2023) 34:S140. doi: 10.1016/j.annonc.2023.04.414
33. Krzywinski, M, and Altman, N. Classification and regression trees. Nat Methods. (2017) 14:757–8. doi: 10.1038/nmeth.4370
35. Dag, A, Oztekin, A, Yucel, A, Bulur, S, and Megahed, F. Predicting heart transplantation outcomes through data analytics. Decis Support Syst. (2017) 94:42–52. doi: 10.1016/j.dss.2016.10.005
36. Fernandez-Lozano, C, Hervella, P, Mato-Abad, V, Rodríguez-Yáñez, M, Suárez-Garaboa, S, López-Dequidt, I, et al. Random forest-based prediction of stroke outcome. Sci Rep. (2021) 11:10071. doi: 10.1038/s41598-021-89434-7
37. Abujaber, A, Fadlalla, A, Gammoh, D, Abdelrahman, H, Mollazehi, M, and El-Menyar, A. Prediction of in-hospital mortality in patients with post traumatic brain injury using National Trauma Registry and machine learning approach. Scand J Trauma Resusc Emerg Med. (2020) 28:44. doi: 10.1186/s13049-020-00738-5
38. Ali, N, Neagu, D, and Trundle, P. Evaluation of k-nearest neighbour classifier performance for heterogeneous data sets. SN App Sci. (2019) 1:1–15. doi: 10.1007/s42452-019-1356-9
39. Dempster, AP, Laird, NM, and Rubin, DB. Maximum likelihood from incomplete data via the EM algorithm. J R Stat Soc B Methodol. (1977) 39:1–22.
40. Liu, X-Y, Wu, J, and Zhou, Z-H. Exploratory undersampling for class-imbalance learning. IEEE Trans Syst Man Cybern B Cybern. (2008) 39:539–50. doi: 10.1109/TSMCB.2008.2007853
41. Mortaz, E . Imbalance accuracy metric for model selection in multi-class imbalance classification problems. Knowl-Based Syst. (2020) 210:106490. doi: 10.1016/j.knosys.2020.106490
42. Scrutinio, D, Ricciardi, C, Donisi, L, Losavio, E, Battista, P, Guida, P, et al. Machine learning to predict mortality after rehabilitation among patients with severe stroke. Sci Rep. (2020) 10:20127. doi: 10.1038/s41598-020-77243-3
43. Abujaber, A, Nashwan, A, and Fadlalla, A. Harnessing machine learning to support evidence-based medicine: a pragmatic reconciliation framework. Intelligence-Based Med. (2022) 6:100048. doi: 10.1016/j.ibmed.2022.100048
44. Mandrekar, J . Receiver operating characteristic curve in diagnostic test assessment. J Thorac Oncol. (2010) 5:1315–6. doi: 10.1097/JTO.0b013e3181ec173d
45. Mistry, E, Yeatts, S, de Havenon, A, Mehta, T, and Arora, N. De Los Rios La Rosa F, et al. predicting 90-day outcome after Thrombectomy: baseline-adjusted 24-hour NIHSS is more powerful than NIHSS score change. Stroke. (2021) 52:2547–53. doi: 10.1161/STROKEAHA.120.032487
46. Hendrix, P, Melamed, I, Collins, M, Lieberman, N, Sharma, V, Goren, O, et al. NIHSS 24 h after mechanical Thrombectomy predicts 90-day functional outcome. Clin Neuroradiol. (2022) 32:401–6. doi: 10.1007/s00062-021-01068-4
47. Abujaber, A, Fadlalla, A, Nashwan, A, El-Menyar, A, and Al-Thani, H. Predicting prolonged length of stay in patients with traumatic brain injury: a machine learning approach. Intelligence-Based Med. (2022) 6:100052. doi: 10.1016/j.ibmed.2022.100052
48. Namale, G, Kamacooko, O, Makhoba, A, Mugabi, T, Ndagire, M, Ssanyu, P, et al. Predictors of 30-day and 90-day mortality among hemorrhagic and ischemic stroke patients in urban Uganda: a prospective hospital-based cohort study. BMC Cardiovasc Disord. (2020) 20:442. doi: 10.1186/s12872-020-01724-6
49. Grieten, J, Chevalier, P, Lesenne, A, Ernon, L, Vandermeulen, E, Panis, E, et al. Hospital-acquired infections after acute ischaemic stroke and its association with healthcare-related costs and functional outcome. Acta Neurol Belg. (2022) 122:1281–7. doi: 10.1007/s13760-022-01977-2
50. Turner, M, Barber, M, Dodds, H, Dennis, M, Langhorne, P, and Macleod, MJ. The impact of stroke unit care on outcome in a Scottish stroke population, taking into account case mix and selection bias. J Neurol Neurosurg Psychiatry. (2015) 86:314–8. doi: 10.1136/jnnp-2013-307478
51. Rodgers, H, and Price, C. Stroke unit care, inpatient rehabilitation and early supported discharge. Clinical Med J. (2017) 17:173–7. doi: 10.7861/clinmedicine.17-2-173
52. Carval, T, Garret, C, Guillon, B, Lascarrou, J, Martin, M, Lemarié, J, et al. Outcomes of patients admitted to the ICU for acute stroke: a retrospective cohort. BMC Anesthesiol. (2022) 22:235. doi: 10.1186/s12871-022-01777-4
53. Wang, H, Huang, C, Sun, Y, Li, J, Chen, C, Sun, Y, et al. Smoking Paradox in Stroke Survivors? Stroke. (2020) 51:1248–56. doi: 10.1161/STROKEAHA.119.027012
54. Chang, Y, Eom, S, Kim, M, and Song, T. Medical Management of Dyslipidemia for secondary stroke prevention: narrative review. Medicina. (2023) 59:776. doi: 10.3390/medicina59040776
55. Zheng, S, and Yao, B. Impact of risk factors for recurrence after the first ischemic stroke in adults: a systematic review and meta-analysis. J Clin Neurosci. (2019) 60:24–30. doi: 10.1016/j.jocn.2018.10.026
56. Schwamm, L, Reeves, M, Pan, W, Smith, E, Frankel, M, Olson, D, et al. Race/ethnicity, quality of care, and outcomes in ischemic stroke. Circulation. (2010) 121:1492–501. doi: 10.1161/CIRCULATIONAHA.109.881490
57. Akhtar, N, Kate, M, Kamran, S, Singh, R, Bhutta, Z, Saqqur, M, et al. Sex-specific differences in short-term and long-term outcomes in acute stroke patients from Qatar. Eur Neurol. (2020) 83:154–61. doi: 10.1159/000507193
58. Tarawneh, A, Hassanat, A, Altarawneh, G, and Almuhaimeed, A. Stop oversampling for class imbalance learning: a review. IEEE Access. (2022) 10:47643–60. doi: 10.1109/ACCESS.2022.3169512
59. Hassanat, A, Altarawneh, G, Alkhawaldeh, I, Alabdallat, Y, Atiya, A, Abujaber, A, et al. The jeopardy of learning from over-sampled class-imbalanced medical datasets. In 28th IEEE symposium on computers and communications; Tunis. (2023).
Keywords: stroke, prognosis, ischemic stroke, hemorrhagic stroke, machine learning
Citation: Abujaber AA, Alkhawaldeh IM, Imam Y, Nashwan AJ, Akhtar N, Own A, Tarawneh AS and Hassanat AB (2023) Predicting 90-day prognosis for patients with stroke: a machine learning approach. Front. Neurol. 14:1270767. doi: 10.3389/fneur.2023.1270767
Edited by:
Francesco Corea, Azienda USL Umbria, ItalyCopyright © 2023 Abujaber, Alkhawaldeh, Imam, Nashwan, Akhtar, Own, Tarawneh and Hassanat. This is an open-access article distributed under the terms of the Creative Commons Attribution License (CC BY). The use, distribution or reproduction in other forums is permitted, provided the original author(s) and the copyright owner(s) are credited and that the original publication in this journal is cited, in accordance with accepted academic practice. No use, distribution or reproduction is permitted which does not comply with these terms.
*Correspondence: Abdulqadir J. Nashwan, YW5hc2h3YW5AaGFtYWQucWE=
†ORCID: Ahmad A. Abujaber, https://orcid.org/0000-0002-8704-4991
Ibraheem M. Alkhawaldeh, https://orcid.org/0000-0002-0187-1583
Yahia Imam, https://orcid.org/0000-0003-4623-733X
Abdulqadir J. Nashwan, https://orcid.org/0000-0003-4845-4119
Ahmad S. Tarawneh, https://orcid.org/0009-0008-6193-9368
Ahmad B. Hassanat, https://orcid.org/0000-0002-9991-304X