 Maolin Wang1,2
 Yifu Yang
 Liang Chen
 Jun Du
 Huali Wu
 Yiming Li
95% of researchers rate our articles as excellent or good
Learn more about the work of our research integrity team to safeguard the quality of each article we publish.
Find out more
ORIGINAL RESEARCH article
Front. Neurol. , 30 November 2023
Sec. Multiple Sclerosis and Neuroimmunology
Volume 14 - 2023 | https://doi.org/10.3389/fneur.2023.1269862
Introduction: Multiple sclerosis (MS) is an inflammatory demyelinating disease of the central nervous system (CNS). Ursolic acid (UA) can be used in the MS treatment with anti-inflammatory and neuroprotective activities. However, UA is insoluble in water, which may affect its medication effectiveness. In our previous study, UAOS-Na, a water-soluble derivative of UA was obtained. In this study, we evaluated the pharmacological effects and explored its underlying mechanism of UAOS-Na on experimental autoimmune encephalomyelitis (EAE).
Methods: Firstly, the pharmacodynamics of UAOS-Na was investigated in EAE and Cuprizone-induced mice. And then the possible mechanisms were investigated by TMT proteomics and verified by in vitro and in vivo experiments.
Results: UAOS-Na (30 mg/kg/d) delayed the onset time of EAE from 11.78 days post immunization (dpi) to 14.33 dpi, reduced the incidence from 90.0% to 42.9%. UAOS-Na (60 mg/kg/d) reduced the serum levels of IFN-γ, IL-17A, TNF-α and IL-6, reduced the mononuclear cell infiltration of spinal cord, and inhibited the overexpression of key transcription factors T-bet and ROR-γt of EAE mouse spinal cord. In addition, UAOS-Na attenuated demyelination and astrogliosis in the CNS of EAE and cuprizone-induced mice. Mechanistically, proteomics showed that 96 differential expression proteins (DEPs) were enriched and 94 were upregulated in EAE mice compared with normal group. After UAOS-Na treatment, 16 DEPs were enriched and 15 were downregulated, and these DEPs were markedly enriched in antigen processing and presentation (APP) signaling pathway. Moreover, UAOS-Na downregulated the protein levels of Tapbp and H2-T23 in MHC-I antigen presentation pathway and reduced the proliferation of splenic CD8 T cells, thereby inhibiting the CNS infiltration of CD8 T cells.
Conclusion: Our findings demonstrated that UAOS-Na has both myelin protective and anti-inflammatory effects. And it could reduce the inflammation of MS by downregulating the expression of Tapbp and H2-T23 in the MHC-I antigen presentation pathway.
Multiple sclerosis (MS) is a common central nervous system (CNS) disease, which can lead to non-traumatic disability in young and middle-aged people (1). As a chronic neurodegenerative disease with a high disability rate, MS imposes a heavy burden on families and society (2, 3). MS pathology mainly includes inflammation and demyelination. Disease-modifying therapy (DMT), including nonspecific immunomodulators and targeted monoclonal antibodies, are the main clinical drugs for MS, but they cannot effectively suppress disease process and have serious adverse reactions (4, 5). For example, IFN-β and Glatiramer acetate inhibit the proliferation, differentiation, and antigen presentation of CD4 T cells, and restore the immunomodulatory function, but about 30% of relapsing remitting MS patients are not sensitive to them (6, 7). IFN-β causes influenza-like symptoms and rare hepatotoxicity (8). Fingolimod, a S1P1 antagonist, blocks the efflux of lymphocytes from lymph nodes, resulting in lymphopenia. Fingolimod only stops the outflow of lymphocytes without depleting them, so discontinuation of the drug can lead to disease outbreaks (9, 10). Alemtuzumab, an anti-CD52 monoclonal antibody, depletes immune cells by binding to CD52 on the surface of lymphocytes and monocytes. it is one of the most effective DMT in the treatment of MS, but it is associated with serious adverse events, including sepsis, secondary autoimmunity, stroke, and even death (11–13). In parallel, several neuroprotective drugs already used to treat other neurodegenerative diseases are currently undergoing clinical trials in MS, but the results are not promising. This prompts us to turn our attention to MS therapies with dual effects of immunomodulation and neuroregeneration.
According to statistics by 2019, natural products and their derivatives account for 23.5% of the drugs approved by FDA, indicating natural products are still an invaluable source to find lead compounds and pharmacophores (14). Ursolic acid (UA) is a natural pharmaceutical chemical component with various biological activities such as anti-inflammation (15), neuroprotection and promoting neuroregeneration (16, 17). UA has been reported to have dual effects, including inflammatory regulation by inhibiting protein expression in the NF-κB, STAT3/6, and Akt/mTOR signaling pathways (17–20), and directly remyelination in MS mice model by activating PPARγ signaling pathway and upregulating the expression of myelin-related genes (21–24). These previous studies supported UA as a potential treatment for MS.
It is well known that low aqueous solubility of a drug may seriously affect its medication effectiveness. UA is insoluble in water and has poor bioavailability in the humans (25, 26). To promote the aqueous solubility of UA, its derivative UAOS-Na was obtained by forming a C-3 hydroxyl ester with succinic acid and then alkalizing to a salt. In this study, the pharmacodynamics and mechanism of UAOS-Na in experimental autoimmune encephalomyelitis (EAE, an animal model of MS) treatment were explored. Compared to UA, we found that UAOS-Na was more effective including delaying the onset time and reducing the incidence of EAE. UAOS-Na also had a dual effect through reducing inflammation and protecting myelin of MS animal models. Mechanistically, UAOS-Na treatment downregulated the protein levels of Tapbp and H2-T23 in MHC-I antigen presentation pathway and reduced the proliferation of splenic CD8 T cells, thereby inhibiting the CNS infiltration of CD8 T cells.
Healthy female/male C57BL/6 mice (17–20 g, 6–8 weeks old) were purchased from Vital River Laboratory Animal Technology Co., Beijing. China (certificate number: 20210520Abzz 0619000101). The animals were maintained in a specific-pathogen-free room at a temperature of 22°C ± 3°C and humidity of 55% ± 5% under a 12 h light/dark cycle. All animal experiments and protocols were conducted in strict accordance with the relevant regulations. The study protocol was approved by the Ethics Committee of Animal Experiments of Shanghai University of Traditional Chinese Medicine (approval number: PZSHUTCM 201023015).
After 1 week of adaptive feeding, female C57BL/6 mice were immunized at three sites on the back (the middle of both shoulders and upper the groin on both sides) with 4 mg/mL heat-killed Mycobacterium tuberculosis H37Ra (#231141; BD, Franklin Lakes, NJ, United States) with 200 μg of myelin oligodendrocyte glycoprotein (MOG) 35-55 (#T510219-0001; Sangon Biotech, Shanghai, China) in 200 μL of emulsion containing 50% complete Freund’s adjuvant (#F5506; Sigma, St. Louis, MI, United States). The mice were then intraperitoneally injected with 400 ng pertussis toxin (#GC17532; GLPBIO, Montclair, CA, United States) in phosphate buffered saline (PBS) at 0 and 2 days post immunization (dpi). All animals were weighed and scored daily in a blinded manner using Weaver’s 15-point scoring system (27, 28). In terms of tail scores, a score of 0 indicated no clinical signs, a score of 1 indicated reduced tail tension, and a score of 2 indicated tail paralysis. In terms of limb scores, a score of 0 indicated no clinical signs, a score of 1 indicated waddling gait, a score of 2 indicated mild limb paralysis (limb dragging while walking), and a score of 3 indicated limb paralysis. The tail and limb scores were then accumulated, and a score of 15 represented death. For therapeutic administration experiments, mice were given individualized treatment, that is, mice were treated only after they developed clinical symptoms (onset, 10–14 dpi). Mice that did not onset until 15 dpi after modeling were not included in this study.
UAOS-Na, batch number: 20200706, prepared by the Shanghai University of Traditional Chinese Medicine, and the voucher specimen (No. UAOS-Na20200706) was deposited at the Department of TCM Chemistry, Pharmacy of Shanghai University of Traditional Chinese Medicine (Shanghai, China). In our previous work, UAOS-Na was synthesized by forming a C-3 hydroxyl ester of UA with succinic acid and then alkalizing to a salt, and its structure was confirmed by 1H-NMR, 13C-NMR and LCMS (ESI) (Figure 1A). The water solubility of UAOS-Na (577.58 mg/L) was determined by using ultraviolet-visible spectrophotometry and was significantly higher than that of UA [<5.64 mg/L (29)]. In this study, UAOS-Na was dissolved in 0.5% sodium carboxymethyl cellulose (CMC-Na, #abs47051270; Absin Bioscience, Shanghai, China) in the comparative efficacy experiments with UA (#SLURA190502; Sanleng Biotech, Guilin, China). Otherwise, UAOS-Na was dissolved in ddH2O.
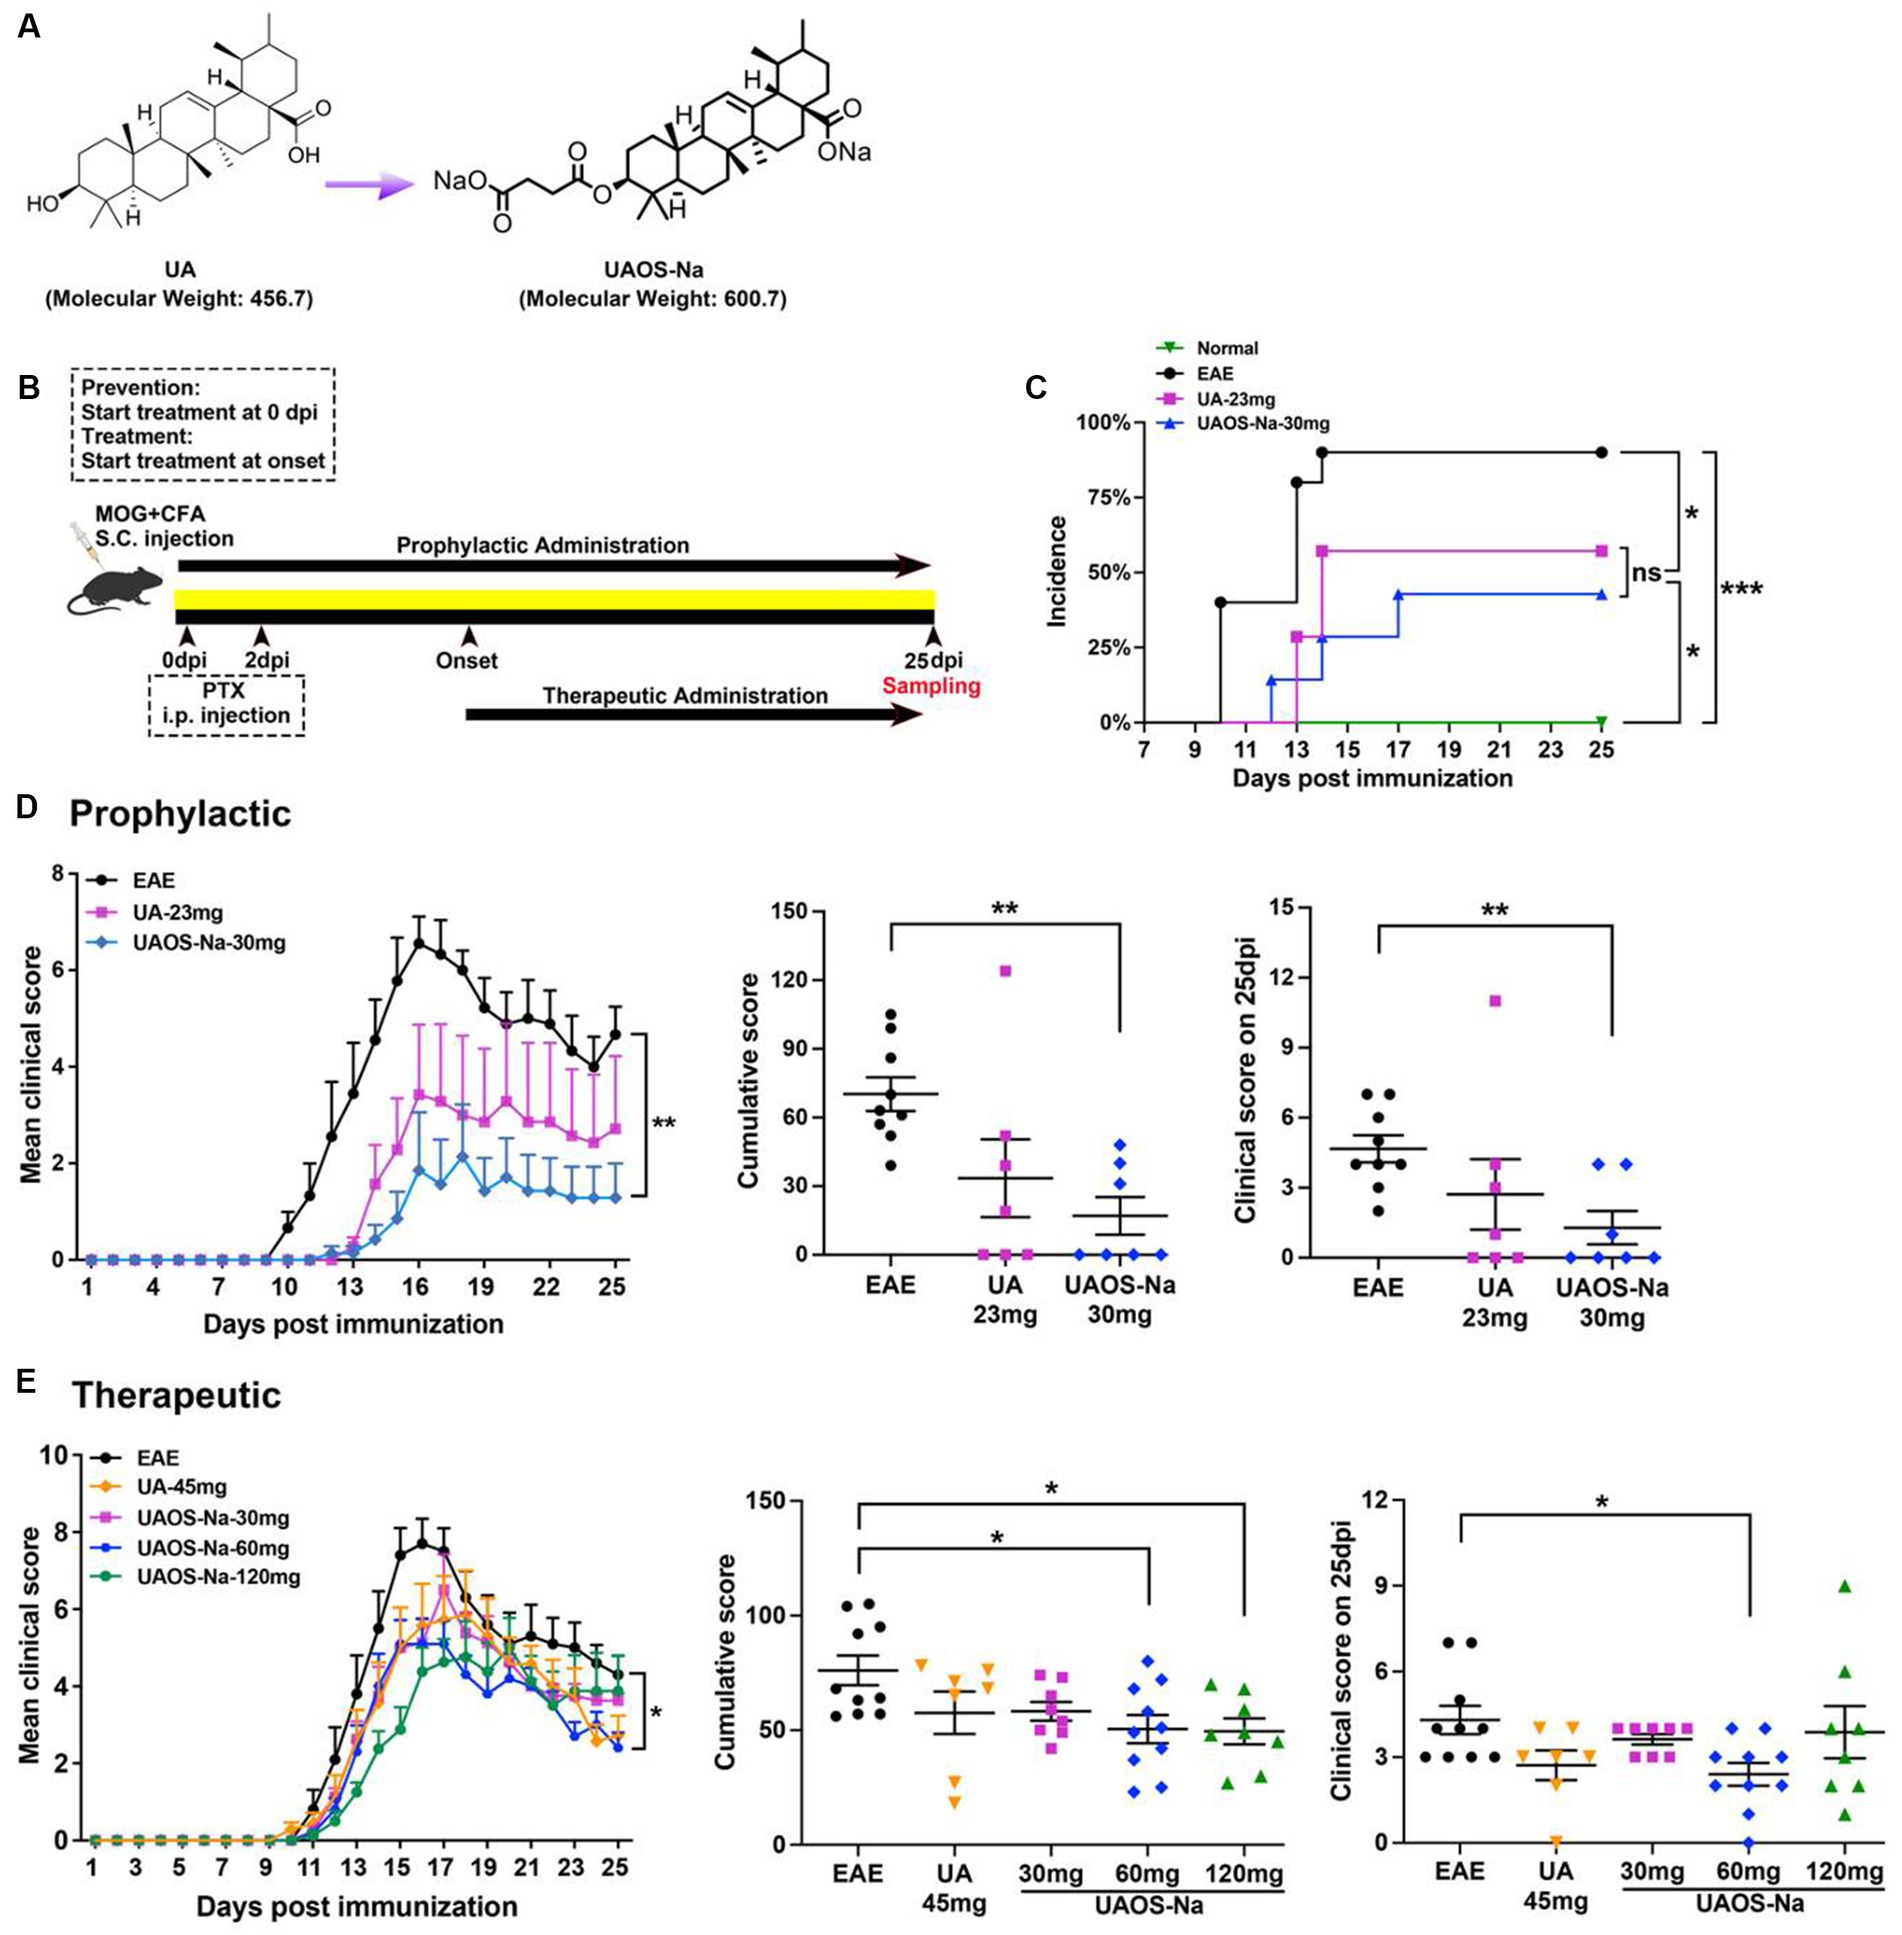
Figure 1. Preliminary comparison of pharmacodynamics between UA and UAOS-Na in EAE. (A) Chemical structures of UA (molecular weight: 456.7) and UAOS-Na (molecular weight: 600.75). Female, 6 to 8 weeks-old C57BL/6J mice were immunized with MOG35-55 and treated with UA and UAOS-Na by oral gavage. (B) UA and UAOS-Na were used for EAE prophylactic/therapeutic; n = 7–10 in each group. Incidence (C) and mean clinical score (D) of EAE mice administrated prophylactically with UA (23 mg/kg/d) and UAOS-Na (30 mg/kg/d). In (C), incidence of EAE mice, log-rank (Mantel–Cox) test, and simple survival analysis (Kaplan–Meier) were performed, *p < 0.05. (E) Mean clinical score of EAE mice treated with UA (45 mg/kg/d) and UAOS-Na at different doses (30, 60, 120 mg/kg/d). Data were expressed as mean ± SEM. Compared with EAE group, one-way ANOVA with Tukey’s multiple comparisons test, *p < 0.05 and **p < 0.01.
For prophylactic administration experiments (Figure 1B), mice were randomly divided into a normal group (n = 6, 0.5% CMC-Na), an EAE group (n = 10, EAE induction, 0.5% CMC-Na), a UA group (n = 7, EAE induction, 23 mg/kg/d), and a UAOS-Na group (n = 7, EAE induction, 30 mg/kg/d, the molar concentration of UAOS-Na was consistent with UA). UA or UAOS-Na was prepared with 0.5% CMC-Na. Mice were treated with 0.5% CMC-Na, UA, or UAOS-Na by gavage daily from the beginning of modeling (0 dpi). Asymptomatic animals were included in the statistical analysis.
For therapeutic administration experiments (Figure 1B), mice were randomly divided into a normal group (n = 11, 0.5% CMC-Na), an EAE group (n = 10, EAE induction, 0.5% CMC-Na), a UA group (n = 7, EAE induction, 45 mg/kg/d), and UAOS-Na groups [EAE induction, 30 mg/kg/d (n = 9), 60 mg/kg/d (n = 10), 120 mg/kg/d (n = 8)]. UA or UAOS-Na was prepared with 0.5% CMC-Na. Mice were given individualized treatment, that is, mice were treated with 0.5% CMC-Na, UA, or UAOS-Na only after they developed clinical symptoms (onset, 10–14 dpi). Mice that did not onset until 15 dpi after modeling were considered asymptomatic animals and were not included in the statistical analysis.
Mice were anesthetized and sacrificed at 25 dpi and perfused with 4% paraformaldehyde (PFA; #G1101; Servicebio, Wuhan, China). Their serum, spinal cord, and spleen were harvested. The spleens were isolated to calculate the spleen index (SI) as follow: SI = spleen weight (mg)/body weight (g) × 10.
After 1 week of adaptive feeding, male C57BL/6 mice were randomly divided into a normal group (10 kcal% Fat Diets, Research Diets, United States) given ddH2O, a cuprizone-induction group [CPZ group, 0.2% cuprizone (w/w), Research Diets] given ddH2O, a UAOS-Na group [0.2% cuprizone (w/w), Research Diets] given UAOS-Na (60 mg/kg/d). These mice in CPZ and UAOS-Na groups were fed cuprizone for 6 weeks to achieve complete demyelination of corpus callosum. From the 2nd week, ddH2O or UAOS-Na (60 mg/kg/d) was administered daily by gavage. At the 6th week, the mice were sacrificed, and brain were obtained.
Spleens were mechanically dissociated through a 70 μm cell strainer (#02036461; Titian, Shanghai, China) and incubated with red blood cell lysis buffer (#C3702; Beyotime, Shanghai, China) for 5 min. Harvested cells were washed with cold PBS and fractionated on lymphocyte separation reagent (#LSM01; Multisciences Biotech, Zhejiang, China) gradient by centrifugation at 400 × g for 30 min. Lymphocyte were obtained by collecting mononuclear cells (MNCs) from the middle layer and washing with PBS.
Bone marrow cells (BMC) were extracted from the femurs and tibiae of C57BL/6 mice under sterile conditions, lysed with red blood cell lysis buffer for 10 min, centrifuged at 400 × g at 4°C for 5 min, and washed twice with RPMI 1640 medium (#MA0215; Meilunbio, Dalian, China). Cells were resuspended in DCs complete culture medium consisting of granulocyte-macrophage colony-stimulating factor (#70343; CST, Massachusetts, United States, 20 ng/mL), interleukin-4 (#abs04697, Absin, 10 ng/mL), and RPMI 1640 complete medium, and adjusted to 1 × 10⁶ cells/mL. Cells were seeded into 6-well plate and cultured for 72 h. Adherent cells were retained, supplemented with fresh DCs complete medium, and cultured for 48 h. Half of the medium was replaced with DCs complete medium for an additional 48 h. On day 7, suspension cells, immature bone marrow-derived dendritic cells (imBMDC), were collected and reseeded in 6-well plate and stimulated with LPS (100 ng/mL) for 24 h to obtain mature mouse bone marrow-derived dendritic cells (mBMDC). In the UAOS-Na groups, different concentrations of UAOS-Na (0, 10, 20, and 40 μM) were added to the culture medium together with LPS (100 ng/mL) for 24 h.
MOG-specific mBMDC (MOG-mBMDC) was obtained by stimulating imBMDC with MOG35-55 (20 μg/mL) for 4 h followed by LPS (100 ng/mL) for 24 h and centrifuged at 400 × g at 4°C for 5 min. MOG-specific lymphocytes (MOG-lymphocytes) were obtained from EAE mouse spleen according to the splenic lymphocyte preparation protocol. MOG-mBMDC and MOG-lymphocytes were co-cultured at a concentration of 1:10 in DCs complete culture medium containing IL-2 (#abs04100; Absin, 10 ng/mL) for 48 h. Then, cell counting kit-8 (CCK-8) and flow cytometry were performed.
In the UAOS-Na groups, different concentrations of UAOS-Na (0, 10, 20, and 40 μM) were added to the culture medium together with LPS (100 ng/mL) for 24 h.
After anesthesia, mouse blood was collected by removing eyeballs. Serum was separated by centrifugation at 1,000 × g for 10 min. To evaluate the peripheral inflammation in mice, serum levels of interferon-γ (IFN-γ; #EK280; Multisciences Biotech), tumor necrosis factor α (TNF-α; #EK282; Multisciences Biotech), interleukin-17A (IL-17A, #EK217; Multisciences Biotech), interleukin-6 (IL-6, #EK206; Multisciences Biotech), and interleukin-10 (IL-10, #EK210; Multisciences Biotech) were determined using commercial enzyme-linked immunosorbent assay (ELISA) kits.
The spinal cords were harvested, fixed with 4% PFA, embedded in paraffin, and sliced into 4 μm-thick sections for pathological analysis. To determine the degree of inflammatory infiltration (MNCs infiltration), spinal cord sections were stained with hematoxylin and eosin (H&E, #G1005; Servicebio). Images were obtained with a 10× objective of Lecia microscope at a 100× magnification. The white matter in transverse spinal cord tissue sections was divided into the following parts, dorsal columns, spinocerebellar, spinothalamic, ventral corticospinal tract, and vestibulospinal, all parts were assessed and scored in a blind manner. Finally, the scores of each part were averaged. The scoring criteria for tissue inflammation were as follow: 0 = none, 1 = some scattered MNCs, 2 = MNCs infiltrating around blood vessels and forming “cuff-like changes” of blood vessel, 3 = numerous “cuff-like changes” were formed and MNCs infiltrated to adjacent tissues (24, 30). To determine the degree of demyelination, spinal cord sections were stained with luxol fast blue (LFB, #G1030; Servicebio). For semiquantitative methods of demyelination (LFB staining), images were obtained with a 10× objective of Lecia microscope at a 100× magnification, the spinal cord transection was divided into four parts, front, back, left, and right. These four visions were selected to calculate degree of LFB staining (myelination area) in each group and the average was taken as the final count. The degree of LFB staining was analyzed automatically using Image-Pro Plus 6.0 software.
The brains of CPZ mouse were harvested, fixed with 4% PFA, embedded in paraffin, and sliced into 4 μm-thick sections for pathological analysis. To determine the degree of corpus callosum demyelination, brain sections were stained with LFB, images were then obtained using a Lecia microscope and quantified using Image-Pro Plus 6.0 software.
Spinal cord of EAE or brain sections of CPZ mice were immunostaining with glial fibrillary acidic protein (GFAP, #80788; CST; 1:200) to evaluate astrocytic lesions. Images were then obtained using a Lecia microscope and quantified using Image-Pro Plus 6.0 software.
Transverse sections of spinal cord were cut. After antigen repair and endogenous peroxidase removal, slices were blocked in 3% bovine serum albumin (BSA, #MB4219; Meilunbio) for 1 h. Primary Abs, major histocompatibility complex class I (MHC-I, #NBP3-09017; NOVUS, Beijing, China; 1: 300) and CD8a (#GB114196; Servicebio; 1: 5000), incubations were conducted overnight at 4°C. HRP labeled secondary Abs incubations were conducted 50 min at room temperature, followed by washing with PBS 3 times. To amplify signal, slices were stained with TSA (#G1223; Servicebio) for 10 min at room temperature. After washing with PBS 3 times, nuclei were stained with DAPI (#G1012; Servicebio). Slides were covered with anti-fluorescence quenching tablet seal (#G1401; Servicebio). Images were then obtained using multispectral tissue slice scanning system and quantified using Image-Pro Plus 6.0 software.
Mice were deeply anesthetized and perfused with 4% PFA, 1.5% glutaraldehyde and 1 mM CaCl2 in 0.1 M cacodylate buffer. Spinal cord sections were harvested and fixed in the same solution at 4°C for 24 h. Sections were washed, post-fixed with 1% OsO4 in 0.1 M PBS (pH 7.4) for 2 h at room temperature, and subsequently dehydrated in graded ethanol series. Embedding was performed in epoxypropane and embedding agent. Sections, 1.0 μm thick, were cut, stained in toluidine blue (1%), and examined by light microscopy (CKX41, Olympus, Japan) to locate the spinothalamic tract. Ultrathin sections (60 nm) were cut, dyed in 2% uranium acetate saturated for 8 min in dark, and in 2.6% lead citrate solution for 8 min without CO2. Then, sections were viewed and photographed with a transmission electron microscope (FEI Tecnai G2 spirit, Leica, Germany) operated at 80 kV. For each sample at 8200× magnification, four fields (up, down, left, and right) in the spinothalamic tract were obtained for statistical analysis. Quantification of the thickness (G-ratio = axon diameter/fiber diameter) and the number of myelinated fibers in the spinothalamic plexus were analyzed by Image-Pro Plus 6.0 software.
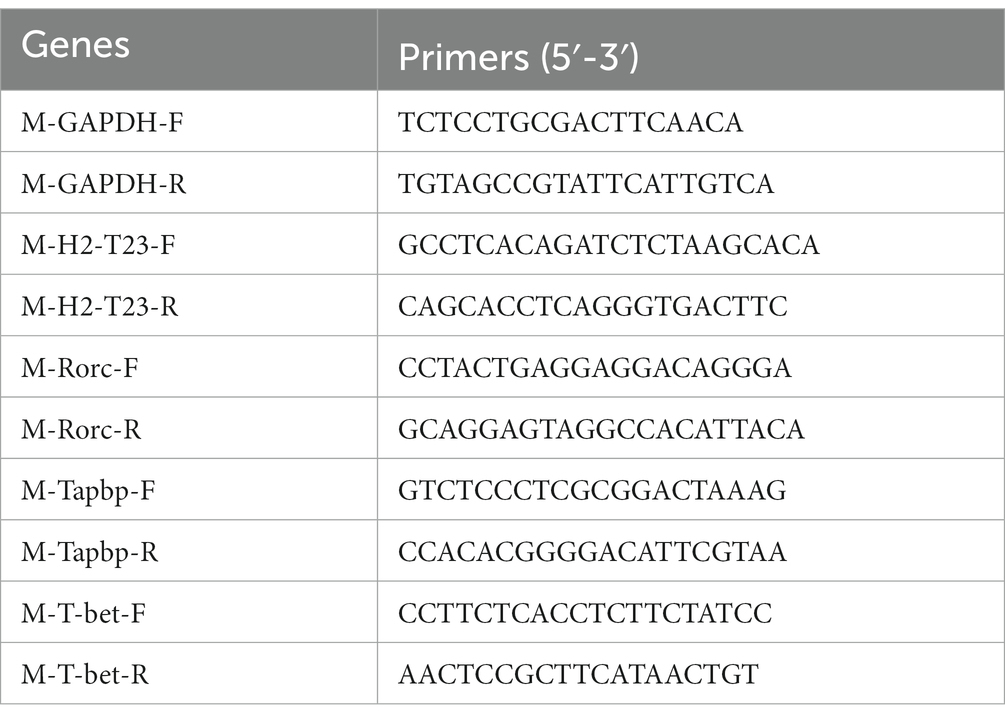
Total RNA was extracted from spinal cords or spleens using RNA isolater Total RNA Extraction Reagent (#R401-01, Vazyme, Nanjing, China) according to the manufacturer’s instructions. Reverse transcription was conducted using 5 × HiScript II qRT SuperMix II (#R223-01; Vazyme). Real-Time PCR was performed using the ChamQ Universal SYBR qPCR Master Mix (#Q711; Vazyme) according to the manufacturer’s instructions, and detection was performed using the ABI Prism® 7500 Sequence Detection System (Applied Biosystems, Foster City, CA, United States). All data were normalized to an average of a housekeeping genes Gapdh. Gene relative expression was calculated by log2 of −ΔΔCt values from triplicate of PCR.
The spinal cord was collected in accordance with standard procedures. Protein lysates were then obtained in RIPA lysis buffer (#P0013B; Beyotime) containing protease and phosphatase inhibitors. The concentration of these protein lysates was then measured using a Bicinchoninic Acid Protein Assay Kit (#P0012S; Beyotime). Equal amounts (3 μg/μL, 10 μL) of proteins in each sample were loaded onto 10% SDS-PAGE gels (#P0690; Beyotime) and transferred to polyvinylidene fluoride membranes (Millipore, Burlington, MA, United States). The membranes were then blocked with 5% BSA and probed with different primary antibodies: MHC-I (#ab281904, Abcam, Waltham, MA, United States), Tapbp (#66382; CST), GAPDH (#abs132004; Absin), Tubulin (#2148; CST), and anti-rabbit secondary antibody (#ab205718; Abcam). Blots were then exposed to an enhanced chemiluminescence detection reagent (#P0018S; Beyotime). Finally, signals were visualized using a Tanon imaging system and quantified using Image-Pro Plus 6.0 software.
For surface-marker staining, cells were incubated with fluorochrome-conjugated Abs to CD4 (#100405; Biolegend, California, United States), CD8a (#162304; Biolegend), CD3ε (#100312; Biolegend), CD11c (#117309, Biolegend), CD86 (#159203; Biolegend), and MHC-I (#114606; Biolegend) at the recommended dilution 30 min on ice. Flow cytometry analysis was performed on Beckman CytoFlex S (Beckman, California, United States) and data were analyzed with FlowJo software (Treestar, Ashland, Kentucky, United States).
Nine spinal cord tissue samples (4 mice spinal cords were mixed into one sample, 3 samples per group) collected from the normal group, EAE group, and UAOS-Na group (60 mg/kg/d) were mixed with SDT buffer and homogenized using SCIENTZ-48 High Throughput Tissue Grinder (SB-3200DT, Xinzhi, Zhejiang, China). The homogenate was cracked on ice for 30 min and centrifuged at 12000 × g for 20 min. The supernatant was collected, and the protein concentration was detected by a BCA kit (#P0012S; Beyotime). For digestion, the protein solution which containing 100 μg protein was reduced with 2 μL 0.5 M TCEP (#646547; Sigma) at 37°C for 60 min and alkylated with 4 μL 1 M iodoacetamide (#I1149; Sigma) at room temperature for 40 min in darkness. Fivefold volumes of cold acetone were added to precipitate protein at −20°C overnight. After centrifugation at 12000 × g at 4°C for 20 min, the samples were washed twice by 1 mL pre-chilled 90% acetone aqueous solution. Trypsin (#G3440; Servicebio) was added at 1:50 trypsin-to-protein mass ratio and incubated at 37°C overnight. The peptide mixture was desalted by C18 ZipTip and quantified by Pierce™ Quantitative Colorimetric Peptide Assay (#23275; Thermo Fisher, Massachusetts, United States) and then lyophilized. Trypsin-digested peptides were labeled with TMT-10 Plex (#90111; Thermo Fisher) reagents according to the manufacturer’s instructions.
The peptide mixture was re-dissolved in the buffer A (20 mM ammonium formats in water, pH 10.0, adjusted with ammonium hydroxide), and then fractionated by high pH separation using Ultimate 3000 system (Thermo Fisher) connected to a reverse phase column (XBridge C18 column, 4.6 mm × 250 mm, 5 μm), (Waters Corporation, MA, United States). High pH separation was performed using a linear gradient, starting from 5% B to 45% B in 40 min (B: 20 mM ammonium formate in 80% ACN, pH 10, adjusted with ammonium hydroxide). The column was re-equilibrated at the initial condition for 15 min. The column flow rate was maintained at 1 mL/min and the column temperature was maintained at 30°C. Ten fractions were collected; each fraction was dried in a vacuum concentrator for the next step. The peptides were re-dissolved in solvent A (0.1% formic acid in water) and analyzed by Orbitrap Fusion™ Lumos™ Tribrid™ coupled to an EASY-nanoLC 1,200 system (Thermo Fisher). Two microliter peptide sample was loaded onto a 25 cm analytical column [75 μm inner diameter, 1.9 μm resin (Dr. Maisch, Tübingen, Germany)] and separated with 120 min-gradient starting at 4% buffer B (80% ACN with 0.1% FA) for 4 min followed by a stepwise increase to 30% in 104 min, 90% in 2 min and stayed there for 10 min. The column flow rate was maintained at 600 nL/min with the column temperature of 55°C. The electrospray voltage was set to 2 kV. The mass spectrometer was run under data dependent acquisition (DDA) mode, and automatically switched between MS and MS/MS mode. The survey of full scan MS spectra (m/z 350–1,500) was acquired in the Orbitrap with 60,000 resolutions. The automatic gain control (AGC) target of 4e5 and the maximum injection time of 50 ms. Then the precursor ions were selected into collision cell for fragmentation by higher-energy collision dissociation (HCD), the normalized collection energy was 40. The MS/MS resolution was set at 50,000, the automatic gain control (AGC) target of 5e4, the maximum injection time of 50 ms, and dynamic exclusion was 30 s.
Tandem mass spectra were processed by PEAKS Studio version 10.6 (Bioinformatics Solutions Inc., Waterloo, Canada). PEAKS DB was set up to search the database of uniport-Mus musculus (version 201907, 22290 entries) assuming trypsin as the digestion enzyme. PEAKS DB were searched with a fragment ion mass tolerance of 0.02 Da and a parent ion tolerance of 10 ppm. Carbamidomethylation (C) and TMT-10 plex were specified as the fixed modification. Oxidation (M) and Acetylation (Protein N-term) were specified as the variable modifications. Peptides were filtered by 1% FDR and proteins were filtered by 1 unique peptide. Reporter ions were used to calculate the quantification ratio between samples. Normalization was calculated from the total intensity of all labels in all quantifiable peptides. After t-test, different expressed proteins were selected if their p < 0.05 and |fold change| >1.5.
Differential expression proteins (DEPs) were subjected to multiple bioinformatic analyses. Gene Ontology (GO) annotation and Kyoto Encyclopedia of Genes and Genomes (KEGG) pathways enrichment analysis was performed using Database for Annotation, Visualization, and Integrated Discovery Bioinformatics Resources.1
Statistical analyses were performed using GraphPad Prism 8 software (GraphPad, La Jolla, CA, United States). The results are presented as mean ± SEM. Group comparisons were established by one-way analysis of variance (ANOVA) with Tukey’s multiple comparisons test. Student’s t-test was used for small sample sizes, and the normality of data was analyzed using the Kolmogorov–Smirnov test. A p-values less than 0.05 was considered statistically significant.
For prophylactic administration, EAE mice were given UA (23 mg/kg/d) and UAOS-Na (30 mg/kg/d) for prophylactic until 25 dpi (Figure 1B). In EAE group, mice began to develop the disease (onset) at 10 dpi, with an average onset time of 11.78 ± 0.57 dpi and an incidence of 90.0% (9/10). UA and UAOS-Na prophylactic administration significantly delayed the average onset time to 13.50 ± 0.29 dpi and 14.33 ± 1.45 dpi and reduced the incidence to 57.1% (4/7) and 42.9% (3/7), respectively (Figure 1C). In addition, UAOS-Na significantly reduced the cumulative score and 25 dpi score and improved the symptoms of EAE mice comparing with normal group, but UA just had a weakening trend in the same experiment (Figure 1D). UAOS-Na may be more effective than UA in preventing EAE.
For therapeutic administration, UA (45 mg/kg/d) and different doses of UAOS-Na (30, 60, 120 mg/kg/d) were administered to EAE mice. UAOS-Na 60 mg/kg/d significantly reduced both the cumulative score and the 25-dpi score of EAE mice. Just like the result of prophylactic administration in Figure 1D, there was only significantly change between UAOS-Na-60 mg/kg/d group and normal group (Figure 1E). Moreover, the effects of UAOS-Na (60 mg/kg/d) and UA (45 mg/kg/d) on inflammation (H&E) and demyelination (LFB) of EAE spinal cords were compared. The results showed that UAOS-Na was more effective than UA in alleviating spinal cord inflammation and demyelination in EAE mice (Figure 2), and UAOS-Na 60 mg/kg/d was used in subsequent in vivo experiments.
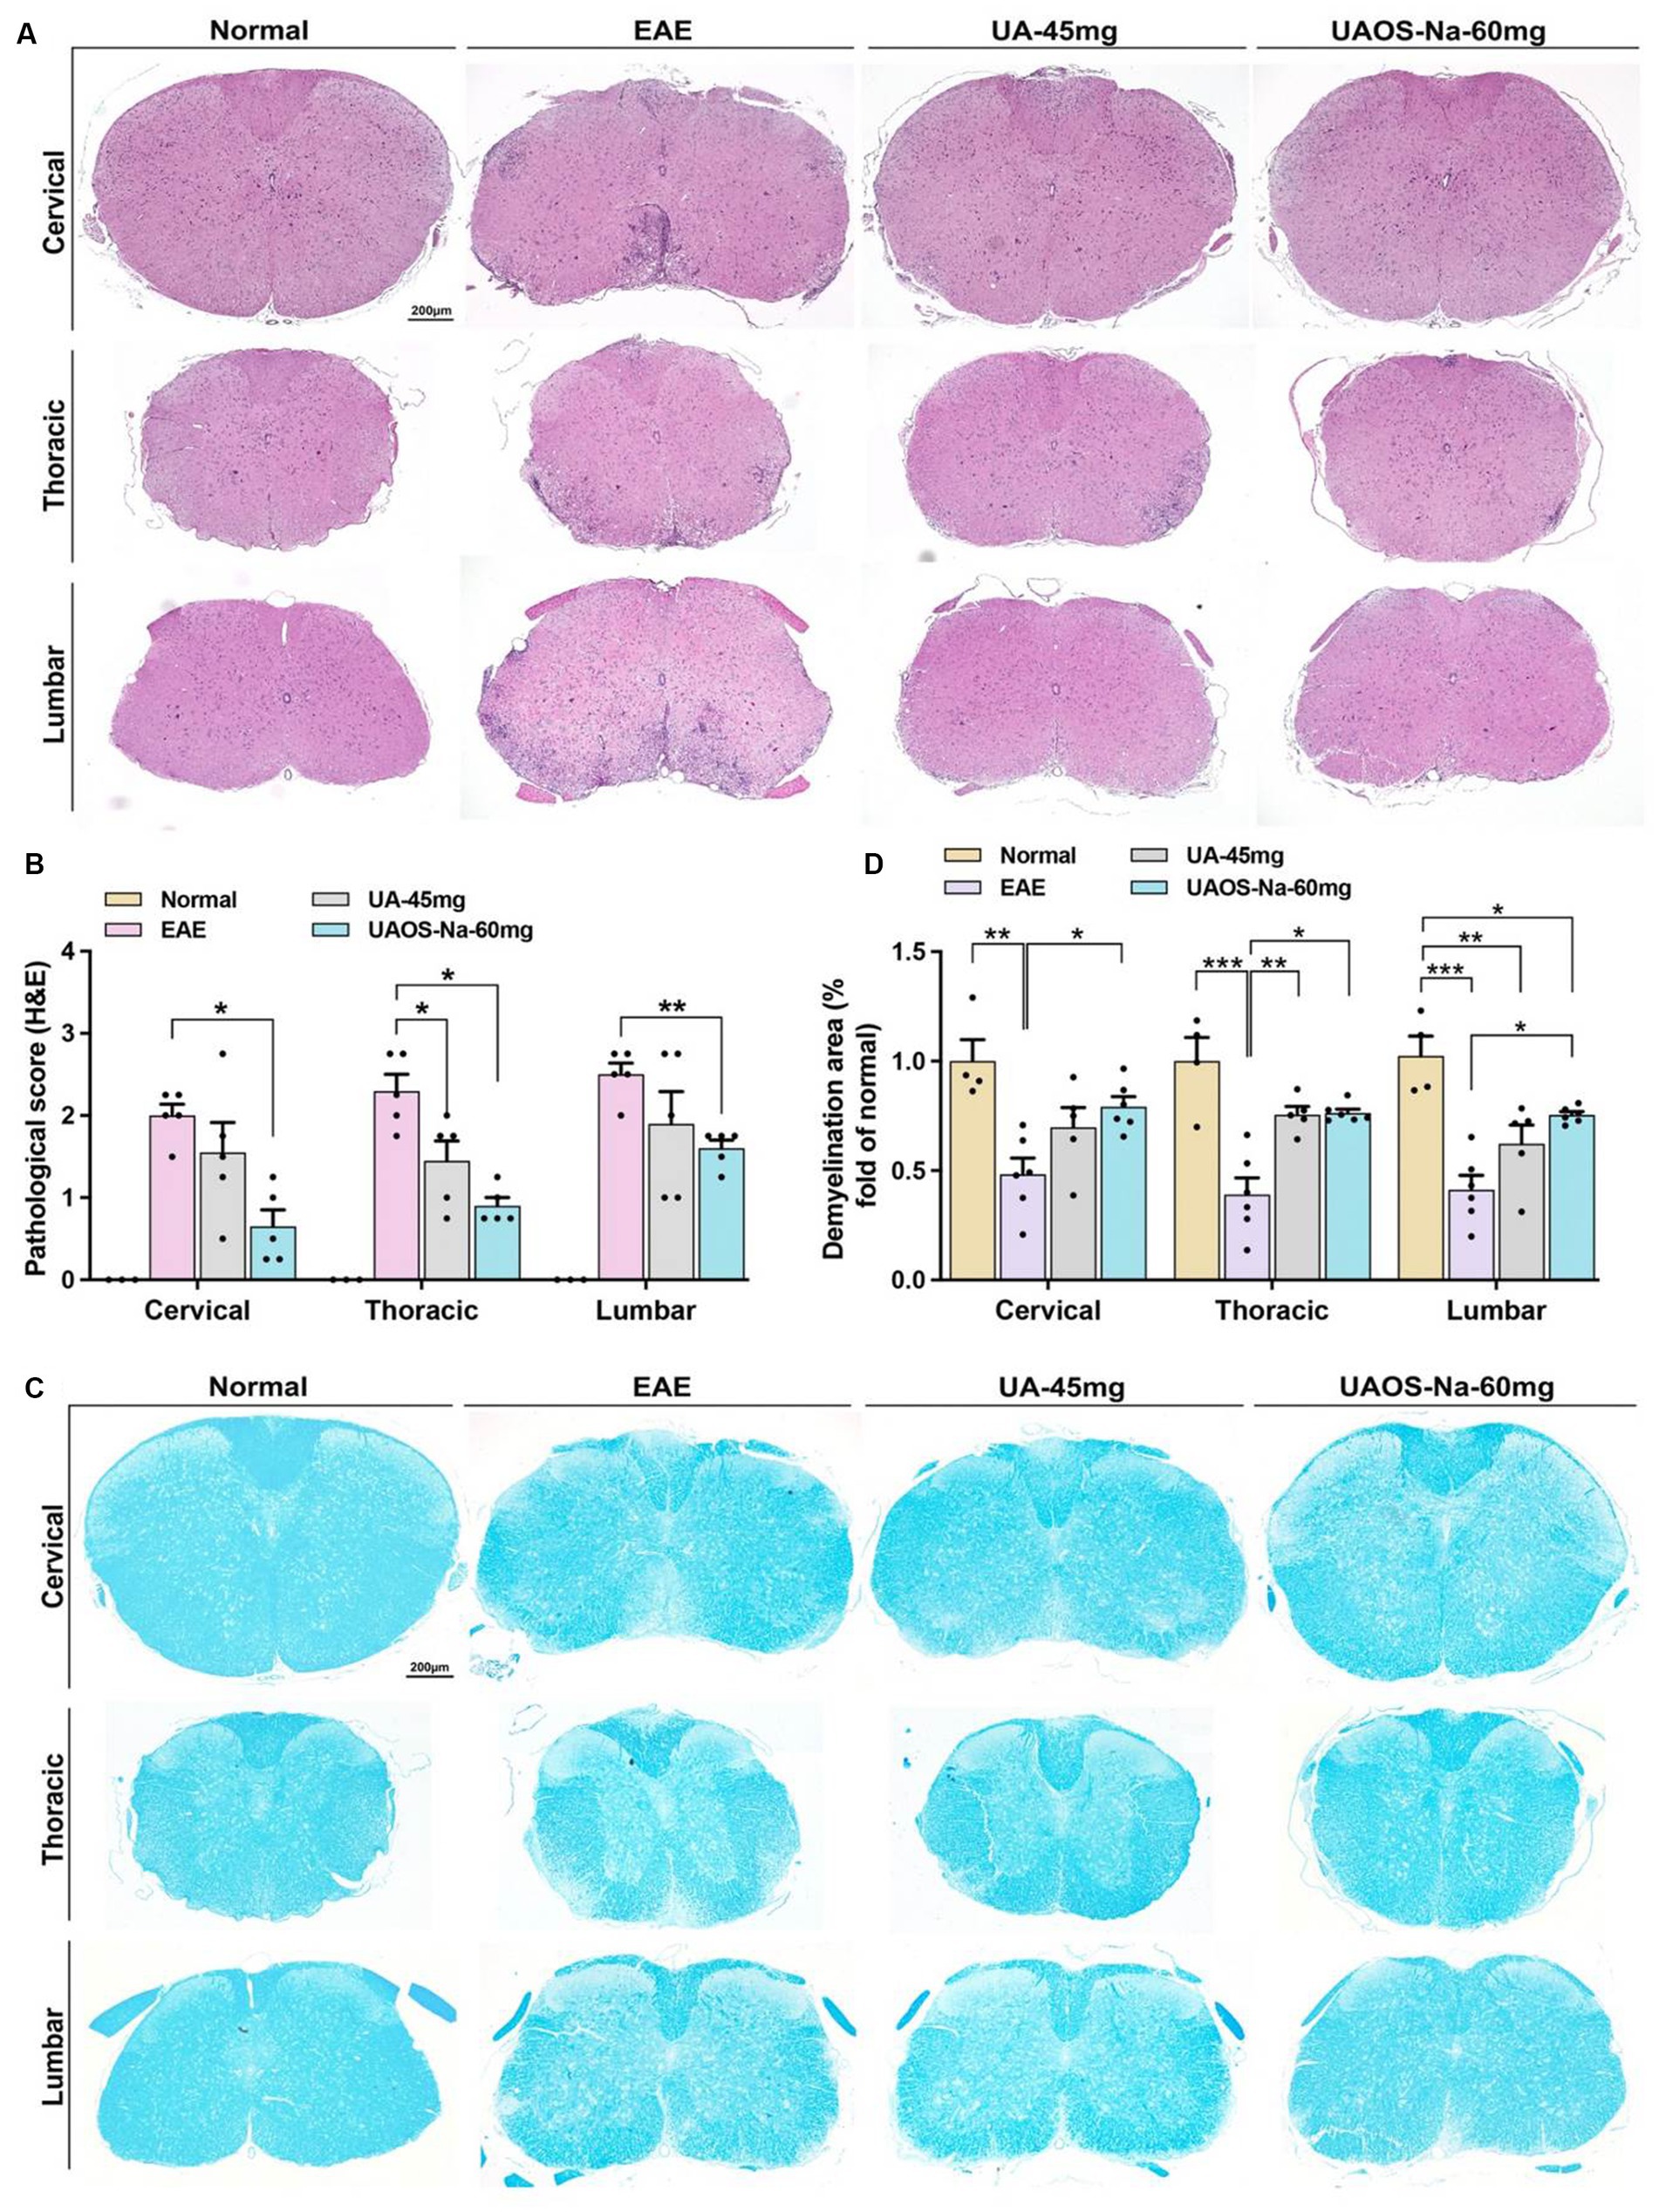
Figure 2. UAOS-Na reduces CNS inflammation and demyelination of EAE mice. Female, 6 to 8 weeks-old C57BL/6J mice were immunized with MOG35-55 and treated with UAOS-Na (60 mg/kg/d) and UA (45 mg/kg/d) from onset to 25 dpi. (A) Sections (cervical, thoracic, and lumbar spinal cords) were assayed for inflammation by H&E (scale bar = 200 μm), and (B) CNS pathology was scored. (C) Sections (cervical, thoracic, and lumbar spinal cord) were assayed for demyelination by LFB (scale bar = 200 μm), and (D) CNS pathology was analyzed automatically using Image-Pro Plus 6.0 software. Data were expressed as mean ± SEM; n = 3–6 in each group, one-way ANOVA with Tukey’s multiple comparisons test was performed. *p < 0.05, **p < 0.01, and ***p < 0.001.
The imbalance of serum pro-inflammatory and anti-inflammatory cytokines is closely related to EAE inflammation. Literatures have reported that inhibiting the expression of pro-inflammatory cytokines such as IFN-γ, TNF-α, IL-6, and IL-17 (31, 32) and promoting the expression of anti-inflammatory cytokines such as IL-10 (33, 34) can alleviate the inflammation of EAE. Moreover, small molecules targeting T-bet and RORγt also inhibit EAE (35). Therefore, the serum levels of cytokines were measured by ELISA and the spleen index of mice was recorded. The results showed that UAOS-Na (60 mg/kg/d) significantly reduced serum levels of the pro-inflammatory cytokines IFN-γ, IL-17A, TNF-α and IL-6, increased the serum level of anti-inflammatory cytokine IL-10 (Figure 3A), and reduced the spleen index (Figure 3B). In parallel, real-time PCR was used to detect the mRNA levels of T-bet and ROR-γt. UAOS-Na obviously reduced the mRNA levels of T-bet and ROR-γt of EAE spinal cord tissues (Figure 3C). Combined with the results in Figures 2A,B, UAOS-Na reduced peripheral and CNS inflammation in the acute stage of EAE mice.
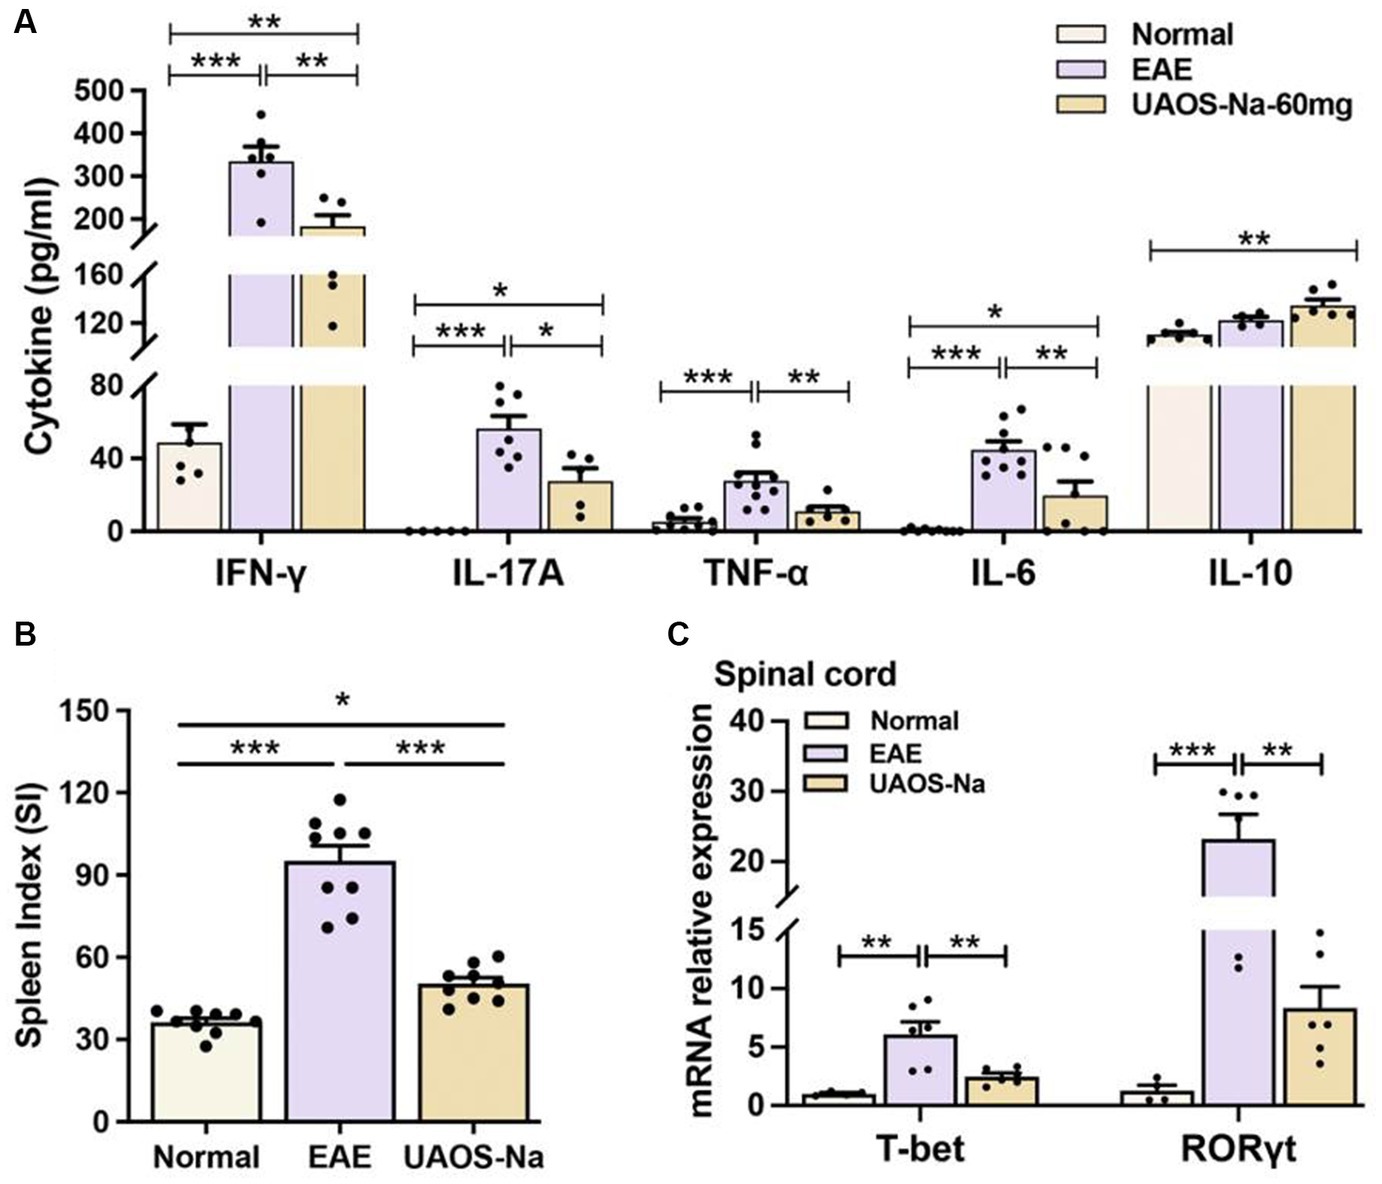
Figure 3. UAOS-Na ameliorates inflammation in EAE mice. Female, 6 to 8 weeks-old C57BL/6J mice were immunized with MOG35-55 and treated with UAOS-Na 60 mg/kg/d from onset to 25 dpi. (A) Serum levels of cytokines IFN-γ, IL-17A, TNF-α, IL-6 and IL-10 analyzed by ELISA, n = 5–10. (B) Spleen index of mice, n = 9. (C) mRNA levels of T-bet and ROR-γt of mouse spinal cord analyzed by real-time PCR, n = 4–6. Data were expressed by mean ± SME; one-way ANOVA with Tukey’s multiple comparisons test was performed. *p < 0.05, **p < 0.01, and ***p < 0.001.
To evaluate the effects of UAOS-Na on myelin sheath at the acute stage of EAE mice, LFB staining and transmission electron microscope for EAE spinal cord were performed. As shown in Figures 2C,D, the LFB staining in EAE group showed obvious demyelinating lesions in the cervical, thoracic, and lumbar spinal cords. In UAOS-Na group, demyelinating lesions were significantly reduced. Moreover, spinothalamic nerve cluster ultrastructure in the transverse section of lumbar spinal cord was measured by transmission electron microscope. As shown in Figures 4A–C, compared with normal group, the EAE group showed discrete stratification and edema of axon’s myelin sheath, as well as a reduction in the number of myelinated axons. The above data supported that UAOS-Na reduced axonal myelin injury in the acute stage of EAE mice.
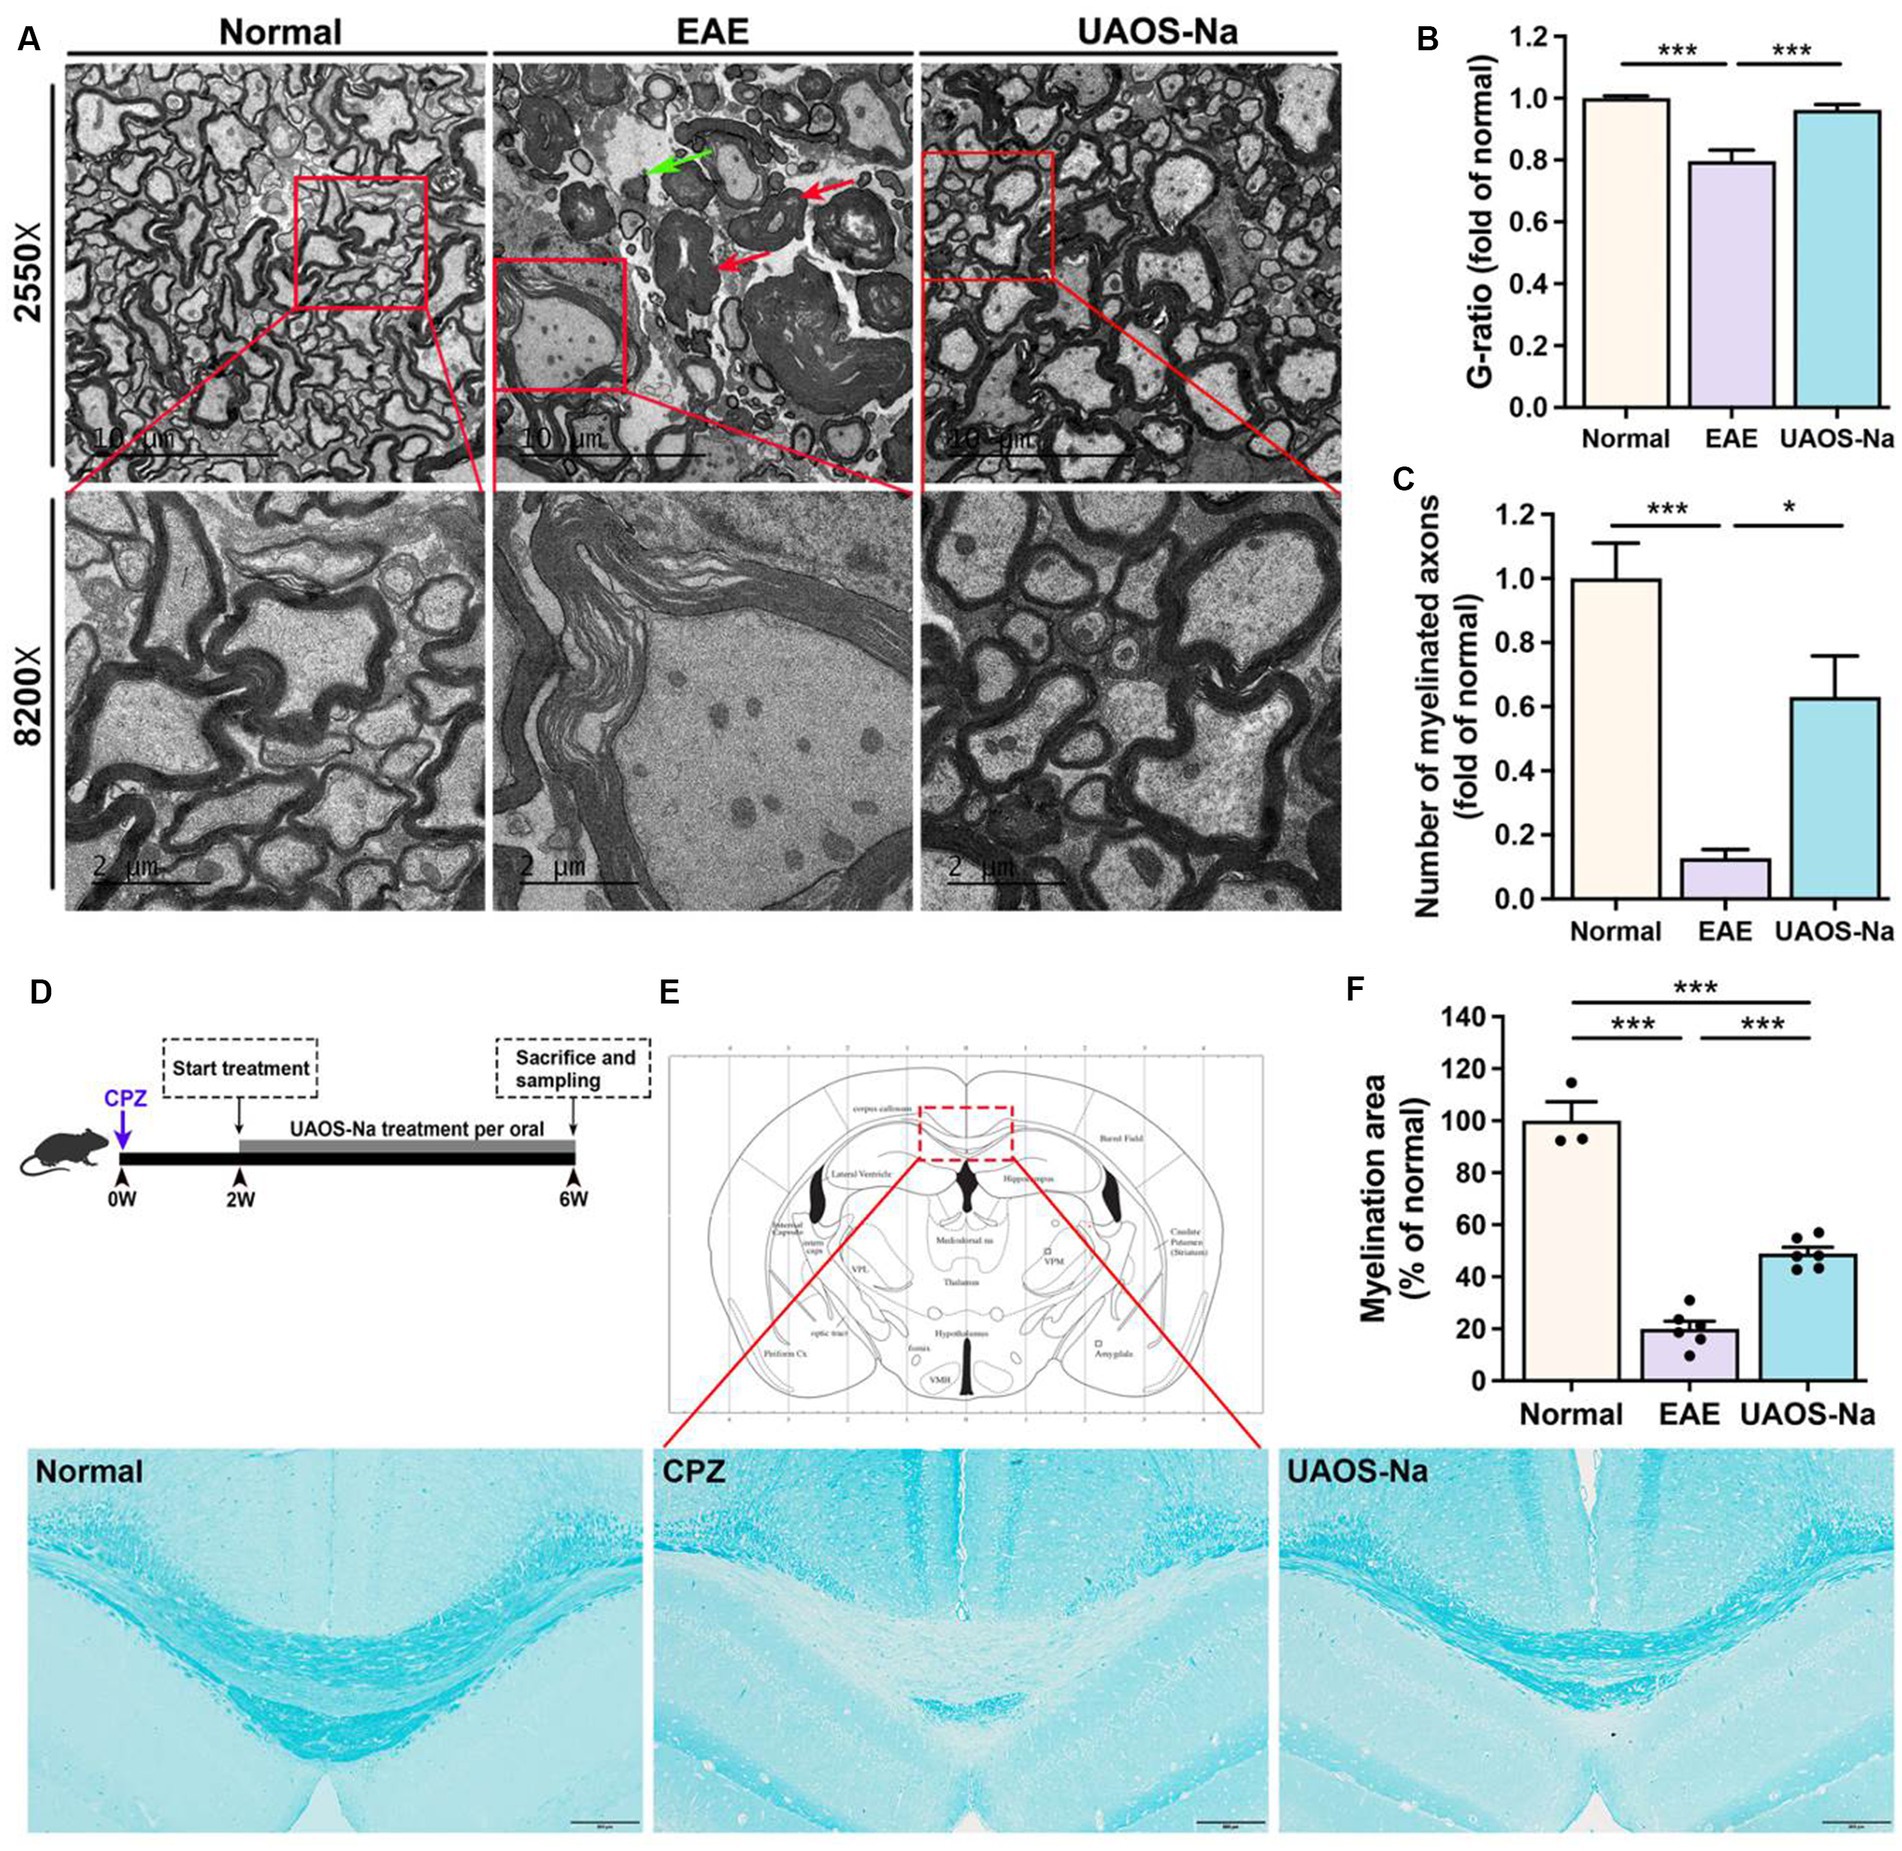
Figure 4. UAOS-Na reduces demyelination in EAE mice and protects the myelin sheath in Cuprizone-induced mice. (A–C) Female, 6 to 8 weeks-old C57BL/6J mice were immunized with MOG35–55 and treated with UAOS-Na (60 mg/kg/d) from onset to 25 dpi, n = 5–6 in each group. (A) Ultrastructure of the spinothalamic nerve cluster in the transverse section of the lumbar spinal cord measured by transmission electron microscope. The red arrow showed myelin edema; the green arrow showed axon demyelination (scale bar = 10 μm in the upper images and 2 μm in the lower images in A). Quantification of the G-ratio (axon diameter/fiber diameter, B) and the number (C) of myelinated fibers in the spinothalamic plexus. (D) Male, 6 to 8 weeks-old C57BL/6J mice were fed with cuprizone for 6 weeks to obtain complete demyelination in the corpus callosum, n = 3–5 in each group; UAOS-Na was given daily from the 2nd week. (E) The corpus callosum was assayed for demyelination by LFB, and (F) CNS pathology was analyzed automatically using Image-Pro Plus 6.0 software (scale bar = 200 μm in E). Data were measured by mean ± SME; one-way ANOVA with Tukey’s multiple comparisons test was performed. *p < 0.05 and ***p < 0.001.
UAOS-Na alleviated demyelination in EAE mice, which might be secondary to its immunomodulatory effect. To test whether UAOS-Na has a direct effect on myelin, we used the cuprizone-induced demyelination mouse model with minimal inflammation (Figure 4D). At 6th week after modeling, mouse brains were harvested for LFB staining to analyze the degree of demyelination in the corpus callosum. The results showed that CPZ group showed obvious demyelination compared with normal group. However, compared with CPZ group, demyelination was significantly alleviated in UAOS-Na group (Figures 4E,F). Therefore, UAOS-Na could directly protect the myelin sheath in cuprizone-induced mice.
The lesions of AST may be an important reason for the failure of remyelination. Studies have shown that reactive AST forms the physical barrier and secretes soluble factors to inhibit remyelination (36–38). So, we determined the effects of UAOS-Na on CNS astrogliosis in EAE mice and CPZ mice. Immunohistochemical staining of the lumbar spinal cord of EAE mice and the corpus callosum of CPZ mice showed deepened GFAP staining, massive reactive astrogliosis, and glial scar formation, which were reversed by UAOS-Na treatment (Figures 5A,C). And the data measured by Image-Pro showed that UAOS-Na treatment significantly reduced reactive astrogliosis and glial scar formation of EAE and CPZ mice (Figures 5B,D). Therefore, UAOS-Na ameliorated astrogliosis in the acute stage of EAE mice and prevented astrogliosis in CPZ mice.
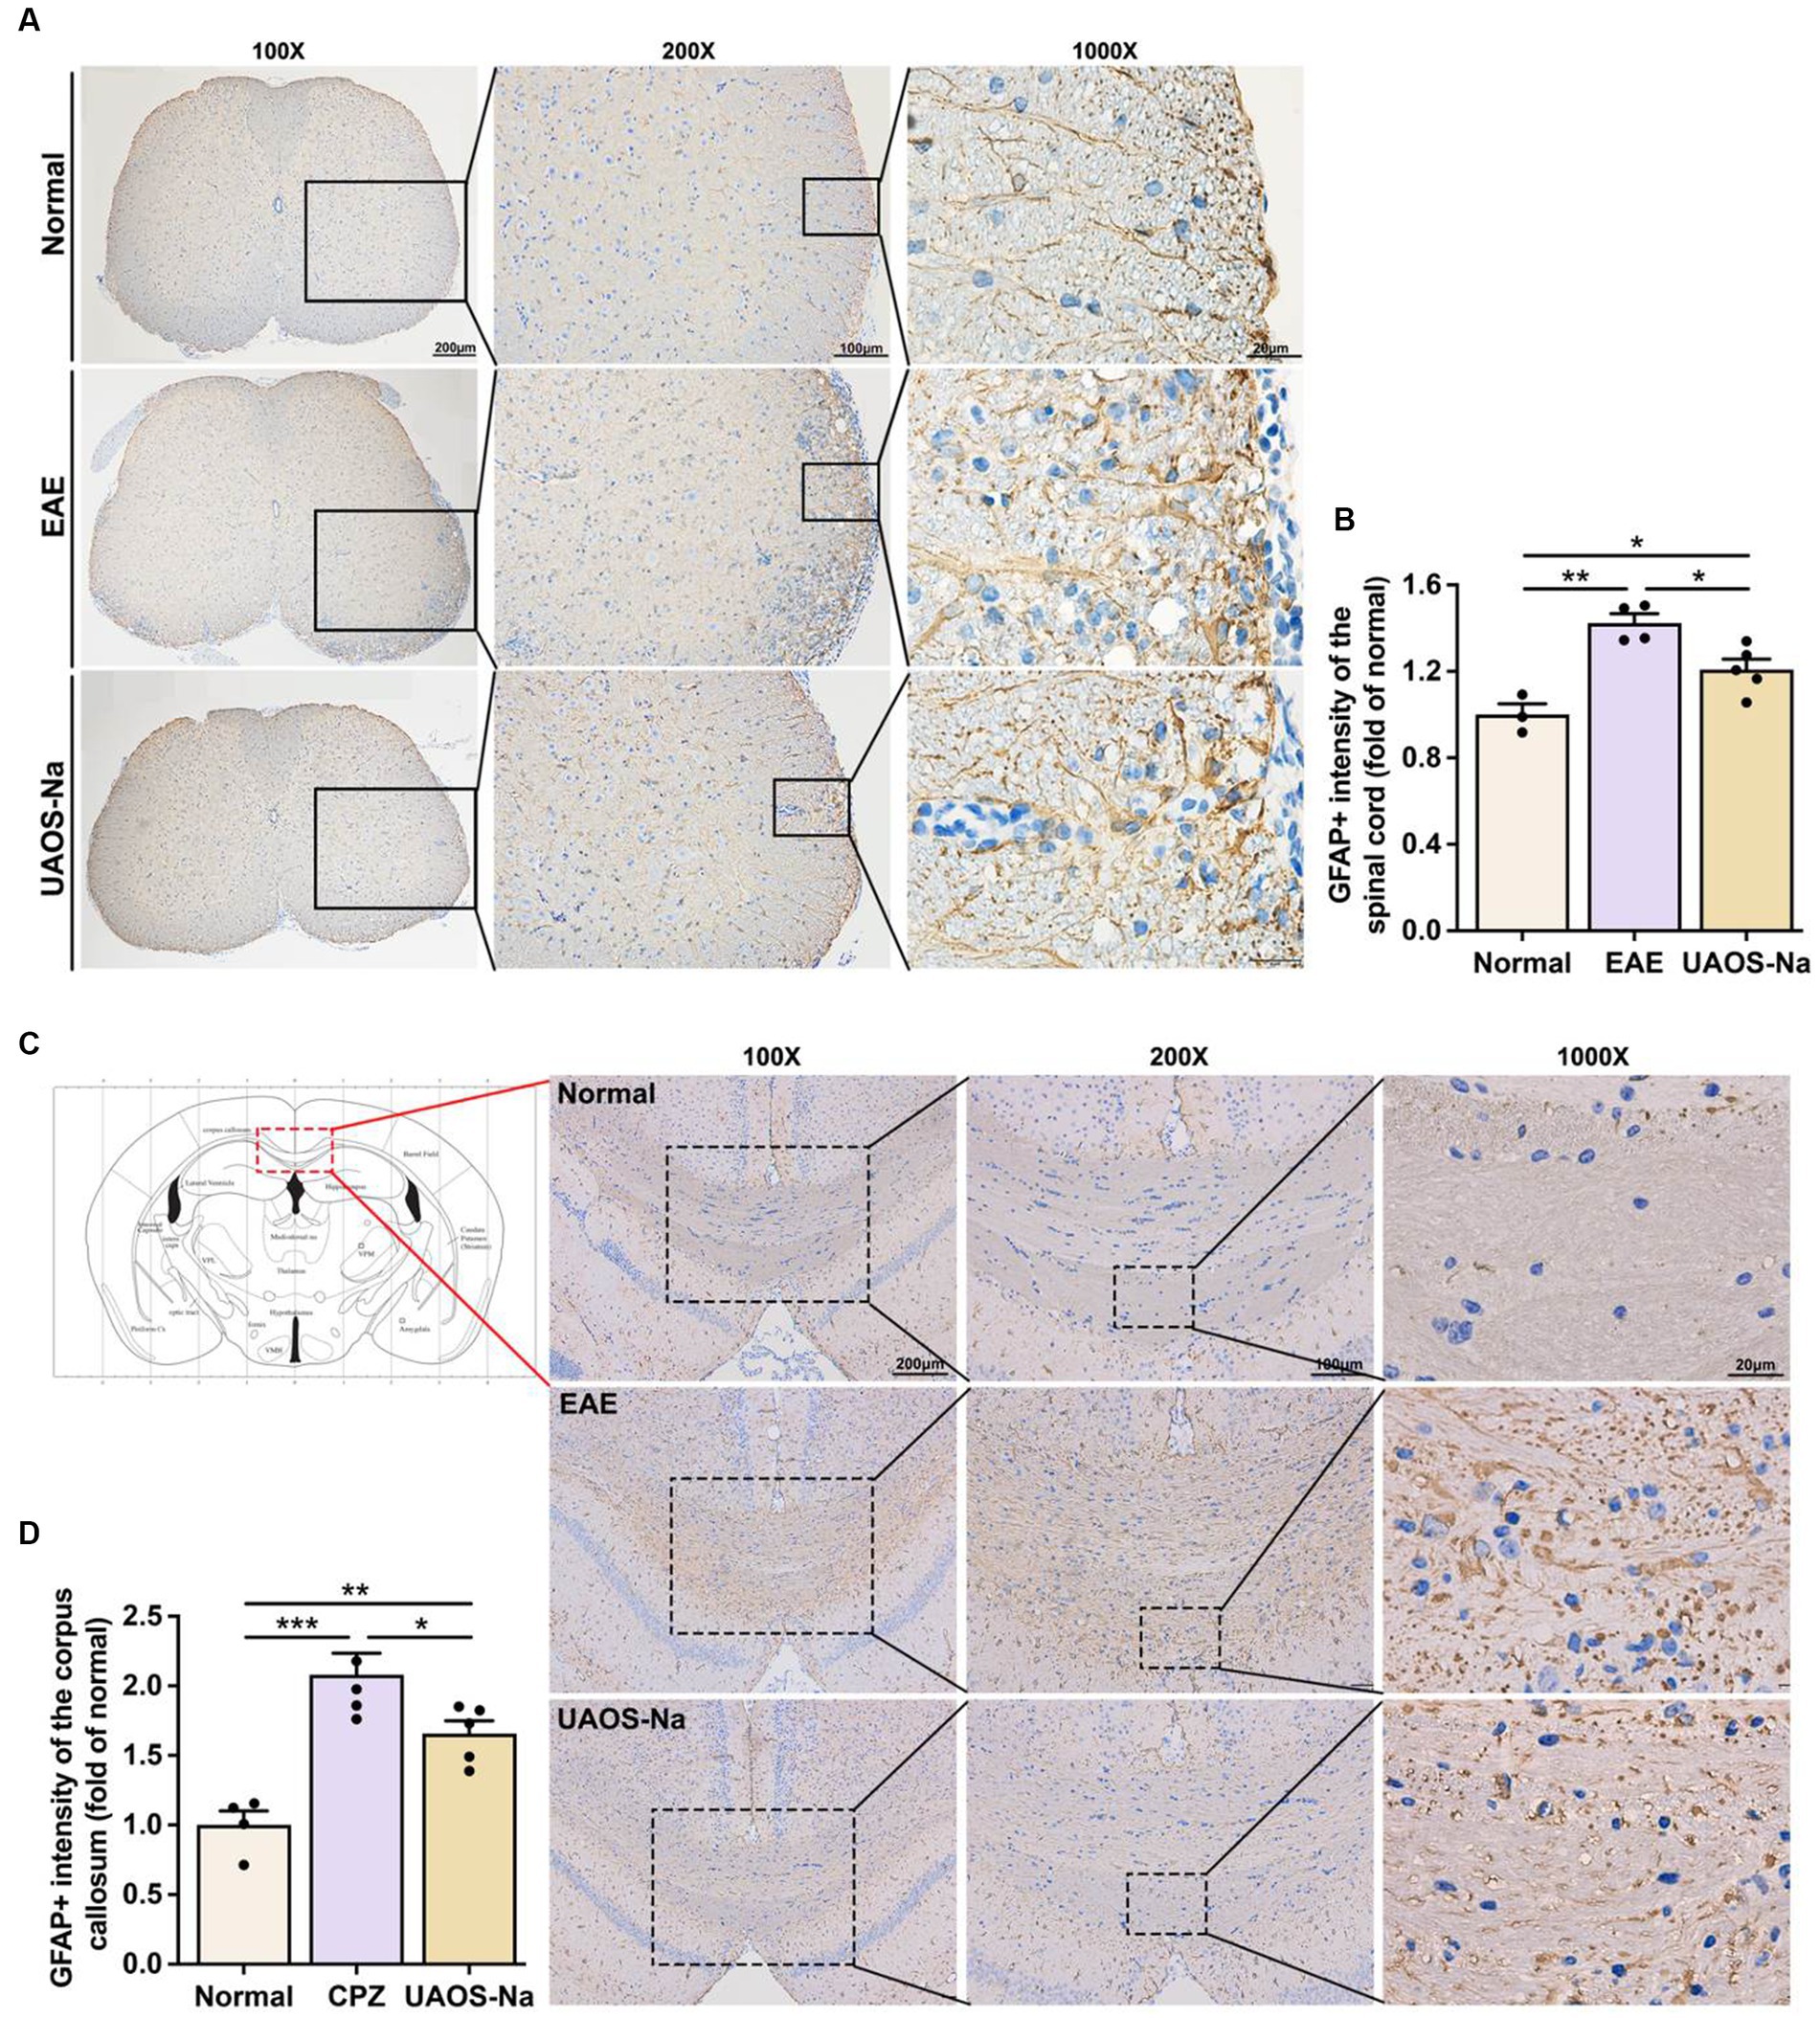
Figure 5. UAOS-Na rameliorates astrogliosis in EAE and cuprizone-induced mice. (A,B) Female, 6 to 8 weeks-old C57BL/6J mice were immunized with MOG35-55 and treated with UAOS-Na (60 mg/kg/d) from onset to 25 dpi. Immunohistochemistry of the spinothalamic nerve cluster in the transverse section of lumbar spinal cord (A, scale bar = 200 μm on the left, 100 μm in the middle, and 20 μm on the right) and the quantitative analysis of GFAP expression using Image-Pro (B), n = 3–5 in each group. (C,D) Male, 6 to 8 weeks-old C57BL/6J mice were fed with cuprizone for 6 weeks to obtain complete demyelination in the corpus callosum; UAOS-Na was given daily from the 2nd week. Immunohistochemistry of the corpus callosum (C, scale bar = 200 μm on the left, 100 μm in the middle, and 20 μm on the right) and the quantitative analysis of GFAP expression using Image-Pro (D), n = 5–6 in each group. Data were measured by mean ± SME; one-way ANOVA with Tukey’s multiple comparisons test was performed, *p < 0.05, **p < 0.01, and ***p < 0.001.
Proteomic technique based on mass spectrometry has been widely used in searching for therapeutic targets of diseases (39, 40). In this study, tandem mass tag (TMT) technique was performed for proteomic analysis of the mouse spinal cord tissues (Figure 6A), and the data were presented in Supplementary Tables S1–S3. DEPs were defined as p < 0.05 and |fold change (FC)| >1.5. Compared with normal mice, 96 DEPs were enriched in EAE mice, of which 94 DEPs were upregulated. After UAOS-Na treatment, 16 DEPs were enriched with 15 DEPs downregulated compared with EAE group, and these DEPs were markedly enriched in phagosome, MAPK, autoimmune thyroid disease, and antigen processing and presentation (APP) signaling pathway, etc. (Figure 6D). Among them, there were few studies on APP signaling pathway, so we focus on it. Meanwhile, GO functional annotation analysis of DEPs in UAOS-Na vs. EAE group showed that the results were closely related to APP signaling pathway (Figure 6E). DEPs were enriched in vesicle membranes and participate in biological processes such as antigen processing and presentation, membrane localization and so on. And in the APP signaling pathway, DEPs in the MHC-I antigen presentation pathway were significantly up-regulated in EAE, while DEPs such as H2-T23 was significantly down-regulated after UAOS-Na treatment (Figure 6F). MHC-I antigen presentation pathway is related to the uptake and processing of antigens and the activation and proliferation of CD8 T cells. Overall, downregulation of H2-T23, the key proteins in MHC-I antigen presentation pathway, may be an important molecular mechanism of UAOS-Na in the treatment of EAE.
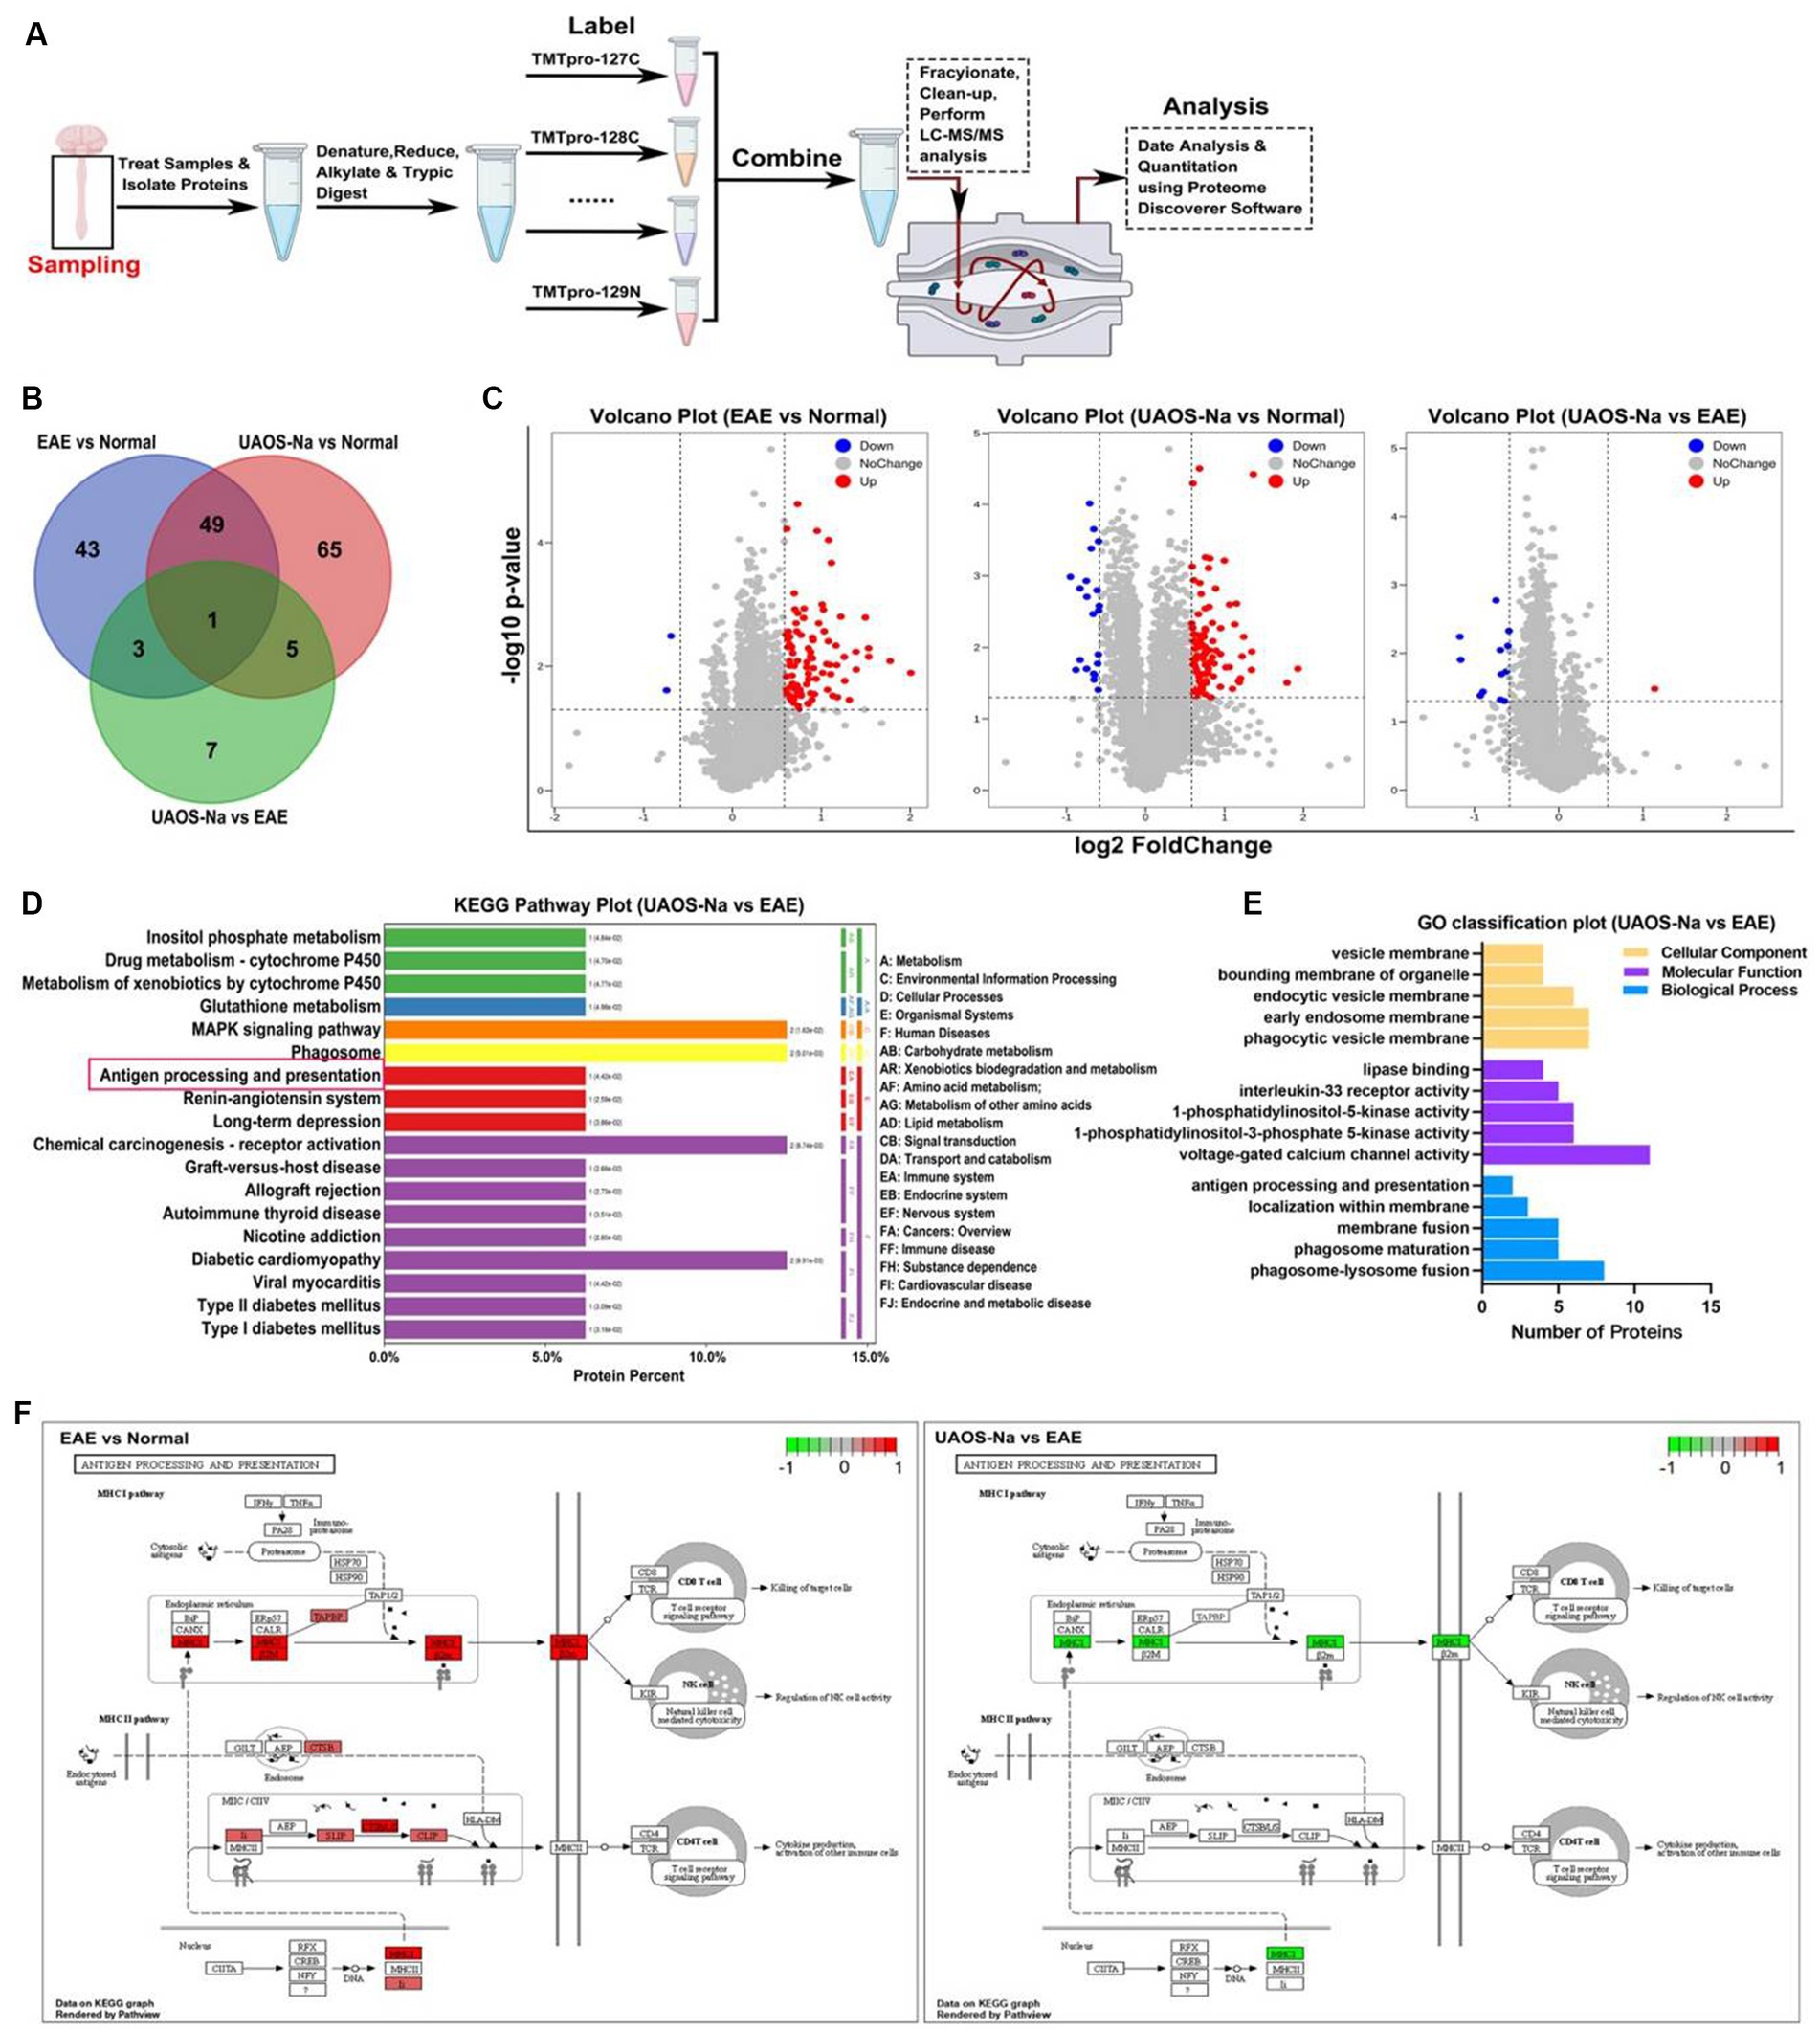
Figure 6. TMT-based proteomic analysis of mouse spinal cords. Female, 6 to 8 weeks-old C57BL/6 J mice were immunized with MOG35-55 and treated with UAOS-Na (60 mg/kg/d) by oral gavage from onset to 25 dpi. (A) Overview of TMT-based spinal cord analysis. Venn map (B) and volcano map (C) of DEPs in three comparison groups. In (C), log2 of FC as the horizontal axis and -log10 of p-value as the vertical axis, red dot means up-regulation, blue dot means down-regulation. (D) Histogram of KEGG enrichment of DEPs in UAOS-Na vs. EAE group (Top 20). The ordinate on the left shows the signaling pathways. The ordinate on the right, from outside to inside, represents the abbreviation of the primary and secondary classification names of the signaling pathways. The number in brackets shows the p-value. (E) GO functional annotation of DEPs in UAOS-Na vs. EAE group (associated with antigen processing and presentation). (F) DEPs in the APP signaling pathway in EAE vs. Normal and UAOS-Na vs. EAE groups. The red box indicates up-regulated DEPs, while the green box indicates down-regulated DEPs.
It has been shown that the TAP-related protein (Tapbp), plays a crucial role in MHC-I antigen presentation pathway. Tapbp is involved in stabilizing MHC-I molecules (41, 42), and increasing the assembly speed and number of MHC-I (43–45). Therefore, both H2-T23 and Tapbp were investigated in subsequent experiments. As shown in Figure 7A, Tapbp and H2-T23 mRNA expression levels in mouse spinal cord were assayed by Real-Time PCR. The results showed that Tapbp and H2-T23 mRNA levels were significantly increased in EAE group compared with normal group. However, UAOS-Na treatment markedly reduced these mRNA expression levels.
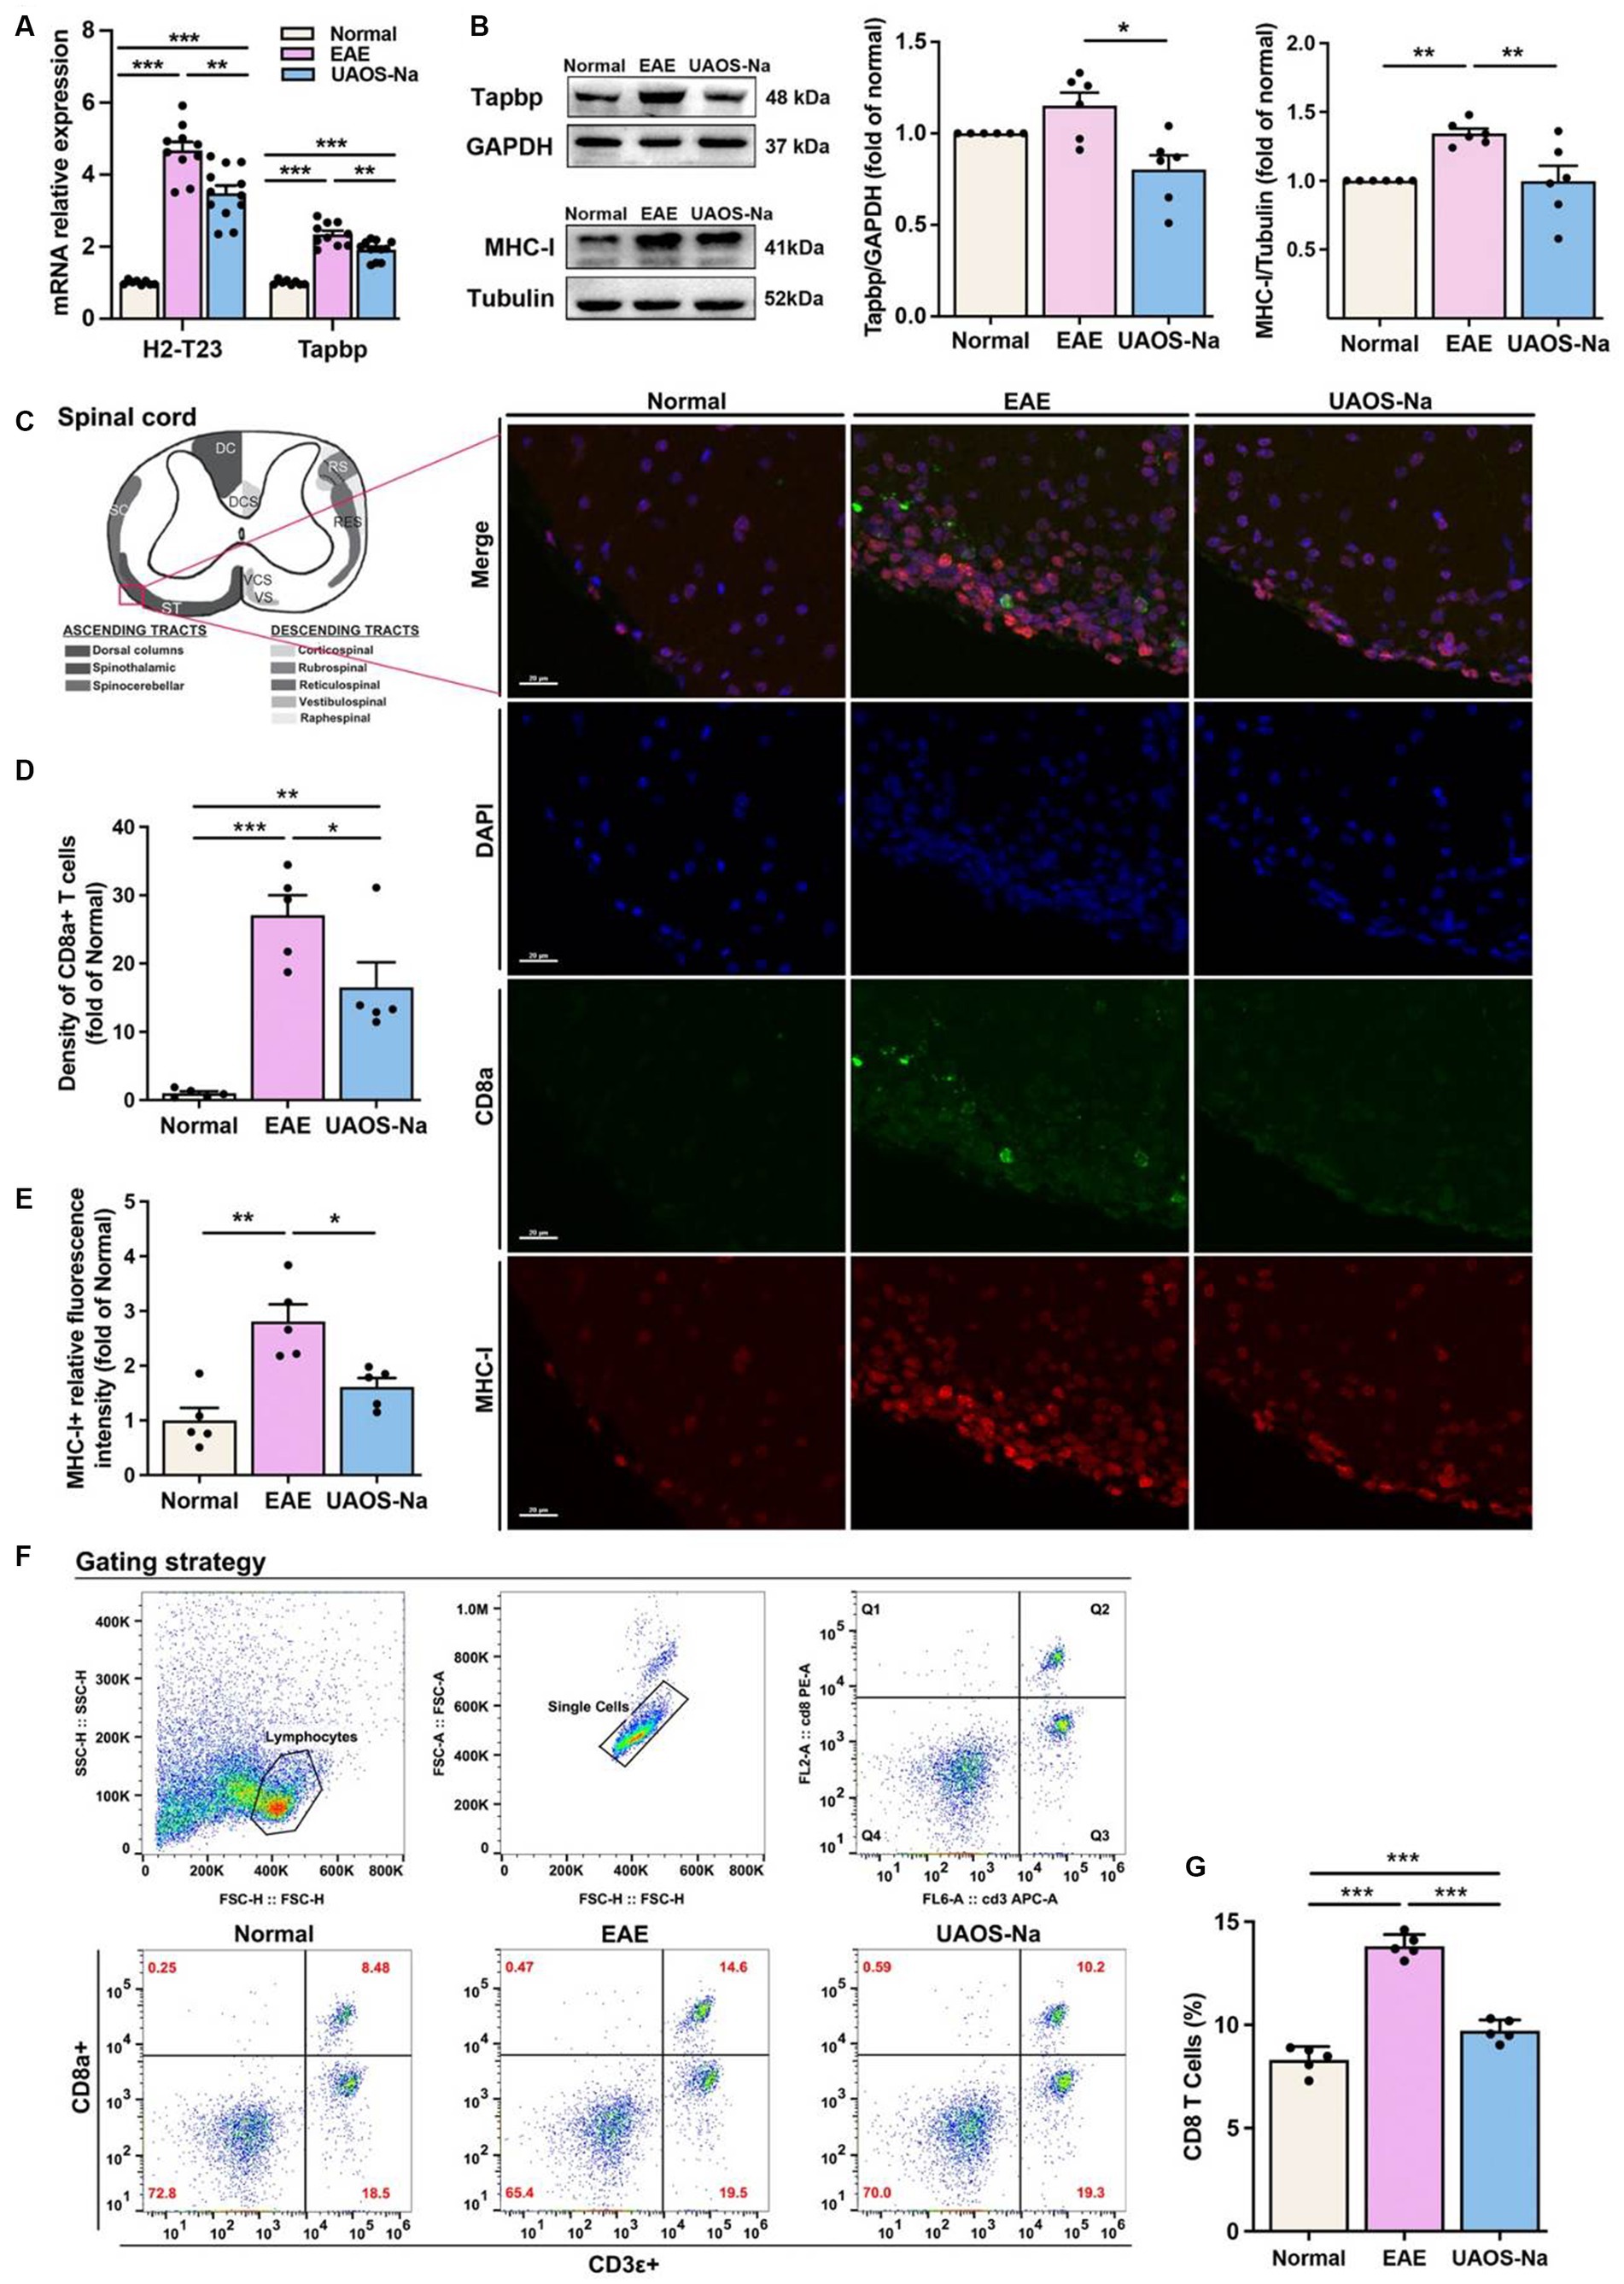
Figure 7. UAOS-Na reduces the MHC-I expression and CD8 T cell infiltration by inhibiting Tapbp and H2-T23 expression in vivo. Female, 6 to 8 weeks-old C57BL/6J mice were immunized with MOG35-55 and treated with UAOS-Na (60 mg/kg/d) by oral gavage from onset to 25 dpi. (A) mRNA levels of H2-T23 and Tapbp in mouse spinal cord analyzed by real-time PCR (n = 8 to 12). (B) The protein bands and the relative expression levels of Tapbp and MHC-I of mouse spinal cord detected by western blot (n = 6, student’s t-test was performed). (C) Spinothalamic immunofluorescence staining of mouse spinal cord (scale bar = 20 μm). (D,E) Image-Pro analysis of CD8a+ T cell density and MHC-I fluorescence intensity (n = 5, student’s t-test was performed). (F) The levels of CD8a+ and CD3ε+ T cells in spleen were detected by flow cytometry. (G) The proportion of CD8 T cells in CD3 T cells (n = 5). Data were showed by mean ± SME, one-way ANOVA with Tukey’s multiple comparisons test was performed. *p < 0.05, **p < 0.01, and ***p < 0.001.
Previous studies have reported that restriction of Tapbp and H2-T23 expression resulted in decreased MHC-I expression on the cell membrane and inhibited CD8 T cell activation (46, 47). To analyze Tapbp and MHC-I protein expression levels in spinal cord tissues, western blotting was performed. The results revealed that Tapbp and MHC-I protein expression levels in EAE mouse spinal cords were higher than those in normal mouse spinal cords, and those protein expression levels were obviously decreased after UAOS-Na treatment (Figure 7B). In addition, to examine whether UAOS-Na treatment could reduce the CNS infiltration of CD8 T cells and the expression of MHC-I in EAE mouse spinal cord, we analyzed the MHC-I expression and the density of CD8+ T cells in mouse lumbar spinal cord by immunofluorescence staining. As shown in Figure 7C, compared with normal group, the density of CD8+ T cells and high MHC-I expression cells were higher in EAE group. UAOS-Na treatment reversed the results compared with EAE group (Figures 7D,E). Thus, UAOS-Na could inhibit the MHC-I expression and reduce the CD8 T cell infiltration in EAE mouse spinal cords. Furthermore, the proportion of CD8+ T cells in mouse spleen was detected by flow cytometry, and the results showed that UAOS-Na significantly reduced the proportion of CD8 T cells (CD3ε+, CD8a+) in splenocytes of EAE mice (Figures 7F,G). Overall, UAOS-Na reduced MHC-I expression in the spinal cord by inhibiting Tapbp and H2-T23 and reduced peripheral proportion and CNS infiltration of CD8 T cells.
We investigated the effect of UAOS-Na on mBMDC, an in vitro model of antigen-presenting cells, induced by C57BL/6 mouse bone marrow cells (Figure 8A). CCK-8 results showed that UAOS-Na did not affect the viability of mBMDC (Figure 8B). To evaluate the effect of UAOS-Na on the BMDC maturation, flow cytometry was performed. UAOS-Na did not affect the numbers of mBMDC (CD11c+, CD86+ and CD11c+, MHC-I+) (Figures 8C,D). However, UAOS-Na reduced the mRNA levels of Tapbp and H2-T23 in mBMDC (Figure 8E), which indicated that UAOS-Na could reduce the antigen presentation ability of mBMDC.
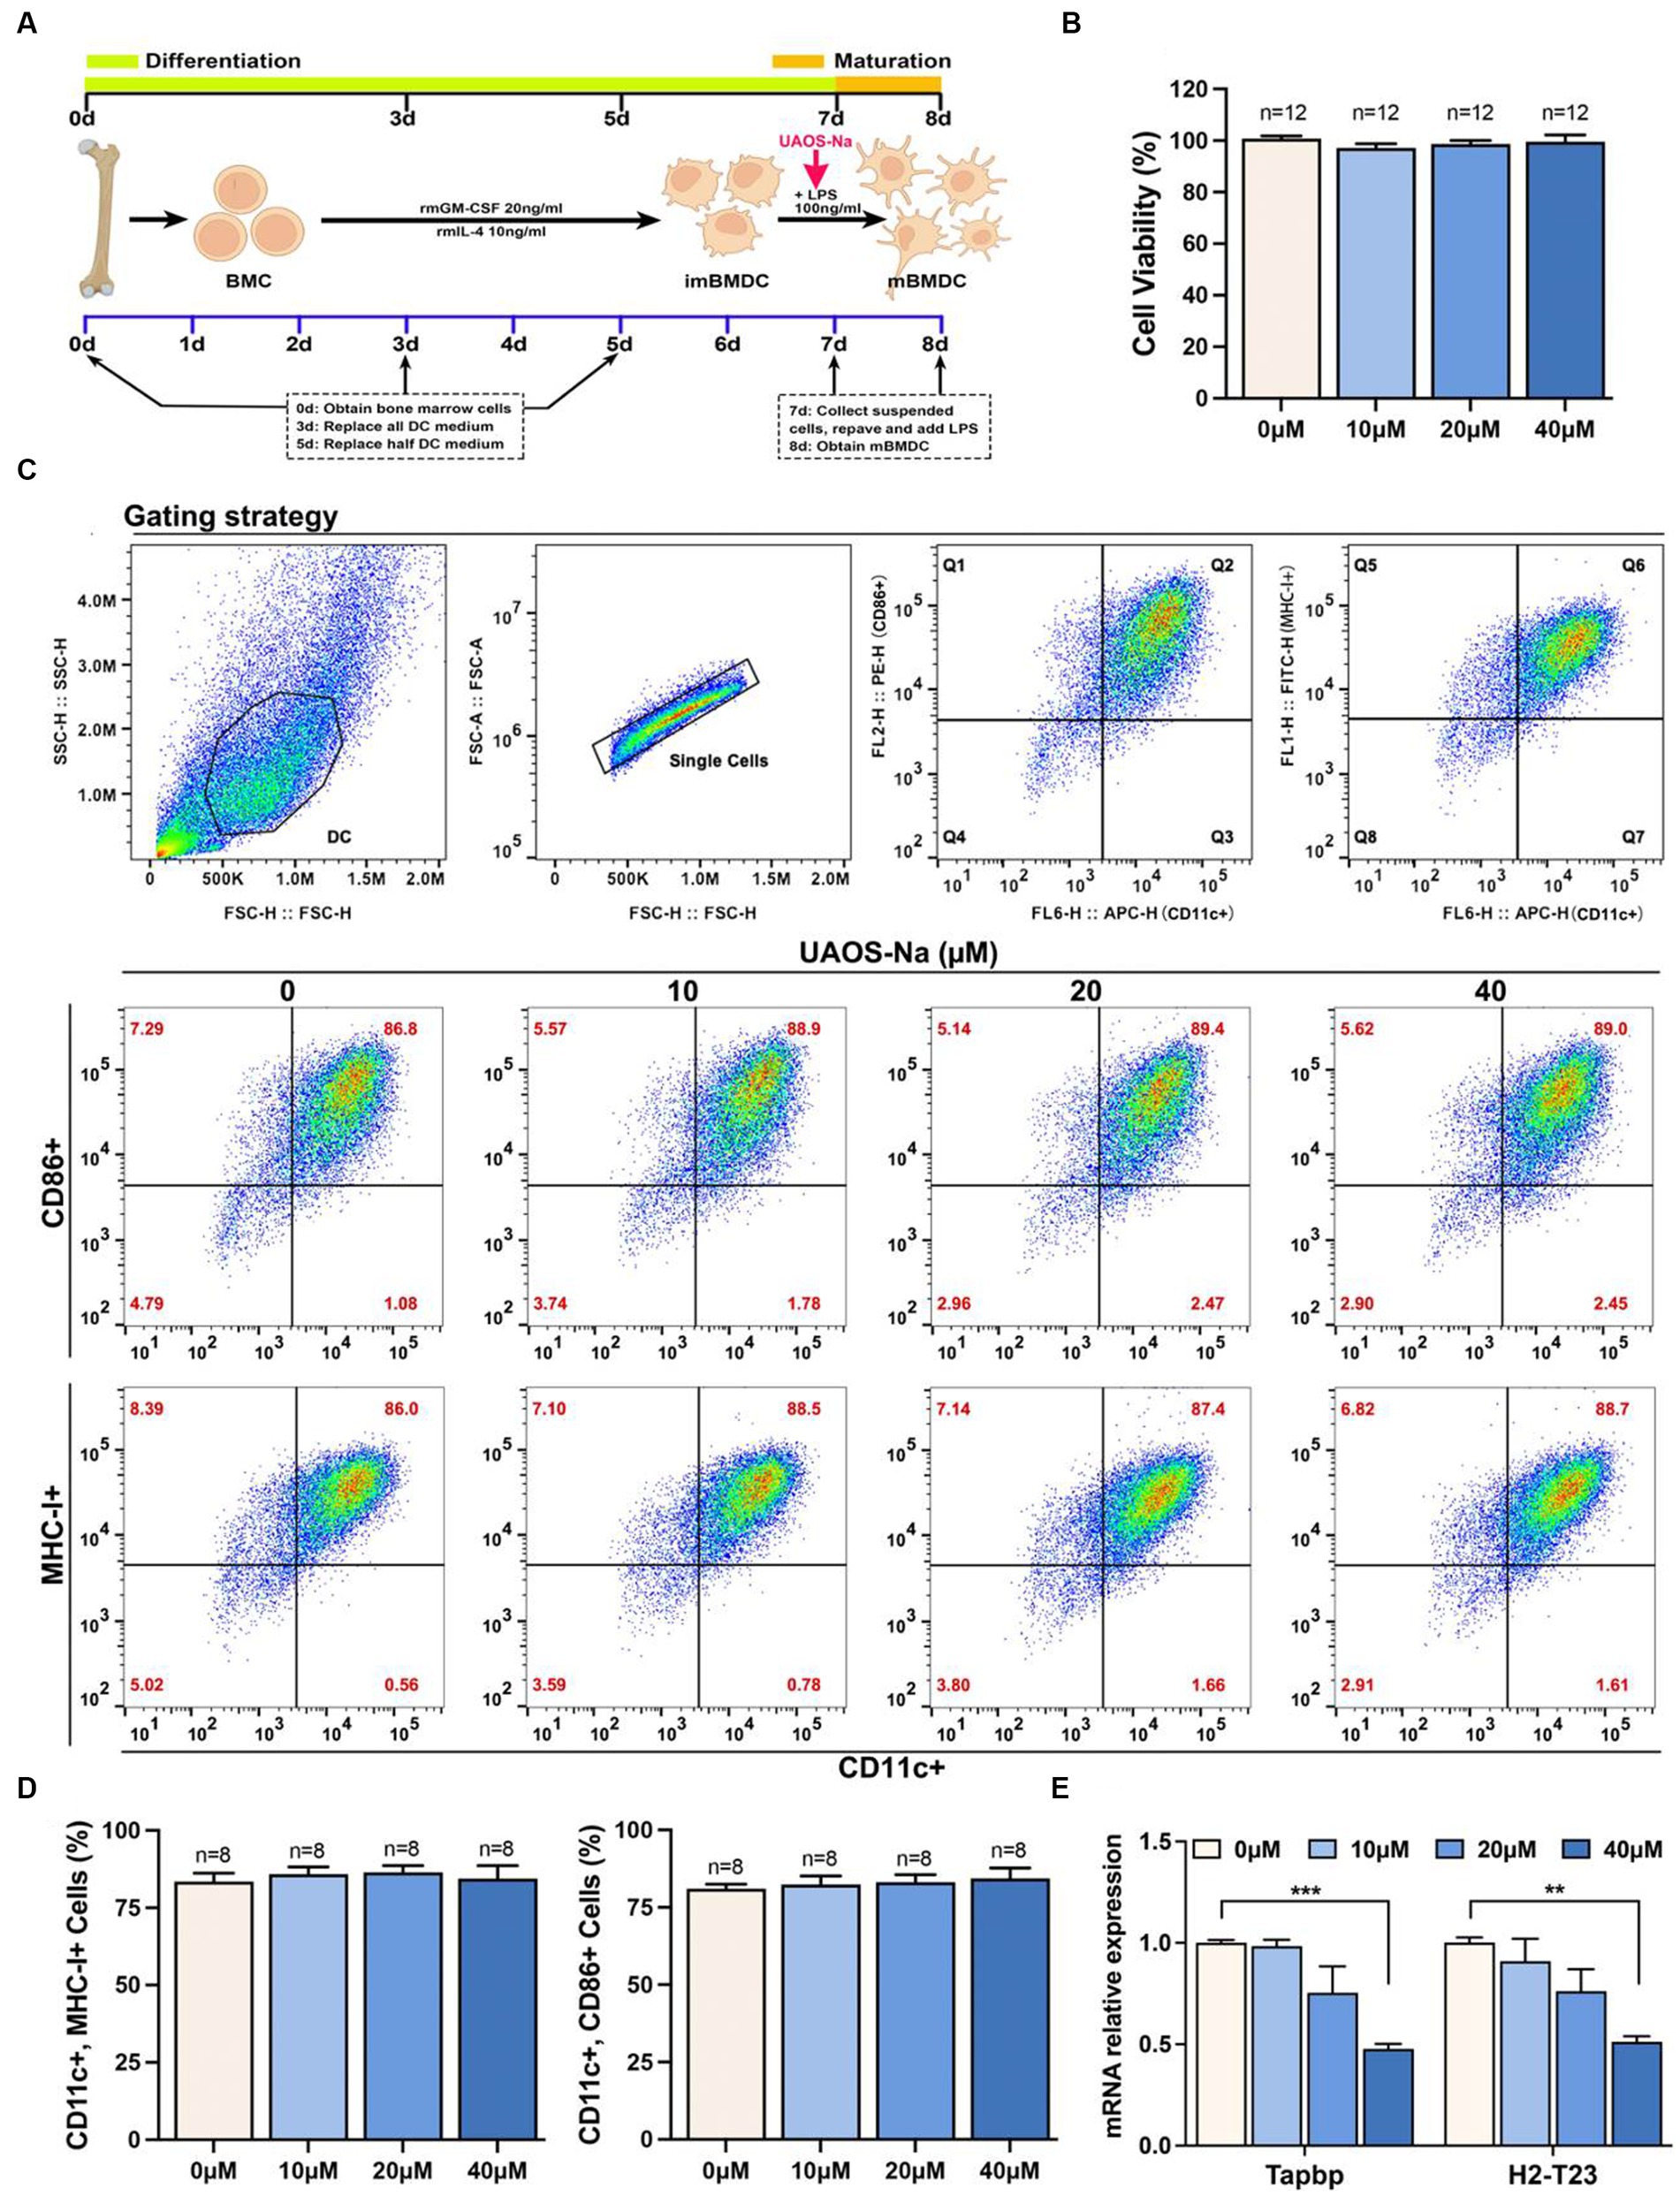
Figure 8. UAOS-Na reduces the antigen presentation ability of mBMDC. (A) Schematic diagram of mBMDC induction. (B) Cell viability was analyzed by CCK-8 commercial kits. (C) Flow cytometry was used to detect the levels of CD11c, CD86 and MHC-I. (D) The proportion of mBMDC. (E) mRNA levels of Tapbp and H2-T23 in mBMDC. Data were showed as mean ± SME. Compared with UAOS-Na-0 μM group, one-way ANOVA with Tukey’s multiple comparisons test was performed, **p < 0.01 and ***p < 0.001.
To investigate the effect of UAOS-Na on the antigen presentation ability of mBMDC, MOG-mBMDC treated by UAOS-Na were co-cultured with MOG-lymphocytes derived from EAE mouse spleen (Figure 9A). As shown in Figure 9B, UAOS-Na treatment inhibited MOG-lymphocytes proliferation induced by MOG-mBMDC which was analyzed by CCK-8 commercial kits. Furthermore, in Figures 9C,D, flow cytometry was used to determine the effect of UAOS-Na on the proportion of lymphocytes and CD8 T cells (CD3ε+, CD8a+) in the co-cultured system. UAOS-Na (40 μM) significantly inhibited the anumber of lymphocytes and CD8 T cells (CD3ε+, CD8a+; Figures 9B–D).
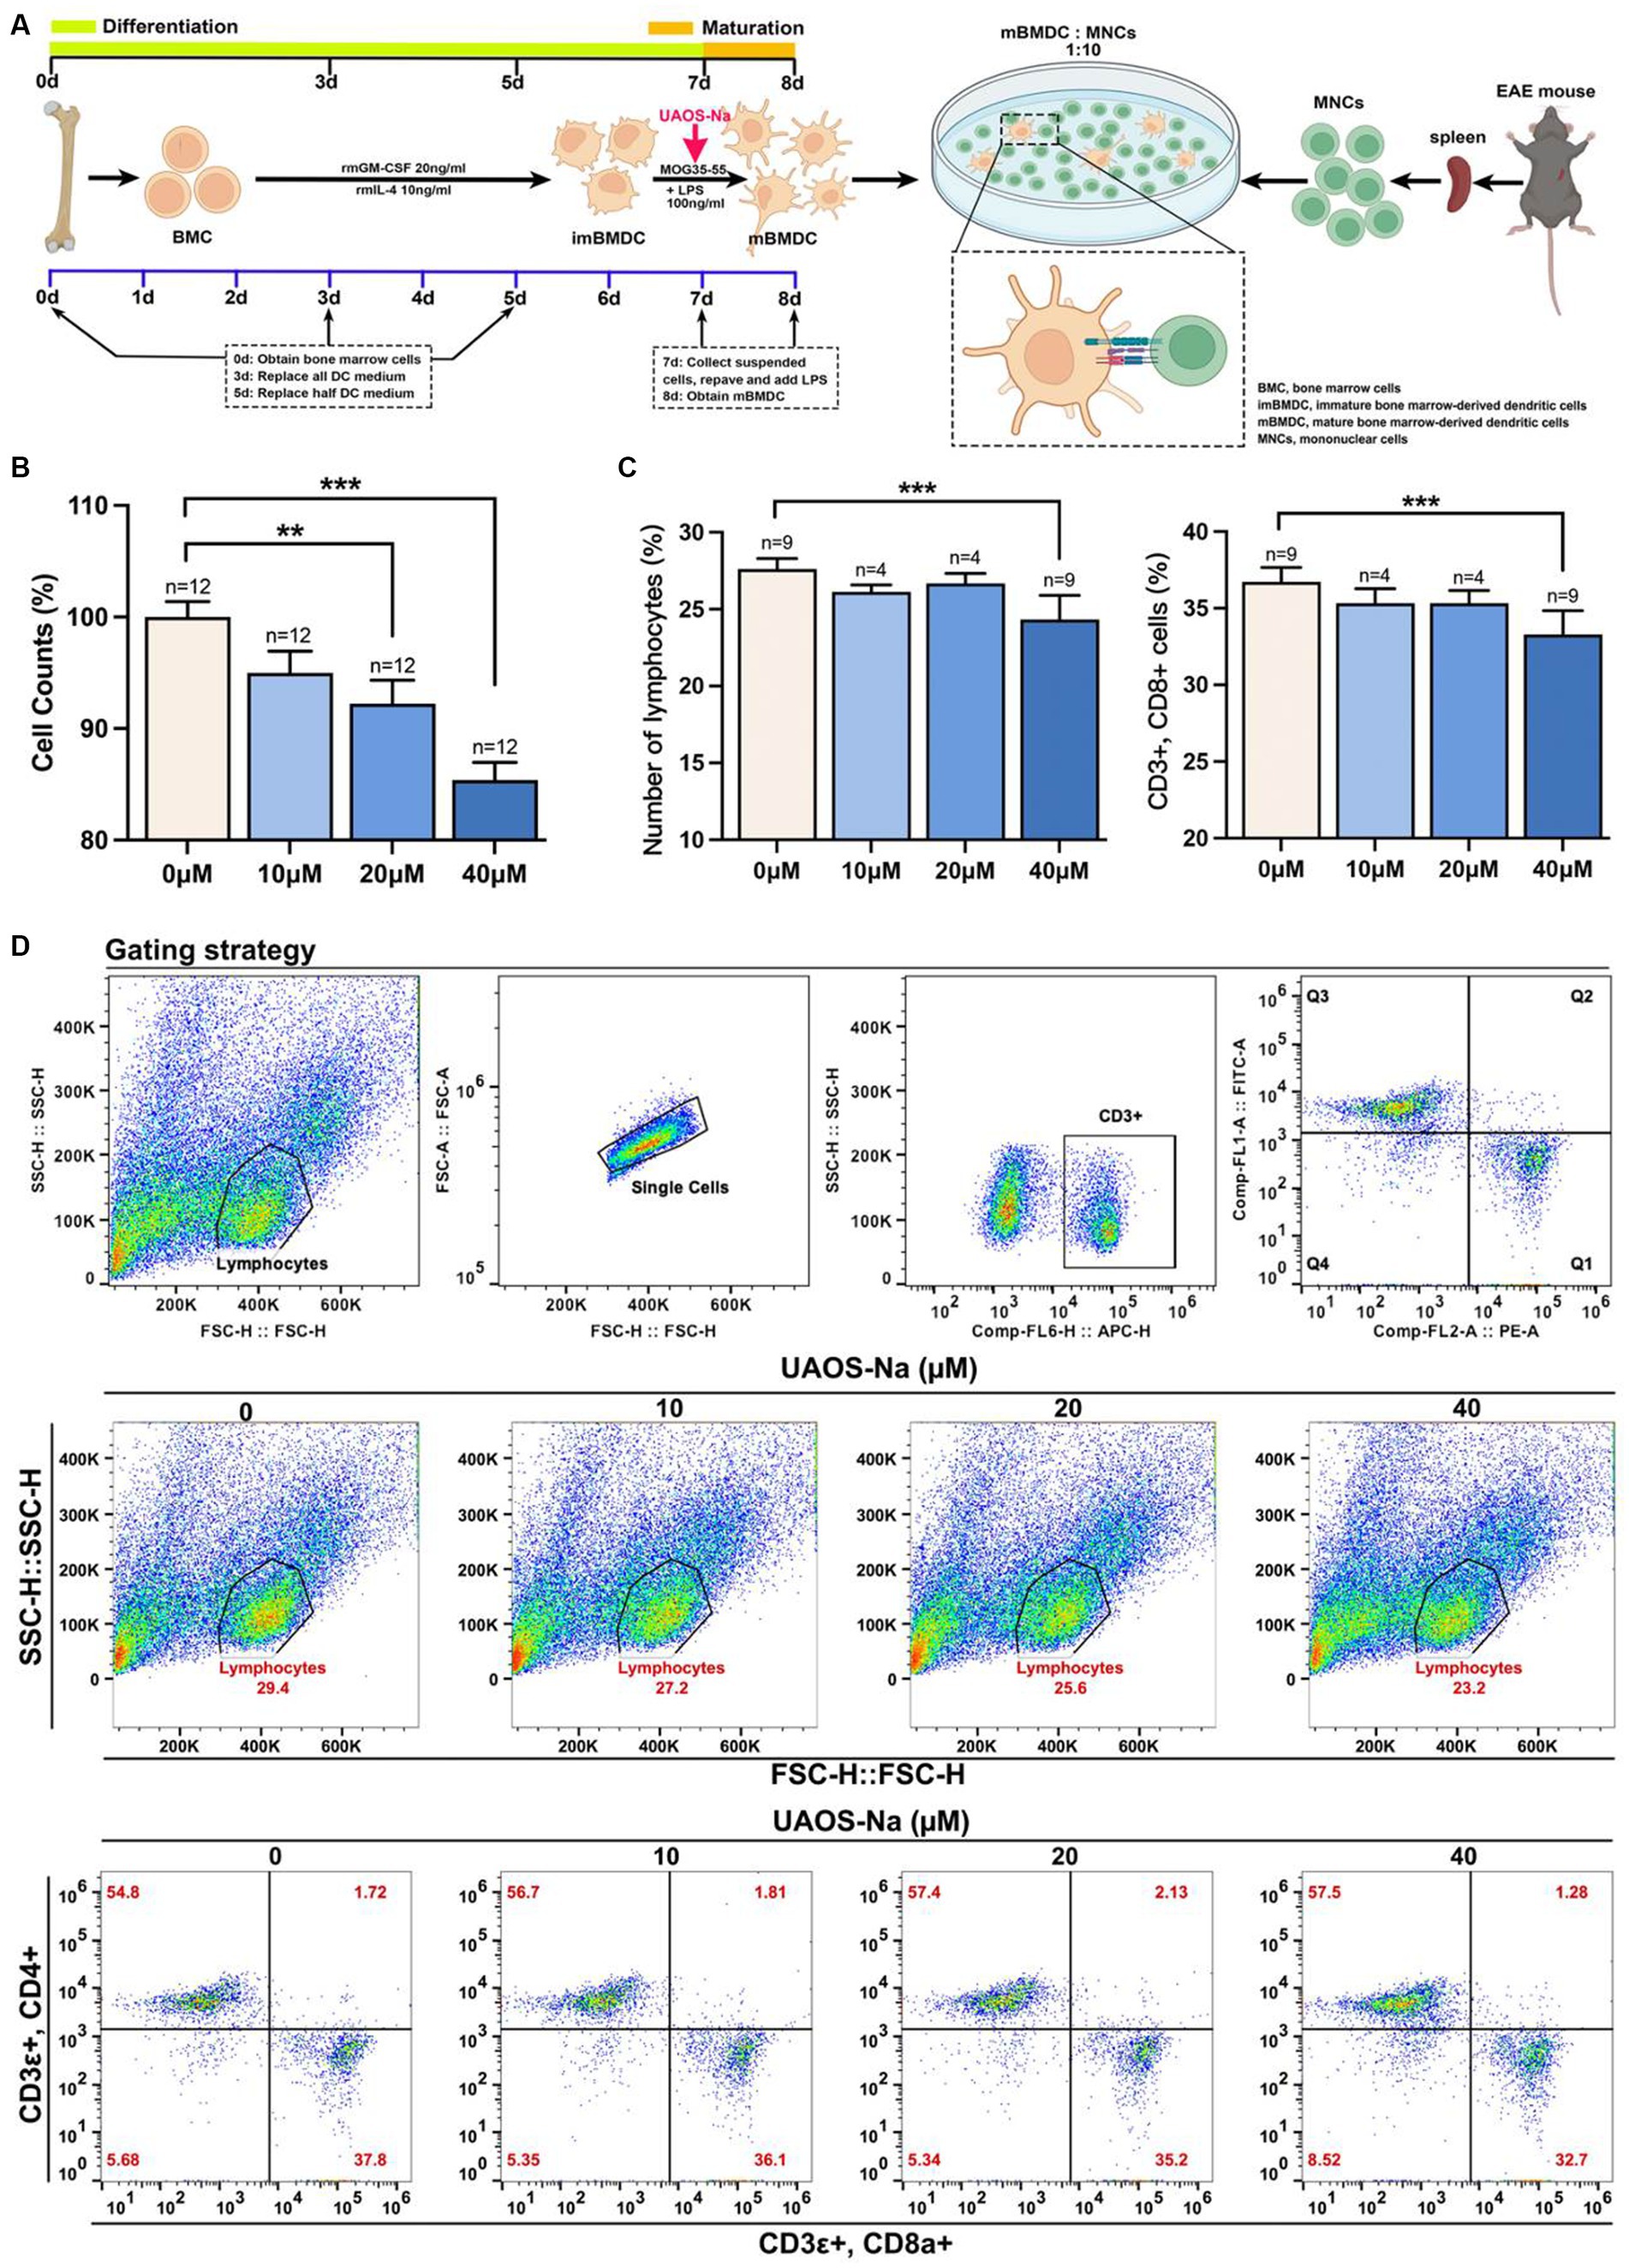
Figure 9. UAOS-Na reduces the proliferation and activation of CD8 T cells in vitro. (A) Schematic diagram of MOG-mBMDC activating MOG-T cells. (B) CCK-8 commercial kits were used to detect the inhibitory effect of UAOS-Na on MOG-T cell proliferation induced by MOG-mBMDC. (C,D) Flow cytometry was used to detect the levels of CD3ε, CD8a and CD4 (D), and the proportion of lymphocytes and CD8 T cells (C, n = 4–9 per group). Data were showed as mean ± SME. one-way ANOVA with Tukey’s multiple comparisons test was performed, *p < 0.05, **p < 0.01, and ***p < 0.001.
In conclusion, UAOS-Na inhibited mBMDC antigen presentation ability by reduced Tapbp and H2-T23 expression thereby suppressing CD8 T cell proliferation and differentiation.
Given the inflammation and demyelination lesions in the acute stage of MS/EAE, an ideal therapeutic strategy would have the capacity both to inhibit the inflammation and to reduce the axon injury with minimal side effects. Previous studies have reported that UA has immunomodulation and direct anti-demyelination effects on EAE (21–24). However, UA is insoluble in water, which may affect its medication effectiveness. To promote the aqueous solubility of UA, UAOS-Na, a derivative of UA, was prepared in our previous study. In the present study, UAOS-Na was used to treat EAE, and the results showed that UAOS-Na delayed the onset time, reduced the incidence, ameliorated inflammation and astrogliosis, and protected myelin sheath in MS animal models. Mechanistically, UAOS-Na treatment downregulated the protein levels of Tapbp and H2-T23 in MHC-I antigen presentation pathway and reduced the proliferation of splenic CD8 T cells, thereby reduced the CNS infiltration of CD8 T cells and CNS injury.
Literatures have reported that the imbalance of serum pro-inflammatory and anti-inflammatory cytokines is closely related to EAE inflammation, and inhibiting the expression of pro-inflammatory cytokines such as IFN-γ, TNF-α, IL-6, and IL-17 (31, 32) and promoting the expression of anti-inflammatory cytokines such as IL-10 (33, 34) can alleviate the inflammation of EAE. And small molecules targeting T-bet and RORγt also inhibit EAE (35). UA could reduce the serum levels of IL-6, IFN-γ, TNF-α and IL-17 (22, 24, 48). In the present study, UAOS-Na-treated EAE mice showed a significant reduction in serum levels of IFN-γ, TNF-α, IL-6, and IL-17A and in expression of key transcription factors T-bet and ROR-γt in spinal cord. In parallel, H&E staining of the spinal cord visually demonstrated that UAOS-Na significantly reduced the CNS inflammation in EAE mice. These results suggested that UAOS-Na reduced peripheral and CNS inflammation in EAE mice (Figures 2, 3). In addition, UA distribution depended on the blood flow and perfusion rate of the organs as follows: lung > spleen > liver > cerebrum > heart > kidney (49), and UA can treat central nervous system diseases (16, 17, 24). In our previous study, the in vivo pharmacokinetic parameters of UAOS-Na and UA indicated that UAOS-Na was 6-fold more exposed than UA, and that UAOS-Na was biologically active in vivo as a prodrug of UA (these data are not shown in this paper). These data also support that UAOS-Na has therapeutic activity of CNS inflammation and may be more effective than UA.
In addition to inflammation, the main pathology of MS includes demyelination and axonal injury (50, 51). Axonal injury after demyelination in MS is difficult to reverse and is a key component of disease progression and permanent neurologic disability. Therefore, preventing demyelination and promoting remyelination is very important and has become one of the research difficulties and hotspots in MS. (52) In this study, H&E (inflammation) and LFB (demyelination) staining of EAE mice spinal cord were performed and the results showed that UAOS-Na had anti-inflammatory and myelin protective effects (Figure 2). However, the effect of UAOS-Na on demyelination in EAE mice may be secondary to its immunomodulatory effect. To test whether UAOS-Na has a direct effect on myelin, we used the cuprizone-induced demyelination mouse model with minimal inflammation and highly effective remyelination. Cuprizone mice were treated with UAOS-Na from weeks 2 to 6, and the results suggested that UAOS-Na may have a direct protective effect on myelin (Figure 4), which is consistent with the anti-demyelinating effect of UA mentioned earlier. In the cuprizone model, however, demyelination and remyelination occur simultaneously in the corpus callosum from weeks 2 to 6. Therefore, whether UAOS-Na prevents demyelination or boost myelin regeneration needs to be verified by further experiments. In addition, cuprizone treatment also enhanced the reactivity of the central resident cells, such as astrocytes and microglia, which is accompanied by expression of pro-inflammatory cytokines and other inflammatory modulators (53). And astrocytes become hypertrophic and hyperplastic predates demyelination (54, 55). In this study, UAOS-Na ameliorates astrogliosis in EAE mice and cuprizone-induced mice (Figure 5), which may be a potential factor for the protection of myelin sheath by UAOS-Na. Furthermore, studies have shown that microglia become reactive as early as 1 week after cuprizone induction and sustain activity throughout demyelination (56, 57). However, whether UAOS-Na can protect the CPZ corpus callosum myelin by affecting microglia was not investigated.
For inflammatory mechanisms, MS inflammation begins with the uptake, processing, and presentation of myelin-specific antigens by antigen presenting cells (APCs) and subsequent T cell activation (58). In MHC-I antigen presentation pathway, antigens are degraded into short peptides and bound to the MHC-I antigen-binding groove in ER to form peptide-MHC-I complexes (pMHC-I), which are subsequently expressed on the cell surface for recognition by CD8 T cells (59). TCRs on CD8 T cells interact with pMHC-I, a signaling cascade is initiated resulting in cytokine production, proliferation, and/or cytolysis (47, 60). And CD8 T cells play an important role in MS and EAE pathology (61–64). Literatures have revealed that in a variety of neurological diseases, high MHC-I expression on neurons makes them a killing target of CD8 T cells, which eventually leads to neuronal apoptosis and synaptic junction dysplasia (65–68). In MS, neurons, AST, and OLs are the CD8 T cell killing targets because of their high MHC-I expression (69–71). Therefore, CD8 T cell mediated CNS damage dependent on MHC-I antigen presentation pathway may be one of the causes of MS or EAE lesions. In this study, proteomics results indicated that UAOS-Na downregulated the expression of H2-T23 in MHC-I antigen presentation pathway (Figure 6). H2-T23 forms non-classical MHC-Ib with β2m on the cell membrane, which can bind and present antigen, and participate in the positive regulation of CD8 T cell-mediated cytotoxicity (46, 72–74). Moreover, Tapbp, expressed in all nucleated cells, is essential for the successful surface expression of pMHC-I (75). Tapbp is involved in stabilizing MHC-I molecules (41, 42), and increasing the assembly speed and number of MHC-I (43–45). When Tapbp expression is restricted, pMHC-I expression in the cell membrane, the antigen presentation process, and CD8 T cell development are inhibited (47). Hence, we hypothesized that UAOS-Na relieved CNS inflammation in EAE mice, which was related to the inhibition of Tapbp and H2-T23 expression. And this hypothesis has been verified by in vitro and in vivo experiments. Further studies are needed to determine whether UAOS-Na protects myelin sheath in relation to its reduction of Tapbp expression in cells, especially oligodendrocytes. Furthermore, existing studies suggested that CD8 Treg cells play an important role in MS/EAE remission (76, 77), which was not discussed in depth in this paper. We will investigate different subtypes of CD8 T cells in the future. Interactions of NK cell receptors with pMHC-I on cell surfaces plays a crucial role in the licensing or education of NK cells (78); and microglia considered to be the principal APC within the CNS may modulate the CD8 T cells response including their proliferation, differentiation and apoptosis through the antigen presenting mechanism (79, 80); however, whether UAOS-Na can affect the function of NK cells and microglia by reducing the cell expression of Tapbp and MHC-I needs further study.
During our experiments, all animals were weighed, scored, and treated at a fixed time each day. Mice were given individualized treatment, that is, the mice were treated only after they developed clinical symptoms (onset). In our study, most of the mice had a consistent onset, which manifested as decrease in tail tension with score point 1 (83.3%) and completed tail paralysis with score point 2 (13.5%). Therefore, we did not administer different doses according to disease severity. In addition, the onset of modeling mice had a subtle difference, which were mainly concentrated in 10–14 dpi. Meanwhile, in our preliminary study for EAE modeling (the data did not show in the paper), we found the demyelinating state was most serious in 25dpi and inflammatory state was recovered quickly after 25 dpi in the mouse spinal cord. In this study, combined consideration of demyelinating and inflammatory states, we chose 25 dpi as the experimental endpoint.
Summary, in the periphery of EAE, UAOS-Na suppressed inflammation by decreasing serum proinflammatory factor levels of IFN-γ, IL-17A, TNF-α and IL-6 and inhibiting CD8 T cell activation. In the CNS of EAE, UAOS-Na reduced the expression levels of Tapbp, H2-T23, and MHC-I and reduced CD8 T cell infiltration, thereby reducing the targeted killing of nerve cells by CD8 T cells. Moreover, UAOS-Na exerted neuroprotective effect by suppressing astrogliosis and protecting myelin sheath (Figure 10).
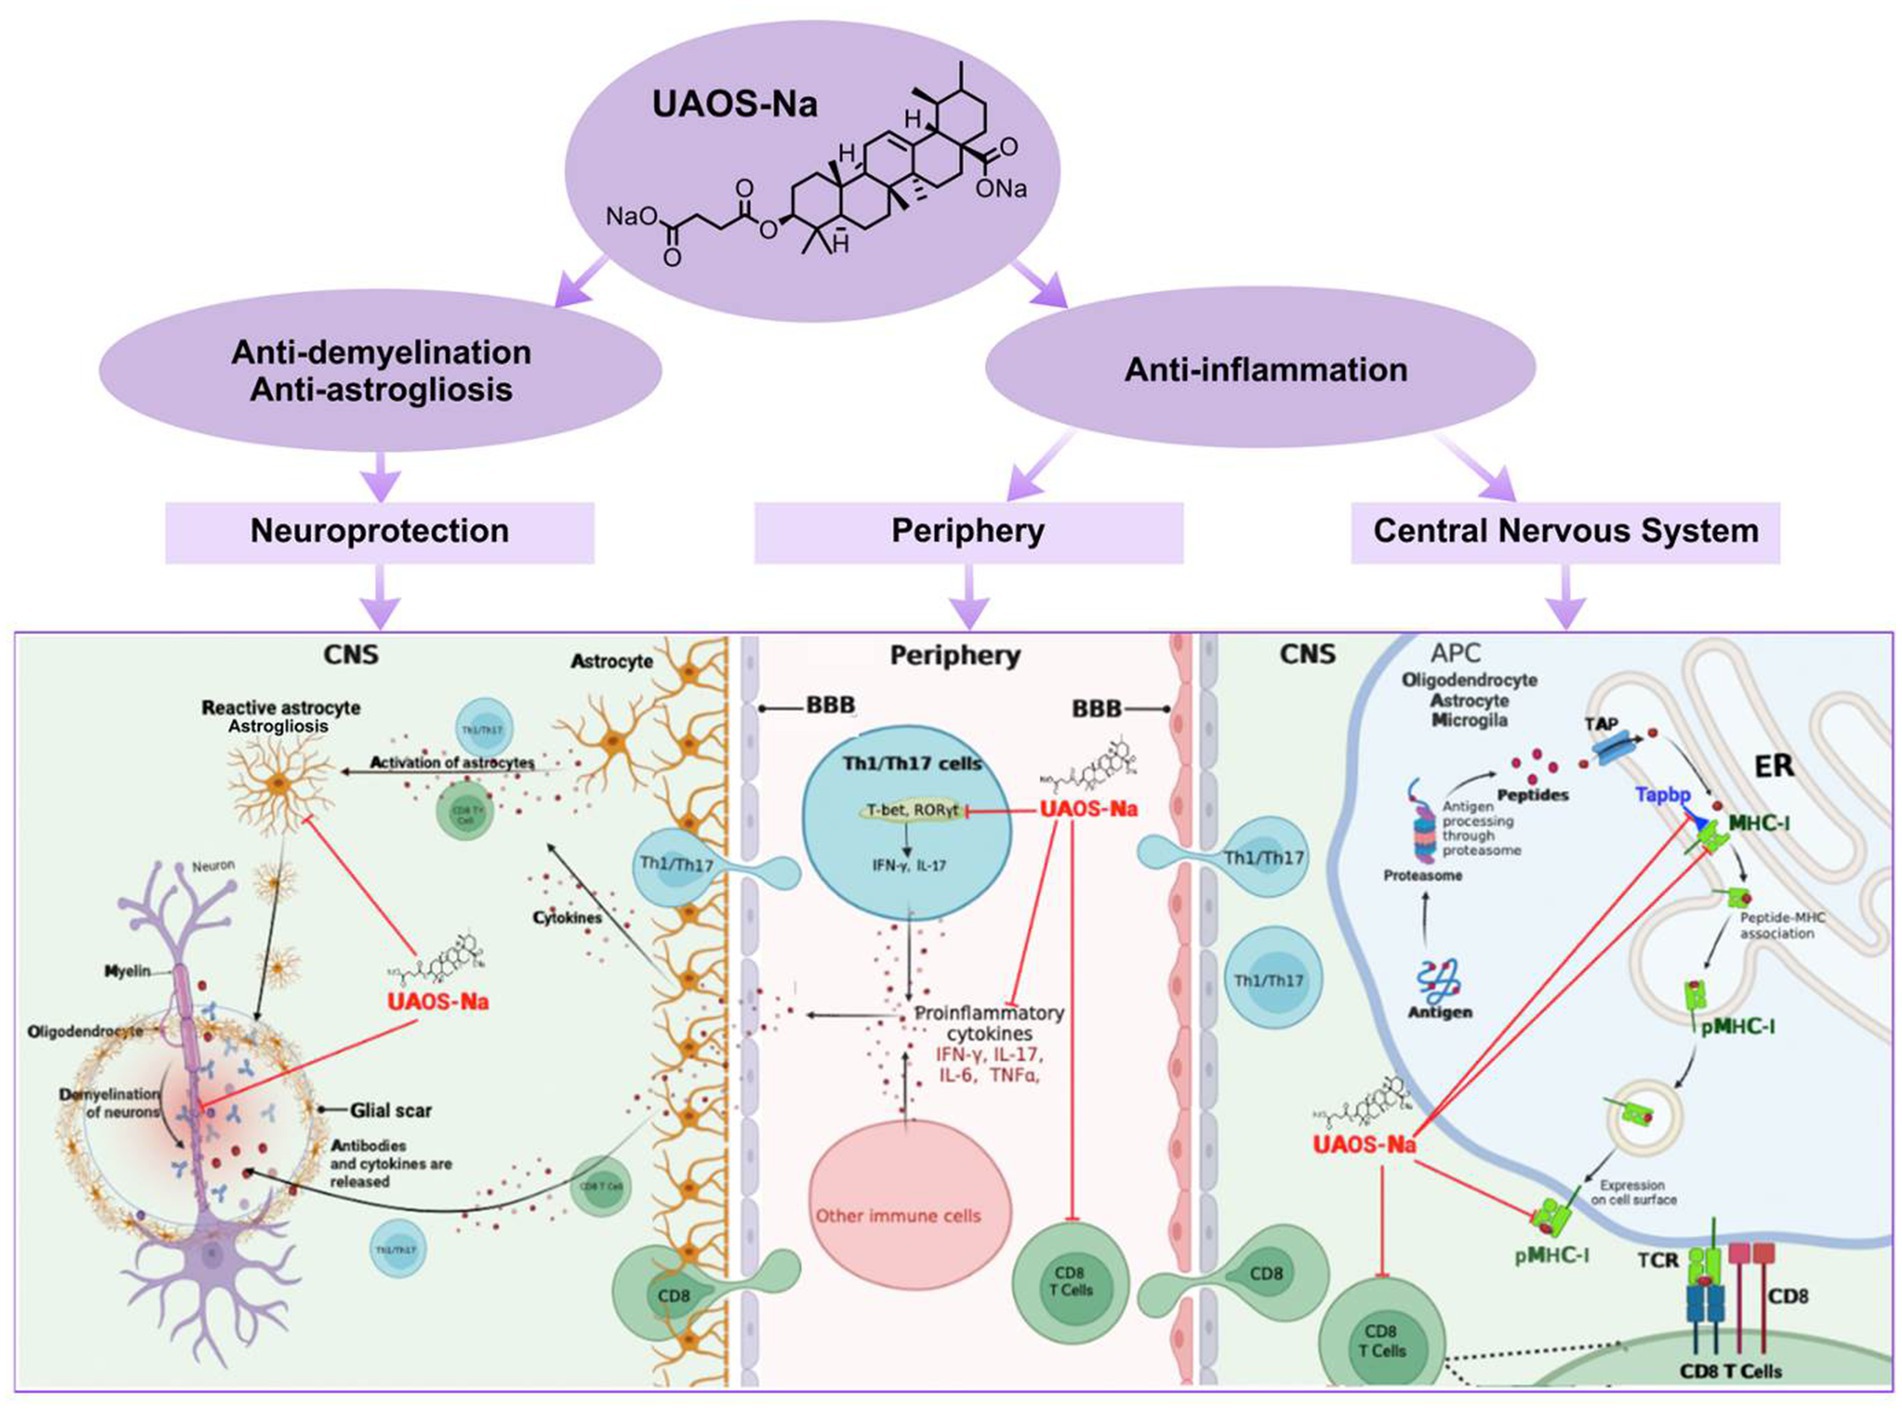
Figure 10. UAOS-Na-mediated immunomodulation and neuroprotection in EAE mice. In the periphery of EAE, UAOS-Na suppressed inflammation by decreasing serum proinflammatory factor levels of IFN-γ, IL-17A, TNF-α and IL-6 and inhibiting CD8 T cell activation (middle). In the CNS, UAOS-Na reduced the expression levels of Tapbp, H2-T23, and MHC-I and reduced CD8 T cell infiltration, thereby reducing the targeted killing of nerve cells by CD8 T cells (right). Moreover, UAOS-Na exerted neuroprotective effect by suppressing astrogliosis and protecting myelin sheath (left).
The original contributions presented in the study are publicly available. This data can be found at: [ProteomeXchange/PXD045108].
The animal study was approved by Ethics Committee of Animal Experiments of Shanghai University of Traditional Chinese Medicine. The study was conducted in accordance with the local legislation and institutional requirements.
MW: Conceptualization, Data curation, Investigation, Methodology, Software, Visualization, Writing – original draft. CG: Data curation, Methodology, Visualization, Writing – review & editing. YY: Formal analysis, Investigation, Supervision, Writing – review & editing. LC: Investigation, Methodology, Validation, Writing – review & editing. KC: Project administration, Resources, Writing – review & editing. JD: Investigation, Methodology, Supervision, Validation, Writing – review & editing. HW: Data curation, Writing – review & editing, Conceptualization, Investigation. YL: Conceptualization, Methodology, Project administration, Resources, Writing – review & editing.
The author(s) declare financial support was received for the research, authorship, and/or publication of this article. This work was supported by the National Natural Science Foundation of China (81973458), the National Key Science and Technology Infrastructure (Shanghai) Translational Medicine Open Program (TMSK-2021-404), and Shanghai Scientific and Technological Innovation Program (18401931100).
LC and JD were employed by Amway (Shanghai) Innovation and Science Co., Ltd.
The remaining authors declare that the research was conducted in the absence of any commercial or financial relationships that could be construed as a potential conflict of interest.
All claims expressed in this article are solely those of the authors and do not necessarily represent those of their affiliated organizations, or those of the publisher, the editors and the reviewers. Any product that may be evaluated in this article, or claim that may be made by its manufacturer, is not guaranteed or endorsed by the publisher.
The Supplementary material for this article can be found online at: https://www.frontiersin.org/articles/10.3389/fneur.2023.1269862/full#supplementary-material
1. Lublin, FD, and Reingold, SC. Defining the clinical course of multiple sclerosis: results of an international survey. National Multiple Sclerosis Society (USA) advisory committee on clinical trials of new agents in multiple sclerosis. Neurology. (1996) 46:907–11. doi: 10.1212/wnl.46.4.907
2. Compston, A, and Coles, A. Multiple sclerosis. Lancet. (2008) 372:1502–17. doi: 10.1016/S0140-6736(08)61620-7
3. Hartung, DM. Economics and cost-effectiveness of multiple sclerosis therapies in the USA. Neurotherapeutics. (2017) 14:1018–26. doi: 10.1007/s13311-017-0566-3
4. Correale, J, Gaitan, MI, Ysrraelit, MC, and Fiol, MP. Progressive multiple sclerosis: from pathogenic mechanisms to treatment. Brain. (2017) 140:aww258–546. doi: 10.1093/brain/aww258
5. Rae-Grant, A, Day, GS, Marrie, RA, Rabinstein, A, Cree, BAC, Gronseth, GS, et al. Practice guideline recommendations summary: disease-modifying therapies for adults with multiple sclerosis: report of the guideline development, dissemination, and implementation subcommittee of the American Academy of Neurology. Neurology. (2018) 90:777–88. doi: 10.1212/WNL.0000000000005347
6. Durelli, L, Verdun, E, Barbero, P, Bergui, M, Versino, E, Ghezzi, A, et al. Every-other-day interferon beta-1b versus once-weekly interferon beta-1a for multiple sclerosis: results of a 2-year prospective randomised multicentre study (INCOMIN). Lancet. (2002) 359:1453–60. doi: 10.1016/s0140-6736(02)08430-1
7. Fox, RJ, Miller, DH, Phillips, JT, Hutchinson, M, Havrdova, E, Kita, M, et al. Placebo-controlled phase 3 study of oral BG-12 or glatiramer in multiple sclerosis. N Engl J Med. (2012) 367:1087–97. doi: 10.1056/NEJMoa1206328
8. Thompson, AJ, Baranzini, SE, Geurts, J, Hemmer, B, and Ciccarelli, O. Multiple sclerosis. Lancet. (2018) 391:1622–36. doi: 10.1016/S0140-6736(18)30481-1
9. Berger, JR. Classifying PML risk with disease modifying therapies. Mult Scler Relat Disord. (2017) 12:59–63. doi: 10.1016/j.msard.2017.01.006
10. Kappos, L, Radue, EW, O’Connor, P, Polman, C, Hohlfeld, R, Calabresi, P, et al. A placebo-controlled trial of oral fingolimod in relapsing multiple sclerosis. N Engl J Med. (2010) 362:387–401. doi: 10.1056/NEJMoa0909494
11. Coles, AJ, Cohen, JA, Fox, EJ, Giovannoni, G, Hartung, HP, Havrdova, E, et al. Alemtuzumab CARE-MS II 5-year follow-up: efficacy and safety findings. Neurology. (2017) 89:1117–26. doi: 10.1212/WNL.0000000000004354
12. Havrdova, E, Arnold, DL, Cohen, JA, Hartung, HP, Fox, EJ, Giovannoni, G, et al. Alemtuzumab CARE-MS I 5-year follow-up: durable efficacy in the absence of continuous MS therapy. Neurology. (2017) 89:1107–16. doi: 10.1212/WNL.0000000000004313
13. Holmoy, T, Fevang, B, Olsen, DB, Spigset, O, and Bo, L. Adverse events with fatal outcome associated with alemtuzumab treatment in multiple sclerosis. BMC Res Notes. (2019) 12:497. doi: 10.1186/s13104-019-4507-6
14. Newman, DJ, and Cragg, GM. Natural products as sources of new drugs over the nearly four decades from 01/1981 to 09/2019. J Nat Prod. (2020) 83:770–803. doi: 10.1021/acs.jnatprod.9b01285
15. Ikeda, Y, Murakami, A, and Ohigashi, H. Ursolic acid: an anti- and pro-inflammatory triterpenoid. Mol Nutr Food Res. (2008) 52:26–42. doi: 10.1002/mnfr.200700389
16. Liu, B, Liu, Y, Yang, G, Xu, Z, and Chen, J. Ursolic acid induces neural regeneration after sciatic nerve injury. Neural Regen Res. (2013) 8:2510–9. doi: 10.3969/j.issn.1673-5374.2013.27.002
17. Ramos-Hryb, AB, Pazini, FL, Kaster, MP, and Rodrigues, ALS. Therapeutic potential of ursolic acid to manage neurodegenerative and psychiatric diseases. CNS Drugs. (2017) 31:1029–41. doi: 10.1007/s40263-017-0474-4
18. Garabadu, D, and Singh, D. Ocimum basilicum attenuates ethidium bromide-induced cognitive deficits and pre-frontal cortical neuroinflammation, astrogliosis and mitochondrial dysfunction in rats. Metab Brain Dis. (2020) 35:483–95. doi: 10.1007/s11011-020-00536-z
19. Kashyap, D, Sharma, A, Tuli, HS, Punia, S, and Sharma, AK. Ursolic acid and oleanolic acid: pentacyclic terpenoids with promising anti-inflammatory activities. Recent Patents Inflamm Allergy Drug Discov. (2016) 10:21–33. doi: 10.2174/1872213x10666160711143904
20. Lu, J, Wu, DM, Zheng, YL, Hu, B, Cheng, W, Zhang, ZF, et al. Ursolic acid improves high fat diet-induced cognitive impairments by blocking endoplasmic reticulum stress and IκB kinase β/nuclear factor-κB-mediated inflammatory pathways in mice. Brain Behav Immun. (2011) 25:1658–67. doi: 10.1016/j.bbi.2011.06.009
21. Honarvar, F, Hojati, V, Bakhtiari, N, Vaezi, G, and Javan, M. Myelin protection by ursolic acid in cuprizone-induced demyelination in mice. Iran J Pharm Res. (2019) 18:1978–88. doi: 10.22037/ijpr.2019.112181.13582
22. Honarvar, F, Hojati, V, Zare, L, Bakhtiari, N, and Javan, M. Ursolic acid enhances myelin repair in adult mice brains and stimulates exhausted oligodendrocyte progenitors to remyelinate. J Mol Neurosci. (2022) 72:2081–93. doi: 10.1007/s12031-022-02059-x
23. Yamamoto, S, Sakemoto, C, Iwasa, K, Maruyama, K, Shimizu, K, and Yoshikawa, K. Ursolic acid treatment suppresses cuprizone-induced demyelination and motor dysfunction via upregulation of IGF-1. J Pharmacol Sci. (2020) 144:119–22. doi: 10.1016/j.jphs.2020.08.002
24. Zhang, Y, Li, X, Ciric, B, Curtis, MT, Chen, WJ, Rostami, A, et al. A dual effect of ursolic acid to the treatment of multiple sclerosis through both immunomodulation and direct remyelination. Proc Natl Acad Sci U S A. (2020) 117:9082–93. doi: 10.1073/pnas.2000208117
25. Chen, H, Gao, Y, Wang, A, Zhou, X, Zheng, Y, and Zhou, J. Evolution in medicinal chemistry of ursolic acid derivatives as anticancer agents. Eur J Med Chem. (2015) 92:648–55. doi: 10.1016/j.ejmech.2015.01.031
26. Chen, Q, Luo, S, Zhang, Y, and Chen, Z. Development of a liquid chromatography-mass spectrometry method for the determination of ursolic acid in rat plasma and tissue: application to the pharmacokinetic and tissue distribution study. Anal Bioanal Chem. (2011) 399:2877–84. doi: 10.1007/s00216-011-4651-x
27. Dasilva, AG, and Yong, VW. Expression and regulation of matrix metalloproteinase-12 in experimental autoimmune encephalomyelitis and by bone marrow derived macrophages in vitro. J Neuroimmunol. (2008) 199:24–34. doi: 10.1016/j.jneuroim.2008.04.034
28. Weaver, A, Goncalves da Silva, A, Nuttall, RK, Edwards, DR, Shapiro, SD, Rivest, S, et al. An elevated matrix metalloproteinase (MMP) in an animal model of multiple sclerosis is protective by affecting Th1/Th2 polarization. FASEB J. (2005) 19:1668–70. doi: 10.1096/fj.04-2030fje
29. Liao, Q, Yang, W, Jia, Y, Chen, X, Gao, Q, and Bi, K. LC-MS determination and pharmacokinetic studies of ursolic acid in rat plasma after administration of the traditional Chinese medicinal preparation Lu-Ying extract. Yakugaku Zasshi. (2005) 125:509–15. doi: 10.1248/yakushi.125.509
30. Sobel, RA, Blanchette, BW, Bhan, AK, and Colvin, RB. The immunopathology of experimental allergic encephalomyelitis. I. Quantitative analysis of inflammatory cells in situ. J Immunol. (1984) 132:2393–401. doi: 10.4049/jimmunol.132.5.2393
31. Navikas, V, and Link, H. Review: cytokines and the pathogenesis of multiple sclerosis. J Neurosci Res. (1996) 45:322–33. doi: 10.1002/(SICI)1097-4547(19960815)45:4<322::AID-JNR1>3.0.CO;2-B
32. Simpson, S Jr, Stewart, N, van der Mei, I, Otahal, P, Charlesworth, J, Ponsonby, AL, et al. Stimulated PBMC-produced IFN-gamma and TNF-alpha are associated with altered relapse risk in multiple sclerosis: results from a prospective cohort study. J Neurol Neurosurg Psychiatry. (2015) 86:200–7. doi: 10.1136/jnnp-2013-307336
33. Grace, PM, Loram, LC, Christianson, JP, Strand, KA, Flyer-Adams, JG, Penzkover, KR, et al. Behavioral assessment of neuropathic pain, fatigue, and anxiety in experimental autoimmune encephalomyelitis (EAE) and attenuation by interleukin-10 gene therapy. Brain Behav Immun. (2017) 59:49–54. doi: 10.1016/j.bbi.2016.05.012
34. Yang, J, Jiang, Z, Fitzgerald, DC, Ma, C, Yu, S, Li, H, et al. Adult neural stem cells expressing IL-10 confer potent immunomodulation and remyelination in experimental autoimmune encephalitis. J Clin Invest. (2009) 119:3678–91. doi: 10.1172/JCI37914
35. Tan, J, Liu, H, Huang, M, Li, N, Tang, S, Meng, J, et al. Small molecules targeting RORgammat inhibit autoimmune disease by suppressing Th17 cell differentiation. Cell Death Dis. (2020) 11:697. doi: 10.1038/s41419-020-02891-2
36. Karimi-Abdolrezaee, S, and Billakanti, R. Reactive astrogliosis after spinal cord injury-beneficial and detrimental effects. Mol Neurobiol. (2012) 46:251–64. doi: 10.1007/s12035-012-8287-4
37. Tepavcevic, V, Kerninon, C, Aigrot, MS, Meppiel, E, Mozafari, S, Arnould-Laurent, R, et al. Early netrin-1 expression impairs central nervous system remyelination. Ann Neurol. (2014) 76:252–68. doi: 10.1002/ana.24201
38. Vora, P, Pillai, P, Mustapha, J, Kowal, C, Shaffer, S, Bose, R, et al. CXCL1 regulation of oligodendrocyte progenitor cell migration is independent of calcium signaling. Exp Neurol. (2012) 236:259–67. doi: 10.1016/j.expneurol.2012.04.012
39. Domon, B, and Aebersold, R. Mass spectrometry and protein analysis. Science. (2006) 312:212–7. doi: 10.1126/science.1124619
40. Guerrera, IC, and Kleiner, O. Application of mass spectrometry in proteomics. Biosci Rep. (2005) 25:71–93. doi: 10.1007/s10540-005-2849-x
41. Garbi, N, Tiwari, N, Momburg, F, and Hammerling, GJ. A major role for tapasin as a stabilizer of the TAP peptide transporter and consequences for MHC class I expression. Eur J Immunol. (2003) 33:264–73. doi: 10.1002/immu.200390029
42. Margulies, DH, Jiang, J, and Natarajan, K. Structural and dynamic studies of TAPBPR and tapasin reveal the mechanism of peptide loading of MHC-I molecules. Curr Opin Immunol. (2020) 64:71–9. doi: 10.1016/j.coi.2020.04.004
43. Howarth, M, Williams, A, Tolstrup, AB, and Elliott, T. Tapasin enhances MHC class I peptide presentation according to peptide half-life. Proc Natl Acad Sci U S A. (2004) 101:11737–42. doi: 10.1073/pnas.0306294101
44. Lan, BH, Becker, M, and Freund, C. The mode of action of tapasin on major histocompatibility class I (MHC-I) molecules. J Biol Chem. (2023) 299:102987. doi: 10.1016/j.jbc.2023.102987
45. van Hateren, A, and Elliott, T. The role of MHC I protein dynamics in tapasin and TAPBPR-assisted immunopeptidome editing. Curr Opin Immunol. (2021) 70:138–43. doi: 10.1016/j.coi.2021.06.016
46. Bian, Y, Shang, S, Siddiqui, S, Zhao, J, Joosten, SA, Ottenhoff, THM, et al. MHC Ib molecule Qa-1 presents Mycobacterium tuberculosis peptide antigens to CD8+ T cells and contributes to protection against infection. PLoS Pathog. (2017) 13:e1006384. doi: 10.1371/journal.ppat.1006384
47. Grandea, AG, Golovina, TN, Hamilton, SE, Sriram, V, Spies, T, Brutkiewicz, RR, et al. Impaired assembly yet normal trafficking of MHC class I molecules in Tapasin mutant mice. Immunity. (2000) 13:213–22. doi: 10.1016/s1074-7613(00)00021-2
48. Xu, H, Yu, AL, Zhao, DP, Meng, GY, Wang, L, Shan, M, et al. Ursolic acid inhibits Th17 cell differentiation via STAT3/RORγt pathway and suppresses Schwann cell-mediated Th17 cell migration by reducing CXCL9/10 expression. Innate Immun. (2022) 28:155–63. doi: 10.1177/17534259221094559
49. Jinhua, W. Ursolic acid: pharmacokinetics process in vitro and in vivo, a mini review. Arch Pharm. (2019) 352:e1800222. doi: 10.1002/ardp.201800222
50. Gacem, N, and Nait-Oumesmar, B. Oligodendrocyte development and regenerative therapeutics in multiple sclerosis. Life. (2021) 11:327. doi: 10.3390/life11040327
51. Tsunoda, I, and Fujinami, RS. Inside-out versus outside-in models for virus induced demyelination: axonal damage triggering demyelination. Springer Semin Immunopathol. (2002) 24:105–25. doi: 10.1007/s00281-002-0105-z
52. Dulamea, AO. The contribution of oligodendrocytes and oligodendrocyte progenitor cells to central nervous system repair in multiple sclerosis: perspectives for remyelination therapeutic strategies. Neural Regen Res. (2017) 12:1939–44. doi: 10.4103/1673-5374.221146
53. Praet, J, Guglielmetti, C, Berneman, Z, Van der Linden, A, and Ponsaerts, P. Cellular and molecular neuropathology of the cuprizone mouse model: clinical relevance for multiple sclerosis. Neurosci Biobehav Rev. (2014) 47:485–505. doi: 10.1016/j.neubiorev.2014.10.004
54. Blakemore, WF. Observations on oligodendrocyte degeneration, the resolution of status spongiosus and remyelination in cuprizone intoxication in mice. J Neurocytol. (1972) 1:413–26. doi: 10.1007/BF01102943
55. Hiremath, MM, Saito, Y, Knapp, GW, Ting, JP, Suzuki, K, and Matsushima, GK. Microglial/macrophage accumulation during cuprizone-induced demyelination in C57BL/6 mice. J Neuroimmunol. (1998) 92:38–49. doi: 10.1016/s0165-5728(98)00168-4
56. Greter, M, Lelios, I, and Croxford, AL. Microglia versus myeloid cell nomenclature during brain inflammation. Front Immunol. (2015) 6:249. doi: 10.3389/fimmu.2015.00249
57. Marzan, DE, Brugger-Verdon, V, West, BL, Liddelow, S, Samanta, J, and Salzer, JL. Activated microglia drive demyelination via CSF1R signaling. Glia. (2021) 69:1583–604. doi: 10.1002/glia.23980
58. Stoeckle, C, and Tolosa, E. Antigen processing and presentation in multiple sclerosis. Results Probl Cell Differ. (2010) 51:149–72. doi: 10.1007/400_2009_22
59. Meunier, L, Usherwood, YK, Chung, KT, and Hendershot, LM. A subset of chaperones and folding enzymes form multiprotein complexes in endoplasmic reticulum to bind nascent proteins. Mol Biol Cell. (2002) 13:4456–69. doi: 10.1091/mbc.e02-05-0311
60. Thomas, C, and Tampe, R. MHC I chaperone complexes shaping immunity. Curr Opin Immunol. (2019) 58:9–15. doi: 10.1016/j.coi.2019.01.001
61. Ankathatti Munegowda, M, Deng, Y, Chibbar, R, Xu, Q, Freywald, A, Mulligan, SJ, et al. A distinct role of CD4+ Th17- and Th17-stimulated CD8+ CTL in the pathogenesis of type 1 diabetes and experimental autoimmune encephalomyelitis. J Clin Immunol. (2011) 31:811–26. doi: 10.1007/s10875-011-9549-z
62. Nichols, JM, Kummari, E, Sherman, J, Yang, EJ, Dhital, S, Gilfeather, C, et al. CBD suppression of EAE is correlated with early inhibition of splenic IFN-gamma + CD8+ T cells and modest inhibition of neuroinflammation. J Neuroimmune Pharmacol. (2021) 16:346–62. doi: 10.1007/s11481-020-09917-8
63. Stojic-Vukanic, Z, Hadzibegovic, S, Nicole, O, Nacka-Aleksic, M, Lestarevic, S, and Leposavic, G. CD8+ T cell-mediated mechanisms contribute to the progression of neurocognitive impairment in both multiple sclerosis and Alzheimer’s disease? Front Immunol. (2020) 11:566225. doi: 10.3389/fimmu.2020.566225
64. Veroni, C, and Aloisi, F. The CD8 T cell-epstein-Barr virus-B cell trialogue: a central issue in multiple sclerosis pathogenesis. Front Immunol. (2021) 12:665718. doi: 10.3389/fimmu.2021.665718
65. Cebrian, C, Zucca, FA, Mauri, P, Steinbeck, JA, Studer, L, Scherzer, CR, et al. MHC-I expression renders catecholaminergic neurons susceptible to T-cell-mediated degeneration. Nat Commun. (2014) 5:3633. doi: 10.1038/ncomms4633
66. Fu, Q, Shi, D, Zhou, Y, Zheng, H, Xiang, H, Tian, X, et al. MHC-I promotes apoptosis of GABAergic interneurons in the spinal dorsal horn and contributes to cancer induced bone pain. Exp Neurol. (2016) 286:12–20. doi: 10.1016/j.expneurol.2016.09.002
67. Gonzalez-Forero, D, and Moreno-Lopez, B. Retrograde response in axotomized motoneurons: nitric oxide as a key player in triggering reversion toward a dedifferentiated phenotype. Neuroscience. (2014) 283:138–65. doi: 10.1016/j.neuroscience.2014.08.021
68. Medana, IM, Gallimore, A, Oxenius, A, Martinic, MM, Wekerle, H, and Neumann, H. MHC class I-restricted killing of neurons by virus-specific CD8+ T lymphocytes is effected through the Fas/Fas L, but not the perforin pathway. Eur J Immunol. (2000) 30:3623–33. doi: 10.1002/1521-4141(200012)30:12<3623::AID-IMMU3623>3.0.CO;2-F
69. Gandhi, R, Laroni, A, and Weiner, HL. Role of the innate immune system in the pathogenesis of multiple sclerosis. J Neuroimmunol. (2010) 221:7–14. doi: 10.1016/j.jneuroim.2009.10.015
70. Konjevic Sabolek, M, Held, K, Beltran, E, Niedl, AG, Meinl, E, Hohlfeld, R, et al. Communication of CD8+ T cells with mononuclear phagocytes in multiple sclerosis. Ann Clin Transl Neurol. (2019) 6:1151–64. doi: 10.1002/acn3.783
71. Salou, M, Nicol, B, Garcia, A, and Laplaud, DA. Involvement of CD8+ T cells in multiple sclerosis. Front Immunol. (2015) 6:604. doi: 10.3389/fimmu.2015.00604
72. Davies, A, Lopez-Briones, S, Ong, H, O'Neil-Marshall, C, Lemonnier, FA, Nagaraju, K, et al. Infection-induced expansion of a MHC class Ib-dependent intestinal intraepithelial gammadelta T cell subset. J Immunol. (2004) 172:6828–37. doi: 10.4049/jimmunol.172.11.6828
73. Sarantopoulos, S, Lu, L, and Cantor, H. Qa-1 restriction of CD8+ suppressor T cells. J Clin Invest. (2004) 114:1218–21. doi: 10.1172/JCI23152
74. van Hall, T, Oliveira, CC, Joosten, SA, and Ottenhoff, TH. The other Janus face of Qa-1 and HLA-E: diverse peptide repertoires in times of stress. Microbes Infect. (2010) 12:910–8. doi: 10.1016/j.micinf.2010.07.011
75. Williams, AP, Peh, CA, Purcell, AW, McCluskey, J, and Elliott, T. Optimization of the MHC class I peptide cargo is dependent on tapasin. Immunity. (2002) 16:509–20. doi: 10.1016/s1074-7613(02)00304-7
76. Mockus, TE, Munie, A, Atkinson, JR, and Segal, BM. Encephalitogenic and regulatory CD8 T cells in multiple sclerosis and its animal models. J Immunol. (2021) 206:3–10. doi: 10.4049/jimmunol.2000797
77. Sinha, S, Boyden, AW, Itani, FR, Crawford, MP, and Karandikar, NJ. CD8+ T-cells as immune regulators of multiple sclerosis. Front Immunol. (2015) 6:619. doi: 10.3389/fimmu.2015.00619
78. Elliott, JM, and Yokoyama, WM. Unifying concepts of MHC-dependent natural killer cell education. Trends Immunol. (2011) 32:364–72. doi: 10.1016/j.it.2011.06.001
79. Goddery, EN, Fain, CE, Lipovsky, CG, Ayasoufi, K, Yokanovich, LT, Malo, CS, et al. Microglia and perivascular macrophages act as antigen presenting cells to promote CD8 T cell infiltration of the brain. Front Immunol. (2021) 12:726421. doi: 10.3389/fimmu.2021.726421
80. Sutter, PA, and Crocker, SJ. Glia as antigen-presenting cells in the central nervous system. Curr Opin Neurobiol. (2022) 77:102646. doi: 10.1016/j.conb.2022.102646
Keywords: experimental autoimmune encephalomyelitis, ursolic acid, MHC-I antigen presentation pathway, TAPBP, H2-T23
Citation: Wang M, Gu C, Yang Y, Chen L, Chen K, Du J, Wu H and Li Y (2023) Ursolic acid derivative UAOS-Na treats experimental autoimmune encephalomyelitis by immunoregulation and protecting myelin. Front. Neurol. 14:1269862. doi: 10.3389/fneur.2023.1269862
Edited by:
Carmen Espejo, Vall d’Hebron Research Institute (VHIR), SpainReviewed by:
Alerie Guzman De La Fuente, Queen’s University Belfast, United KingdomCopyright © 2023 Wang, Gu, Yang, Chen, Chen, Du, Wu and Li. This is an open-access article distributed under the terms of the Creative Commons Attribution License (CC BY). The use, distribution or reproduction in other forums is permitted, provided the original author(s) and the copyright owner(s) are credited and that the original publication in this journal is cited, in accordance with accepted academic practice. No use, distribution or reproduction is permitted which does not comply with these terms.
*Correspondence: Jun Du, ZXJpYy5kdUBhbXdheS5jb20=; Huali Wu, d3U1MjU0MzA3QDE2My5jb20=; Yiming Li, eW1saXVzQDE2My5jb20=
Disclaimer: All claims expressed in this article are solely those of the authors and do not necessarily represent those of their affiliated organizations, or those of the publisher, the editors and the reviewers. Any product that may be evaluated in this article or claim that may be made by its manufacturer is not guaranteed or endorsed by the publisher.
Research integrity at Frontiers
Learn more about the work of our research integrity team to safeguard the quality of each article we publish.