
95% of researchers rate our articles as excellent or good
Learn more about the work of our research integrity team to safeguard the quality of each article we publish.
Find out more
ORIGINAL RESEARCH article
Front. Neurol. , 20 December 2023
Sec. Neurological Biomarkers
Volume 14 - 2023 | https://doi.org/10.3389/fneur.2023.1242317
 Yaxuan Wei1,2,3†Ying Hao4†Yuanming Li2†Meiling Dan5Zhiqi Yang1,2Huihui Qiu2,6Rong Li1,3Rong Yin2*
 Pengcheng Fan7,8*
Japanese encephalitis (JE) is a severe infectious disease affecting the central nervous system (CNS). However, limited risk factors have been identified for predicting poor prognosis (PP) in adults with severe JE. In this study, we analyzed clinical data from thirty-eight severe adult JE patients and compared them to thirty-three patients without organic CNS disease. Machine learning techniques employing branch-and-bound algorithms were used to identify clinical risk factors. Based on clinical outcomes, patients were categorized into two groups: the PP group (mRs ≥ 3) and the good prognosis (GP) group (mRs ≤ 2) at three months post-discharge. We found that the neutrophil-to-lymphocyte ratio (NLR) and the percentage of neutrophilic count (N%) were significantly higher in the PP group compared to the GP group. Conversely, the percentage of lymphocyte count (L%) was significantly lower in the PP group. Additionally, elevated levels of aspartate aminotransferase (AST) and blood glucose were observed in the PP group compared to the GP group. The clinical parameters most strongly correlated with prognosis, as indicated by Pearson correlation coefficient (PCC), were NLR (PCC 0.45) and blood glucose (PCC 0.45). In summary, our findings indicate that increased serum NLR, N%, decreased L%, abnormal glucose metabolism, and liver function impairment are risk factors associated with poor prognosis in severe adult JE patients.
Japanese encephalitis (JE) is a severe form of viral encephalitis characterized by acute inflammation of the central nervous system, primarily caused by the Japanese Encephalitis Virus (JEV) (1). Although the development of JE occurs in only a small percentage of JEV-infected individuals (0.1–1%), it still poses a significant public health burden, with approximately 68,000 to 96,000 reported cases and 15,000 deaths worldwide each year (2, 3). Among severe JE cases with neurological dysfunction, the fatality rate can reach 20–52%, and neurological sequelae have been reported in 44–60% of patients (2). Furthermore, nearly 50% of JE patients continue to experience neurological sequelae even 1 year after hospital discharge (4). Conducting clinical studies with large sample sizes is challenging due to the regional and seasonal incidence patterns of JE.
To date, limited information is available regarding the risk factors associated with poor prognosis in severe adult JE cases. The Japanese Encephalitis Virus can directly induce neuronal damage, and the resulting inflammation can exacerbate this effect (5). Previous studies have indicated a correlation between the innate immune response and fatal outcomes in flavivirus infections (6). However, the major risk factors contributing to poor prognosis in JE infections remain unclear. Our previous research focused on analyzing proteome profiling changes in the cerebrospinal fluid (CSF) of severe adult JE patients, identifying a subgroup with lower survival rates and a higher risk of cognitive impairment (7). Identifying key factors associated with poor prognosis through clinical indicators is an ongoing research topic in JE.
In the past, the lack of extensive samples and high-quality clinical studies has hindered a clear understanding of the specific clinical indicators associated with adult JE. The onset and progression of adult JE are characterized by rapidity, while the prognosis remains unfavorable. How to utilize commonly employed clinical indicators for early prediction of unfavorable prognosis, thereby enabling prompt implementation of targeted therapeutic interventions such as early tracheotomy and mechanical ventilation, holds the potential to significantly mitigate both mortality and disability rates.
Machine learning has emerged as a valuable tool in investigating clinical risk factors. Branch and bound algorithms, specifically designed for logistic regression analysis using R script packages, are commonly employed for analyzing large-scale biomedical data (8). The present study aims to employ machine learning techniques and statistical analysis tools to identify risk factors for poor prognosis in severe adult JE patients using extensive clinical data. By leveraging these advanced analytical approaches, we seek to gain valuable insights into the prognosis of severe JE and contribute to the understanding and management of this debilitating disease. To the best of our knowledge, this study represents the pioneering application of machine learning in analyzing risk factors associated with unfavorable outcomes in adults affected by JE.
The study received approval from the Ethics Committee of Lanzhou General Hospital prior to initiation (2017XYLL050) and utilized data from the Chinese Clinical Trial Registration Study (ChiCTR2000030499). The participants were admitted to the hospital between July 2017 and December 2019. A total of thirty-eight patients diagnosed with JE during the acute stage of encephalitis were included in the study. These JE cases were reported to the Gansu Sub-center of the Center for Disease Control in China. As a control group, thirty-three patients who were hospitalized in the neurology department during the same period but excluded from having organic disease of the central nervous system (CNS) were enrolled. Machine learning analysis utilizing branch-and-bound algorithms was employed to select clinical risk factors from the data of JE patients and the control group. The criteria for defining JE were based on the World Health Organization recommendations (9), requiring the presence of clinical criteria for acute encephalitis syndrome and satisfying at least one of the following: detectable JE-specific IgM in the cerebrospinal fluid (CSF) or serum, evidence of seroconversion or a fourfold increase in IgM or IgG during the convalescence phase as detected by ELISA, isolation of the virus from blood, CSF fluid, or tissue, or detection of the JE virus genome in the serum, plasma, blood, CSF, or tissue. Information extracted from the database included demographic baseline data, vital signs, clinical symptoms, positive signs, endotracheal intubation or tracheotomy, complications and comorbidities, blood and CSF laboratory indicators, Glasgow Coma Score (GCS), Mini-Mental State Examination (MMSE) at discharge, and modified Rankin Scale (mRS) scores collected 3 months after discharge.
The selection of risk factors was conducted through logistic regression, combining best subset selection and cross-validation approaches for model selection (Supplementary Figure S1). A total of 45 clinical test results were collected to perform statistic analysis. Among them, 26 major clinical test results with statistic significant difference between 38 good and poor prognosis patients of JE were chosen as input factors. These included 4 CSF test results (RBC count, WBC count in CSF, Platelet Count, and pressure) and 22 blood test results (WBC, total protein, RBC, blood glucose, Cl, WBC in blood, percentage of neutrophilic count (N%), percentage of lymphocyte count (L%), percentage of monocyte (M%), hemoglobin, hematocrit, Platelet Count, lactate dehydrogenase, aspartate transaminase, alanine transaminase, gamma-glutamyl transferase, K+, Na+, Cl−, blood urea nitrogen, and creatinine). Branch-and-bound algorithms were implemented using the R script package “bestglm” which represents Best Subset GLM. The analysis utilized Bayesian Information Criterion with Bernoulli prior (“BICq”) as the information criteria.
Patients with JE were grouped according to the WS214-2008 Diagnostic Criteria for JE (10). All patients included in the study were classified as severe or critically ill. Prognosis-based categorization was performed 3 months after discharge, considering mRS ≤ 2 as the good prognosis group (GP) (n = 29) and mRS ≥ 3 as the poor prognosis group (PP) (n = 9).
Continuous variables were expressed as mean (standard deviation) for normally distributed data and median (interquartile range [IQR]) for non-normally distributed data. One-way ANOVA test was conducted for data that adheres to a normal distribution. Non-parametric test (Wilcoxon rank-sum test) was performed for data that did not conform to a normal distribution. Enumeration data was presented as percentages and analyzed by the Chi-square test. A two-sided p-value of less than 0.05 was considered statistically significant. Data analysis and visualization were performed using R version 4.1.3. Principal component analysis (PCA) was employed to visualize the distribution of clinical characteristics in the two groups of JE patients (GP and PP) (11). The PCA analysis utilized packages such as “ggplot2”, “FactoMineR”, and “factoextra”. Correlation coefficient analysis between prognosis subtypes and clinical features was conducted using the R package “ggcorr”, and the results were visualized using “corrplot.mixed” (12).
Through the machine learning analysis using the R script, six major significantly risky factors were identified (p < 0.05) for distinguishing between the control group and patients with JE. These factors included WBC in CSF, total protein, N%, L%, RBC, and Cl− concentration in blood. Changes in WBC in CSF and total protein in blood are commonly associated with viral infections. The significant changes in N% and L% are consistent with a previous proteomics study, which reported decreased levels of L%, M%, and increased levels of complement components as potential clinical markers for poor prognosis in JE (7). The statistical analysis based on mRS results further validated the significant changes in N% and L% in blood as indicators for the prognosis of JE.
A total of 38 severe adult patients with JE who were hospitalized were included in the analysis. The demographic and clinical characteristics of these patients are summarized in Table 1. The average age was 51.26 years (range: 35 to 65), and 24 patients (63.2%) were male. The most common signs and symptoms observed were fever (38/38, 100%), positive meningeal stimulation (31/38, 81.6%), disturbance of consciousness (30/38, 78.9%), headache (26/38, 68.4%), and mental symptoms (24/38, 63.2%). Among the patients, nine had a poor prognosis (mRs ≥ 3), including five deaths (mRs = 6), two with mRs = 3, and two with mRs = 4. All nine patients in the poor prognosis group exhibited disturbance of consciousness, and 7/9 (77.8%) required respiratory support and tracheal intubation. The Glasgow Coma Score (GCS) was significantly lower in the poor prognosis group compared to the good prognosis group (5.67 vs. 10.66, p = 0.001). A total of 25/38 cases (65.8%) were associated with pulmonary infection, and the ratio of pneumonia in the poor prognosis group was higher than that in the good prognosis group (88.9% vs. 58.6%, p = 0.126).
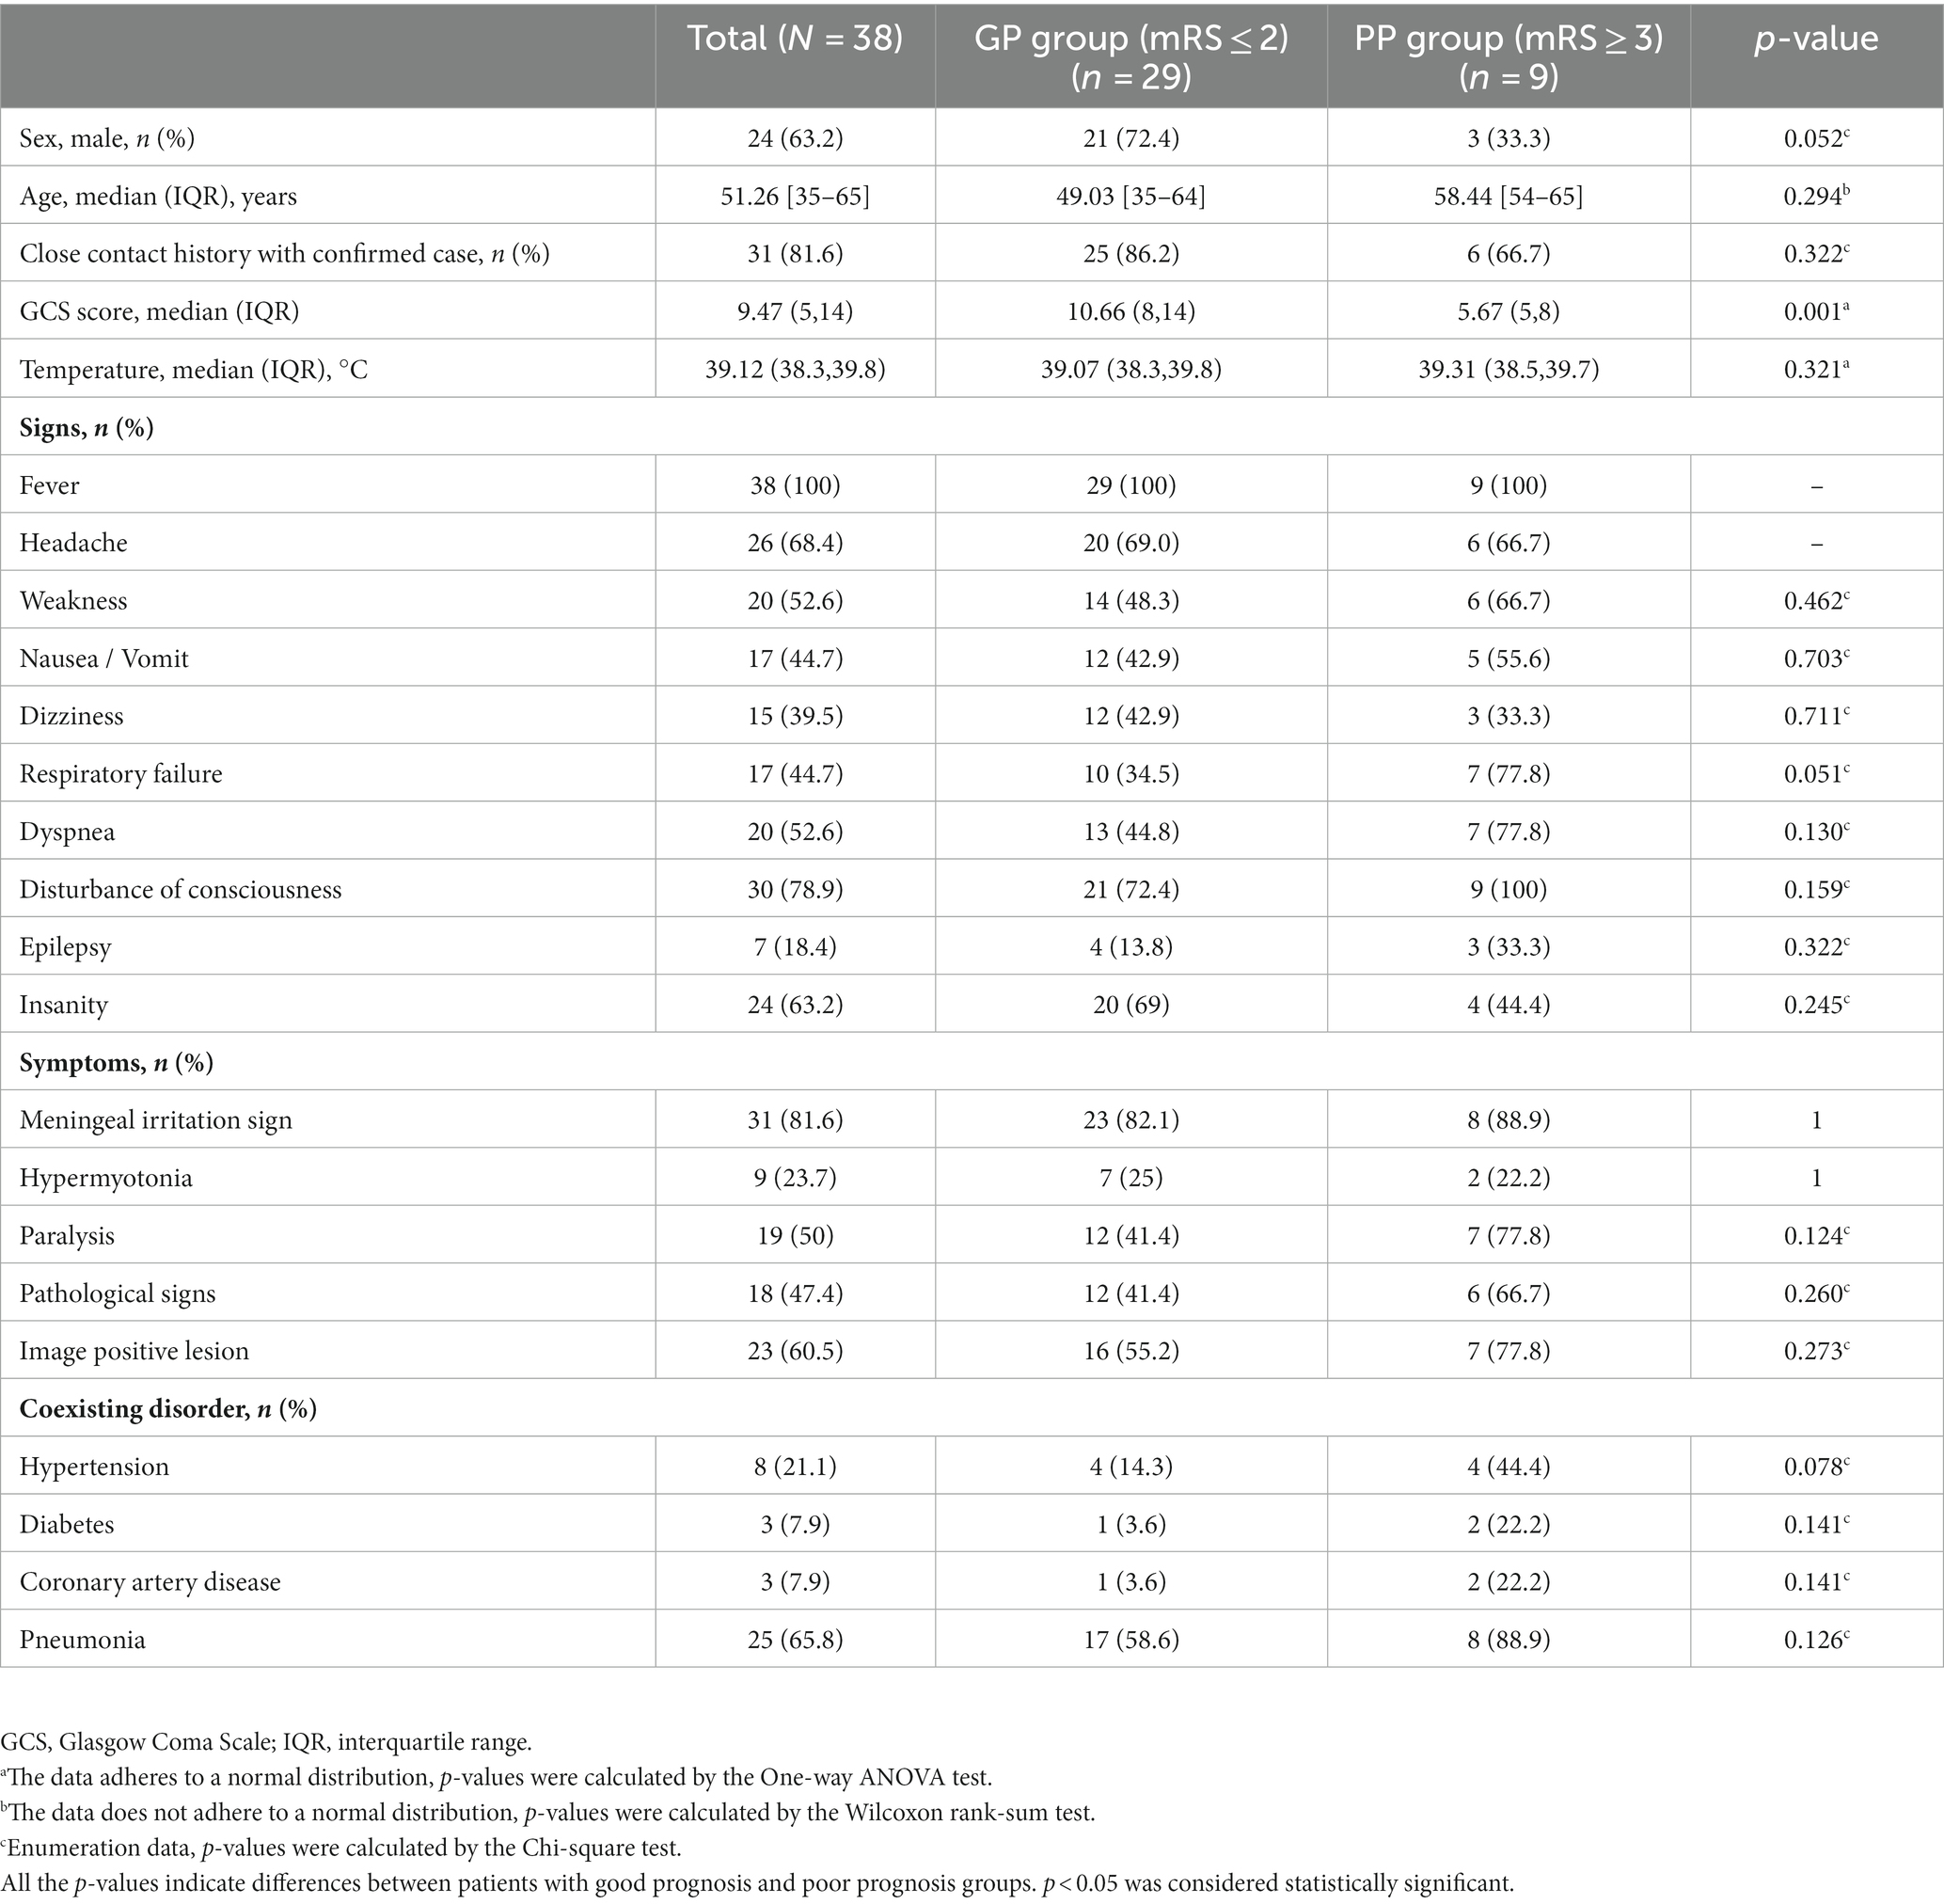
Table 1. Clinical characteristics of patients of JE grouped according to clinical outcome.
The laboratory results are presented in Table 2. The N% in the poor prognosis group (86.70% [IQR, 84.4–88.4%]) was significantly higher than that in the good prognosis group (81.50% [IQR, 77.5–84.3%]) (p = 0.01). The L% in the poor prognosis group (8.00% [IQR, 5.30–9.70%]) was significantly lower than that in the good prognosis group (11.10% [IQR, 9.50–14.90%]) (p = 0.032). The neutrophil-to-lymphocyte ratio (NLR) in the poor prognosis group (10.84 [8.06–17.58]) was significantly higher than that in the good prognosis group (7.11 [5.24–8.74]) (p = 0.01). CSF tests were performed on all 38 patients, and three cases had CSF WBC counts greater than 500 × 106/L, while one case had a CSF WBC count greater than 1,000 × 106/L. The latter patient was also diagnosed with suppurative meningitis and Kawasaki disease.
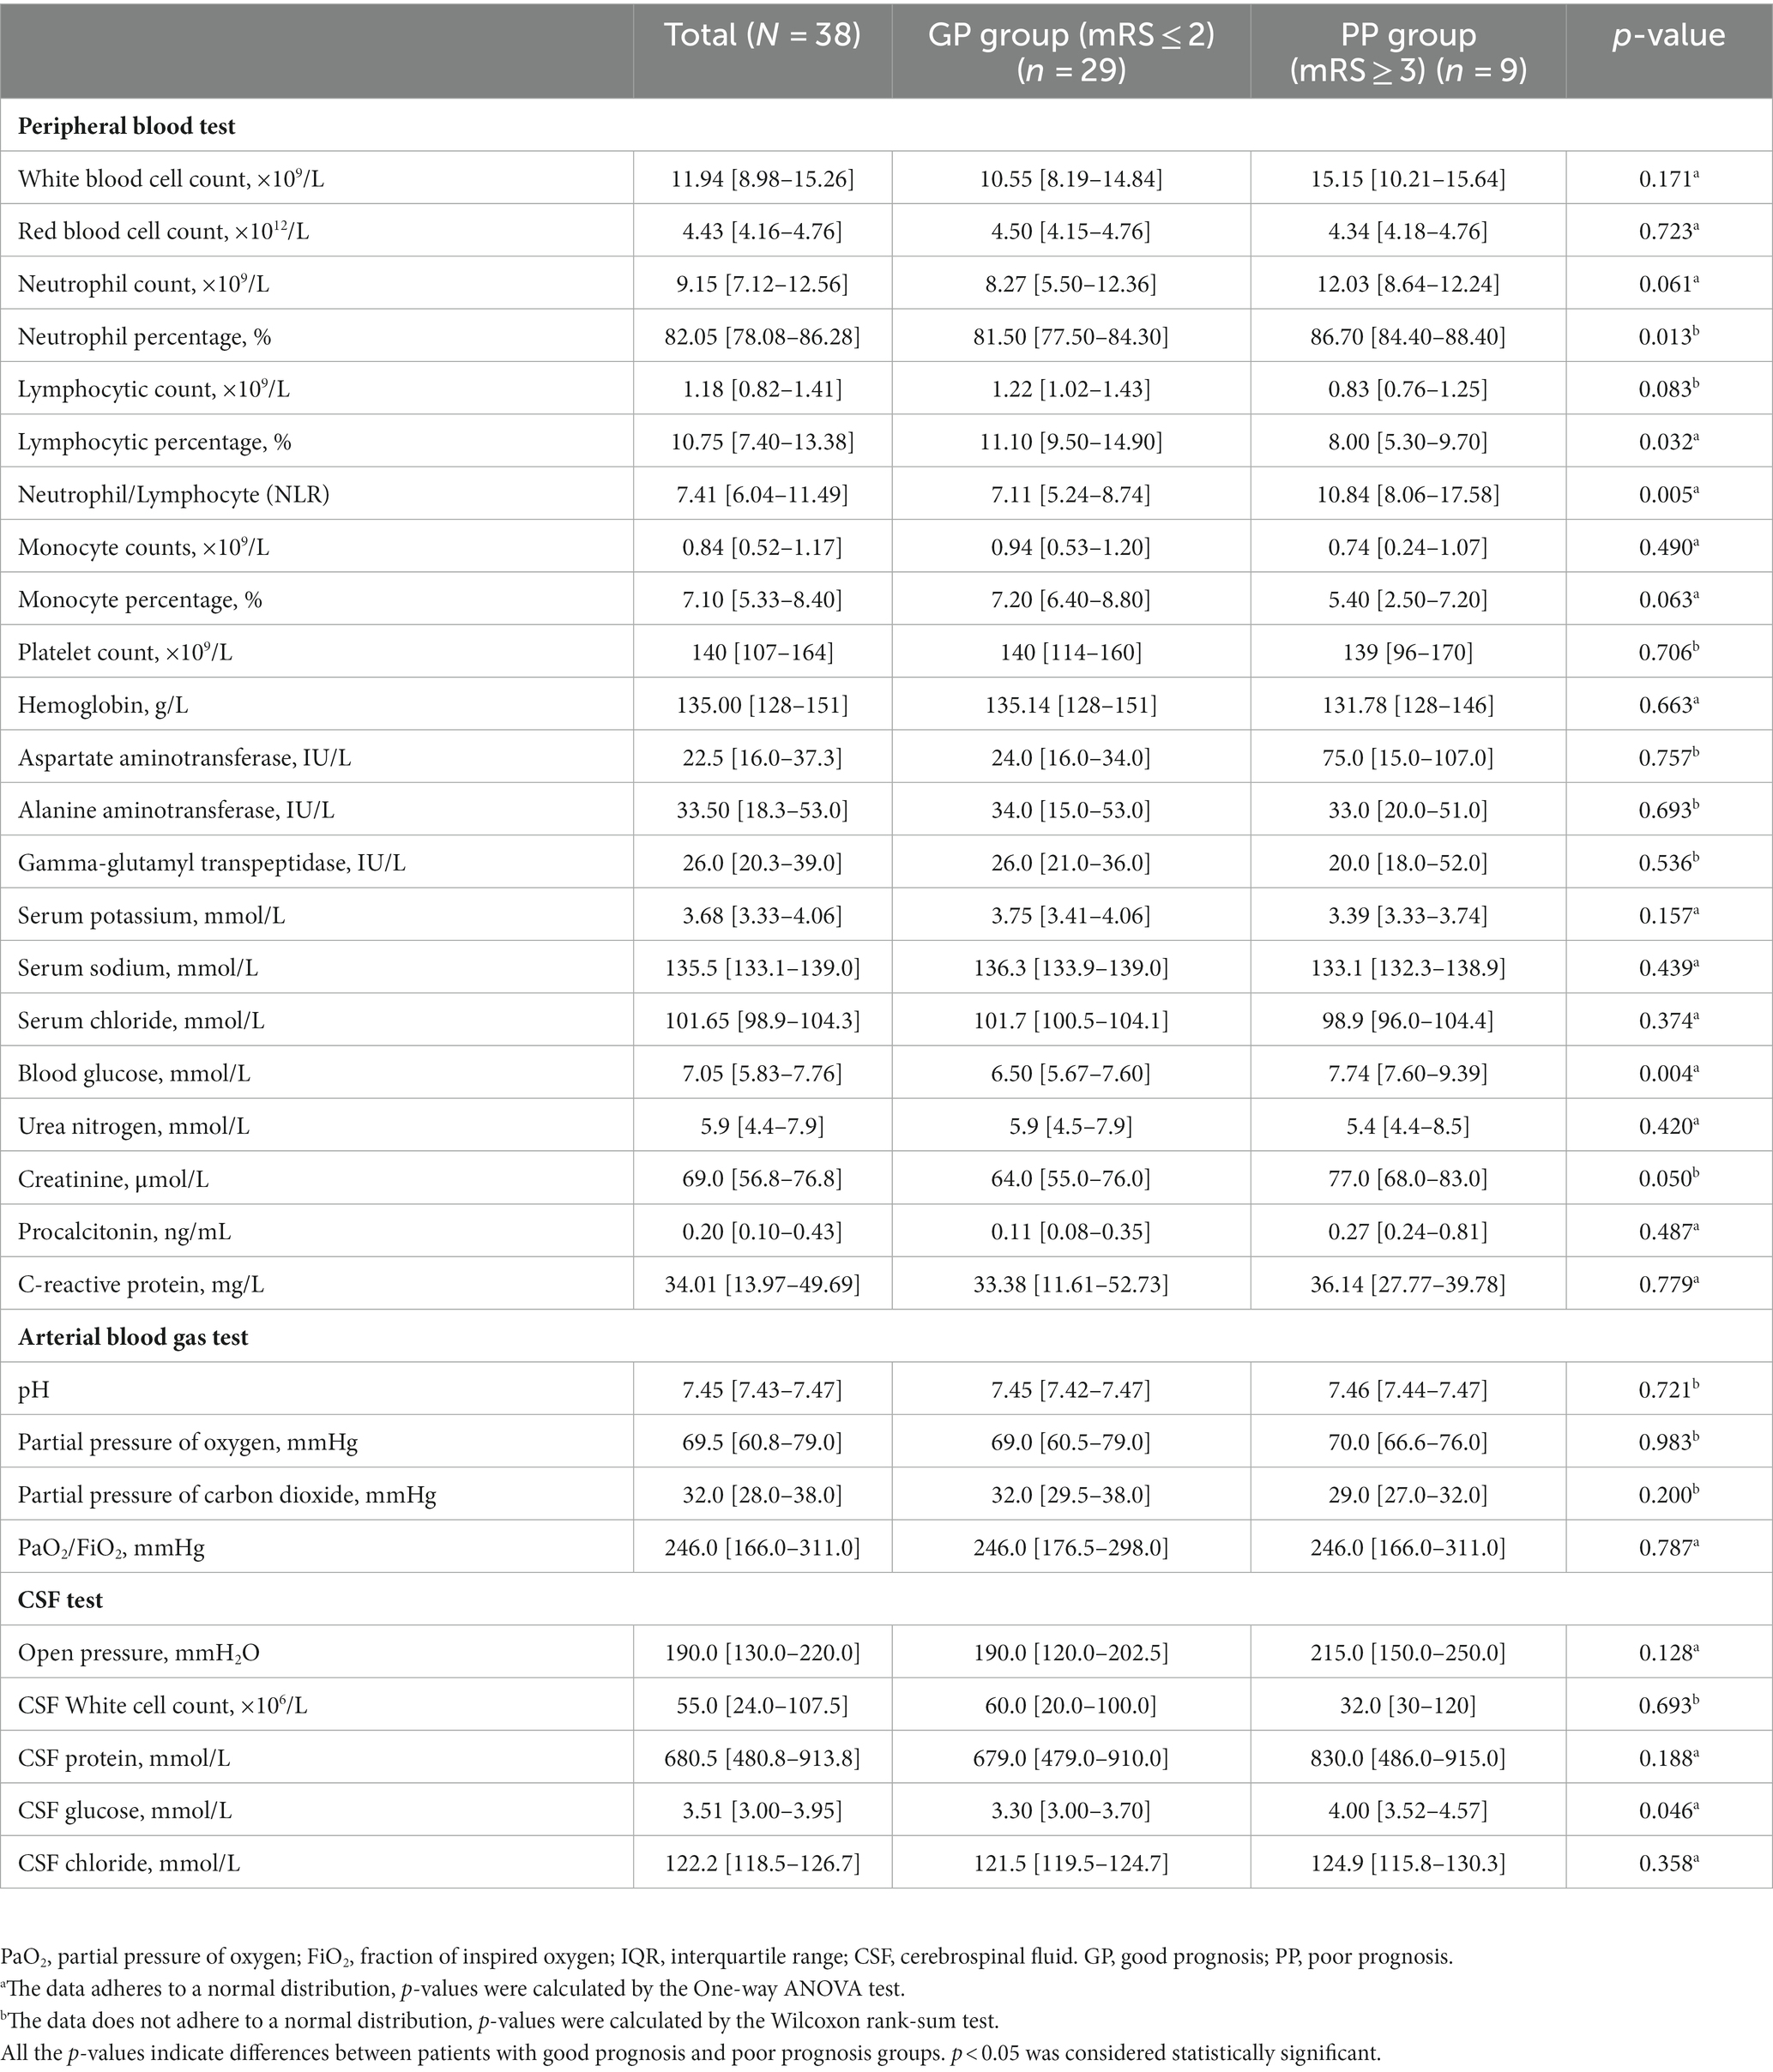
Table 2. Laboratory findings of patients with JE grouped according to the clinical outcome (median [IQR]).
To further validate the subgrouping results, PCA was employed to analyze the distribution of the two groups (GP and PP) based on their clinical characteristics. The results are presented in Figure 1. The PCA score plot demonstrated distinct clusters for patients with JE in the GP subgroup (blank) and the PP subgroup (red), indicating a differentiation based on clinical and laboratory features. Data from GP and PP was divided into two clusters by PCA (Figure 1). These results indicated that patients with poor prognosis could be distinguished from good prognosis through machine learning.
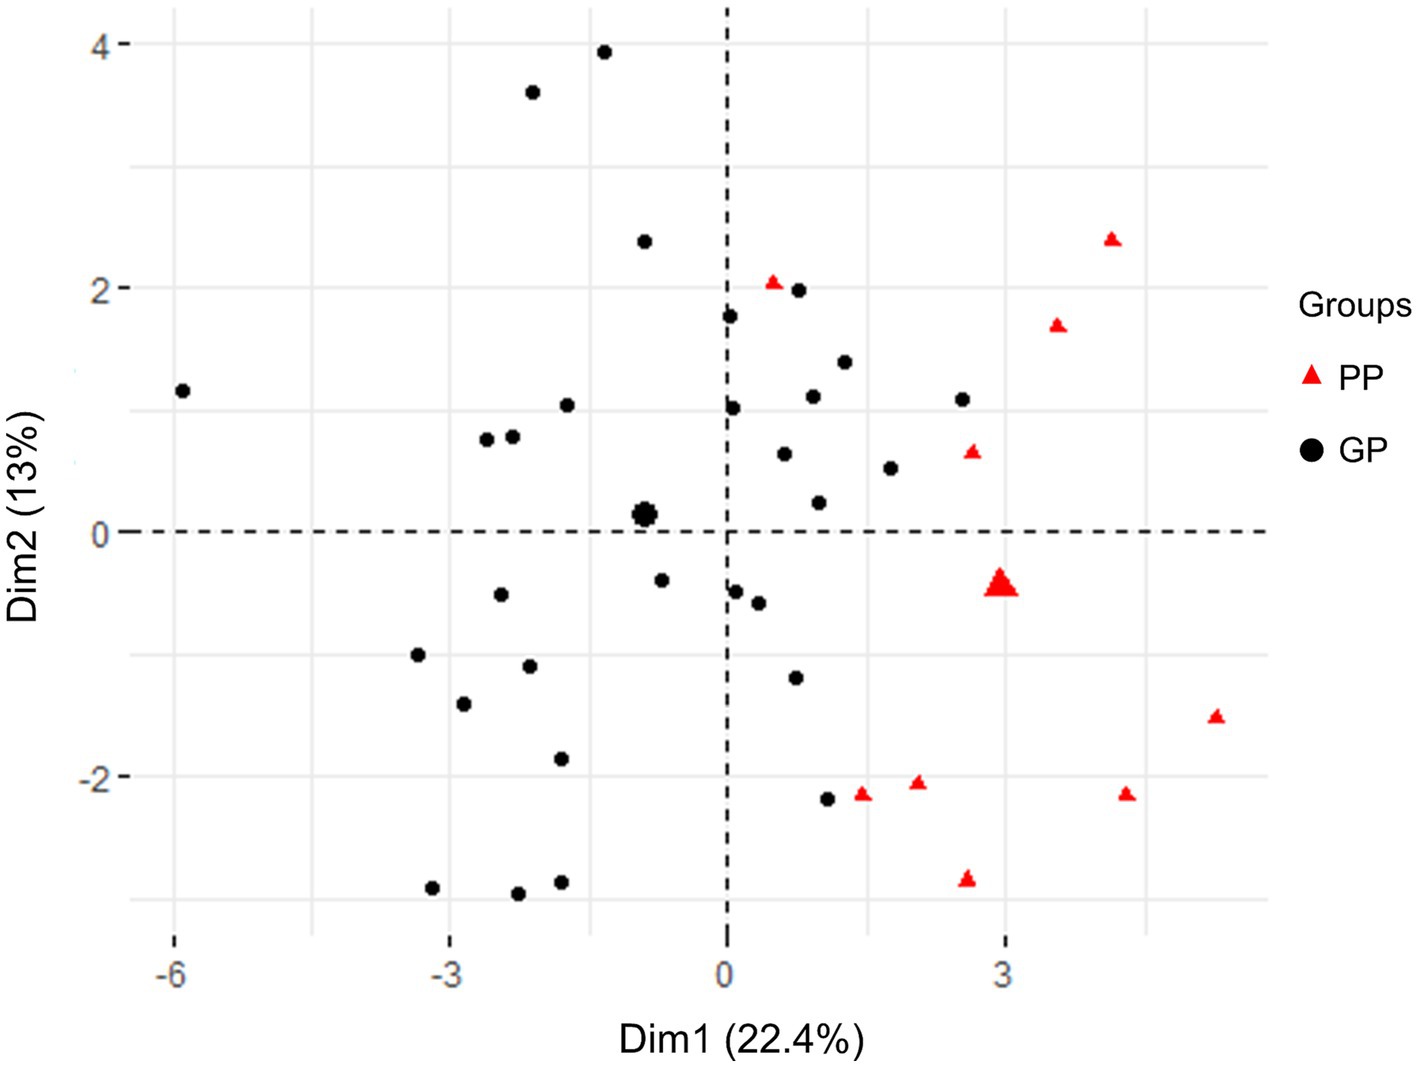
Figure 1. PCA score plot in all patients with JE based on clinical testing characteristics and clinical outcomes. The plots in GP (blank) and PP (red) group were apart from each other and could be easily differentiated. All plots within the group were clustered together, respectively.
Correlation analysis was conducted to assess the relationship between clinical parameters and the prognosis of JE. The Pearson correlation coefficient (PCC) was calculated to determine the strength and direction of the correlations. The results revealed several clinical parameters that exhibited significant correlations with prognosis. The most closely related clinical parameters were GLU (PCC 0.45), NLR (PCC 0.45), N% (PCC 0.41), AST (PCC 0.37), respiratory failure (PCC 0.37), and L% (PCC −0.35), as depicted in Figure 2. These findings suggest that these parameters may serve as potential indicators for predicting the prognosis of JE.
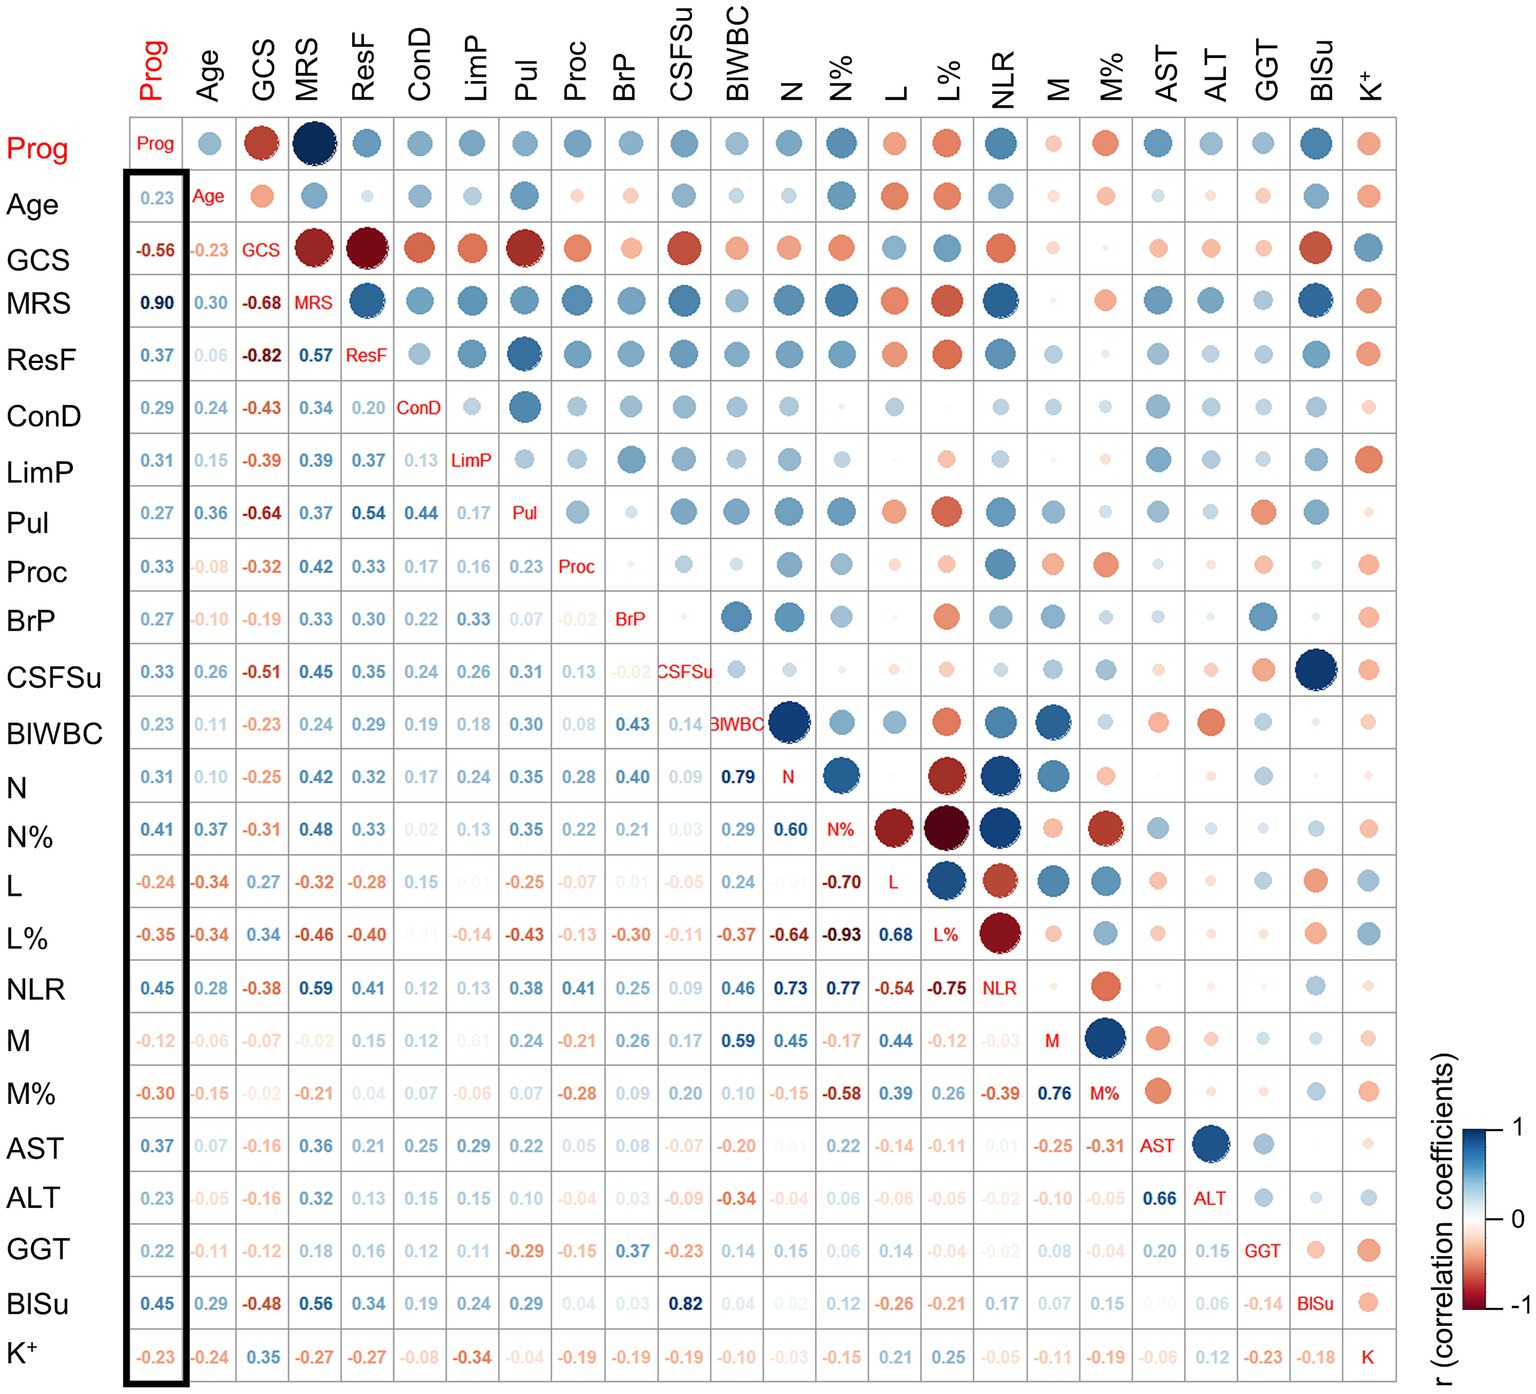
Figure 2. The correlation coefficient analysis for the selection of key clinical factors. The cut-off for clinical factors selection: p (PP vs. GP) ≤ 0.2. ResF, respiratory failure; ConD, consciousness disorder; LimP, limb paralysis; Pul, pulmonary infection; Proc, procalcitonin; BrP, open pressure for the brain; CSFSu, sugar in cerebrospinal fluid; BlWBC, blood WBC; N, neutrophils; N%, percentage of neutrophils; L, lymphocyte; L%, percentage of lymphocytes; M, monocyte; M%, percentage of monocyte; AST, the aspartate aminotransferase; ALT, the alanine aminotransferase; GGT, the gamma-glutamyl transferase; BlSu, blood sugar; K, potassium; Prog, prognosis; PP, poor prognosis; GP, good prognosis.
Overall, the machine learning analysis identified significant risk factors for distinguishing between the control group and patients with JE. The clinical characteristics and laboratory results of the JE subgroup provided valuable insights into the prognosis of the disease. Furthermore, the PCA and correlation coefficient analysis further supported the differentiation of subgroups based on clinical and laboratory parameters and highlighted the potential predictive value of certain parameters for prognosis assessment in patient with JE.
JE is a significant infectious disease that poses a serious threat to human health. Studies conducted in South Korea have reported a notable increase in the proportion of adults affected by JE in recent years (13). Additionally, a retrospective study spanning over 15 years in Gansu, China, found distinct clinical manifestations between children and adults (14). Children with JE commonly present with symptoms such as vomiting, irritability, hypersomnia, convulsions, and spasms. On the other hand, adults experience symptoms such as changes in blood pressure, pupil size, positive meningeal stimulation signs, and positive pathological reflexes (hypertonia and Babinski sign). These findings suggest that adults tend to exhibit more severe clinical manifestations and higher mortality rates. The differences in manifestations may be attributed to the absence of JE vaccination during childhood or the higher average age of onset (13). Therefore, it is crucial to identify risk factors for poor prognosis in adult patients with JE and develop personalized treatment plans that can provide more effective supportive care based on different subpopulations.
In our study, all patients presented with fever, and some also experienced symptoms such as headache, nausea, vomiting, and other manifestations of high cranial pressure. Consciousness and mental symptoms were prevalent among the patients. The machine learning analysis identified WBC in CSF, total protein in CSF, N%, L%, RBC in blood, and Cl− as the key factors associated with JEV infection. Furthermore, the correlation coefficient analysis, using the clinical prognosis (mRS) as a grouping variable, revealed that increased NLR, N%, and decreased L% were risk factors associated with the clinical outcome of JE. Abnormal glucose metabolism and liver function were also closely associated with poor prognosis in JE. Additionally, the proportion of lung infections was higher in the poor prognosis group.
Our findings align with previous research, which demonstrated an increase in WBC, N%, and CSF WBC in severe JEV infection (15). JEV induces an inflammatory response characterized by the accumulation of various immune cells around the spleen, lymph nodes, and in the blood. This leads to increased WBC and neutrophil counts in the peripheral blood (16). Viral infections often result in increased lymphocyte counts, with or without elevated WBC levels. The potential pathogenesis underlying these observations involves nervous stress response, tissue damage response, immune response disorder, and secondary or mixed bacterial infections (2, 15, 16). In our study, 65.8% of the patients had lung infections, which may explain the increased percentage of WBC and neutrophils. Specifically, the poor prognosis group exhibited lower GCS scores, more severe disturbance of consciousness, and a higher likelihood of ventilator-associated pneumonia following tracheal intubation. Although WBC levels were outside the normal range, no statistically significant difference was observed between the poor prognosis and good prognosis groups. There were no significant differences in electrolyte, metabolite, and blood gas analysis between the two groups. Apart from bacterial infection, the increase in N% may be attributed to excessive cellular immune defense.
The correlation coefficient analysis demonstrated opposite trends in N% and L% with regard to prognosis. Increased NLR, N%, or decreased L% indicated a potential poor prognosis for patients with JE. These immunological findings highlight the important role of the innate immune system in the recovery from JEV infection. Previous research has reported elevated levels of certain components that are associated with the prognosis of JEV infection (7). Neutrophils express IgG Fc receptors, complement C3b, and C5a receptors on their surface. The upregulation of complement levels in the CSF of patients with JE may impact chemotaxis, thereby promoting and enhancing neutrophil phagocytosis. However, chemotaxis and excessive activation of neutrophils can be detrimental to the recovery from JEV infection. The overall condition of patients also plays a significant role in the prognosis of the disease, with liver function and glucose metabolism contributing to the impairment (17).
Once the virus enters the central nervous system, uncontrolled viral proliferation may occur (2). Proinflammatory cytokines can trigger immune cell infiltration and clearance of infectious viral factors. However, an excess of proinflammatory cytokines can lead to tissue damage and systemic inflammation (18). Previous studies have demonstrated that JEV infection, especially after the virus enters the CNS through the blood–brain barrier, triggers unrestricted viral proliferation, leading to a series of inflammatory reactions and activation of the systemic immune response (19). Overactivation of inflammatory cells can result in severe cytokine storms and tissue damage (20). This may explain why increased N% is a risk factor for poor prognosis in JE. Therefore, future treatments for severe JE may focus on regulating the innate immune response induced by the JE virus within a specific range, maintaining antiviral function while avoiding excessive inflammatory reactions.
Currently, two articles on the subject of JE and machine learning were reported, including one of our previous research. In a study performed by Tehmina et al., deep proteomic networks and machine learning techniques were employed to investigate the hypothesis regarding the presence of JE diagnostic protein signatures. However, it is worth noting that this study compared the CSF proteomics result from JE samples with other CNS infection patients, but without incorporating an appropriate control group. It is important to consider that patients with various infections, including those caused by other flaviviruses, may exhibit similar CSF protein expression patterns.
Machine learning by stepwise algorithm is to automatically discover the major influential factors. Stepwise regression is useful when dealing with a large number of potential predictor variables. It automates the process of variable selection by sequentially adding or removing variables based on their statistical significance, which can be more efficient than manual selection (21). There are also some challenges existing in the stepwise method, one of the issues is that the remaining coefficients may be biased and need shrinkage. After each variable addition or deletion step, an evaluation metric is used to assess whether that step impacted fit. Giving primacy to individual fit, as is done with p-values and R2, when group fit may be the larger concern, can lead to misguided decision making (22). As the potential limitation of stepwise regression, we do statistical analysis first for the clinical results and input the clinical variables with significant differences, which helps to select the risky factor though the regression.
Despite the valuable findings of our study, several limitations should be acknowledged. Firstly, this was a single-center retrospective cohort study with a limited sample size. The inclusion of only severe cases and the absence of mild cases may introduce bias in the results. Secondly, the study lacked a comparison between severe and mild cases, which could have provided further insights. Lastly, there was a high proportion of patients lost to long-term follow-up, resulting in a lack of long-term prognostic outcomes.
The study identified significant risk factors associated with poor prognosis in adult patients with JE. These factors include WBC in CSF, total protein in CSF, N%, L%, RBC in blood, and Cl−. Correlation analysis further confirmed the association of increased NLR, N%, and decreased L% with adverse clinical outcomes. Additionally, abnormal glucose metabolism, liver function impairment, and a higher proportion of lung infections were observed in the poor prognosis group. The innate immune response appears to play a crucial role in the recovery from JEV infection, and maintaining a balanced immune response is crucial. Further research, including larger and prospective studies, is warranted to validate these findings and explore potential targeted therapies for severe JE.
In summary, our findings suggest that elevated serum NLR, N%, decreased L%, abnormal glucose metabolism, and liver function impairment may serve as potential prognostic indicators for severe adult patients with JE. However, further confirmation is required through prospective, multicenter randomized controlled trials with larger sample sizes. Additionally, conducting basic mechanisms research would provide deeper insights into these associations.
The original contributions presented in the study are included in the article/Supplementary material, further inquiries can be directed to the corresponding authors.
The studies involving humans were approved by the Ethics Committee of Lanzhou General Hospital. The studies were conducted in accordance with the local legislation and institutional requirements. The participants provided their written informed consent to participate in this study.
PF, YH, YW, YH, and YL: conceptualization. YW, YL, MD, and HQ: data curation. YH, MD, and RL: formal analysis. YW, YH, YL, ZY, HQ, and RL: methodology. RY, PF, and YW: supervision. PF, YH, and MD: visualization. YW and MD: writing – original draft. RY and PF: writing – review and editing. All authors contributed to the article and approved the submitted version.
This work was supported by Biosafety Project Foundation (no. 19SWAQ13), Natural Science Foundation of Gansu Province (no. 22JR5RA720), Gansu Province High-end Expert Introduction Plan (no. 22JR10KA008), and Major Research Projects of the Hospital (no. ZDGG-2023-002).
We acknowledge the assistance from the colleagues in Department of Neurology in Lanzhou General Hospital and Gansu Province Central Hospital.
The authors declare that the research was conducted in the absence of any commercial or financial relationships that could be construed as a potential conflict of interest.
All claims expressed in this article are solely those of the authors and do not necessarily represent those of their affiliated organizations, or those of the publisher, the editors and the reviewers. Any product that may be evaluated in this article, or claim that may be made by its manufacturer, is not guaranteed or endorsed by the publisher.
The Supplementary material for this article can be found online at: https://www.frontiersin.org/articles/10.3389/fneur.2023.1242317/full#supplementary-material
1. Griffiths, MJ, Turtle, L, and Solomon, T. Japanese encephalitis virus infection. Handb Clin Neurol. (2014) 123:561–76. doi: 10.1016/B978-0-444-53488-0.00026-2
2. Turtle, L, and Solomon, T. Japanese encephalitis – the prospects for new treatments. Nat Rev Neurol. (2018) 14:298–313. doi: 10.1038/nrneurol.2018.30
3. Campbell, GL, Hills, SL, Fischer, M, Jacobson, JA, Hoke, CH, Hombach, JM, et al. Estimated global incidence of Japanese encephalitis: a systematic review. Bull World Health Organ. (2011) 89:766–74. doi: 10.2471/BLT.10.085233
4. Cheng, Y, Tran Minh, N, Tran Minh, Q, Khandelwal, S, and Clapham, HE. Estimates of Japanese encephalitis mortality and morbidity: a systematic review and modeling analysis. PLoS Negl Trop Dis. (2022) 16:e0010361. doi: 10.1371/journal.pntd.0010361
5. Zhao, G, Gao, Y, Zhang, J, Zhang, H, Xie, C, Nan, F, et al. Toll-like receptor 2 signaling pathway activation contributes to a highly efficient inflammatory response in Japanese encephalitis virus-infected mouse microglial cells by proteomics. Front Microbiol. (2022) 13:989183. doi: 10.3389/fmicb.2022.989183
6. Pan, Y, Cai, W, Cheng, A, Wang, M, Yin, Z, and Jia, R. Flaviviruses: innate immunity, Inflammasome activation, inflammatory cell death, and cytokines. Front Immunol. (2022) 13:829433. doi: 10.3389/fimmu.2022.829433
7. Yin, R, Yang, L, Hao, Y, Yang, Z, Lu, T, Jin, W, et al. Proteomic landscape subtype and clinical prognosis of patients with the cognitive impairment by Japanese encephalitis infection. J Neuroinflammation. (2022) 19:77. doi: 10.1186/s12974-022-02439-5
8. Somol, P, Pudil, P, and Kittler, J. Fast branch & bound algorithms for optimal feature selection. IEEE Trans Pattern Anal Mach Intell. (2004) 26:900–12. doi: 10.1109/TPAMI.2004.28
9. Solomon, T, Thao, TT, Lewthwaite, P, Ooi, MH, Kneen, R, Dung, NM, et al. A cohort study to assess the new WHO Japanese encephalitis surveillance standards. Bull World Health Organ. (2008) 86:178–86. doi: 10.2471/BLT.07.043307
10. Chinese Ministry of Health. (2008). Diagnostic criteria for Japanese encephalitis (WS214-2008). pp. 1–11. Available at: http://www.nhc.gov.cn/ewebeditor/uploadfile/2014/10/20141011154554184.PDF
11. Ringner, M. What is principal component analysis? Nat Biotechnol. (2008) 26:303–4. doi: 10.1038/nbt0308-303
12. Ogluszka, M, Orzechowska, M, Jedroszka, D, Witas, P, and Bednarek, AK. Evaluate Cutpoints: adaptable continuous data distribution system for determining survival in Kaplan-Meier estimator. Comput Methods Prog Biomed. (2019) 177:133–9. doi: 10.1016/j.cmpb.2019.05.023
13. Kwak, BO, Hong, YJ, and Kim, DH. Changes in age-specific seroprevalence of Japanese encephalitis virus and impact of Japanese encephalitis vaccine in Korea. Clin Exp Pediatr. (2022) 65:108–14. doi: 10.3345/cep.2020.01984
14. Li, D, Zhang, X, Shi, T, Jin, N, Zhao, X, Meng, L, et al. A comparison of clinical manifestations of Japanese encephalitis between children and adults in Gansu Province, Northwest China (2005–2020). Acta Trop. (2022) 231:106449. doi: 10.1016/j.actatropica.2022.106449
15. Guo, H, Sun, L, Shen, X, and Hu, W. A retrospective study of the clinical characteristics of Japanese encephalitis in adults. J Integr Neurosci. (2022) 21:125. doi: 10.31083/j.jin2105125
16. Lannes, N, Summerfield, A, and Filgueira, L. Regulation of inflammation in Japanese encephalitis. J Neuroinflammation. (2017) 14:158. doi: 10.1186/s12974-017-0931-5
17. Shah, T, Malhi, M, Kachiwal, AB, Bhutto, B, Shah, QA, Lei, Y, et al. Ameliorative effects of supranutritional selenium on TLR-4-NF-kB-TNF-alpha-mediated hepatic oxidative injury and inflammation in goats fed high concentrate diet. Food Sci Nutr. (2022) 10:3842–54. doi: 10.1002/fsn3.2980
18. Huang, SH, Lien, JC, Chen, CJ, Liu, YC, Wang, CY, Ping, CF, et al. Antiviral activity of a novel compound CW-33 against Japanese encephalitis virus through inhibiting intracellular calcium overload. Int J Mol Sci. (2016) 17:1386. doi: 10.3390/ijms17091386
19. Bergsbaken, T, Fink, SL, and Cookson, BT. Pyroptosis: host cell death and inflammation. Nat Rev Microbiol. (2009) 7:99–109. doi: 10.1038/nrmicro2070
20. Mukherjee, S, Singh, N, Sengupta, N, Fatima, M, Seth, P, Mahadevan, A, et al. Japanese encephalitis virus induces human neural stem/progenitor cell death by elevating GRP78, PHB and hnRNPC through ER stress. Cell Death Dis. (2017) 8:e2556. doi: 10.1038/cddis.2016.394
21. Genell, A, Nemes, S, Steineck, G, and Dickman, PW. Model selection in medical research: a simulation study comparing Bayesian model averaging and stepwise regression. BMC Med Res Methodol. (2010) 10:108. doi: 10.1186/1471-2288-10-108
Keywords: Japanese encephalitis, neutrophil-to-lymphocyte ratio, percentage of neutrophilic, machine learning, cognitive impairment
Citation: Wei Y, Hao Y, Li Y, Dan M, Yang Z, Qiu H, Li R, Yin R and Fan P (2023) Machine learning reveals neutrophil-to-lymphocyte ratio as a crucial prognostic indicator in severe Japanese encephalitis patients. Front. Neurol. 14:1242317. doi: 10.3389/fneur.2023.1242317
Edited by:
Mohendra Roy, Pandit Deendayal Petroleum University, IndiaReviewed by:
Paawan Sharma, Pandit Deendayal Petroleum University, IndiaCopyright © 2023 Wei, Hao, Li, Dan, Yang, Qiu, Li, Yin and Fan. This is an open-access article distributed under the terms of the Creative Commons Attribution License (CC BY). The use, distribution or reproduction in other forums is permitted, provided the original author(s) and the copyright owner(s) are credited and that the original publication in this journal is cited, in accordance with accepted academic practice. No use, distribution or reproduction is permitted which does not comply with these terms.
*Correspondence: Pengcheng Fan, cGhhcm1hcGFwZXJzQGhvdG1haWwuY29t; Rong Yin, eWluX3JvbmdfQDE2My5jb20=
†These authors have contributed equally to this work
Disclaimer: All claims expressed in this article are solely those of the authors and do not necessarily represent those of their affiliated organizations, or those of the publisher, the editors and the reviewers. Any product that may be evaluated in this article or claim that may be made by its manufacturer is not guaranteed or endorsed by the publisher.
Research integrity at Frontiers
Learn more about the work of our research integrity team to safeguard the quality of each article we publish.