 Yadong Yu1†
 Wenchao Qiu
95% of researchers rate our articles as excellent or good
Learn more about the work of our research integrity team to safeguard the quality of each article we publish.
Find out more
ORIGINAL RESEARCH article
Front. Neurol. , 11 May 2023
Sec. Epilepsy
Volume 14 - 2023 | https://doi.org/10.3389/fneur.2023.1135305
Introduction: Childhood absence epilepsy (CAE) is a well-known pediatric epilepsy syndrome. Recent evidence has shown the presence of a disrupted structural brain network in CAE. However, little is known about the rich-club topology. This study aimed to explore the rich-club alterations in CAE and their association with clinical characteristics.
Methods: Diffusion tensor imaging (DTI) datasets were acquired in a sample of 30 CAE patients and 31 healthy controls. A structural network was derived from DTI data for each participant using probabilistic tractography. Then, the rich-club organization was examined, and the network connections were divided into rich-club connections, feeder connections, and local connections.
Results: Our results confirmed a less dense whole-brain structural network in CAE with lower network strength and global efficiency. In addition, the optimal organization of small-worldness was also damaged. A small number of highly connected and central brain regions were identified to form the rich-club organization in both patients and controls. However, patients exhibited a significantly reduced rich-club connectivity, while the other class of feeder and local connections was relatively spared. Moreover, the lower levels of rich-club connectivity strength were statistically correlated with disease duration.
Discussion: Our reports suggest that CAE is characterized by abnormal connectivity concentrated to rich-club organizations and might contribute to understanding the pathophysiological mechanism of CAE.
The human brain is a network. The brain function is not solely attributable to the properties of individual regions or individual connections but rather emerges from the effective communication among regions linked within a complex network of white matter pathways, known as the human connectome (1). Conversely, brain dysfunction may also result from abnormal wiring of the brain's network.
Childhood absence epilepsy (CAE) is defined by the presence of multiple absence seizures in previously healthy developing children without a particular history of neurologic diseases. Typical seizures usually begin between 4 and 10 years of age (2). In the ILAE definition, the typical absence seizure is characterized by sudden cessation of ongoing activities with or without automatisms, usually lasting 30–60 s. The classic electroencephalogram (EEG) shows a generalized symmetrical and synchronous spike-wave discharges (GSWDs) pattern at 3 Hz with normal background activity. It affects 10–17% of all children with epilepsy, making it the most common form of generalized epilepsy syndrome in school-aged children (3). Although labeled “benign,” children with CAE may experience many times daily, including both clinical and subclinical seizures, which can impair memory processing and sustained attention. There is a strong association between CAE and significant cognitive deficits, behavioral disorders, and psychosocial difficulties (4–7). Given the “not so benign nature” of CAE, more attention is needed for this common childhood epileptic syndrome.
Based on some modern research studies (8, 9), the ILAE has recommended epilepsy as a network disease in their latest guidelines (10). Although the absence seizure is classified as a generalized onset, the generalized seizure is traditionally considered as the entire brain may be homogeneously embraced. There is emerging evidence supporting that generalized seizures are not truly generalized but rather rising in some regions and rapidly engaging bilaterally distributed networks containing the original regions (2).
The densely interconnected and central brain regions, so-called hub nodes, play a key role in sustaining efficient communication across the global brain network (11–13). In the cases of possible disruptions of information integration in epilepsy, the hub nodes may be of particular interest because hub regions have been suggested to be more vulnerable than non-hub regions in many brain disorders (14, 15). In the human brain, network hubs show higher connectivity with each other, beyond what would be expected based on their degrees, giving rise to the presence of the so-called “rich-club” phenomenon. The rich-club topology plays a pivotal role in the integrative capacity among regions of the whole-brain network (16). In our previous study, 12 hub regions and disrupted global integration of information have been detected in CAE (17). However, it is unclear whether these patients got disturbed wiring of rich-club topology and whether the global disruptions were concentrated to the rich-club connections.
In this study, diffusion tensor imaging (DTI) scans were acquired from 30 patients diagnosed with CAE and 31 healthy controls (HCs), and probabilistic tractography was employed to reconstruct the structural network. Based on the graph theory, the rich-club organizations of the structural brain network were compared between CAE and HCs. We hypothesized that the disturbed rich-club topology may contribute to the pathophysiology of CAE.
A total of 30 clinically definite CAE patients and 31 healthy controls were recruited from the Department of Neurology at Nanjing Brain Hospital Affiliated with Nanjing Medical University and the Department of Neurology at the Affiliated Huai'an Hospital of Xuzhou Medical University. The CAE was diagnosed according to the guideline from the International League Against Epilepsy (ILAE) (2). This study was performed according to the Declaration of Helsinki and approved by the Ethics Committee of the Nanjing Brain Hospital Affiliated with Nanjing Medical University and the Affiliated Huai'an Hospital of Xuzhou Medical University. Informed consent was signed by all participants or their legal guardians prior to participation. All subjects are right-handed. The populations did not receive a significant difference in terms of age (CAE, mean and standard deviation of 8.30 ± 1.66; HCs, mean and standard deviation of 8.52 ± 1.61; t-test p-value = 0.61) or gender (16 female participants and 14 male participants for CAE; 18 female participants and 13 male participants for HCs; chi-squared test p-value = 0.71). More details of the demographic and clinical characteristics of each group are summarized in Table 1. The inclusion criteria for patient recruitment were as follows: (1) routine video-EEG showing bilateral, symmetrical spike-waves at approximate 3 Hz on normal background activity accompanied by clinical absence seizure; (2) normal neurologic development and no other seizure types; and (3) normal findings in the 3.0 T MRI. Among the 30 patients, either monotherapy or polytherapy of anti-seizure medications (ASMs) were accepted (for details, please see Supplementary Table S1).
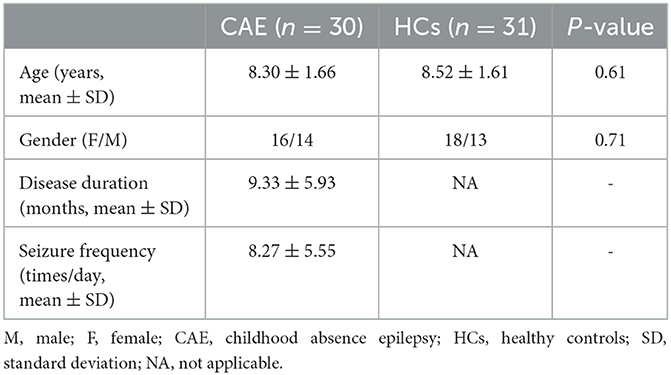
Table 1. Baseline characteristics of participants.
The MR acquisition has been described previously (17). In brief, neuroimaging data were acquired on a Siemens 3.0 T scanner (Erlangen, Germany) equipped with a 12-channel head coil for sensitivity-encoding parallel imaging. Each subject underwent MRI scans as their head was restrained by foam pads to minimize head motion. Diffusion-weighted data were acquired using a single-shot echo planar imaging sequence (TR = 6600 ms, TE = 93 ms, acquisition matrix = 128 × 128, FOV = 240 × 240 mm2, 45 axial slices, slice thickness = 3 mm, and inter-slice gap = 0 mm). The diffusion weighting was isotropically distributed in 30 non-collinear directions (b = 1000 m2/s) with one additional acquisition without diffusion weighting (b = 0m2/s). High-resolution T1-weighted MRI was also obtained using a 3D rapid acquisition gradient echo sequence with the following scanning parameters: TR = 1900 ms, TE = 2.48 ms, acquisition matrix = 512 × 512, FOV = 250 × 250 mm2, 176 sagittal slices, slice thickness = 1 mm, and flip angle = 9°.
Using Diffusion Toolbox in FSL (FMRIB Software Library, http://fsl.fmrib.ox.ac.uk/fsl) (18), the DTI data were pre-processed to correct for eddy currents and head motion (19, 20). After fitting the diffusion tensor to the corrected images (21), the fractional anisotropy (FA) map was produced using the Diffusion Toolbox in FSL. In addition, the skull and surrounding soft tissues were removed using the FSL Brain Extraction Toolbox (BET) (22).
In graph theory, a network consists of a set of nodes connected by edges and can be mathematically expressed as a graph: G = (V, E), with V indicating a finite set of nodes and E indicating the set of edges between them (23). See Figure 1 for an overview of the analytical flowchart. This is the same as our previous study (17).

Figure 1. Flowchart for the construction of brain network. (A) Automated anatomical labeling (AAL) atlas, high-resolution T1-weighted MRI, and diffusion tensor images. (B) The connectivity matrix is generated using the probabilistic tractography algorithm after the brain is parcellated into a number of segregated regions and normalized to standard MNI space. (C) A weighted network is rendered by a 3D visualization model in BrainNet Viewer (BrainNet Viewer 1.53, Beijing Normal University, http://www.nitrc.org/projects/bnv/). The edges are encoded with their connection weights at the threshold of 0.01.
The procedure to define network nodes was completed following our previous study (17). In brief, the automated anatomic labeling (AAL) atlas was employed to generate 90 cortical and sub-cortical regions in diffusion native space (45 for each hemisphere, see Supplementary Table S2) (24). First, T1 images were non-linearly converted to the ICBM152 T1 template in the MNI space. Then, the AAL atlas was warped to the DTI native space by using the inverse transformation matrix. Of note, a nearest-neighbor interpolation method was employed in this step to preserve discrete labeling values. Finally, 90 AAL regions were executed and served as network nodes in the subsequent topological analyses.
To define the edges of the brain network, probabilistic tractography was carried out using the FSL Diffusion Toolbox (FDT) (25). The bedpostx was run to estimate distributions on diffusion parameters at each voxel, and the probtrackx tool was used to conduct probabilistic tracking. From each voxel in the seed region, 5,000 samplings from the distributions of voxel-wise principal diffusion directions were repetitively performed. For each time, we can get a probabilistic streamline. After that, the connectivity probability from the seed region to each of the other 89 regions was calculated. As a result, a 90 × 90 network matrix N for each subject was generated. In the network matrix N, the element Nij means the connectivity probability from i to j. However, considering the dependence of tractography on the seeding location, the connectivity probability from i to j is not necessarily equivalent to that from j to i. Therefore, we computed the undirected connectivity probability Nij between regions i and j by averaging these two probabilities and defined it as the edge weight. To minimize possible false-positive fiber streamlines, edges with a weight value below 0.01 were considered potentially spurious and were removed from the network matrix, which was consistent with our previous research (17). The same threshold was applied to both patients and controls in order not to artificially inflate any group difference. As a result, an individual-specific 90 × 90 weighted network matrix was generated for each participant. Moreover, to define the rich-club topology, the unweighted brain networks were obtained as connections were represented in a binary fashion (connection present = 1, connection absent = 0). In detail, the edges with a connectivity probability above 0.01 were assigned a value of 1, and the edges with a connectivity probability below 0.01 were assigned a value of zero. Then, an individual-specific binary network matrix was generated for each participant. Next, for both patients and healthy controls, a group-averaged binary network was generated by selecting all the edges that were present in at least 75% of the subjects for each group. These steps were also reported in previous articles (16, 26) and were considered helpful for alleviating noise caused by inter-subject variability.
To examine the possible differences in whole-brain network topology between patients and controls, several characteristic graph properties of the brain network of interest were computed using the Brain Connectivity Toolbox (http://sites.google.com/a/brain-connectivity-toolbox.net/bct/metrics) (27). All properties were calculated based on weighted networks to better describe the information of the existing connections. The global network topological properties were described in terms of the global connection strength, global efficiency, and small-worldness (details described in Supplementary material). Each metric provided a specific viewpoint to characterize the main features of the large-scale architecture.
The focus of our study was the investigation of rich-club organization of the structural brain network in CAE patients. The so-called rich-club phenomenon in networks is said to be present when a small set of these highly connected hub regions tend to be more densely interconnected among each other than expected by chance (16). The rich club is thought to facilitate the integration of brain functions by providing shorter and faster routes of information transfer across widespread brain networks. In this study, the rich-club organization was delineated in the binary network. A detailed description of the unweighted rich-club coefficient is given in the Supplementary material. In short, for the given nodal degree k (the number of connections attached to each network node), the subnetwork comprising nodes with a degree larger than k was selected. For the remaining network, the rich-club coefficient Φ(k) was calculated as the ratio of connections present in the subnetwork and the total number of possible connections that would be present when all these remaining nodes would be fully connected. Then, the normalized rich-club coefficient Φnorm(k) was obtained by comparing and normalizing the rich-club coefficient to a set of 1000 comparable random networks with the same number of nodes, edges, and preserved degree distribution. By definition, a normalized rich-club coefficient Φnorm(k) >1 over a range of k is indicative of a rich-club organization in a network (16).
Once a rich-club organization has been identified, network nodes can be classified as rich-club nodes and non-rich-club nodes, and existing connections in the network were classified into three categories: (1) rich-club connections only linking rich-club nodes among each other, (2) feeder connections linking rich-club to non-rich-club nodes, and (3) local connections only linking non-rich-club nodes among each other (Figure 3C). This classification was commonly adopted in several analyses and helpful for the estimation and statistical comparison of multiple aspects of brain connections (16, 26).
For each individual dataset, rich club, feeder, and local connection strength were computed as a sum of all the weights of their connections, respectively.
To evaluate the group differences in graphic metrics between patients and healthy controls, permutation testing (10000) was used for randomizing group assignments (28, 29). For rich-club analysis, a p-value was corrected for the number of rich-club levels.
In addition, to investigate how impairments in rich-club topology relate to clinical characteristics in CAE, we used Pearson's correlations to assess how rich-club connectivity related to disease duration and seizure frequency for patients.
Consistent with our previous report on global network topology in CAE patients (17), this study further confirmed the topological alterations with a larger sample. The bivariate comparison showed that the strength and global efficiency of the structural network were significantly reduced in patients relative to healthy controls (p = 0.01 and p = 0.03, respectively) (Figure 2). Moreover, both groups got a small-world organization within the structural brain network as the value of σ>1, while the small-worldness was reduced in patients (p = 0.04) (Figure 2).
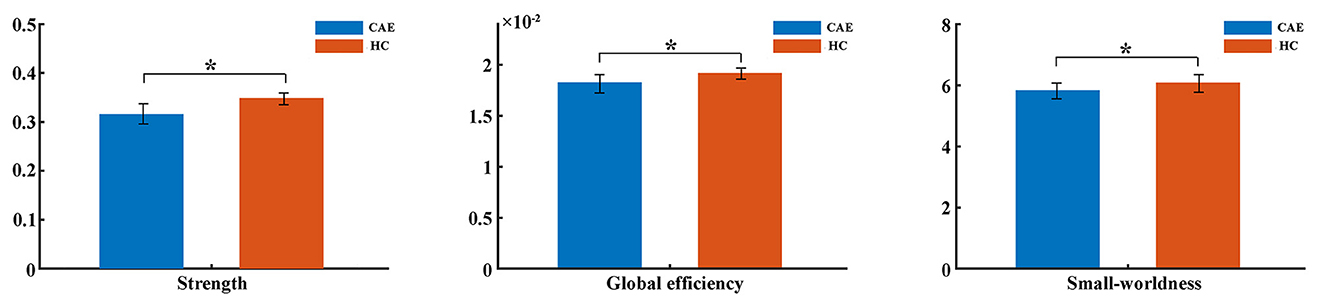
Figure 2. Comparisons of global network metrics between CAE patients and healthy controls (HC). The asterisk shows a significant between-group difference (*p < 0.05). The error bar indicates the standard deviation.
Group averaged rich-club curves of both the patient and control networks are illustrated in Figure 3A. Based on the definition of Φnorm(k) > 1, both patients and controls had a rich-club organization in structural networks, but patients showed a reduced rich-club coefficient. Notably, the reduction in Φnorm in patients was most pronounced at the level of k = 16 (p = 0.008). Rich-club regions were then selected based on this level, including the bilateral posterior cingulate gyrus, bilateral median cingulate and paracingulate gyri, bilateral precuneus, bilateral cuneus, left superior occipital gyrus, right supplementary motor area, and left inferior parietal gyrus (Figure 3B). This decision was in line with previous studies (16, 30).
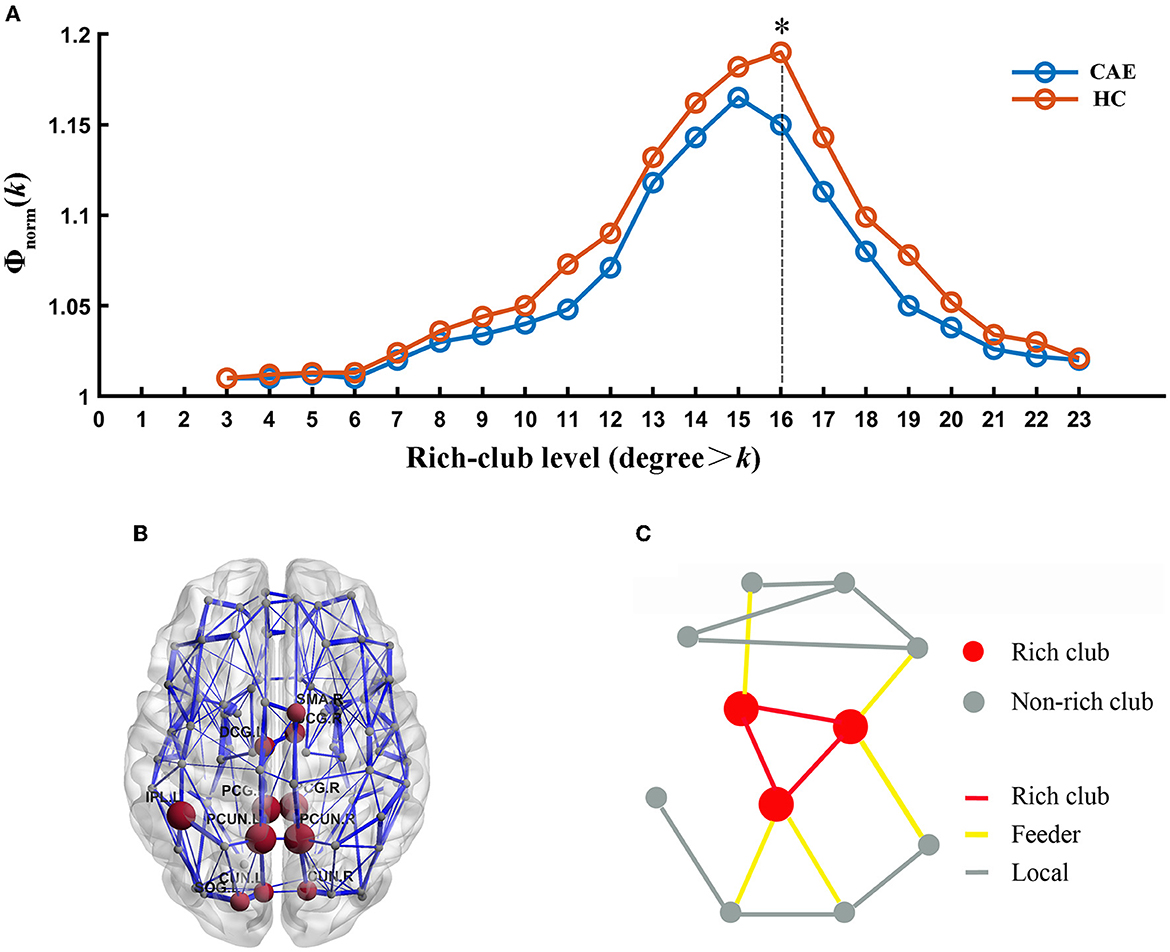
Figure 3. Rich-club organization. (A) Normalized rich-club coefficient (Φnorm) at different rich-club levels expressed as a nodal degree for patients and healthy controls. (*) Significantly reduced Φnorm in CAE subjects compared with healthy controls. (B) Network representation of rich-club regions (brown). (C) Schematic illustration of rich-club (red) and non-rich-club (gray) nodes and local (gray), feeder (yellow), and rich-club (red) connections.
Further analysis of the connections revealed a lower rich-club connectivity strength in patients (p = 0.002, Figure 4). In contrast, this alteration was not significant for feeder connections and local connections (p = 0.27 and p = 0.99, respectively, Figure 4).
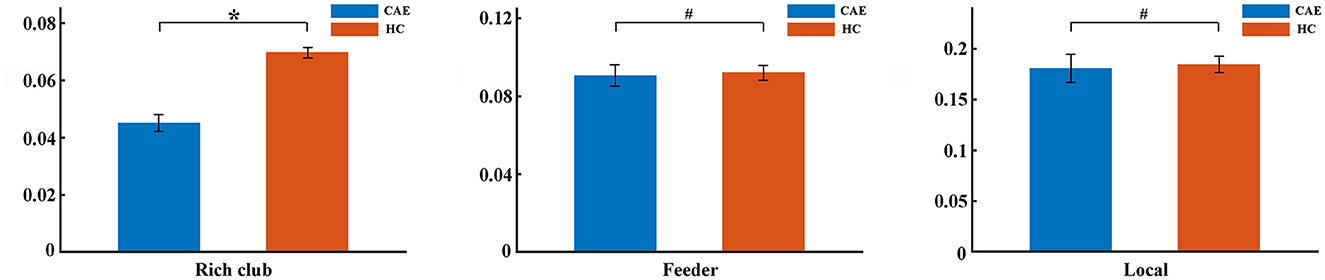
Figure 4. Differences of rich-club organization between patients and controls. The group differences in strength for rich-club connections, feeder connections, and local connections were displayed, respectively (*p < 0.05, #p > 0.05). The error bar indicates the standard deviation.
Correlation analysis showed that the reduction in rich-club strength was significantly related to disease duration (r = −0.514, p = 0.002, Figure 5), while no significant correlation was detected between the rich-club topology and seizure frequency (Supplementary Figure S1).
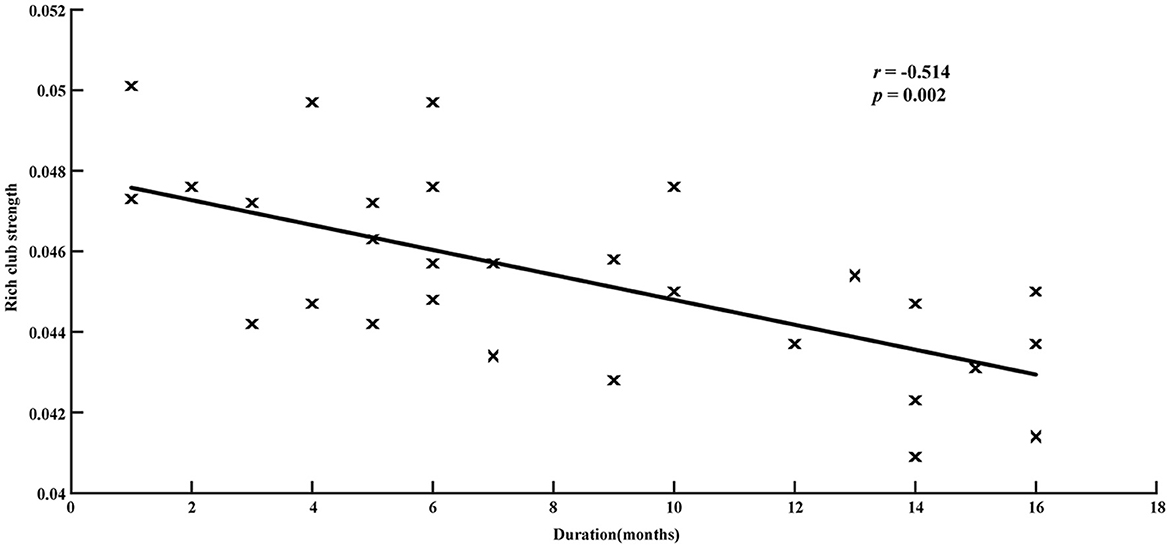
Figure 5. Relationship between disease duration and rich-club strength in patients group. Significantly negative correlations are revealed (r = −0.514, p = 0.002).
This study investigated the structural network, especially the rich-club topology, in CAE using the DTI dataset and graph theory. Lower network strength and global efficiency were detected in this study, indicating a less efficient network in childhood absence epilepsy. The weakening shift of brain topology had been consistently reported in previous studies (17, 31). The small-world topology falls between regular and random networks and can support both segregated and integrated information processing (32). In this research, small-world topology was proven in both patients and controls following the criterion of small-worldness index (σ) > 1 (33). However, the index of σ decreased significantly in patients, which may correspond to a disruption of the balance between information integration and segregation.
The main focus of this study was the alteration of structural rich-club topology in clinical CAE patients. As referred, the densely connected and highly centralized hub brain regions had a strong tendency to be connected among themselves to form a “rich club,” which might serve as a connectivity backbone in the structural networks of the human brain (26). Although rich-club architecture in rodents and many human neuropsychiatric disorders have been extensively explored in recent years (34–38), it is still unclear in CAE. Our study was the first to explore the rich-club topology of the structural brain network in CAE using graph theory. Previous studies had provided new insights into the topological organization of structural connectome in CAE; however, they were limited to network-based analysis or global metrics and were not able to address the selective vulnerability of rich-club organizations.
In this study, we were able to show that the structural brain network of CAE derived from the DTI dataset by probabilistic tractography indeed got a rich-club organization, but the rich-club connectivity in patients with CAE was significantly reduced, reflecting a lower level of connectivity among hub brain regions. Immature rich-club topology might be related to some neurodevelopmental disorders (39). Recently, emerging evidence of brain network abnormalities has been reported in patients with CAE, such as impaired attention network (40) and salience network (41), altered effective connectivity (42), and disrupted structural connectivity in orbitofrontal and sub-cortical regions (31). Going beyond these findings, our study revealed an impaired rich-club organization while the feeder and local connections seem to be relatively reserved. This may be explained by the vulnerability of rich-club regions in brain disorders as these regions are characterized by not only high topological value but also high biological cost (14).
Furthermore, the association between the impaired rich-club organization and disease effects was found in this study. Lower rich-club connection strength was statistically correlated with longer disease duration of absence epilepsy, implying the longer the duration, the worse the impairment. This was in good agreement with previous reports concerning the long-standing burden of epileptic discharges on brain dysfunction (43–45). Although whether the structural abnormalities are reasons or consequences of frequent absence seizure still remains unclear, we tentatively speculate that impaired rich-club topology might be the consequence of long-term injurious effects of epileptic activity. As a result, an altered rich-club organization may serve as a potential biomarker for disease progression in CAE, which needs to be further discussed.
Although we reported some promising findings in this study, there were also some issues that should be considered when interpreting these results. First, node definition is an important issue. The results may vary with the number of parcellated regions, region size, or their locations when using graph theory to analyze brain networks (46). It was strongly suggested that the high-resolution network keeps a great consistency with regional analysis in investigating the existence of a densely interconnected rich club in the brain connectome (16). However, replicating the current dataset in an alternative parcellation scheme is still deserved in future work to get a more convincing result. Second, given the correlation between rich-club alterations and disease duration, we supported the hypothesis that rich-club impairments might be the consequence of long-term frequent epileptic discharges, but this hypothesis might be preliminary due to the cross-sectional nature of our study and relatively small sample size (47). Therefore, future longitudinal studies with larger samples are advisable to further examine the causal relationship between epileptic activity and rich-club changes in this regard. Finally, it is the trouble of the network model. In addition to the binary network, there were also some other weighted networks, such as the streamline-weighted network and FA-weighted network, which had been widely discussed in previous studies (16, 35). Unfortunately, there has been no consensus on the selection of a network model in rich-club analysis.
Our study further confirmed the severely disrupted connectome in CAE with a larger sample as network strength, global efficiency, and small-worldness significantly decreased. More importantly, this study detected an abnormal rich-club organization in CAE, and these impairments were significantly correlated with disease duration. All these findings highlight the role of the rich club as a backbone for the brain connectome and provide a novel perspective to understand the pathophysiological mechanism of CAE.
The original contributions presented in the study are included in the article/Supplementary material, further inquiries can be directed to the corresponding author.
The studies involving human participants were reviewed and approved by the Ethics Committee of Nanjing Brain Hospital Affiliated to Nanjing Medical University and the Ethics Committee of Huai'an Hospital Affiliated to Xuzhou Medical University. Written informed consent to participate in this study was provided by the participants' legal guardian/next of kin.
YY, WQ, XC, and YZ designed the research. MQ, YT, and JT analyzed the data. Participants were recruited and images were acquired by WZ and XC. The manuscript's textual content was written by YY and MQ and revised by WQ. All authors approved the final submitted version and agreed to be accountable for its content.
This study was supported by the Science Foundation of Huai'an Commission of Health (Grant no. HAWJ202113) and the Third Phase of Huai'an Project 533 Scientific Research Funding Schemes.
We would like to thank all partners in the Department of Radiology at the Huai'an Hospital Affiliated with Xuzhou Medical University for their help in MRI acquisition. We also thank all the subjects and their parents for their support.
The authors declare that the research was conducted in the absence of any commercial or financial relationships that could be construed as a potential conflict of interest.
All claims expressed in this article are solely those of the authors and do not necessarily represent those of their affiliated organizations, or those of the publisher, the editors and the reviewers. Any product that may be evaluated in this article, or claim that may be made by its manufacturer, is not guaranteed or endorsed by the publisher.
The Supplementary Material for this article can be found online at: https://www.frontiersin.org/articles/10.3389/fneur.2023.1135305/full#supplementary-material
1. Sporns O, Tononi G, Kotter R. The human connectome: a structural description of the human brain. PLoS Comput Biol. (2005) 1:e42. doi: 10.1371/journal.pcbi.0010042
2. Berg AT, Berkovic SF, Brodie MJ, Buchhalter J, Cross JH. Revised terminology and concepts for organization of seizures and epilepsies: report of the ILAE commission on classification and terminology, 2005-2009. Epilepsia. (2010) 51:676–85. doi: 10.1111/j.1528-1167.2010.02522.x
3. Berg AT, Shinnar S, Levy SR, Testa FM. Newly diagnosed epilepsy in children: presentation at diagnosis. Epilepsia. (1999) 40:445–52. doi: 10.1111/j.1528-1157.1999.tb00739.x
4. Caplan R, Siddarth P, Stahl L, Lanphier E, Vona P. Childhood absence epilepsy: behavioral, cognitive, and linguistic comorbidities. Epilepsia. (2008) 49:1838–46. doi: 10.1111/j.1528-1167.2008.01680.x
5. Pavone P, Bianchini R, Trifiletti RR, Incorpora G, Pavone A. Neuropsychological assessment in children with absence epilepsy. Neurology. (2001) 56:1047–51. doi: 10.1212/WNL.56.8.1047
6. Kanner AM, Helmstaedter C, Sadat-Hossieny Z, Meador K. Cognitive disorders in epilepsy I: clinical experience, real-world evidence and recommendations. Seizure. (2020) 83:216–22. doi: 10.1016/j.seizure.2020.10.009
7. Baggio M, Toffoli L, Baggio M, Toffoli L, Da Rold M. Neuropsychological and behavioral profiles of self-limited epileptic syndromes of childhood: a cross-syndrome comparison. Child Neuropsychol. (2022) 28:878–902. doi: 10.1080/09297049.2022.2028754
8. Blumenfeld H. What is a seizure network? Long-range network consequences of focal seizures. Adv Exp Med Biol. (2014) 813:63–70. doi: 10.1007/978-94-017-8914-1_5
9. Centeno M, Carmichael DW. Network connectivity in epilepsy: resting state fMRI and EEG-fMRI Contributions. Front Neurol. (2014) 5:93. doi: 10.3389/fneur.2014.00093
10. Fisher RS, Cross JH, French JA, Higurashi N, Hirsch E. operational classification of seizure types by the international league against epilepsy: position paper of the ilae commission for classification and terminology. Epilepsia. (2017) 58:522–30. doi: 10.1111/epi.13670
11. Sporns O, Honey CJ, Kotter R. Identification and classification of hubs in brain networks. PLoS ONE. (2007) 2:e1049. doi: 10.1371/journal.pone.0001049
12. Hagmann P, Cammoun L, Gigandet X, Meuli R, Honey CJ. Mapping the structural core of human cerebral cortex. PLoS Biol. (2008) 6:e159. doi: 10.1371/journal.pbio.0060159
13. van den Heuvel MP, Sporns O. Network hubs in the human brain. Trends Cogn Sci. (2013) 17:683–96. doi: 10.1016/j.tics.2013.09.012
14. Crossley NA, Mechelli A, Scott J, Carletti F, Fox PT, McGuire P. The hubs of the human connectome are generally implicated in the anatomy of brain disorders. Brain. (2014) 137:2382–95. doi: 10.1093/brain/awu132
15. Li S, Chen Y, Ren P, Li Z, Zhang J, Liang X. Highly connected and highly variable: a Core brain network during resting state supports Propofol-induced unconsciousness. Human Brain Mapping. (2023) 4:841–53. doi: 10.1002/hbm.26103
16. van den Heuvel MP, Sporns O. Rich-club organization of the human connectome. J Neurosci. (2011) 31:15775–86. doi: 10.1523/JNEUROSCI.3539-11.2011
17. Qiu W, Yu C, Gao Y, Miao A, Tang L, Huang S, et al. Disrupted topological organization of structural brain networks in childhood absence epilepsy. Sci Rep. (2017) 7:11973. doi: 10.1038/s41598-017-10778-0
18. Jenkinson M, Beckmann CF, Behrens TE, Woolrich MW, Smith SM. FSL. Neuroimage. (2012) 62:782–90. doi: 10.1016/j.neuroimage.2011.09.015
19. Jenkinson M, Smith S. A global optimisation method for robust affine registration of brain images. Med Image Anal. (2001) 5:143–56. doi: 10.1016/S1361-8415(01)00036-6
20. Jenkinson M, Bannister P, Brady M, Smith S. Improved optimization for the robust and accurate linear registration and motion correction of brain images. Neuroimage. (2002) 17:825–41. doi: 10.1006/nimg.2002.1132
21. Basser PJ, Pierpaoli C. Microstructural and physiological features of tissues elucidated by quantitative-diffusion-tensor MRI. J Magn Reson B. (1996) 111:209–19. doi: 10.1006/jmrb.1996.0086
22. Smith SM. Fast robust automated brain extraction. Hum Brain Mapp. (2002) 17:143–55. doi: 10.1002/hbm.10062
23. Bullmore E, Sporns O. Complex brain networks: graph theoretical analysis of structural and functional systems. Nat Rev Neurosci. (2009) 10:186–98. doi: 10.1038/nrn2575
24. Tzourio-Mazoyer N, Landeau B, Papathanassiou D, Crivello F, Etard O, Delcroix N, et al. Automated anatomical labeling of activations in SPM using a macroscopic anatomical parcellation of the MNI MRI single-subject brain. Neuroimage. (2002) 15:273–89. doi: 10.1006/nimg.2001.0978
25. Behrens TE, Berg HJ, Jbabdi S, Rushworth MF, Woolrich MW. Probabilistic diffusion tractography with multiple fibre orientations: what can we gain? Neuroimage. (2007) 34:144–55. doi: 10.1016/j.neuroimage.2006.09.018
26. van den Heuvel MP, Kahn RS, Goni J, Sporns O. High-cost, high-capacity backbone for global brain communication. Proc Natl Acad Sci U S A. (2012) 109:11372–7. doi: 10.1073/pnas.1203593109
27. Rubinov M, Sporns O. Complex network measures of brain connectivity: uses and interpretations. Neuroimage. (2010) 52:1059–69. doi: 10.1016/j.neuroimage.2009.10.003
28. Berry KJ, Mielke PW, Mielke HW. The Fisher-Pitman permutation test: an attractive alternative to the F test. Psychol Rep. (2002) 90:495–502. doi: 10.2466/pr0.2002.90.2.495
29. Suckling J, Bullmore E. Permutation tests for factorially designed neuroimaging experiments. Hum Brain Mapp. (2004) 22:193–205. doi: 10.1002/hbm.20027
30. Schmidt A, Crossley NA, Harrisberger F, Smieskova R, Lenz C, Riecher-Rössler A. Structural network disorganization in subjects at clinical high risk for psychosis. Schizophr Bull. (2017) 43:583–91. doi: 10.1093/schbul/sbw110
31. Xue K, Luo C, Zhang D, Yang T, Li J. Diffusion tensor tractography reveals disrupted structural connectivity in childhood absence epilepsy. Epilepsy Res. (2014) 108:125–38. doi: 10.1016/j.eplepsyres.2013.10.002
32. Bassett DS, Bullmore E. Small-world brain networks. Neuroscientist. (2006) 12:512–23. doi: 10.1177/1073858406293182
33. Humphries MD, Gurney K. Network 'small-world-ness': a quantitative method for determining canonical network equivalence. PLoS ONE. (2008) 3:e0002051. doi: 10.1371/journal.pone.0002051
34. Liang X, Hsu LM, Lu H, Sumiyoshi A, He Y. The rich-club organization in rat functional brain network to balance between communication cost and efficiency. Cereb Cortex. (2018) 28:924–35. doi: 10.1093/cercor/bhw416
35. Li K, Liu L, Yin Q, Dun W, Xu X. Abnormal rich club organization and impaired correlation between structural and functional connectivity in migraine sufferers. Brain Imaging Behav. (2017) 11:526–40. doi: 10.1007/s11682-016-9533-6
36. Zhang P, Wan X, Ai K, Zheng W, Liu G. Rich-club reorganization and related network disruptions are associated with the symptoms and severity in classic trigeminal neuralgia patients. Neuroimage Clin. (2022) 36:103160. doi: 10.1016/j.nicl.2022.103160
37. Huang W, Hu W, Zhang P, Wang J, Jiang Y. Early changes in the white matter microstructure and connectome underlie cognitive deficit and depression symptoms after mild traumatic brain injury. Front Neurol. (2022) 13:880902. doi: 10.3389/fneur.2022.880902
38. Peng L, Zhang Z, Chen X, Gao X. Alternation of the rich-club organization of individual brain metabolic networks in Parkinson's disease. Front Aging Neurosci. (2022) 14:964874. doi: 10.3389/fnagi.2022.964874
39. Watanabe T, Rees G. Age-associated changes in rich-club organisation in autistic and neurotypical human brains. Sci Rep. (2015) 5:16152. doi: 10.1038/srep16152
40. Killory BD, Bai X, Negishi M, Vega C, Spann MN, Vestal M, et al. Impaired attention and network connectivity in childhood absence epilepsy. Neuroimage. (2011) 56:2209–17. doi: 10.1016/j.neuroimage.2011.03.036
41. Luo C, Yang T, Tu S, Deng J, Liu D, Li Q, et al. Altered intrinsic functional connectivity of the salience network in childhood absence epilepsy. J Neurol Sci. (2014) 339:189–95. doi: 10.1016/j.jns.2014.02.016
42. Wu C, Xiang J, Jiang W, Huang S, Gao Y, Tang L, et al. Altered effective connectivity network in childhood absence epilepsy: a multi-frequency MEG study. Brain Topogr. (2017) 30:673–84. doi: 10.1007/s10548-017-0555-1
43. Leiva-Salinas C, Quigg M, Elias WJ, Patrie JT, Flors L, Fountain NB, et al. Earlier seizure onset and longer epilepsy duration correlate with the degree of temporal hypometabolism in patients with mesial temporal lobe sclerosis. Epilepsy Res. (2017) 138:105–9. doi: 10.1016/j.eplepsyres.2017.10.023
44. Chiang S, Levin HS, Wilde E, Haneef Z. White matter structural connectivity changes correlate with epilepsy duration in temporal lobe epilepsy. Epilepsy Res. (2016) 120:37–46. doi: 10.1016/j.eplepsyres.2015.12.002
45. Kim JB, Suh SI, Seo WK, Oh K, Koh SB. Altered thalamocortical functional connectivity in idiopathic generalized epilepsy. Epilepsia. (2014) 55:592–600. doi: 10.1111/epi.12580
46. Cohen AL, Fair DA, Dosenbach NU, Miezin FM, Dierker D. Defining functional areas in individual human brains using resting functional connectivity MRI. Neuroimage. (2008) 41:45–57. doi: 10.1016/j.neuroimage.2008.01.066
Keywords: childhood absence epilepsy, diffusion tensor imaging, probabilistic tractography, graph theory, rich-club
Citation: Yu Y, Qiu M, Zou W, Zhao Y, Tang Y, Tian J, Chen X and Qiu W (2023) Impaired rich-club connectivity in childhood absence epilepsy. Front. Neurol. 14:1135305. doi: 10.3389/fneur.2023.1135305
Received: 31 December 2022; Accepted: 12 April 2023;
Published: 11 May 2023.
Edited by:
Giorgi Kuchukhidze, University Hospital Salzburg, AustriaReviewed by:
Jintao Sun, Nanjing Brain Hospital Affiliated to Nanjing Medical University, ChinaCopyright © 2023 Yu, Qiu, Zou, Zhao, Tang, Tian, Chen and Qiu. This is an open-access article distributed under the terms of the Creative Commons Attribution License (CC BY). The use, distribution or reproduction in other forums is permitted, provided the original author(s) and the copyright owner(s) are credited and that the original publication in this journal is cited, in accordance with accepted academic practice. No use, distribution or reproduction is permitted which does not comply with these terms.
*Correspondence: Wenchao Qiu, d2VuY2hhb3FpdTIwMTBAMTYzLmNvbQ==
†These authors have contributed equally to this work and share first authorship
Disclaimer: All claims expressed in this article are solely those of the authors and do not necessarily represent those of their affiliated organizations, or those of the publisher, the editors and the reviewers. Any product that may be evaluated in this article or claim that may be made by its manufacturer is not guaranteed or endorsed by the publisher.
Research integrity at Frontiers
Learn more about the work of our research integrity team to safeguard the quality of each article we publish.