 Hogene Kim
 Ji-Eun Cho
 Kyeong-Jun Seo
 Jooyoung Lee
95% of researchers rate our articles as excellent or good
Learn more about the work of our research integrity team to safeguard the quality of each article we publish.
Find out more
BRIEF RESEARCH REPORT article
Front. Neurol. , 09 February 2023
Sec. Stroke
Volume 14 - 2023 | https://doi.org/10.3389/fneur.2023.1078064
Objectives: Stroke patients suffer from ankle joint deformities due to spastic ankle muscles. This study evaluated the viability of using 3D scanned surface images of the feet of stroke victims to visually assess the deformities of a hemiparetic foot and investigated the influences of deformed ankle joints on gait kinematics.
Methods: A total of 30 subjects with stroke-induced hemiparesis and 11 age-matched healthy controls completed the clinical assessments. We analyzed their feet's morphometric characteristics using a 3D scanner, identified convenient anthropometric measurements, and conducted gait trials on even and uneven terrains. The 3D foot morphometric characteristics were evaluated using the geometric morphometrics method (GMM).
Results: Results showed that there were significant differences in bilateral foot shapes between the chronic stroke patients and healthy controls and between the paretic and non-paretic sides in the chronic stroke patients. In stroke patients, those with the smaller medial malleoli's vertical tilt angles showed significantly different ankle ranges of motion of dorsi-/plantar flexion during gaits on uneven terrains (p = 0.009). In addition, those with the greater medial malleoli's vertical tilt angles showed significantly different ankle ranges of motion of inversion/eversion during gaits on even and uneven terrains (p < 0.05).
Conclusion: Using 3D scanning technology, bilateral morphometric changes in the feet of chronic stroke patients were shown by GMM and the simple anthropometric measurements identified its shape deformities in the feet. Their possible effects on gait kinematics while walking on uneven terrains were investigated. Current methodology can be potentially useful in applying conventional productions of clinically manufactured, patient-fitted ankle-foot-orthosis in orthotics and prosthetics, and in detecting various unidentified pathological deformities in the feet.
Most patients with upper motor neuron disorders, such as stroke, multiple sclerosis, and amyotrophic lateral sclerosis, have spastic lower limb muscles (1). Specifically, 30–70% of stroke survivors suffer from spastic or stiff ankle muscles (2). Spastic muscles in the ankle joints significantly increase joint stiffness owing to the dependence of the muscle tone on the rising velocity of the stretch reflex (3). Thus, patients with stroke-induced hemiparesis suffer from several movement disorders. Previous studies have reported that the equinus foot condition significantly disrupts the gait patterns of stroke patients (4, 5). Decreased muscle activity in the ankle plantar flexors of such patients reduces the propulsive forces acting during their gait (5). A patient with equinovarus foot requires more time to recover than one without equinus foot and they have to undergo intense rehabilitation (6).
Chronic stroke victims who have not undergone ankle treatments suffer from a constant inequivalence between their major ankle muscles, i.e., the spastic triceps surae and ankle dorsiflexors. This inequivalence is responsible for the geometric deformities of a foot (7). A spastic equinus foot introduces many functional limitations into the daily activities of patients, namely foot drop during gait (4, 8) and balance impairments (9). Various clinical treatments, such as orthopedic surgeries, toxin injections, and ankle-foot-orthoses (AFOs) (10, 11) have been adopted to treat the spastic equinovarus foot condition. AFO is a popular assistive technology that has been used to treat patients having a hemiparetic foot, both inside and outside clinics.
Recent advances in scanned 3D digital imaging technology have been successfully incorporated into clinical practice to enable the treatment of various pathological deformities. For example, standardized measurements of 3D surface images of breasts and head shapes allow for obtaining objective dimensions in a subjective field and overcoming the deficits of conventional 2D photography in plastic and reconstructive surgery. This enables clinicians to reproduce their results and precisely track the deformities of patients (12). Although 3D surface imaging technology can be used in applying it to many patient-fitted assistive devices in rehabilitation clinics, orthotics and prosthetics, the application of 3D surface imaging technology in detecting hemiparetic foot deformities is limited. In addition, the traditional approach to shape analysis, using numerical quantities such as the distance or angle between a foot's landmarks, employs quantities that are less verified than the actual coordinates of the landmarks, ignoring the foot's precise geometry (13).
This study evaluates the viability of using 3D scanned surface images of the feet of stroke patients to visually assess the deformities of a hemiparetic foot. Anthropometric measurements that can locate typical foot landmarks, characteristic of hemiparetic foot abnormalities, are easier to obtain when using modern 3D scanning technology. First, we hypothesized that there was no difference in the foot and ankle shapes (1) between the paretic and non-paretic sides in chronic stroke patients and (2) between the hemiparetic sides of chronic stroke patients and age- and gender-matched healthy controls using the geometric morphometrics method (GMM); variations in foot shapes were examined based on the coordinates of foot landmarks as well as by using the traditional approach. Secondly, we hypothesized that (3) the effect of the anthropometric difference between paretic and non-paretic feet did not affect the gait parameters of chronic stroke patients.
The subjects were recruited from National Rehabilitation Center (Seoul, South Korea). The eligibility criteria for adults with stroke-induced hemiparesis to participate in this study are listed as follows:
1. The Patient should have experienced foot drop during gait.
2. The ankle dorsiflexor should be moderately strong (manual muscle testing grades are such that 1 corresponds to trace and 4 to good).
3. The patient should have moderate ankle spasticity (modified Ashworth scale ≥2).
4. The patient should understand the contents of the test and follow the instructions (mini-mental status examination ≥24).
The healthy controls included people without mental and physical impairments. The exclusion criteria for the participants are mentioned below:
1. Patients with severe contracture and pain at the ankle joint.
2. Patients unable to walk independently on level ground (Functional Ambulation Categories score <4 and Berg balance scale score <41).
3. Patients with orthopedic complications at the ankle joint.
4. Patients who have attended intensive ankle training sessions within the last 6 months.
The study protocol was reviewed and approved by the local institutional review board (NRC-2019-03-021) and registered at a clinical trial registry in the World Health Organization registry network (Clinical Research Information Service, KCT0005171). The methodology of the study was explained in depth to all the participants. Written informed consent was obtained from each participant prior to data collection.
To quantify foot shape, landmark-based geometric morphometrics were used (14). In accordance with commonly used foot anatomical landmarks, a set of four 3D landmarks on the foot surface were chosen that effectively show the hemiparetic deformity in foot and ankle structure of chronic stroke patients: (1) the first metatarsal joint head, (2) the fifth metatarsal joint head, (3) medial malleolus, and (4) lateral malleolus (15–18). Then we have set three points of a foot as custom references to define the plane of the foot ground-contact-area while standing: (5) the medial and (6) the lateral outmost point of the heel ground-contact-area while standing, (7) the tip of index toe, and the origin as the most posterior point of the foot along the line between the calcaneus center and index toe on this plane. All these landmarks were recorded on the paretic and non-paretic sides for each stroke patient and on the dominant side for each healthy control. We reflected on the non-paretic or non-dominant side of the foot for landmark correspondence. The original landmarks (right side) and the ones we reflected on (left side) were then superimposed using Generalized Procrustes Analysis (GPA) to remove the effects of position, size, and orientation (19). Procrustes coordinates were then used to analyse the foot shape variations between the stroke patients and healthy controls and between the paretic and non-paretic asymmetry in foot shapes for stroke patients.
In addition, the traditional approach to shape analysis including using distances and angles between landmarks, was applied. The angles θht, θmmv, θlmv, θmm, and θlm represent the horizontal tilt, medial malleolus' vertical tilt, lateral malleolus' vertical tilt, medial malleolus' side, and lateral malleolus' side, respectively. Here, θht denotes the angle between the horizontal line in the coronal plane and the line connecting the medial and lateral malleoli, θmmv denotes the angle between the vertical line in the coronal plane and the line connecting the origin to the medical maliolus, θlmv does to lateral malleolus θmm denotes the angle between the lines connecting from (1) and (5) to the medial malleolus, and θlm does connecting from (2) and (6) to the lateral malleolus. These parameters are shown in Figure 1. All foot lengths, widths, and heights were normalized according to the individual's full length of the foot (lf) and expressed as a percentage.
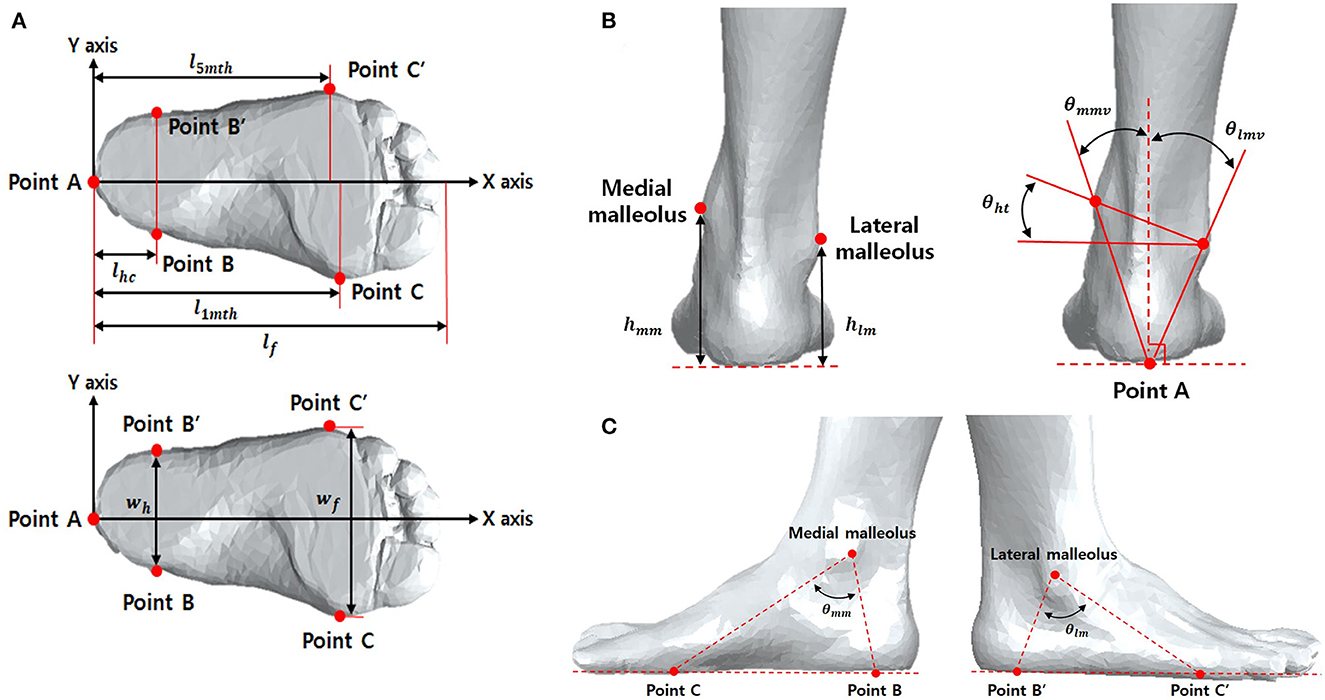
Figure 1. Reference points for 3D ankle measurements in transverse plane (A) and frontal plane (B), and sagittal plane (C). lfoot, length of foot; l1mt, length of 1st metatarsal head; l5mt, length of 5th metatarsal head; lhc, length of hind foot center; wh, width of hind foot; wf, width of forward foot; hmm, height of medial malleolus; hlm, height of lateral malleolus; θmmv, vertical degree of medial malleolus; θlmv, vertical degree of lateral malleolus; θht, degree of horizontal tilt; θmm, degree of medial malleolus; θlm, degree of lateral malleolus; θmv, vertical degree of malleolus.
The following standard clinical measurements of the subjects were obtained prior to the procedure:
1. Ankle isometric contraction force (N);
To measure ankle strength, the maximal voluntary isometric contraction force of the paretic ankle muscle was measured using a portable manual muscle strength tester (Lafayette Instrument, Lafayette, IN, USA). The participants were in the sitting position during the measurements, and resistance was provided using a measurer to isolate the ankle joint motion. Each trial consisted of a voluntary isometric contraction with a maximum of 3 s; a 30 s rest period was provided between trials. The average value was used for analysis.
2. Modified Ashworth scale (MAS, score);
To testing the spasticity of plantar flexor, place the ankle joint a maximally plantarflexion position and move to a position of maximal dorsiflexion over 1 s. A five-point ordinal scale described the grades of resistance encountered during such passive muscle stretching.
3. Berg balance scale (BBS, score);
To measure balance, the BBS was used as a clinical test of an individual's static and dynamic balance. The test comprised a set of 14 simple balance-related tasks ranging from standing from a sitting position to standing on one foot.
4. Fugl-Meyer assessment of-Lower Extremity (FMA-LE, score);
To measure the motor function, we used the motor domain of the FMA-LE. The motor domain includes measurements of movement, coordination, and reflex action of the hip, knee, and ankle. The maximum possible score of the motor domain of the FMA-LE is 34, corresponding to full sensorimotor recovery.
5. Fall efficacy scale (FES, score);
The FES was applied to ascertain an individual's level of confidence when performing activities of daily living. It is a self-report questionnaire that contains 10 items, with each scored using a scale of 0 to 10, and the total summed scores range from 0 to 100. A high score indicates high confidence when performing activities of daily living without falling.
Each subject placed their target foot comfortably on a custom, transparent footplate that was tilted by 45° and was supported 50 cm above the ground by a central pillar. This arrangement ensured that the subject's ankle joint remained in a neutral position while they were in a semi-sitting posture on a comfortable chair with their knee in a naturally flexed position (see Supplementary Figure 1). The orientation of the ankle joint was neutral, and moderate pressure was applied to the surface of the footplate. A test administrator then acquired paretic and non-paretic 3D images of the foot and ankle structures using a commercial 3D scanner (Artec Eva, Artec 3D Inc., Luxembourg), weighing 0.9 kg with a resolution of 0.5 mm. The acquired 3D images were stored in the STereoLithography (STL) file format and post-processed using a 3D CAD program (SolidWorks, Dassault Systems, Waltham, MA, United States). From the processed images, the 3D foot anthropometric characteristics were identified, and the geometric parameters of the foot were measured.
Each subject walked three times on 10 m even and uneven terrains at a self-selected comfortable speed, as presented in a previous study. The uneven terrain was created using randomly arranged triangular wooden prisms (H 1.5 cm × W 3.5 cm × L 6–12 cm) placed under a 1.5 m × 10 m strip of industrial carpeting with a surface texture identical to that of the even surface (20). Kinematic data were recorded at 100 Hz with 24 reflective passive markers on the lower limbs using a 3D motion capturing system based on a commonly used model (Plug-in-Gait, Vicon, Oxford, UK). The joint and gait parameters data were then processed using Visual3D (C-Motion, Germantown, MD, USA) to analyse joint kinematics of the hip, knee, ankle, and gait parameters during gait on even and uneven terrains.
A statistical shape analysis was performed using the R package geomoph v.4.0.0 (21). Before all analysis, normality of data distribution was tested. A Procrustes Analysis of variance (ANOVA) on Procrustes distances was conducted to test the significant foot shape differences between the stroke patients and healthy controls. The patterns of overall shape variation were visualized using Principal Component Analysis (PCA). The shape analysis of bilateral symmetry was performed using a Procrustes ANOVA with individual and side (as the paretic and non-paretic foot of each stroke patient) and individual*side interaction. Symmetric variations among the individuals corresponded to the main effect of the individual. Asymmetry, expressed as the difference between the paretic and non-paretic sides of each stroke patient, was partitioned into two components: (i) the directional asymmetry (DA) as the difference between the average of the paretic and non-paretic sides, and (ii) fluctuating asymmetry (FA) as the individual variability of paretic/non-paretic differences. In ANOVA, DA corresponded to the main effect of the side and FA corresponded to the individual*side interaction. PCA was also performed to visualize the patterns of fluctuating asymmetry variations. Permutation tests with 10,000 iterations were conducted for testing the ANOVA effects with a significance level of 0.05.
The statistical comparisons between the intra- and inter- variables were performed using the Statistical Package for the Social Sciences (SPSS Inc., Chicago, Illinois; version 12.0). Before all analyses, the normality of data was assessed using the one-sample Kolmogorov-Smirnov test. The Mann-Whiteny U-test was performed on the variables for a between-group comparison, i.e., strokes vs. healthy controls and upper vs. lower halves of foot deformity, while the Wilcoxon signed rank test was performed for a within-group comparison, i.e., paretic vs. non-paretic patients. Analysis of covariance (ANCOVA) was performed for a comparison between groups by controlling weight and gender as covariates. We applied Bonferroni correction for 30 tests to correct for multiple comparison. The effects of foot deformities on step and joint kinematics during gait were investigated based on the results of the Wilcoxon signed-rank test. These results were used to compare the walking kinematics of the upper and lower halves of the participants for each kinematic deformity of their feet. The alpha level was set to P < 0.05 to identify the statistically significant readings. The appropriate number of subjects for the study was estimated by performing a power analysis to calculate the values of alpha and beta.
A total of 30 subjects with stroke-induced hemiparesis and 11 age-matched healthy controls participated in this study (Supplementary Table 1). The stroke patients were all independent walkers and completed the clinical assessments. The weights of the stroke patients were significantly higher than those of the healthy controls (p = 0.005). The ankle joint strengths of the stroke patients were significantly lower than those of the healthy controls (p < 0.001).
The length, height, and width were normalized with respect to the total foot length and expressed in terms of percentages (%) (Table 1). There was a significant difference between the length of the 1st metatarsal head, width of the forward foot, and vertical tilt degrees of the medial and lateral malleoli of the paretic and non-paretic sides for the stroke patients (p < 0.05). The ANCOVA analysis showed a significant difference for θmm (p = 0.002) using weights as a covariate and θmm (p = 0.001) and θlm (p = 0.001) using gender as a covariate. After applying Bonferroni correction Wh and θmm were no longer significant.

Table 1. 3D ankle anthropometric measurements (N = 41).
The GMM showed that the foot shapes of stroke patients significantly differed in the paretic side (F = 3.298, p = 0.001) and the non-paretic side (F = 2.184, p = 0.034) compared to the dominant side in healthy controls. The foot shape group differences were observed along the first two principal components (PCs) primarily in the medial malleolus, resulting in a smaller degree of change in the medial malleolus for the paretic and non-paretic sides of stroke patients than the healthy controls (Supplementary Figure 2). The Procrustes ANOVA done for testing bilateral symmetry showed no significant variations among individuals (symmetry: SS = 0.190, df = 29, F = 1.147, p = 0.123) and no significant foot shape variations between the paretic and non-paretic sides (directional asymmetry: SS = 0.009, df = 1, F = 1.622, p = 0.116), The shape directional asymmetry showed a subtle foot shape difference in the first metatarsal joint head, the medial malleolus, and the index toe. The first principal component (PC1) explained that 31.8% of fluctuating asymmetry was related to overall locations. The principal component (PC2) explained that 15.2% was primarily related to the medial and lateral malleoli and the first metatarsal joint head, indicating that a foot with a positive PC2 was tilted medially.
There were significant differences between the joint kinematics and gait parameters of the stroke patients and healthy controls (Table 2). All hip, knee, and ankle range of motion (ROM) except only hip abduction-adduction of the paretic side were significantly less than that of the non-paretic side while walking on both even and uneven terrains (p < 0.01). In addition, the step length and step time of the paretic side during gait on even terrains and step time of the paretic side during gait on uneven terrains were significantly less than those of the non-paretic side (p < 0.01). All joint kinematics except only ankle inversion-eversion of the paretic side of stroke patients were significantly less than that of the dominant side of healthy control while walking on both even and uneven terrains (p < 0.01). Furthermore, there were significant difference in all gait parameters except only stance time between the paretic side of stroke patients and the dominant side of healthy control while walking on both even and uneven terrains (p < 0.01).
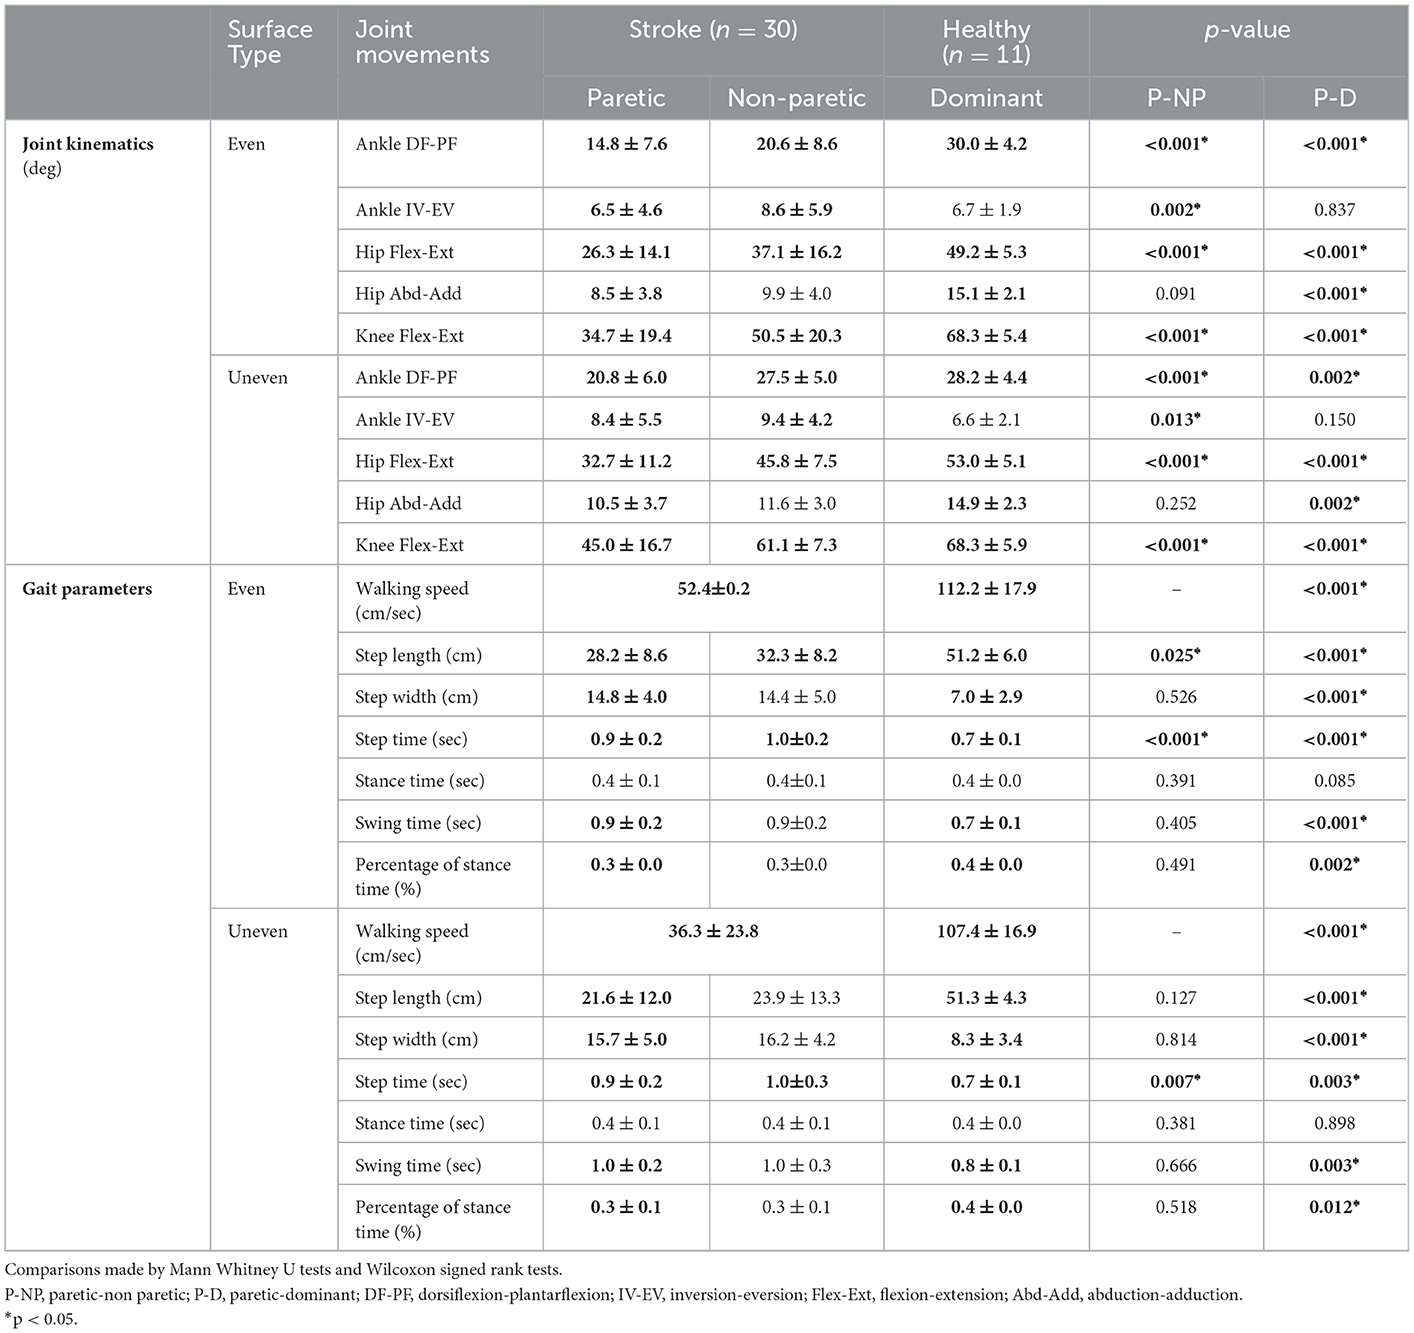
Table 2. Joint kinematics and gait parameters on even and uneven terrains between strokes and healthy controls.
There were significant differences between the ankle joint kinematics of the upper and lower halves of the medial and lateral melleoli's vertical tilt angles, θmmv and θlmv, respectively, during gait on the even and uneven terrains, as shown in Figure 2. The lower half of the medial malleolus' vertical tilt angle (θmmv), i.e., smaller θmmv, had significantly greater ankle ROM than those of upper half in the sagittal and frontal planes during gait on uneven terrains (dorsi-/plantarflexion: p = 0.009, in-/eversion: p = 0.020, Figure 2A). The upper half of the lateral malleolus' vertical tilt angle (θlmv), i.e., greater θlmv, had significantly greater ankle ROM in the frontal planes during gait on both even and uneven terrains (even: p = 0.012, uneven: p = 0.005, Figure 2B).
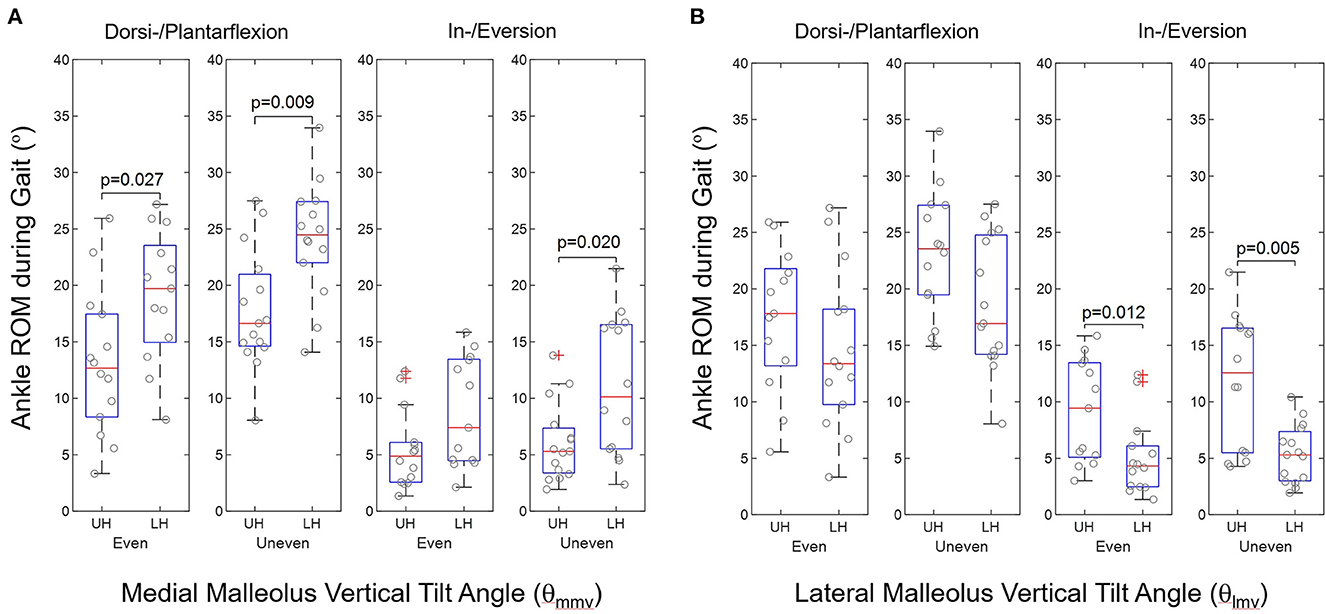
Figure 2. Group comparison of ankle ROM during walking in terms of upper half (UH) and lower half (LH) in (A) medial malleolus vertical tilt angle (θmmv) and (B) lateral malleolus vertical tilt angle (θlmv) according to ankle geometric measurements in stroke (n = 30).
Our study successfully showed that using 3D scanning technology, the foot morphometric changes in the feet if chronic stroke patients and their anthropometric measurements identified significant hemiparetic deformities in ankle and foot structures between the paretic and non-paretic sides as well as between the chronic stroke patients and healthy controls. Simple measurements using typical foot landmarks identified hemiparetic ankle deformities. Then there were significant differences in the joint and gait kinematics between chronic stroke patients and healthy controls when they walked on even and uneven terrains, with respect to malleoli measurements.
The results in this study have a couple of clinical and biomechanical implications. First, our results revealed that chronic stroke patients had significant shape deformities in the paretic and non-paretic sides, compared to healthy controls. The chronic stroke patients who participated in this study had an average 10 years onset stroke period. These people usually had pathological conditions in ankle muscles such as spasticity in the triceps surae, proprioceptive deficits, and weaknesses in ankle dorsiflexor muscles (22, 23). Ankle biomechanics, which affected by these pathological conditions, consists of a complex form involving subtalar joints rather than simple flexion-extension movements at talocrural joints. A previous study on ankle stability and morphological factors revealed that the bone morphology of the talus showed potential instability in plantar flexion and the radii of curvature of the talar dome have a variable mediolateral distribution (24). In addition, ligament components such as cervical and anterior talofibular ligaments and talocalcaneal ligaments are largely responsible for inversion, the most advanced injury mechanism (24). Compared to previous studies based on CT measurements, this study was able to compare ankle morphological changes in stroke patients with a relatively simple 3D surface image. Even if it does not include fundamental morphologies such as bone and ligament, 3D surface images can be a way to measure pathological morphological changes. Moreover, foot geometry and ankle stiffness are two crucial design aspects for an AFO. Therefore, the 3D morphometric changes in a post-stroke hemiparetic foot must be considered while designing AFOs.
Second, there was a significant difference in ankle ROM during gait with respect to ankle anthropometric differences within stroke patients (especially medial/lateral malleolus vertical tilt angle). Although there are various internal variables that contribute to walking in stroke patients, balance represents one of the largest contributing factors to gait dysfunctions (25). Hence, this study recruited subjects who could walk independently and had good balance (Functional Ambulation Categories score: 4.7 ± 0.5 and BBS score: 47.6 ± 5.3) in order to exclude the effect of poor balance on gait ability as much as possible. The results of this study reveal that foot deformity can contribute to one of the causes of ankle-foot kinematics during even and uneven gait in stroke patients. Spasticity in the ankle and foot muscle groups is very common and often results in various ankle and foot deformities and spastic equinovarus foot is the most common (23, 26, 27). These pathological conditions in stroke patients resulted in the consequential inequivalences of muscle tone and force and reduced ankle joint ROM during gait. Joint damage, deformity, and pain in this population also cause abnormal joint loading, inefficient energy expenditure, and falls during walking (28). In addition, limited ROM in ankle-foot joints cause the compensatory movements of proximal joints (29). A previous study demonstrated that there is a large difference in kinematics at ankle joint between the stroke patients and healthy control in uneven terrains and the subtalar joint ROM in stroke patients is considerably reduced compared with healthy control (30). Therefore, practically measured in clinics, the identified 3D foot anthropometric quantities, such as the medial malleolus height (hmm) or tilt angle (qmmv), may be effectively and conveniently useful in assessing the ankle deformity that would potentially relate ankle joint kinematics during gait on even and uneven terrains. Future studies can analyse the relationship between the morphometric changes of ankles and their mobility during gait under different environmental factors. These factors could include various terrain conditions, such as slippery, irregular, or inclined surfaces. The stroke patients were found to have shorter but wider steps than those of the healthy controls in this study, indicating a reduced gait efficiency in the former, corresponding to reduced energy. Our future study would focus on the impact of ankle shape deformity on related factors such as gait kinematics, balance capability, metabolic cost, etc.
Third, the 3D scanned ankle surface images of stroke patients would have clinical implications to follow up long-term anthropometric changes of hemiparetic feet for clinical analyses, evaluations, and managements. In the clinical practices, the proposed ankle measurements may be useful for chronic stroke patients as an initial assessment of walking capability during activities of daily livings. The clinic-based conventional assessments on gait kinematics generally involve comprehensive optical-technology equipment and post-processing efforts. Nevertheless, the proposed method may be advantageous in clinical aspects such as less expensive and time consuming, rather used as a simple initial screening one, even done at home. As the height and weight were used as criterion over child's developments, the proposed ankle deformity measurement would potentially contribute to a criterion-referenced tests for patients with neurological disorders, with the predetermined standard. In addition, stroke survivors use a series of AFOs after the occurrence of stroke to prevent foot drop while walking, which may lead to a fatal fall or other injuries (31). Recently, AFO production using 3D scanned ankle surface images has seen several improvements, compared to conventional handmade AFO made from plaster, in terms of production time, cost, design aesthetics, patient-fitted comfort and biomechanical advantages (32). Reductions in size and cost and simultaneous improvements in the accuracy and precision of modern 3D handheld scanners enable rehabilitation clinicians to conveniently visualize 3D surface images. This facilitates better diagnostic analyses and makes using these scanners in therapeutic procedures easier.
This study has several limitations. First, the current analysis does not include an analysis on the underlying bone shape or ligament factors, which directly affect foot shape. This study was unable to show the internal biomechanical aspects of hemiparetic foot shape changes including ankle spasticity, muscle weakness, and ankle stiffness. Second, our 3D foot morphometric data were cross-sectional data in which we assessed static group differences in foot shapes. Further studies using dynamic foot morphometric data in the prospective study will enable us to examine dynamic foot deformities. Third, limited subject population may not reveal more specific shape discrimination between paretic and non-paretic foot shapes, including anthropometric parameters on lateral malleolus. Fourth, this study included only dominant side of healthy control. Fifth, the number of patients and healthy groups was not the same. Sixth, applications of current methods, although suggesting simple anthropometric foot measurements, should follow more thorough evaluations for the clinical validity in the future.
This study successfully utilized anthropometric parameters that were identified from the 3D scanned surface images of the feet of stroke survivors to distinguish between hemiparetic feet with deformities and healthy feet. The morphometric changes in the hemiparetic feet were used to identify gait changes in stroke patients. The proposed ankle measurements may be useful as an initial assessment of walking capability for chronic stroke patients.
The original contributions presented in the study are included in the article/Supplementary material, further inquiries can be directed to the corresponding author.
The study protocol was reviewed and approved by the Local Institutional Review Board (NRC-2019-03-021) and registered at a clinical trial registry in the World Health Organization registry network (Clinical Research Information Service, KCT0005171). The patients/participants provided their written informed consent to participate in this study.
Conceptualization, writing—original draft preparation, writing—review and editing, supervision, and funding acquisition: HK. Methodology: HK and JL. Validation: K-JS, JL, and HK. Formal analysis: J-EC, JL, and K-JS. Visualization: J-EC, JL, and HK. Project administration: K-JS. All authors have read and agreed to the publisheds version of the manuscript.
This work was supported by Translational Research Center for Rehabilitation Robots, Korea National Rehabilitation Center, Ministry of Health and Welfare, Korea. Award Number: #NRCTR-IN20003. Grant Recipient: HK.
The authors declare that the research was conducted in the absence of any commercial or financial relationships that could be construed as a potential conflict of interest.
All claims expressed in this article are solely those of the authors and do not necessarily represent those of their affiliated organizations, or those of the publisher, the editors and the reviewers. Any product that may be evaluated in this article, or claim that may be made by its manufacturer, is not guaranteed or endorsed by the publisher.
The Supplementary Material for this article can be found online at: https://www.frontiersin.org/articles/10.3389/fneur.2023.1078064/full#supplementary-material
Supplementary Figure 1. Analysis of Geometric Morphometrics on foot and ankle shapes in participants. (A) paretic foot vs healthy foot, (B) non-paretic foot vs healthy foot, and (C) paretic vs non-paretic sides. *a1 and b1 indicate Scatterplots of the first two principal components of the foot and ankle shape variations between stroke patients and healthy controls. (a2 and a3) and (b2 and b3) indicate patterns of shape variation in stroke patients and healthy controls - paretic side (a2 and a3) and non-paretic side (b2 and b3). The red line represents maximum (positive) values, and the yellow line represents minimum (negative) values along PC1 and PC2 (the bottom panel). c1 indicate the directional asymmetry defined as the difference between the average of paretic and non-paretic sides and (b1 and b2) indicate patterns of fluctuating asymmetry. The red line represents maximum (positive) values, and the yellow line represents minimum (negative) values along PC1 and PC2.
Supplementary Figure 2. Subject's Foot placement during 3D scanning measurements.
Supplementary Table 1. Participants characteristics (N = 41).
1. Oussini HE, Scekic-Zahirovic J, Vercruysse P, Marques C, Dirrig-Grosch S, Dieterlé S, et al. Degeneration of serotonin neurons triggers spasticity in amyotrophic lateral sclerosis. Ann Neurol. (2017) 82:444–56. doi: 10.1002/ana.25030
2. Thilmann A, Fellows S, Ross H. Biomechanical changes at the ankle joint after stroke. J Neurol Neurosurg Psychiatry. (1991) 54:134–9. doi: 10.1136/jnnp.54.2.134
3. Veltink PH, Ladouceur M, Sinkjær T. Inhibition of the triceps surae stretch reflex by stimulation of the deep peroneal nerve in persons with spastic stroke. Arch Phys Med Rehabil. (2000) 81:1016–24. doi: 10.1053/apmr.2000.6303
4. Kinsella S, Moran K. Gait pattern categorization of stroke participants with equinus deformity of the foot. Gait Posture. (2008) 27:144–51. doi: 10.1016/j.gaitpost.2007.03.008
5. Mulroy S, Gronley J, Weiss W, Newsam C, Perry J. Use of cluster analysis for gait pattern classification of patients in the early and late recovery phases following stroke. Gait Posture. (2003) 18:114–25. doi: 10.1016/S0966-6362(02)00165-0
6. Verdié C, Daviet JC, Borie MJ, Popielarz S, Munoz M, Salle JY, et al. Epidemiology of pes varus and/or equinus one year after a first cerebral hemisphere stroke: apropos of a cohort of 86 patients. Paper presented at: Annales de readaptation et de medecine physique: revue scientifique de la Societe francaise de reeducation fonctionnelle de readaptation et de medecine physique (2004).
7. Picelli A, Vallies G, Chemello E, Castellazzi P, Brugnera A, Gandolfi M, et al. Is spasticity always the same? An observational study comparing the features of spastic equinus foot in patients with chronic stroke and multiple sclerosis. J Neurol Sci. (2017) 380:132–6. doi: 10.1016/j.jns.2017.07.026
8. Manca M, Ferraresi G, Cosma M, Cavazzuti L, Morelli M, Benedetti M. Gait patterns in hemiplegic patients with equinus foot deformity. BioMed Res Int. (2014) 2014:939316. doi: 10.1155/2014/939316
9. Bensoussan L, Mesure S, Viton J-M, Delarque A. Kinematic and kinetic asymmetries in hemiplegic patients' gait initiation patterns. J Rehabil Med. (2006) 38:287–94. doi: 10.1080/16501970600694859
10. Benedetti MG, Manca M, Ferraresi G, Boschi M, Leardini A. A new protocol for 3D assessment of foot during gait: application on patients with equinovarus foot. Clin Biomech. (2011) 26:1033–8. doi: 10.1016/j.clinbiomech.2011.06.002
11. Carda S, Invernizzi M, Baricich A, Cisari C. Casting, taping or stretching after botulinum toxin type A for spastic equinus foot: a single-blind randomized trial on adult stroke patients. Clin Rehabil. (2011) 25:1119–27. doi: 10.1177/0269215511405080
12. Beaumont CA, Knoops PG, Borghi A, et al. Three-dimensional surface scanners compared with standard anthropometric measurements for head shape. J Cranio-Maxillofac Surg. (2017) 45:921–7. doi: 10.1016/j.jcms.2017.03.003
13. Dryden IL, Mardia KV. Statistical shape analysis: with applications in R. Vol 995. New York, NY: John Wiley & Sons. (2016).
15. Luximon A, Goonetilleke R, Tsui K. Foot landmarking for footwear customization. Ergonomics. (2003) 46:364–83. doi: 10.1080/0014013021000045225
16. Kelikian AS, Sarrafian SK. Sarrafian's Anatomy of the Foot and Ankle: Descriptive, Topographic, Functional. Philadelphia, PA: Lippincott Williams & Wilkins (2011).
18. Jenkyn T, Nicol A. A multi-segment kinematic model of the foot with a novel definition of forefoot motion for use in clinical gait analysis during walking. J Biomech. (2007) 40:3271–8. doi: 10.1016/j.jbiomech.2007.04.008
19. Rohlf FJ, Slice D. Extensions of the Procrustes method for the optimal superimposition of landmarks. Syst Biol. (1990) 39:40–59. doi: 10.2307/2992207
20. Kim H, Cho S, Lee H. Effects of passive Bi-axial ankle stretching while walking on uneven terrains in older adults with chronic stroke. J Biomech. (2019) 89:57–64. doi: 10.1016/j.jbiomech.2019.04.014
21. Adams DC, Otárola-Castillo E. geomorph: an R package for the collection and analysis of geometric morphometric shape data. Methods Ecol Evol. (2013) 4:393–9. doi: 10.1111/2041-210X.12035
22. Lawrence SJ, Botte MJ. Management of the adult, spastic, equinovarus foot deformity. Foot Ankle Int. (1994) 15:340–6. doi: 10.1177/107110079401500610
23. Gustin M. Assessment and treatment of spastic equinovarus foot after stroke: Guidance from the Mont-Godinne interdisciplinary group. J Rehabil Med. (2017) 49:461. doi: 10.2340/16501977-2226
24. Bonnel F, Toullec E, Mabit C, Tourné Y. Chronic ankle instability: biomechanics and pathomechanics of ligaments injury and associated lesions. Orthopaed Traumatol Surg Res. (2010) 96:424–32. doi: 10.1016/j.otsr.2010.04.003
25. Weerdesteijn V, Niet Md, Van Duijnhoven H, Geurts AC. Falls in individuals with stroke. J Rehabil Res Dev. (2008) 45:1195–213. doi: 10.1682/JRRD.2007.09.0145
26. Cioni M, Esquenazi A, Hirai B. Effects of botulinum toxin-A on gait velocity, step length, and base of support of patients with dynamic equinovarus foot. Am J Phys Med Rehabil. (2006) 85:600–6. doi: 10.1097/01.phm.0000223216.50068.bc
27. Foley N, Murie-Fernandez M, Speechley M, Salter K, Sequeira K, Teasell R. Does the treatment of spastic equinovarus deformity following stroke with botulinum toxin increase gait velocity? A systematic review and meta-analysis. Eur. J Neurol. (2010) 17:1419–27. doi: 10.1111/j.1468-1331.2010.03084.x
28. Verma R, Arya KN, Sharma P, Garg R. Understanding gait control in post-stroke: implications for management. J Bodyw Mov Ther. (2012) 16:14–21. doi: 10.1016/j.jbmt.2010.12.005
29. Boudarham J, Roche N, Pradon D, Bonnyaud C, Bensmail D, Zory R. Variations in kinematics during clinical gait analysis in stroke patients. PLoS ONE. (2013) 8:e66421. doi: 10.1371/journal.pone.0066421
30. Rashid M, Mathew J, Raja K. Alteration in ankle kinematics during uneven surface ambulation in stroke survivors: An exploratory observational study. Int J Health Allied Sci. (2020) 9:263. doi: 10.4103/ijhas.IJHAS_20_20
31. Tyson SF, Kent RM. Effects of an ankle-foot orthosis on balance and walking after stroke: a systematic review and pooled meta-analysis. Arch Phys Med Rehabil. (2013) 94:1377–85. doi: 10.1016/j.apmr.2012.12.025
Keywords: stroke, foot, ankle, 3D scan, anthropometry, deformity, geometric morphometrics, ankle-foot-orthosis
Citation: Kim H, Cho J-E, Seo K-J and Lee J (2023) Bilateral ankle deformities affects gait kinematics in chronic stroke patients. Front. Neurol. 14:1078064. doi: 10.3389/fneur.2023.1078064
Received: 24 October 2022; Accepted: 26 January 2023;
Published: 09 February 2023.
Edited by:
Wen-Jun Tu, Chinese Academy of Medical Sciences and Peking Union Medical College, ChinaReviewed by:
Chun Kwang Tan, University of Tsukuba, JapanCopyright © 2023 Kim, Cho, Seo and Lee. This is an open-access article distributed under the terms of the Creative Commons Attribution License (CC BY). The use, distribution or reproduction in other forums is permitted, provided the original author(s) and the copyright owner(s) are credited and that the original publication in this journal is cited, in accordance with accepted academic practice. No use, distribution or reproduction is permitted which does not comply with these terms.
*Correspondence: Hogene Kim,  aG9nZW5la2ltQGtvcmVhLmty; aG9nZW5la2ltQGdtYWlsLmNvbQ==
Disclaimer: All claims expressed in this article are solely those of the authors and do not necessarily represent those of their affiliated organizations, or those of the publisher, the editors and the reviewers. Any product that may be evaluated in this article or claim that may be made by its manufacturer is not guaranteed or endorsed by the publisher.
Research integrity at Frontiers
Learn more about the work of our research integrity team to safeguard the quality of each article we publish.