
94% of researchers rate our articles as excellent or good
Learn more about the work of our research integrity team to safeguard the quality of each article we publish.
Find out more
ORIGINAL RESEARCH article
Front. Neurol., 20 September 2022
Sec. Applied Neuroimaging
Volume 13 - 2022 | https://doi.org/10.3389/fneur.2022.996459
Objective: Even after palatoplasty and speech rehabilitation, patients with cleft lip and palate (CLP) remain to produce pronunciation errors. We hypothesized that nonsyndromic CLP (NSCLP) after speech rehabilitation had structural abnormalities in language-related brain regions. This study investigates structural patterns in NSCLP children after speech rehabilitation using surface-based morphometry (SBM) analysis.
Methods: Forty-two children with NSCLP and 42 age- and gender-matched healthy controls were scanned for 3D T1-weighted images on a 3T MRI scanner. After reconstructing each brain surface, we computed SBM parameters and assessed between-group differences using two-sample t-tests and permutation tests (5,000 times). Then, we assessed the relationship between the SBM parameters and the Chinese language clear degree scale (CLCDS) using Pearson's correlation analysis.
Result: The speech-rehabilitated children with NSCLP showed lower cortical thickness and higher gyrification index mainly involving left language-related brain regions (permutation tests, p < 0.05). Furthermore, the lower cortical thickness of the left parahippocampal gyrus was positively correlated with CLCDS scores (r = 0.370, p = 0.017) in patients with NSCLP.
Conclusion: The SBM analysis showed that the structural abnormalities of speech-rehabilitated children with NSCLP mainly involved language-related brain regions, especially the dominant cerebral hemisphere. The structural abnormalities of the cortical thickness and folding in the language-related brain regions might be the neural mechanisms of speech errors in NSCLP children after speech rehabilitation. The cortical thickness of the parahippocampal gyrus may be a biomarker to evaluate pronunciation function.
Cleft lip and palate (CLP) is one of the most common craniofacial malformations in infants and is divided into syndromic CLP and nonsyndromic CLP (NSCLP) according to whether the CLP is part of a well-known syndrome (1). NSCLP accounts for 70% of CLP with unclear etiology. The incidence rate of speech disorder, the most common complication of NSCLP, ranges from 22 to 92% (2). Even with early surgical treatment, 30–50% of CLP patients still suffered “cleft palate speech” characterized by hypernasality and/or nasal emission (3). Therefore, cleft repair and speech therapy are the most common methods of cleft palate management (4). However, studies confirmed the residual speech disorders in CLP patients with postsurgical repair and speech therapy, and the percentage of consonant errors ranged from 15 to 22% (5–8). Studies have confirmed brain structural differences in brain regions for patients with CLP before surgery and speech training (9, 10). Thus, we hypothesized that patients with NSCLP after surgery and speech therapy had structural abnormalities in language-related brain regions.
Voxel-based morphometry (VBM) analysis, a common method of assessing brain structure, has confirmed that the gray matter volume was lower in the frontal lobe and higher in the temporal lobe in patients with CLP (11). Besides, gray matter density was higher in the left superior temporal gyrus and fusion (12) and was lower in the bilateral medial frontal cortex (10). Different from VBM analysis, surface-based morphometry (SBM) analysis could measure the cortical thickness (CT) and gyrification index (GI) of every cortical region. A neuroimaging study found that cortical thickness was higher in left pars opercularis and triangularis in CLP children than in healthy peers (13), and cortical folding also changed in adult patients with CLP before and after rehabilitation. Li et al. (14) found that the changes in cortical thickness and gyrification occurred in brain regions related to language, execution, and auditory functions in NSCLP children. However, the abnormalities in the SBM patterns are unclear in NSCLP children after speech rehabilitation.
We hypothesized that regional brain structural abnormalities in the NSCLP children after speech therapy might lead to residual speech errors. Therefore, this study investigated the possible morphological pattern of the cerebral cortex in speech-rehabilitated children with NSCLP using the SBM analysis.
The ethical committee of the Beijing Children's Hospital approved this study, and informed consent was obtained from all subjects and their legal guardian. A total of 42 children (31 boys and 11 girls) with NSCLP (NSCLP group) and 42 age- and gender-matched typical developing healthy controls were recruited for the current study from the Beijing Children's Hospital. The inclusion criteria were as follows: (1) NSCLP patients (ranging from 6 to 16 years) who started the speech therapy 3–6 months after a successful pharyngeal closure surgery, by the frequency of 30 min/day and 3 times/week, lasting for half a year, till they reached the basic point 86 according to the Chinese language clear degree scale (CLCDS) scores; (2) normal vision and hearing (by auditory brainstem response examination below 30 dB nHL); (3) average intelligence [more than 90 scores using the Chinese Wechsler Intelligence Scale for Children-IV (CWISC-IV)]; and (4) right-handed subjects. The exclusion criteria of the patients were as follows: NSCLP patients with clinic diagnoses of (1) dysarthria; (2) velopharyngeal insufficiency; (3) hearing and/or vision impairments; (4) developmental delays; (5) congenital disorders; (6) other syndromes or possible; and (7) other chronic health diseases.
All data were acquired on a 3.0 T GE MRI system at the Department of Radiology (Beijing Children's Hospital). For each subject, high resolution 3D T1-weighted gradient-echo images were acquired with the following parameters: repetition time (TR) = 8.2 ms, echo time (TE) = 3.5 ms, inversion time (TI) = 450 ms, flip angle (FA) = 13°, matrix = 256 × 256, and FOV = 256 × 256, 164 continuous sagittal slices were scanned to cover the whole brain, and slice thickness = 1 mm.
Cortical thickness and gyrification index are widely used in the SBM analysis of structural plasticity. Cortical thickness is a sensitive metric of dynamic brain alterations across development stemming from maturational pruning and experiential neuroplasticity (15), and the gyrification index provides a new method for analyzing brain structure. It focuses on the frequency of gyrus folding, describing either structurally constrained cognitive characteristics or acquired long-term experience-dependent plasticity (16). Moreover, because the gyrification index is characterized by relative lifetime stability, it is suitable as an index of aberrant neurodevelopment (17).
For the SBM analysis, the CAT12 (Computational Anatomy Toolbox, http://dbm.neuro.uni-jena.de/cat/) and SPM12 (statistical parametric mapping, http://www.fil.ion.ucl.ac.uk/spm/) were used within the MATLAB environment. We used this software to reconstruct the cortical surface of each subject and calculate multiple morphometric parameters (18, 19). During the procedure, cortical thickness estimation and the central surface were carried out in one step based on the projection-based thickness (PBT) approach (19). Then, the topology correction, spherical mapping, and spherical registration were performed for cortical thickness and central surface. After that, the gyrification index was extracted from the central surface. Finally, the surface of cortical thickness and gyrification index was resampled and smoothed with a 15-mm filter for each hemisphere. For further statistical analysis, the mean cortical thickness and gyrification index were extracted for 68 ROIs defined by the Desikan-Killiany atlas (20) with CAT12.
Statistical analyses were conducted using the statistical module CAT12/SPM12. The age and gender were taken as covariates, and the between-group differences in the mean regional value of the two morphometric parameters were tested with two-sample t-tests (p < 0.05) and permutation tests 5,000 times (p < 0.05). In addition, the mean values of between-group different regions were calculated for the correlations between the metrics and CLCDS in the NSCLP group using Pearson's correlation analyses (p < 0.05).
Table 1 shows that it was not significant in the age (t = −0.46, p = 0.96), CWISC-IV scores (t = −1.18, p = 0.24), and education years (t = −1.12, p = 0.28) of children between the NSCLP group and healthy controls. The CLCDS scores were 91.45 ± 3.92 in the NSCLP children. The number of boys and girls showed no between-group significant differences in the two groups (χ2 = 0, p = 1).
Figure 1A depicts a whole-brain cortical thickness analysis comparing healthy controls to the NSCLP group, controlling for age and gender with permutation tests (p < 0.05). Compared with healthy controls, the cortical thickness in the bilateral lingual gyrus was lower in the NSCLP group. The thinner cortex was found in additional left hemisphere areas, including the superior/middle frontal and parahippocampal gyrus. In the right hemisphere, the regions of the thinner cortex in the NSCLP group included pericalcarine and cuneus cortices. The size (mm2) of each cluster and the location coordinated at Montreal Neurological Institute (MNI) are shown in Table 2. Compared to healthy controls, the bar plot graph of each cluster with thinner cortex in the NSCLP group was demonstrated in Figure 2.
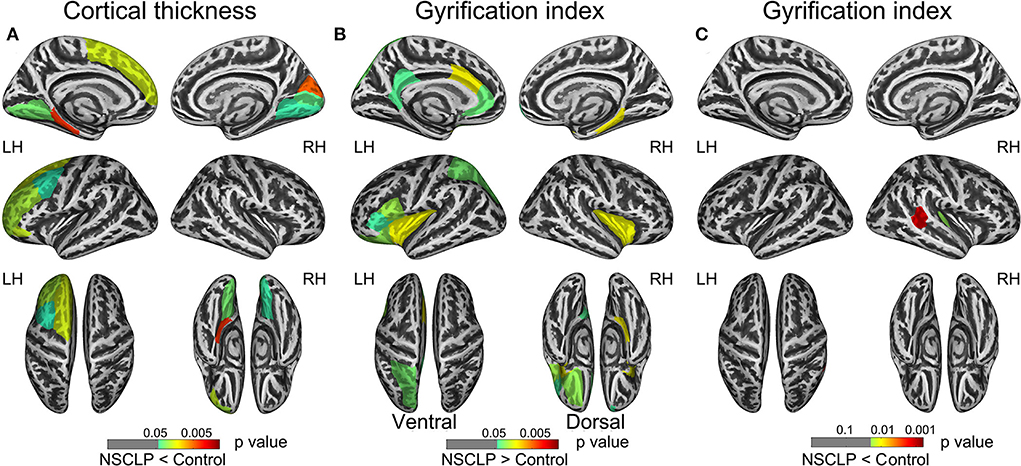
Figure 1. shows regions with a significant between-group cortical thickness (CT) and gyrification index (GI). (A) The distribution of regions with lower CT showed in the NSCLP patients. (B,C) The distribution of higher GI (B) and lower GI (C) regions showed in patients with NSCLP. The color bars indicated the p-value. Two-sample t-test (p < 0.05) and permutation tests 5,000 times (p < 0.05). Corrected for age and gender. NSCLP, nonsyndromic cleft lip and palate; LH, left hemisphere; RH, right hemisphere.
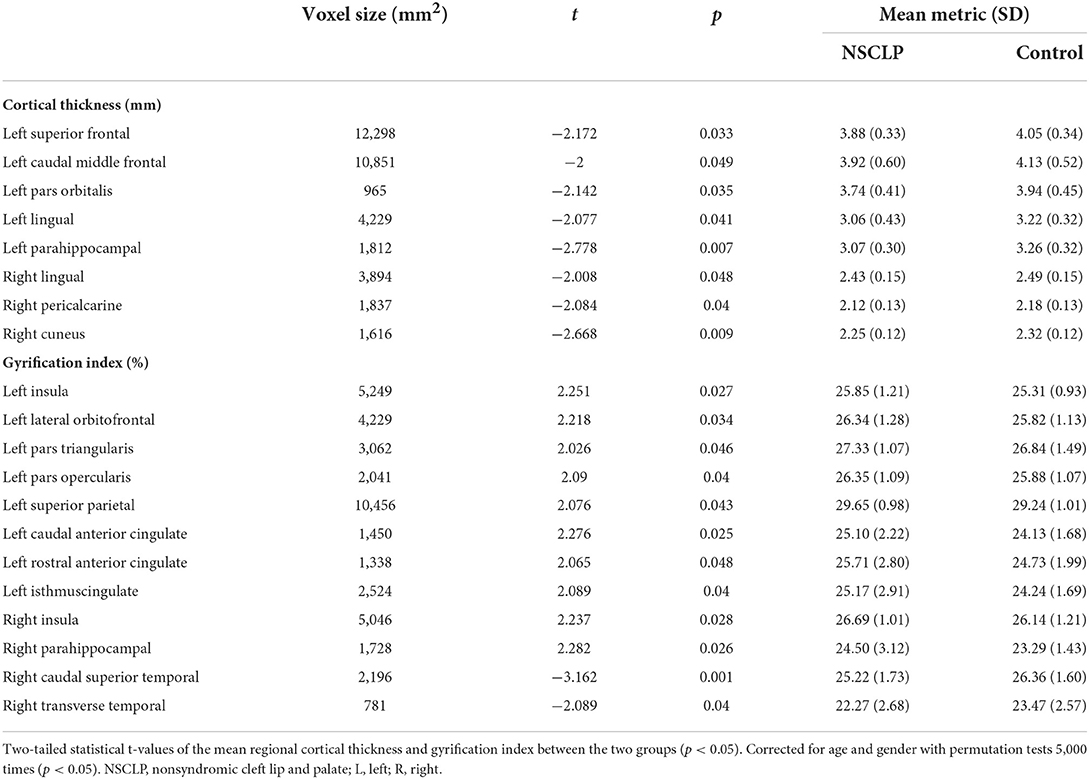
Table 2. Descriptive report of brain regions showing a significant difference (P < 0.05) between patients with NSCLP and healthy controls on cortical thickness and gyrification index.
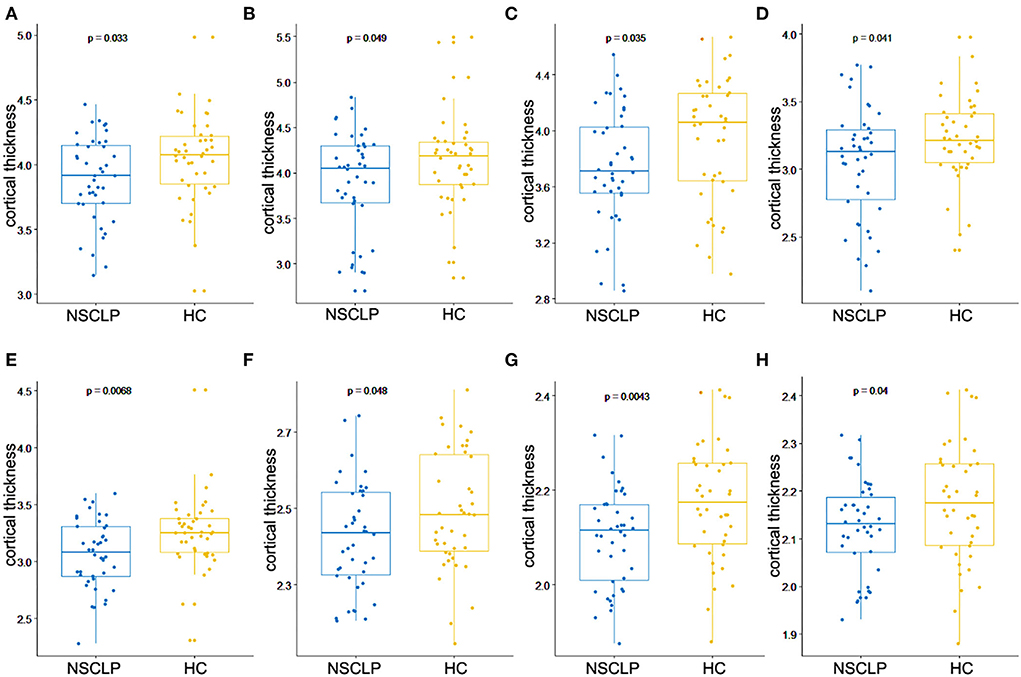
Figure 2. Bar plot for cortical regions showed significant between-group differences in the cortical thickness, including left superior frontal gyrus (A), left middle frontal gyrus (B), left pars orbitalis of inferior frontal gyrus (C), left lingual gyrus (D), left parahippocampal gyrus (E), right lingual gyrus (F), right pericalcarine (G), and right cuneus (H). The blue color represents NSCLP, and the yellow color represents HC (healthy controls).
Figures 1B,C depicts whole-brain regional gyrification index analysis comparing healthy controls to the NSCLP group, controlling for age and gender with permutation tests (p < 0.05). The gyrification index of the bilateral insula gyrus, the right parahippocampal gyrus, and the left hemisphere (lateral orbitofrontal, pars opercularis, pars triangularis, superior parietal, and cingulate gyrus) were higher in the NSCLP group than in healthy controls. Compared to healthy controls, a lower gyrification index was shown in the NSCLP group on the right hemisphere transverse temporal and caudal superior temporal gyrus (p < 0.05). The size (mm2) of each cluster and the location coordinated at Montreal Neurological Institute (MNI) were shown in Table 1. Compared to healthy controls, the bar plot graph of each cluster with a different gyrification index in the NSCLP group was demonstrated in Figure 3.
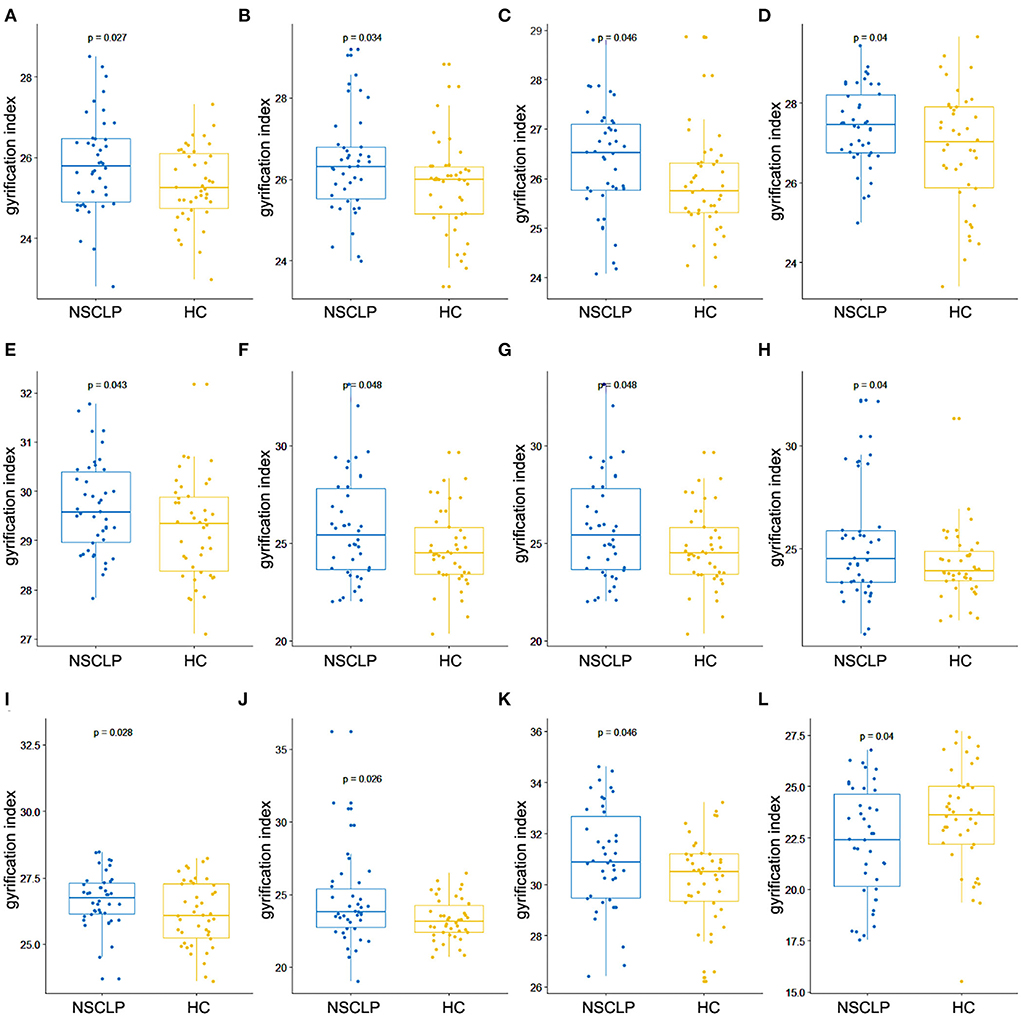
Figure 3. Bar plot for cortical regions showed significant between-group differences in the gyrification index. Left insula (A), left lateral orbitofrontal (B), left pars triangularis (C), left pars opercularis (D), left superior parietal lobule (E), left rostral anterior cingulated (F), left caudal anterior cingulated (G), left isthmus cingulate (H), right insula (I), right parahippocampal (J), right caudal superior temporal (K), and right transverse temporal gyrus (L). The blue color represents NSCLP, and the yellow color represents HC (healthy controls).
The correlations between the cortical morphological parameters and CLCDS scores were calculated, finding a positive correlation between the cortical thickness of the left parahippocampal gyrus and CLCDS scores (r = 0.370, p = 0.017) in the NSCLP group (Figure 4).
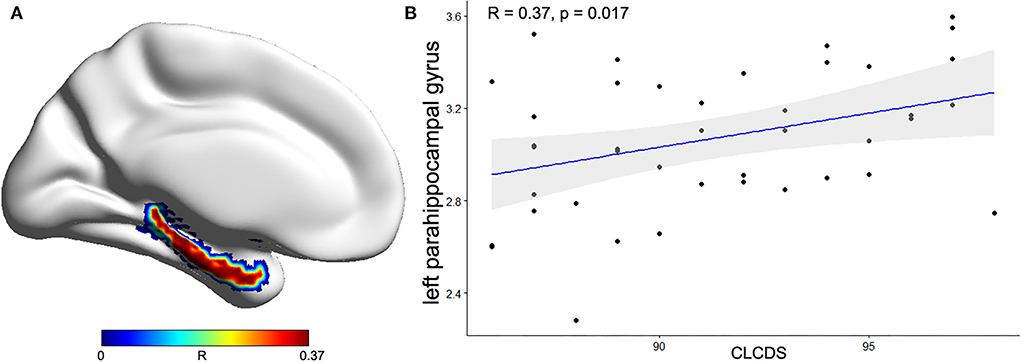
Figure 4. (A) The correlation coefficient of the left parahippocampal gyrus between the mean cortical thickness (CT) and CLCDS scores was projected onto the cortical surface. (B) The positive correlation between the mean CT of the left parahippocampal gyrus and CLCDS scores in the NSCLP group. The color bars indicated R-value. CLCDS, Chinese language clear degree scale.
This study investigated the surface-based morphological patterns of patients with NSCLP after speech rehabilitation. Compared with healthy controls, the differences in cortical thickness and gyrification index were identified primarily in the language-related brain regions in speech-rehabilitated patients with NSCLP. Furthermore, the cortical thickness of the left parahippocampal gyrus showed a positive correlation with the CLCDS scores.
Consistent with our hypothesis, we identified that the residual speech errors in NSCLP children after speech rehabilitation demonstrated a Thinner cortex than healthy controls in language-related brain areas, including the left superior frontal gyrus, left caudal middle frontal, left pars orbitalis, left parahippocampal, right pericalcarine, right cuneus, and bilateral lingual. The left superior frontal and middle frontal gyrus were crucial areas of the dorsal phonological processing stream (21). At the same time, the cuneus, pericalcarine cortices, and lingual gyrus were essential brain regions in the ventral visual pathway (22) and the reading circuitry (23). The parahippocampal gyrus is involved in increasing expertise (24, 25). Previous studies confirmed that expertise training, e.g., simultaneous interpretation learning (26) and diving training (25), could increase cortical thickness. Our result found that the cortical thickness of the language-related brain areas in NSCLP children after speech therapy still did not reach an average level, which indicated that the speech-rehabilitated children with NSCLP also had structural brain differences.
The declining period of the gyrification index describes the fine-tuning process during the school-aged child period for cortical maturation (27). In this period, a previous study confirmed that developmental dyslexia could lead to an increased gyrification index (28). Moreover, expertise training induces the deceased gyrification index, such as diving training (29).
The higher gyrification indexes were detected in the insula, lateral orbitofrontal cortices, pars opercularis, pars triangularis, superior parietal lobule, and cingulate gyrus of the left hemisphere and in the insula and parahippocampal gyrus of the right hemisphere. The pars triangularis and pars opercularis belong to Broca's area, which was related to the motor function of language (30). In our study, all subjects were at age 6–16. Thus, they were in the declining period of the gyrification index. The higher gyrification index of these language-related brain regions suggested immature neural circuitry, which might result from the speech dysfunctions of NSCLP children. Our result showed that the higher gyrification index did not develop to normal levels in NSCLP children after speech therapy, indicating structural-developmental disorders.
The insular cortex, lateral orbitofrontal cortices, pars opercularis, pars triangularis, and superior parietal lobule are associated with phonological processing (21, 31). The cingulate gyrus is concerned with assessing the spatial, context, and personal relevance of sensory information (32). Therefore, this abnormal brain structural development may be closely related to speech disorders. A study found increased gyrification of parietal, frontal, and temporal lobes in adults with NSCLP after articulation rehabilitation (14), similar to our research.
Moreover, the lower gyrification indexes were located in the right transverse and caudal superior temporal gyrus. The caudal superior temporal belongs to Wernicke's area, the sensory language center (33). The transverse temporal gyrus is involved in acoustic signal perception (34). Besides, the caudal superior temporal gyrus is demonstrated to transfer language sound into phonemes from the transverse temporal gyrus (21). The decreased gyrification index suggested that neural connections in these regions were strengthened for cortical maturation (27). Therefore, we could infer that not only the earliest sound process of the right transverse temporal and causal superior temporal gyrus was not impaired, but also more sound information of speech therapy through these brain regions led to the neuroplasticity, describing the lower gyrification index.
Additionally, the correlation analysis showed that the mean cortical thickness of the left parahippocampal gyrus was positively correlated with the CLCDS scores. The parahippocampus, an important memory brain region, receives input from other brain regions and processes several types of sensory information (35). Li et al. (14) found that changed attention and language networks and working-memory brain structures (hippocampal and parahippocampal gyrus) were related to impaired language function. Our results suggested that the cortical thickness in the left parahippocampal gyrus was closely related to pronunciation function in the NSCLP children, indicating the state of pronunciation function. Furthermore, the mean cortical thickness of the left parahippocampal gyrus was lower in the NSCLP group than in healthy controls, which suggested that the damage to the parahippocampal gyrus might prevent the pronunciation function recovery. The lower cortical thickness of the left parahippocampal gyrus might be underlying neural mechanisms in NSCLP children after speech therapy, which might be a biomarker for evaluating pronunciation function.
This study still has some limitations. First, more subjects should be enrolled in further studies. Second, more work focused on the investigation of the differences in both functional and structural abnormalities for CLP children before speech therapy should be done in the future. Third, the CLP patients with special consonant pronunciation errors, such as affricates, would be further estimated for the changes in the brain structures in the future.
In our study, the speech-rehabilitated children with NSCLP had speech errors clinically and neuroimaging abnormalities structurally. The structural impairments of cortical thickness and folding in the language-related brain regions might be the neural mechanisms of speech errors in NSCLP children after speech rehabilitation. Moreover, the cortical thickness of the left parahippocampal gyrus might indicate pronunciation function in NSCLP children after speech rehabilitation.
The original contributions presented in the study are included in the article/supplementary material, further inquiries can be directed to the corresponding author/s.
The studies involving human participants were reviewed and approved by the Ethical Committee of the Beijing Children's Hospital. Written informed consent to participate in this study was provided by the participants' legal guardian/next of kin.
SW: conceptualization and writing—reviewing and editing. LF: writing—original draft and investigation. GM: methodology, software, and formal analysis. ZL: project administration, validation, and data curation. BR: resources and supervision. HC: funding acquisition. All the authors have read and approved the final manuscript.
This research was partly supported by the research fund from the Medical Sci-Tech Innovation Platform of Zhongnan Hospital, Wuhan University (PTXM2022020) and the Cultivate Plan of the Beijing Municipal Administration of Hospital (PX2018047).
The authors declare that the research was conducted in the absence of any commercial or financial relationships that could be construed as a potential conflict of interest.
All claims expressed in this article are solely those of the authors and do not necessarily represent those of their affiliated organizations, or those of the publisher, the editors and the reviewers. Any product that may be evaluated in this article, or claim that may be made by its manufacturer, is not guaranteed or endorsed by the publisher.
1. Dixon MJ, Marazita ML, Beaty TH, Murray JC. Cleft lip and palate: understanding genetic and environmental influences. Nat Rev Genet. (2011) 12:167–78. doi: 10.1038/nrg2933
2. Ruiter J, Korsten-Meijer A, Goorhuis-Brouwer S. Communicative abilities in toddlers and in early school age children with cleft palate. Int J Pediatr Otorhinolaryngol. (2009) 73:693–8. doi: 10.1016/j.ijporl.2009.01.006
3. Priester G, Goorhuis-Brouwer S. Speech and language development in toddlers with and without cleft palate. Int J Pediatr Otorhinolaryngol. (2008) 72:801–6. doi: 10.1016/j.ijporl.2008.02.004
4. Swift CC, Eklund MJ, Kraveka JM, Alazraki AL. Updates in diagnosis, management, and treatment of neuroblastoma. Radiographics. (2018) 38:566–80. doi: 10.1148/rg.2018170132
5. Ysunza A, Pamplona M, Femat T, Mayer I, García-Velasco M. Videonasopharyngoscopy as an instrument for visual biofeedback during speech in cleft palate patients. Int J Pediatr Otorhinolaryngol. (1997) 41:291–8. doi: 10.1016/S0165-5876(97)00096-7
6. Gibbon FE, Crampin L. An electropalatographic investigation of middorsum palatal stops in an adult with repaired cleft palate. Cleft Palate Craniofac J. (2001) 38:96–105. doi: 10.1597/1545-1569_2001_038_0096_aeiomp_2.0.co_2
7. Ysunza A, Pamplona MC, Molina F, Hernández A. Surgical planning for restoring velopharyngeal function in velocardiofacial syndrome. Int J Pediatr Otorhinolaryngol. (2009) 73:1572–5. doi: 10.1016/j.ijporl.2009.08.007
8. Willadsen E, Boers M, Schöps A, Kisling-Møller M, Nielsen JB, Jørgensen LD, et al. Influence of timing of delayed hard palate closure on articulation skills in 3-year-old Danish children with unilateral cleft lip and palate. Int J Lang Commun Disord. (2018) 53:130–43. doi: 10.1111/1460-6984.12331
9. Huang S, Yang F, Ding GC, Xiang K, Mcpherson B. A MRI study of auditory center of Infants with cleft lip and/or palate. J Clin Stomatol. (2012) 28:430–2. doi: 10.3969/j.issn.1003-1634.2012.07.017
10. Xie N, Yang F, Gan YG. Structural MRI of the cognition associated brain regions in children with cleft lip and palate. Chin J CT MRI. (2012) 10:14–7. doi: 10.3969/j.issn.1672-5131.2012.03.005
11. Nopoulos P, Langbehn DR, Canady J, Magnotta V, Richman L. Abnormal brain structure in children with isolated clefts of the lip or palate. Arch Pediatr Adolesc Med. (2007) 161:753–8. doi: 10.1001/archpedi.161.8.753
12. Xie N, Yang F, Gan YG, Shu H, Xiang K, Lin F. Voxel-based morphometry of brain structural characteristics in children with cleft lip and/or palate. Chin J Biomed Eng. (2010) 16:363–6. doi: 10.3760/cma.j.issn.1674-1927.2010.04.019
13. Adamson CL, Anderson VA, Nopoulos P, Seal ML, Da Costa AC. Regional brain morphometric characteristics of nonsyndromic cleft lip and palate. Dev Neurosci. (2014) 36:490–8. doi: 10.1159/000365389
14. Li Z, Zhang W, Li C, Wang M, Wang S, Chen R, et al. Articulation rehabilitation induces cortical plasticity in adults with non-syndromic cleft lip and palate. Aging. (2020) 12:13147–59. doi: 10.18632/aging.103402
15. Vijayakumar N, Allen NB, Youssef G, Dennison M, Yücel M, Simmons JG, et al. Brain development during adolescence: a mixed-longitudinal investigation of cortical thickness, surface area, and volume. Hum Brain Mapp. (2016) 37:2027–38. doi: 10.1002/hbm.23154
16. Duret P, Samson F, Pinsard B, Barbeau EB, Boré A, Soulières I, et al. Gyrification changes are related to cognitive strengths in autism. Neuroimage Clin. (2018) 20:415–23. doi: 10.1016/j.nicl.2018.04.036
17. Mutlu AK, Schneider M, Debbané M, Badoud D, Eliez S, Schaer M. Sex differences in thickness, and folding developments throughout the cortex. Neuroimage. (2013) 82:200–7. doi: 10.1016/j.neuroimage.2013.05.076
18. Luders E, Narr KL, Thompson PM, Rex DE, Woods RP, Deluca H, et al. Gender effects on cortical thickness and the influence of scaling. Hum Brain Mapp. (2006) 27:314–24. doi: 10.1002/hbm.20187
19. Dahnke R, Yotter RA, Gaser C. Cortical thickness and central surface estimation. Neuroimage. (2013) 65:336–48. doi: 10.1016/j.neuroimage.2012.09.050
20. Desikan RS, Ségonne F, Fischl B, Quinn BT, Dickerson BC, Blacker D, et al. An automated labeling system for subdividing the human cerebral cortex on MRI scans into gyral based regions of interest. Neuroimage. (2006) 31:968–80. doi: 10.1016/j.neuroimage.2006.01.021
21. Fujii M, Maesawa S, Ishiai S, Iwami K, Futamura M, Saito K. Neural basis of language: an overview of an evolving model. Neurol Med Chir. (2016) 56:379–86. doi: 10.2176/nmc.ra.2016-0014
22. Freud E, Plaut DC, Behrmann M. 'What' is happening in the dorsal visual pathway. Trends Cogn Sci. (2016) 20:773–84. doi: 10.1016/j.tics.2016.08.003
23. Wandell BA, Le RK. Diagnosing the neural circuitry of reading. Neuron. (2017) 96:298–311. doi: 10.1016/j.neuron.2017.08.007
24. Wei G, Luo J. Sport expert's motor imagery: functional imaging of professional motor skills and simple motor skills. Brain Res. (2010) 1341:52–62. doi: 10.1016/j.brainres.2009.08.014
25. Wei G, Zhang Y, Jiang T, Luo J. Increased cortical thickness in sports experts: a comparison of diving players with the controls. PLoS ONE. (2011) 6:e17112. doi: 10.1371/journal.pone.0017112
26. Hervais-Adelman A, Moser-Mercer B, Murray MM, Golestani N. Cortical thickness increases after simultaneous interpretation training. Neuropsychologia. (2017) 98:212–9. doi: 10.1016/j.neuropsychologia.2017.01.008
27. Kochunov P, Glahn DC, Fox PT, Lancaster JL, Saleem K, Shelledy W, et al. Genetics of primary cerebral gyrification: heritability of length, depth and area of primary sulci in an extended pedigree of Papio baboons. Neuroimage. (2010) 53:1126–34. doi: 10.1016/j.neuroimage.2009.12.045
28. Williams VJ, Juranek J, Cirino P, Fletcher JM. Cortical thickness and local gyrification in children with developmental dyslexia. Cereb Cortex. (2018) 28:963–73. doi: 10.1093/cercor/bhx001
29. Zhang Y, Zhao L, Bi W, Wang Y, Wei G, Evans A, et al. Effects of long-term diving training on cortical gyrification. Sci Rep. (2016) 6:28243. doi: 10.1038/srep28243
30. Fedorenko E, Blank IA. Broca's area is not a natural kind. Trends Cogn Sci. (2020) 24:270–84. doi: 10.1016/j.tics.2020.01.001
31. Price CJ. The anatomy of language: contributions from functional neuroimaging. J Anat. (2000) 197 (Pt 3):335–59. doi: 10.1046/j.1469-7580.2000.19730335.x
32. Bar M, Aminoff E. Cortical analysis of visual context. Neuron. (2003) 38:347–58. doi: 10.1016/S0896-6273(03)00167-3
33. Binder JR. Current controversies on Wernicke's area and its role in language. Curr Neurol Neurosci Rep. (2017) 17:58. doi: 10.1007/s11910-017-0764-8
34. Mikell CB, McKhann GM. Categorical speech representation in human superior temporal gyrus. Neurosurgery. (2010) 67:N19–20. doi: 10.1227/01.neu.0000390615.58208.a8
Keywords: nonsyndromic cleft lip and palate, speech therapy, cortical thickness, gyrification index, surface-based morphometry
Citation: Wang S, Fang L, Miao G, Li Z, Rao B and Cheng H (2022) Atypical cortical thickness and folding of language regions in Chinese nonsyndromic cleft lip and palate children after speech rehabilitation. Front. Neurol. 13:996459. doi: 10.3389/fneur.2022.996459
Received: 17 July 2022; Accepted: 24 August 2022;
Published: 20 September 2022.
Edited by:
Yangming Ou, Harvard Medical School, United StatesReviewed by:
Mohammad Arafat Hussain, Harvard Medical School, United StatesCopyright © 2022 Wang, Fang, Miao, Li, Rao and Cheng. This is an open-access article distributed under the terms of the Creative Commons Attribution License (CC BY). The use, distribution or reproduction in other forums is permitted, provided the original author(s) and the copyright owner(s) are credited and that the original publication in this journal is cited, in accordance with accepted academic practice. No use, distribution or reproduction is permitted which does not comply with these terms.
*Correspondence: Zhichao Li, MzU3MTY5NDg2QHFxLmNvbQ==; Bo Rao, cmFvMjE0M0AxMjYuY29t; Hua Cheng, Y2hodWFlckBob3RtYWlsLmNvbQ==
†These authors have contributed equally to this work and share first authorship
Disclaimer: All claims expressed in this article are solely those of the authors and do not necessarily represent those of their affiliated organizations, or those of the publisher, the editors and the reviewers. Any product that may be evaluated in this article or claim that may be made by its manufacturer is not guaranteed or endorsed by the publisher.
Research integrity at Frontiers

Learn more about the work of our research integrity team to safeguard the quality of each article we publish.