
94% of researchers rate our articles as excellent or good
Learn more about the work of our research integrity team to safeguard the quality of each article we publish.
Find out more
ORIGINAL RESEARCH article
Front. Neurol., 01 July 2022
Sec. Neurological Biomarkers
Volume 13 - 2022 | https://doi.org/10.3389/fneur.2022.888511
This article is part of the Research TopicDetection of Cerebral Small Vessel DiseaseView all 4 articles
 Timothy J. Libecap1
 Valentinos Zachariou1
 Christopher E. Bauer1
 Donna M. Wilcock2,3
 Gregory A. Jicha3,4
 Flavius D. Raslau5
 Brian T. Gold1,3,6*
Emerging evidence suggests that enlarged perivascular spaces (ePVS) may be a clinically significant neuroimaging marker of global cognitive function related to cerebral small vessel disease (cSVD). We tested this possibility by assessing the relationship between ePVS and both a standardized measure of global cognitive function, the Montreal Cognitive Assessment (MoCA), and an established marker of cSVD, white matter hyperintensity volume (WMH) volume. One hundred and eleven community-dwelling older adults (56–86) underwent neuroimaging and MoCA testing. Quantification of region-specific ePVS burden was performed using a previously validated visual rating method and WMH volumes were computed using the standard ADNI pipeline. Separate linear regression models were run with ePVS as a predictor of MoCA scores and whole brain WMH volume. Results indicated a negative association between MoCA scores and both total ePVS counts (P ≤ 0.001) and centrum semiovale ePVS counts (P ≤ 0.001), after controlling for other relevant cSVD variables. Further, WMH volumes were positively associated with total ePVS (P = 0.010), basal ganglia ePVS (P ≤ 0.001), and centrum semiovale ePVS (P = 0.027). Our results suggest that ePVS burden, particularly in the centrum semiovale, may be a clinically significant neuroimaging marker of global cognitive dysfunction related to cSVD.
Cerebral small vessel disease (cSVD) is a major contributor to cognitive impairment in older adults (1–4). cSVD is often characterized by the presence of lacunes, microbleeds, and white matter hyperintensities (WMHs) on magnetic resonance imaging (5–7). Accumulating evidence suggests that enlarged perivascular spaces (ePVS), may also be a neuroimaging marker of cSVD (5, 8–13). ePVS refer to larger than typical fluid-filled spaces along perforating arteries between the astrocytic endfeet of the blood brain barrier and endothelial cells of the cerebrovascular lumen surrounding small arteries (8, 14, 15). The etiology of ePVS remains unknown but impaired clearance of waste through the brain's glymphatic system and blood-brain-barrier damage may represent contributing factors (16–19).
Enlarged perivascular spaces were initially considered benign radiological findings (1). More recent cross-sectional evidence demonstrates an increase in ePVS with age and vascular risk factors, including WMH volume, suggesting ePVS may be a marker of cSVD (18, 20–25). Accumulating evidence also suggests a negative association between ePVS and cognitive processes including executive function, processing speed, semantic memory, and visuospatial ability (26–32).
Nevertheless, the clinical significance of ePVS is not clear due to mixed findings associating ePVS with the the Mini-Mental State Exam (MMSE), a standardized measure of global cognitive function. Some previous studies reported a negative relationship between ePVS burden and MMSE scores (33–37), while others reported no relationship (27, 38–41).
Furthermore, the relationship between ePVS burden and scores on the Montreal Cognitive Assessment (MoCA), a widely used measure of global cognitive function and clinical diagnostic status (42–44), remains to be described. The MoCA was developed as an alternative measure of global cognitive function and clinical diagnosis to the MMSE. Multiple studies have demonstrated that the MoCA is a more sensitive measure of early cognitive dysfunction than the MMSE (43–46). Given that ePVS are thought to represent a potential marker of early cognitive dysfunction it is important to assess their association with MoCA scores.
Here we addressed this issue using a previously validated, visual rating method for quantification of region-specific ePVS burden (47, 48). In addition, we investigated the relationship between ePVS burden and WMH volume, a well-established neuroimaging marker of cSVD (5, 49, 50). Our hypothesis was that ePVS would be negatively associated with MoCA scores, and positively associated with WMH volume, which would support the hypothesis that ePVS are clinically significant and may be an early marker of vascular cognitive dysfunction.
One hundred and eleven community-dwelling older adults were initially recruited for the experiment (64 women, age range 56–86). All participants provided informed consent under a protocol approved by the Institutional Review Board of the University of Kentucky. Participants were recruited from an existing longitudinal cohort at the Sanders-Brown Center on Aging (SBCoA) and the Lexington, KY community. Twenty-eight participants were also co-enrolled in the MarkVCID consortium study (51). Participants completed the Montreal Cognitive Assessment (MoCA) (42) within 6 months of their scan date. Participant MoCA scores ranged from 18 to 30. A total of 72 participants had MoCA scores within the cognitively normal range (26–30) while a total of 39 participants had scores within the mild cognitive impairment (MCI) range (18–25).
Exclusion criteria were significant head injury (defined as loss of consciousness for more than 5 min), stroke, neurological disorders (e.g., epilepsy, Alzheimer's disease) or major psychiatric disorders (e.g., schizophrenia, active clinical depression), claustrophobia, pacemakers, the presence of metal fragments or implants that are incompatible with MRI, or significant brain abnormalities detected during imaging. A neuroradiologist (FDR) evaluated the T1W and FLAIR images for evidence of stroke or other clinically relevant abnormalities. This resulted in exclusion of two participants due to evidence of previous stroke (one participant) and hydrocephalus (one participant), not known at the time of enrollment. Three additional participants were excluded due to MoCA scores suggestive of dementia (MoCA <18), an exclusionary criterion for this study. Finally, one participant was excluded on the basis of being a statistical outlier in WMH volume. Detailed characteristics of the final group of 105 participants involved in data analyses are shown in Table 1.

Table 1. Group demographics and mean MoCA scores.
Participants were scanned in a Siemens 3T Prisma scanner (software version E11C), using a 64-channel head coil, at the University of Kentucky's Magnetic Resonance Imaging and Spectroscopy Center (MRISC). Prior to scanning, all participants were screened to ensure magnetic safety for scanning. The following scans were acquired: (1) a 3D multi-echo, T1-weighted magnetization prepared rapid gradient echo (T1) scan, (2) a 3D fluid-attenuated inversion recovery (FLAIR) scan, (3) a 3D, multi-echo gradient-recalled echo scan used for quantitative susceptibility mapping (QSM). Several other sequences were collected during the scanning session related to other scientific questions and are not discussed further here.
The T1 sequence covered the entire brain [1 mm isotropic voxels, 256 × 256 × 176 mm acquisition matrix, parallel imaging (GRAPPA) acceleration = 2, repetition time (TR) = 2,530 ms, inversion time = 1,100 ms, flip angle (FA) = 7°, scan duration = 5.88 min] and had four echoes [first echo time (TE1) = 1.69 ms, echo spacing (ΔTE = 1.86 ms)]. The 3D FLAIR sequence covered the entire brain (1 mm isotropic voxels, 256 × 256 × 176 acquisition matrix, TR = 5,000 ms, TE = 388 ms, inversion time = 1,800 ms, scan duration = 6.45 min). A high-resolution, flow compensated, multi-echo, 3D spoiled GRE sequence with eight echoes (TR/TE1/ΔTE/FA = 24ms/2.98ms/2.53ms/15°) was acquired and used to create QSM images as described elsewhere (52). The entire brain was covered [acquisition matrix = 224 × 224 × 144, parallel imaging (GRAPPA) acceleration = 2, 1.2 mm isotropic voxels and scan duration = 6.18 min].
We used a previously validated, visual rating method for quantification of region-specific ePVS burden developed via collaboration between multiple consortia and intended to standardize ePVS assessment across the field of cSVD research (47). The method involves manually counting ePVS on T1 images, with additional reference to T2 FLAIR images. Counts were performed in each hemisphere in a single, axial slice of T1 images, within four regions of interest that are known to have the greatest burden of ePVS (11, 14, 27, 33, 47, 53): the centrum semiovale, 1 cm above the lateral ventricles (Figure 1A); the basal ganglia, in the plane of the columns of the fornix (Figure 1B); the midbrain, at the level of the cerebral peduncles; the hippocampus, at the level of the midbrain.
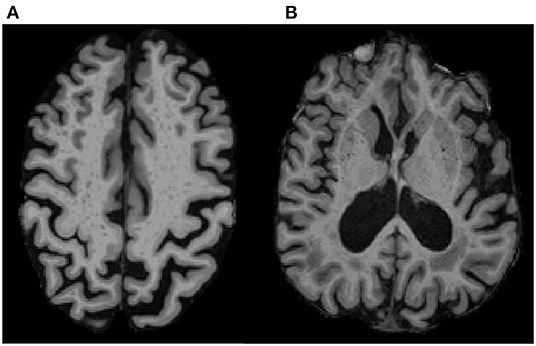
Figure 1. ePVS Regions of Interest on T1 MPRAGE. Examples show ePVS burden in (A) the centrum semiovale (white matter; 10 mm above the lateral ventricles) and in (B) the basal ganglia (gray matter in the putamen and head of caudate in the plane of the columns of the fornix). A high intra-rater reliability was achieved for ePVS (ICC = 0.9) on a subset of 20 randomly selected participants.
Previous work by multiple consortia such as STandards for ReportIng Vascular changes on nEuroimaging (STRIVE) and Uniform Neuro-Imaging of Virchow-Robin Spaces Enlargement (UNIVRSE) have demonstrated the reliability of counting ePVS on T1, with very high correlation to counts on T2 images (5, 27, 48) as well as a high correlation between single-slice and multi-slice counts (47, 48, 54–57). A total ePVS score was created for each participant by combining counts across the four ROIs. All counts were conducted by the lead author (TJL) blinded to participant demographics and under the supervision of an experienced neuroradiologist (FDR), who clarified unclear imaging.
In accordance with STRIVE and UNIVRSE consensus guidelines (5, 8, 48, 58), ePVS were identified using T1, FLAIR and susceptibility weighted images. ePVS were identified as hypointense and less than 3 mm in diameter to differentiate them from lacunes, which tend to be larger (5, 59, 60). ePVS were further differentiated from lacunes based on their lack of hyperintensity on FLAIR (5, 48). ePVS were differentiated from cerebral microbleeds (CMBs) by their absence of prominent associated blooming artifact on QSM. We used QSM for differentiation of ePVS and CMBs due to evidence that QSM images outperform traditional single-echo susceptibility weighted images in this regard (61–66). Intra-rater reliability for ePVS was assessed on a subset of 20 randomly selected participants, using intra-class correlation (ICC).
Whole brain white matter hyperintensity (WMH) volumes were computed using the ADNI pipeline, specifically the UCD WMH segmentation toolkit (Version 1.3), which employs a validated 4-tissue segmentation method (67). Briefly, participants' T1 image [the four echoes averaged into a root mean square (RMS) image] were first registered to their FLAIR image using FLIRT from FMRIB Software Library version 6.0.1 (68). The FLAIR image was then skull stripped, corrected for inhomogeneities using a previously published local histogram normalization (69), and then non-linearly aligned to a standard atlas (67). WMHs were estimated in standard space using Bayesian probability based on histogram fitting and prior probability maps. Voxels labeled as WMHs based on these maps exceeded 3.5 SDs above the mean WM signal intensity. WMH volumes were calculated in participants' native FLAIR space after back-transformation and reported in cubic millimeters.
Statistical analyses were performed using SPSS (IBM, Chicago, IL, USA, version 28), with results considered statistically significant at P < 0.05. Two main linear regression models were performed. The predictor variable in each model was total ePVS count. The dependent variable in the first model was MoCA score and the dependent variable in the second model was whole brain WMH volume. In the case of significant omnibus results, post-hoc comparisons were conducted to assess relationships between ePVS in specific ROIs and MoCA scores or WMH volume. Age, sex, years of education and estimated total intracranial volume were included as covariates in all models. Estimated total intracranial volume (eTIV) was computed using FreeSurfer as described elsewhere (70).
Three additional analyses were run to control for potential confounders in the relationship between ePVS and MoCA scores. In the first follow-up model, we added other cSVD neuroimaging measures as additional covariates (lacune counts and cerebral microbleed counts). In a second follow-up model, we added available self-reported cSVD risk factors as covariates [body mass index (BMI), hypertension, and diabetes]. Finally, due to a correlation between ePVS counts and whole brain WMH volume, post-hoc regression models were conducted to determine if the relationships between ePVS in our ROIs and MoCA scores remained significant after controlling for whole brain WMH volume.
All predictors and dependent variables were tested for the assumption of normality using the Shapiro-Wilk test. Collinearity between predictors in all models was explored using the variance inflation factor (VIF), with a value of 5 implemented as a threshold value (71). For the generation of scatterplot figures, predictor and dependent variable scores were z-scored within our participant sample to aid identification of potential outliers.
High intra-rater reliability was achieved for ePVS (ICC = 0.9) on a subset of 20 randomly selected participants. MoCA scores were skewed (W statistic = 0.914; P ≤ 0.001) and therefore log-transformed. The distribution of whole brain WMH volume was also skewed, as is typical (W statistic = 0.542; P ≤ 0.001), and thus log-transformed. Variance inflation factor for all predictors was <2 and tolerance was >0.5 in all analyses. Error residuals from all ePVS analyses were normally distributed indicating that the assumption of normality was met.
Results indicated that total ePVS counts were negatively associated with MoCA scores (N = 105, β = −0.352, P ≤ 0.001, SE = 0.099, 95% CI = −0.549 to −0.156, VIF = 1.239) after controlling for age, gender, eTIV, and years of education (Figure 2A). Post-hoc comparisons were conducted to assess relationships between ePVS in specific ROIs and MoCA scores. Results indicated that number of ePVS in the centrum semiovale was negatively associated with MoCA scores (N = 105, β = −0.351, P ≤ 0.001, SE = 0.097, 95% CI = −0.543 to −0.160, VIF = 1.179) after controlling for age, gender, eTIV, and years of education (Figure 2B). ePVS in the basal ganglia was marginally associated with MoCA scores (P = 0.07), while hippocampus (P = 0.561), and midbrain (P = 0.447) were not associated with MoCA score.
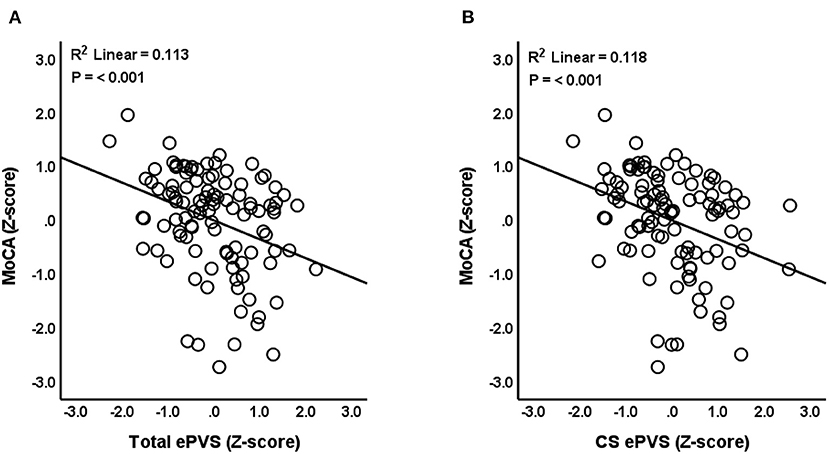
Figure 2. Relationship between ePVS and MoCA scores. The scatterplot shows total ePVS values (A) and centrum semiovale (CS) values (B) plotted against MoCA scores. Standardized (Z-scores) are presented to identify potential outliers.
Next, we assessed the impact of controlling for additional covariates on our observed relationships between ePVS counts and MoCA scores. First, lacunes and cerebral microbleeds, known cSVD neuroimaging markers, were added as continuous covariates. The relationship between total ePVS and MoCA (P = 0.002) as well as the relationship between centrum semiovale ePVS and MoCA (P ≤ 0.001) remained significant. ePVS in the basal ganglia (P = 0.205), hippocampus (P = 0.579), and midbrain (P = 0.629) were still not associated with MoCA score.
Second, we investigated participant-reported risk factors of cSVD as covariates in the ePVS-MoCA model. BMI was treated as a continuous variable and hypertension and diabetes were treated as dichotomous variables. Once again, the relationship between total ePVS and MoCA (P = 0.002), as well as the relationship between centrum semiovale ePVS and MoCA (P = 0.001), remained significant. ePVS in the basal ganglia (P = 0.145), hippocampus (P = 0.629), and midbrain (P = 0.542) were not associated with MoCA score.
Neither the addition of other neuroimaging markers of cSVD as covariates in our models, nor the addition of cSVD risk factors, affected the significance of our results. Therefore, we summarize statistical values (Table 2) and present figures (Figure 2) from the original linear regression model which includes age, gender, years of education, and eTIV as covariates.

Table 2. Linear regression analyses: relationship between ePVS and MoCA scores or WMH Volume.
Linear regression models were used to evaluate the relationship between ePVS and WMH volume. Results indicated that total ePVS count was positively associated with whole brain WMH volume (N = 104, β = 0.245, P = 0.010, SE = 0.093, 95% CI = 0.060–0.430, VIF =1.239) after controlling for age, sex, eTIV, and years of education (Figure 3A). Post-hoc comparisons indicated that basal ganglia ePVS were positively associated with whole brain WMH volume (N = 104, β = 0.324, P ≤ 0.001, SE = 0.089, 95% CI = 0.148–0.500, VIF = 1.191) (Figure 3B). In addition, centrum semiovale ePVS were positively associated with whole-brain WMH volume (N = 104, β = 0.206, P = 0.027, SE = 0.092, 95% CI = 0.023–0.388, VIF = 1.179) (Figure 3C). ePVS in the midbrain (P = 0.117) and hippocampus (P = 0.860) were not significantly related to WMH volume. Linear regression statistical values for the relationships between WMH volume and ePVS by ROI are reported in Table 2.
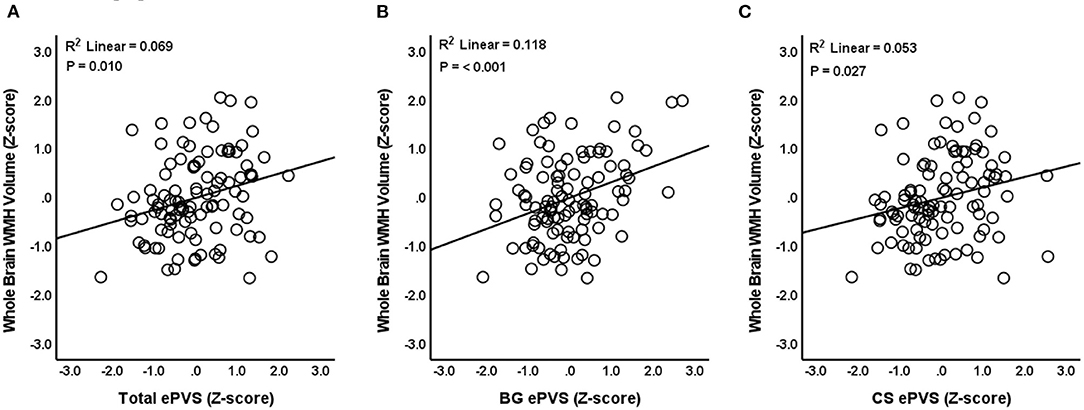
Figure 3. Relationship between ePVS and whole brain WMH volume. The scatterplot shows total ePVS values (A), basal ganglia (BG) values (B), and centrum semiovale (CS) values (C) plotted against whole brain WMH volume. Standardized (Z-scores) are presented to identify potential outliers.
Consistent with our hypotheses, our results thus far indicate a relationship between ePVS and both MoCA and WMH volume. In order to determine if our hypothesized relationship between ePVS and MoCA is independent of WMH volume, a final set of regression models were conducted between ePVS and MoCA scores after controlling for whole brain WMH volume. Standard covariates of age, gender, eTIV, and education were also included. The relationship between total ePVS and MoCA (N = 104, β = −0.358, P ≤ 0.001, SE = 0.104, 95% CI = −0.564 to −0.153, VIF = 1.326) as well as the relationship between centrum semiovale ePVS and MoCA (N = 104, β = −0.354, P ≤ 0.001, SE = 0.100, 95% CI = −0.552 to −0.155, VIF = 1.240) remained significant after controlling for total WMH volume. ePVS in the basal ganglia (P = 0.094), hippocampus (P = 0.572), and midbrain (P = 0.386) were still not associated with MoCA scores. Statistical values for these relationships across all ROIs are reported in Table 3.
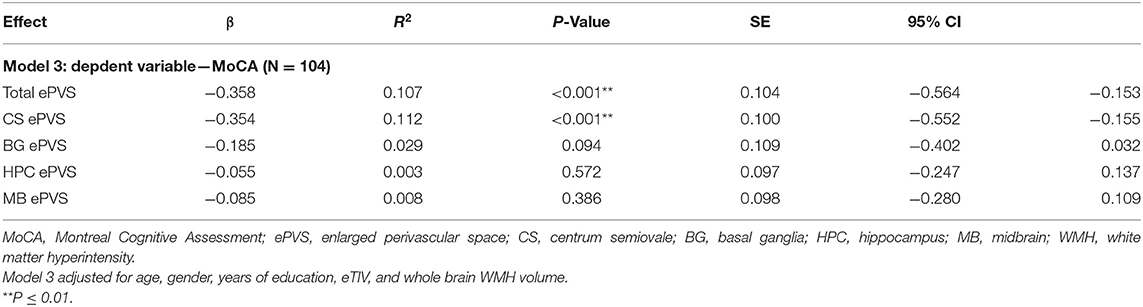
Table 3. Linear regression analyses: relationship between ePVS and MoCA scores controlling for whole brain WMH volume.
We explored cross-sectional relationships between enlarged perivascular spaces (ePVS) and both scores on the Montreal Cognitive Assessment (MoCA) and white matter hyperintensity (WMH) volume. Our results show that a greater ePVS burden in community-dwelling older adults is associated with lower scores on the MoCA, after controlling for age, gender, eTIV and years of education. Additional models controlling for other relevant cSVD variables did not change our results. Further, greater ePVS burden was also associated with higher WMH volume. Our results add to growing evidence that ePVS are clinically significant and may represent an early marker of vascular cognitive dysfunction.
Our results indicate that total ePVS count, assessed within brain regions exhibiting relatively high ePVS burden, was negatively associated with scores on the MoCA in a cohort of community-dwelling older adults. Our results are among the first to our knowledge to demonstrate a negative association between ePVS burden and MoCA scores. Previous studies exploring the association between ePVS with scores on another global cognitive screening tool, the Mini-Mental State Exam (MMSE), have yielded mixed results, as described in the Introduction. The reasons for these mixed results remain unclear but may include lower sensitivity of the MMSE for early cognitive dysfunction compared to the MoCA (43, 72–74). In the present study we were unable to assess the relationship between ePVS and the MMSE because only a subset of participants completed the MMSE and the range of scores was narrow (range = 25–30). Future studies should directly compare the strength of associations between ePVS and both MoCA and MMSE scores.
Our follow-up ROI analyses showed that global cognitive function measured by the MoCA appears to be particularly sensitive to ePVS burden in the centrum semiovale. The relationship between ePVS in the basal ganglia and MoCA approached significance (P = 0.07), while neither ePVS in the hippocampus nor the midbrain were associated with MoCA scores. The centrum semiovale is a large area of white matter located above the lateral ventricles and includes projection, association, and commissural tracts. It includes ascending and descending connections between neocortical regions and subcortical regions including thalamus and basal ganglia. As such, the centrum semiovale includes key portions of the fronto-striatal-thalamic pathway, a circuit known to contribute to executive functions (75, 76). Furthermore, previous studies have demonstrated that the integrity of centrum semiovale white matter plays a role in cognition throughout the lifespan (77–80). The present results add to this literature by demonstrating that ePVS burden in the centrum semiovale may have a more prominent effect on global cognitive function assessed by the MoCA than ePVS in other brain regions we investigated.
Next, to anchor our results firmly within the existing ePVS literature, we assessed the cross-sectional relationships between ePVS burden and WMH volume. Our results indicated that total ePVS were positively associated with whole brain WMH volume after controlling for age, gender, eTIV and years of education. These results are in-line with previous reports in cognitively normal participants (81–83), participants with cerebral small vessel disease (14, 84–86), and cognitively impaired participants (22, 23, 33).
Our follow-up ROI analyses showed that ePVS in the centrum semiovale and basal ganglia were positively related to whole-brain WMH volume. This is consistent with previous studies that demonstrated relationships between WMHs and ePVS in the centrum semiovale (82, 86) and between WMHs and ePVS in the basal ganglia (14, 22, 34, 81, 82, 84, 86). Despite tendency for ePVS and WMH volume to co-occur, our post-hoc analyses showed that the relationships we observed between ePVS and MoCA remained significant after controlling for WMH volume. While intriguing, this result stemmed from a post-hoc, exploratory analysis and will require future longitudinal studies in order to allow interpretation.
Overall, our results suggest that ePVS burden in the centrum semiovale was associated with both general cognitive function and WMH volume whereas ePVS in the basal ganglia was associated with WMH volume. It is possible that ePVS in the centrum semiovale and the basal ganglia may differ in etiology or that this finding may be more related to differential functions of the centrum semiovale and basal ganglia in regards to MoCA performance. Centrum semiovale ePVS have been linked to cerebral amyloid angiopathy and β-amyloid deposition (22, 87–89). In contrast, ePVS in the basal ganglia have been more closely associated with hypertensive arteriopathy (22, 87). The differences between ePVS in the centrum semiovale and basal ganglia should be further explored to understand the independent and synergistic contributions to cognitive dysfunction and WMH burden.
Strengths of our study generally relate to both clinical usefulness and clinical meaningfulness. Clinical usefulness is supported by our use of a validated method for visual rating of ePVS (47, 48) focusing on a single representative slice in key ROIs shown to have the highest ePVS burden. We demonstrated high intra-rater reliability using this method. In addition, the counting procedure does not require advanced neuroimaging analysis skills that may be less typically employed in clinical environments. Similarly, the MoCA enables a brief, sensitive assessment of global cognitive function that is routinely performed in clinical settings (42, 43, 73, 90). Additional strengths include treating ePVS as a continuous variable in our analyses, which more accurately reflects the biologically continuous nature of ePVS burden than categorical rating scales. Finally, our study utilized a moderately large study sample size including a wide age range of older adults.
This study has limitations that highlight the need for additional follow-up studies. First, our cross-sectional study cannot determine if ePVS predict cognitive dysfunction and white matter damage. Future research using longitudinal imaging and clinical data collection is needed to identify if ePVS are baseline predictors of longitudinal cognitive decline and WMH change. While longitudinal studies are the gold-standard for investigating the predictive capacity of ePVS, results from cross-sectional studies such as the present one may prove useful in optimizing the selection of relevant variables for use in future longitudinal ePVS studies. It should also be noted that our cohort included primarily highly educated, White participants. Our findings will need to be replicated in more diverse cohorts. Future studies should also explore the associations between ePVS and MoCA scores in a more clinically heterogeneous set of participants, including those with dementia.
Finally, future longitudinal studies should consider mechanistic contributions to ePVS development. For example, longitudinal studies considering the potential contributions of biofluid markers of AD, atrophy, and inflammatory processes to subsequent ePVS development could prove informative (12, 14, 17, 18, 86, 91–93). In particular, the inflammatory processes of arterial stiffening and blood-brain-barrier breakdown are both established markers of cSVD and should be explored as predictors of ePVS development or as modifiers of ePVS effects on global cognition (10, 17, 24, 94–96). A better understanding of the potential mechanisms of perivascular space enlargement could point to early intervention targets intended to slow or prevent cognitive dysfunction.
Our results indicate that ePVS burden in older adults is negatively associated with performance on the MoCA, a standardized clinical measure of global cognitive function. Further, ePVS burden was positively associated with WMH volume, an established marker of cSVD. Our results are consistent with a view that ePVS are clinically significant and motivate future longitudinal studies exploring the accuracy of ePVS in predicting subsequent cognitive decline and cSVD progression.
The raw data supporting the conclusions of this article will be made available by the authors, without undue reservation.
The studies involving human participants were reviewed and approved by Institutional Review Board of the University of Kentucky. The patients/participants provided their written informed consent to participate in this study.
TL: conceptualization, data collection, data curation, methodology, formal analysis, writing (original draft), and writing (review and editing). VZ and CB: data collection, data curation, methodology, and writing (review and editing). DW and GJ: data collection, data curation, and writing (review and editing). FR: conceptualization, data collection, methodology, and writing (review and editing). BG: conceptualization, data curation, methodology, formal analysis, writing (review and editing), supervision, project administration, and funding acquisition. All authors contributed to the article and approved the submitted version.
This work was supported by the National Institutes of Health (grant numbers NIA R01 AG055449, NIA R01 AG068055, NINDS RF1 NS122028, NIA P30 AG072946, NINDS UH3 NS100606, NINDS UF1 NS125488, NIGMS S10 OD023573, and NIH Training Grant T32 AG 05746105). This work was also supported by an award from the American Heart Association (TL).
The content is solely the responsibility of the authors and does not necessarily represent the official views of these granting agencies.
The authors declare that the research was conducted in the absence of any commercial or financial relationships that could be construed as a potential conflict of interest.
All claims expressed in this article are solely those of the authors and do not necessarily represent those of their affiliated organizations, or those of the publisher, the editors and the reviewers. Any product that may be evaluated in this article, or claim that may be made by its manufacturer, is not guaranteed or endorsed by the publisher.
The authors thank Beverly Meacham and Eric Foreman for assisting with MRI scanning and Beatriz Rolopho, Elayna Seago, and Tiara Starks for early conceptual discussions.
1. Greenberg SM. Small vessels, big problems. N Engl J Med. (2006) 354:1451–3. doi: 10.1056/NEJMp068043
2. Gorelick PB, Scuteri A, Black SE, DeCarli C, Greenberg SM, Iadecola C, et al. Vascular contributions to cognitive impairment and dementia. Stroke. (2011) 42:2672–713. doi: 10.1161/STR.0b013e3182299496
3. Corriveau RA, Bosetti F, Emr M, Gladman JT, Koenig JI, Moy CS, et al. The science of vascular contributions to cognitive impairment and dementia (VCID): a framework for advancing research priorities in the cerebrovascular biology of cognitive decline. Cell Mol Neurobiol. (2016) 36:281–8. doi: 10.1007/s10571-016-0334-7
4. Snyder HM, Corriveau RA, Craft S, Faber JE, Greenberg SM, Knopman D, et al. Vascular contributions to cognitive impairment and dementia including Alzheimer's disease. Alzheimer's Dement. (2015) 11:710–7. doi: 10.1016/j.jalz.2014.10.008
5. Wardlaw JM, Smith EE, Biessels GJ, Cordonnier C, Fazekas F, Frayne R, et al. Neuroimaging standards for research into small vessel disease and its contribution to aging and neurodegeneration. Lancet Neurol. (2013) 12:822–38. doi: 10.1016/S1474-4422(13)70124-8
6. van Veluw SJ, Arfanakis K, Schneider JA. Neuropathology of vascular brain health: insights from ex vivo magnetic resonance imaging–histopathology studies in cerebral small vessel disease. Stroke. (2022) 53:404–15. doi: 10.1161/STROKEAHA.121.032608
7. Pantoni L. Cerebral small vessel disease: from pathogenesis and clinical characteristics to therapeutic challenges. Lancet Neurol. (2010) 9:689–701. doi: 10.1016/S1474-4422(10)70104-6
8. Wardlaw JM, Benveniste H, Nedergaard M, Zlokovic BV, Mestre H, Lee H, et al. Perivascular spaces in the brain: anatomy, physiology and pathology. Nat Rev Neurol. (2020) 16:137–53. doi: 10.1038/s41582-020-0312-z
9. Mestre H, Kostrikov S, Mehta RI, Nedergaard M. Perivascular spaces, glymphatic dysfunction, and small vessel disease. Clin Sci. (2017) 131:2257–74. doi: 10.1042/CS20160381
10. Rosenberg GA, Wallin A, Wardlaw JM, Markus HS, Montaner J, Wolfson L, et al. Consensus statement for diagnosis of subcortical small vessel disease. J Cereb Blood Flow Metab. (2016) 36:6–25. doi: 10.1038/jcbfm.2015.172
11. Rouhl RPW, van Oostenbrugge RJ, Knottnerus ILH, Staals JEA, Lodder J. Virchow-Robin spaces relate to cerebral small vessel disease severity. J Neurol. (2008) 255:692–6. doi: 10.1007/s00415-008-0777-y
12. Wuerfel J, Haertle M, Waiczies H, Tysiak E, Bechmann I, Wernecke KD, et al. Perivascular spaces—MRI marker of inflammatory activity in the brain? Brain. (2008) 131:2332–40. doi: 10.1093/brain/awn171
13. Passiak BS, Liu D, Kresge HA, Cambronero FE, Pechman KR, Osborn KE, et al. Perivascular spaces contribute to cognition beyond other small vessel disease markers. Neurology. (2019) 92:e1309–21. doi: 10.1212/WNL.0000000000007124
14. Doubal FN, MacLullich AMJ, Ferguson KJ, Dennis MS, Wardlaw JM. Enlarged perivascular spaces on MRI are a feature of cerebral small vessel disease. Stroke. (2010) 41:450–4. doi: 10.1161/STROKEAHA.109.564914
15. Troili F, Cipollini V, Moci M, Morena E, Palotai M, Rinaldi V, et al. Perivascular unit: this must be the place. The anatomical crossroad between the immune, vascular and nervous system. Front Neuroanat. (2020) 14:17. doi: 10.3389/fnana.2020.00051
16. Iliff JJ, Wang M, Zeppenfeld DM, Venkataraman A, Plog BA, Liao Y, et al. Cerebral arterial pulsation drives paravascular CSF-interstitial fluid exchange in the murine brain. J Neurosci. (2013) 33:18190–9. doi: 10.1523/JNEUROSCI.1592-13.2013
17. Bakker ENTP, Bacskai BJ, Arbel-Ornath M, Aldea R, Bedussi B, Morris AWJ, et al. Lymphatic clearance of the brain: perivascular, paravascular and significance for neurodegenerative diseases. Cell Mol Neurobiol. (2016) 36:181–94. doi: 10.1007/s10571-015-0273-8
18. Brown R, Benveniste H, Black SE, Charpak S, Dichgans M, Joutel A, et al. Understanding the role of the perivascular space in cerebral small vessel disease. Cardiovasc Res. (2018) 114:1462–73. doi: 10.1093/cvr/cvy113
19. Weller RO, Hawkes CA, Kalaria RN, Werring DJ, Carare RO. White matter changes in dementia: role of impaired drainage of interstitial fluid. Brain Pathol. (2015) 25:63–78. doi: 10.1111/bpa.12218
20. Huijts M, Duits A, van Oostenbrugge RJ, Kroon AA, de Leeuw PW, Staals J. Accumulation of MRI markers of cerebral small vessel disease is associated with decreased cognitive function. A study in first-ever lacunar stroke and hypertensive patients. Front Aging Neurosci. (2013) 5:72. doi: 10.3389/fnagi.2013.00072
21. Potter GM, Chappell FM, Morris Z, Wardlaw JM. Cerebral perivascular spaces visible on magnetic resonance imaging: development of a qualitative rating scale and its observer reliability. Cerebrovasc Dis. (2015) 39:224–31. doi: 10.1159/000375153
22. Charidimou A, Boulouis G, Pasi M, Auriel E, van Etten ES, Haley K, et al. MRI-visible perivascular spaces in cerebral amyloid angiopathy and hypertensive arteriopathy. Neurology. (2017) 88:1157–64. doi: 10.1212/WNL.0000000000003746
23. Shams S, Martola J, Charidimou A, Larvie M, Granberg T, Shams M, et al. Topography and determinants of magnetic resonance imaging (MRI)-visible perivascular spaces in a large memory clinic cohort. J Am Heart Assoc. (2017) 6:e006279. doi: 10.1161/JAHA.117.006279
24. Yang T, Sun Y, Lu Z, Leak RK, Zhang F. The impact of cerebrovascular aging on vascular cognitive impairment and dementia. Aging Res Rev. (2017) 34:15–29. doi: 10.1016/j.arr.2016.09.007
25. Huang P, Zhu Z, Zhang R, Wu X, Jiaerken Y, Wang S, et al. Factors associated with the dilation of perivascular space in healthy elderly subjects. Front Aging Neurosci. (2021) 26:13. doi: 10.3389/fnagi.2021.624732
26. MacLullich AMJ, Wardlaw JM, Ferguson KJ, Starr JM, Seckl JR, Deary IJ. Enlarged perivascular spaces are associated with cognitive function in healthy elderly men. J Neurol Neurosurg Psychiatry. (2004) 75:1519–23. doi: 10.1136/jnnp.2003.030858
27. Hilal S, Tan CS, Adams HHH, Habes M, Mok V, Venketasubramanian N, et al. Enlarged perivascular spaces and cognition. Neurology. (2018) 91:e832–42. doi: 10.1212/WNL.0000000000006079
28. Javierre-Petit C, Schneider JA, Kapasi A, Makkinejad N, Tamhane AA, Leurgans SE, et al. Neuropathologic and cognitive correlates of enlarged perivascular spaces in a community-based cohort of older adults. Stroke. (2020) 51:2825–33. doi: 10.1161/STROKEAHA.120.029388
29. Jie W, Lin G, Liu Z, Zhou H, Lin L, Liang G, et al. The relationship between enlarged perivascular spaces and cognitive function: a meta-analysis of observational studies. Front Pharmacol. (2020) 11:715. doi: 10.3389/fphar.2020.00715
30. Li X, Shen M, Jin Y, Jia S, Zhou Z, Han Z, et al. The effect of cerebral small vessel disease on the subtypes of mild cognitive impairment. Front Psychiatry. (2021) 16:12. doi: 10.3389/fpsyt.2021.685965
31. Peng D, Chen L, Chen X, Chen Z, Du Y, Guo Q, et al. Clinical practice guideline for cognitive impairment of cerebral small vessel disease. Aging Med. (2019) 2:64–73. doi: 10.1002/agm2.12073
32. Li Q, Yang Y, Reis C, Tao T, Li W, Li X, et al. Cerebral small vessel disease. Cell Transplant. (2018) 27:1711–22. doi: 10.1177/0963689718795148
33. Chen W, Song X, Zhang Y. Assessment of the Virchow-Robin spaces in Alzheimer's disease, mild cognitive impairment, and normal aging, using high-field MR imaging. Am J Neuroradiol. (2011) 32:1490–5. doi: 10.3174/ajnr.A2541
34. Arba F, Quinn TJ, Hankey GJ, Lees KR, Wardlaw JM, Ali M, et al. Enlarged perivascular spaces and cognitive impairment after stroke and transient ischemic attack. Int J Stroke. (2018) 13:47–56. doi: 10.1177/1747493016666091
35. Park YW, Shin N, Chung SJ, Kim J, Lim SM, Lee PH, et al. Magnetic resonance imaging–visible perivascular spaces in basal ganglia predict cognitive decline in parkinson's disease. Mov Disord. (2019) 34:1672–9. doi: 10.1002/mds.27798
36. Shibata K, Sugiura M, Nishimura Y, Sakura H. The effect of small vessel disease on motor and cognitive function in Parkinson's disease. Clin Neurol Neurosurg. (2019) 182:58–62. doi: 10.1016/j.clineuro.2019.04.029
37. Xia Y, Shen Y, Wang Y, Yang L, Wang Y, Li Y, et al. White matter hyperintensities associated with progression of cerebral small vessel disease: a 7-year Chinese urban community study. Aging. (2020) 12:8506–22. doi: 10.18632/aging.103154
38. Liu H, Yang S, He W, Liu X, Sun S, Wang S, et al. Associations among diffusion tensor image along the perivascular space (DTI-ALPS), enlarged perivascular space (ePVS), and cognitive functions in asymptomatic patients with carotid plaque. Front Neurol. (2022) 4:12. doi: 10.3389/fneur.2021.789918
39. Luo X, Jiaerken Y, Yu X, Huang P, Qiu T, Jia Y, et al. Associations between APOE genotype and cerebral small-vessel disease: a longitudinal study. Oncotarget. (2017) 8:44477–89. doi: 10.18632/oncotarget.17724
40. Paradise M, Crawford JD, Lam BCP, Wen W, Kochan NA, Makkar S, et al. Association of dilated perivascular spaces with cognitive decline and incident dementia. Neurology. (2021) 96:e1501–11. doi: 10.1212/WNL.0000000000011537
41. Yao M, Zhu YC, Soumaré A, Dufouil C, Mazoyer B, Tzourio C, et al. Hippocampal perivascular spaces are related to aging and blood pressure but not to cognition. Neurobiol Aging. (2014) 35:2118–25. doi: 10.1016/j.neurobiolaging.2014.03.021
42. Nasreddine ZS, Phillips NA, Bédirian V, Charbonneau S, Whitehead V, Collin I, et al. The montreal cognitive assessment, MoCA: a brief screening tool for mild cognitive impairment. J Am Geriatr Soc. (2005) 53:695–9. doi: 10.1111/j.1532-5415.2005.53221.x
43. Smith T, Gildeh N, Holmes C. The montreal cognitive assessment: validity and utility in a memory clinic setting. Can J Psychiatry. (2007) 52:329–32. doi: 10.1177/070674370705200508
44. Freitas S, Simões MR, Alves L, Vicente M, Santana I. Montreal cognitive assessment (MoCA): validation study for vascular dementia. J Int Neuropsychol Soc. (2012) 18:1031–40. doi: 10.1017/S135561771200077X
45. Godefroy O, Fickl A, Roussel M, Auribault C, Bugnicourt JM, Lamy C, et al. Is the montreal cognitive assessment superior to the mini-mental state examination to detect post-stroke cognitive impairment? A study with neuropsychological evaluation. Stroke. (2011) 42:1712–6. doi: 10.1161/STROKEAHA.110.606277
46. Dong Y, Sharma VK, Chan BP-L, Venketasubramanian N, Teoh HL, Seet RCS, et al. The montreal cognitive assessment (MoCA) is superior to the mini-mental state examination (MMSE) for the detection of vascular cognitive impairment after acute stroke. J Neurol Sci. (2010) 299:15–8. doi: 10.1016/j.jns.2010.08.051
47. Adams HHH, Cavalieri M, Verhaaren BFJ, Bos D, van der Lugt A, Enzinger C, et al. Rating method for dilated Virchow–Robin spaces on magnetic resonance imaging. Stroke. (2013) 44:1732–5. doi: 10.1161/STROKEAHA.111.000620
48. Adams HHH, Hilal S, Schwingenschuh P, Wittfeld K, van der Lee SJ, DeCarli C, et al. A priori collaboration in population imaging: the uniform neuro-imaging of Virchow-Robin spaces enlargement consortium. Alzheimer's Dement. (2015) 1:513–20. doi: 10.1016/j.dadm.2015.10.004
49. Jeerakathil T, Wolf PA, Beiser A, Massaro J, Seshadri S, D'Agostino RB, et al. Stroke risk profile predicts white matter hyperintensity volume: the Framingham study. Stroke. (2004) 35:1857–61. doi: 10.1161/01.STR.0000135226.53499.85
50. Debette S, Markus HS. The clinical importance of white matter hyperintensities on brain magnetic resonance imaging: systematic review and meta-analysis. BMJ. (2010) 341:c3666. doi: 10.1136/bmj.c3666
51. Lu H, Kashani AH, Arfanakis K, Caprihan A, DeCarli C, Gold BT, et al. MarkVCID cerebral small vessel consortium: II. Neuroimaging protocols. Alzheimer's Dement. (2021) 17:716–25. doi: 10.1002/alz.12216
52. Zachariou V, Bauer CE, Powell DK, Gold BT. Ironsmith: an automated pipeline for QSM-based data analyses. Neuroimage. (2022) 1:249. doi: 10.1016/j.neuroimage.2021.118835
53. Zhu Y-C, Dufouil C, Mazoyer B, Soumaré A, Ricolfi F, Tzourio C, et al. Frequency and location of dilated Virchow-Robin spaces in elderly people: a population-based 3D MR imaging study. Am J Neuroradiol. (2011) 32:709–13. doi: 10.3174/ajnr.A2366
54. Ballerini L, Lovreglio R, Valdés Hernández MDC, Ramirez J, MacIntosh BJ, Black SE, et al. Perivascular spaces segmentation in brain MRI using optimal 3D filtering. Sci Rep. (2018) 8:2132. doi: 10.1038/s41598-018-19781-5
55. Wang X, Valdés Hernández Mdel C, Doubal F, Chappell FM, Piper RJ, Deary IJ, et al. Development and initial evaluation of a semi-automatic approach to assess perivascular spaces on conventional magnetic resonance images. J Neurosci Methods. (2016) 257:34–44. doi: 10.1016/j.jneumeth.2015.09.010
56. Dubost F, Adams H, Bortsova G, Ikram MA, Niessen W, Vernooij M, et al. 3D regression neural network for the quantification of enlarged perivascular spaces in brain MRI. Med Image Anal. (2019) 51:89–100. doi: 10.1016/j.media.2018.10.008
57. Schwartz DL, Boespflug EL, Lahna DL, Pollock J, Roese NE, Silbert LC. Autoidentification of perivascular spaces in white matter using clinical field strength T1 and FLAIR MR imaging. Neuroimage. (2019) 202:116126. doi: 10.1016/j.neuroimage.2019.116126
58. Charidimou A, Pantoni L, Love S. The concept of sporadic cerebral small vessel disease: a road map on key definitions and current concepts. Int J Stroke. (2016) 11:6–18. doi: 10.1177/1747493015607485
59. Bokura H, Kobayashi S, Yamaguchi S. Distinguishing silent lacunar infarction from enlarged Virchow-Robin spaces: a magnetic resonance imaging and pathological study. J Neurol. (1998) 245:116–22. doi: 10.1007/s004150050189
60. Longstreth WT. Lacunar infarcts defined by magnetic resonance imaging of 3,660 elderly people: the cardiovascular health study. Arch Neurol. (1998) 55:1217–25. doi: 10.1001/archneur.55.9.1217
61. Klohs J, Deistung A, Schweser F, Grandjean J, Dominietto M, Waschkies C, et al. Detection of cerebral microbleeds with quantitative susceptibility mapping in the arcabeta mouse model of cerebral amyloidosis. J Cereb Blood Flow Metab. (2011) 31:2282–92. doi: 10.1038/jcbfm.2011.118
62. Liu T, Surapaneni K, Lou M, Cheng L, Spincemaille P, Wang Y. Cerebral microbleeds: burden assessment by using quantitative susceptibility mapping. Radiology. (2012) 262:269–78. doi: 10.1148/radiol.11110251
63. Haacke EM, Liu S, Buch S, Zheng W, Wu D, Ye Y. Quantitative susceptibility mapping: current status and future directions. Magn Reson Imaging. (2015) 33:1–25. doi: 10.1016/j.mri.2014.09.004
64. Haller S, Vernooij MW, Kuijer JPA, Larsson E-M, Jäger HR, Barkhof F. Cerebral microbleeds: imaging and clinical significance. Radiology. (2018) 287:11–28. doi: 10.1148/radiol.2018170803
65. Fazlollahi A, Raniga P, Bourgeat P, Yates P, Bush AI, Salvado O, et al. Restricted effect of cerebral microbleeds on regional magnetic susceptibility. J Alzheimer's Dis. (2020) 76:571–7. doi: 10.3233/JAD-200076
66. Puy L, Pasi M, Rodrigues M, van Veluw SJ, Tsivgoulis G, Shoamanesh A, et al. Cerebral microbleeds: from depiction to interpretation. J Neurol Neurosurg Psychiatry. (2021) 92:598–607. doi: 10.1136/jnnp-2020-323951
67. DeCarli C, Maillard P, Fletcher E. Four Tissue Segmentation in ADNI II. Alzheimer's Disease Neuroimaging Initiative (2013). Available online at: https://files.alz.washington.edu/documentation/adni_proto.pdf (accessed March 1, 2022).
68. Jenkinson M, Beckmann CF, Behrens TEJ, Woolrich MW, Smith SM. FSL. Neuroimage. (2012) 62:782–90. doi: 10.1016/j.neuroimage.2011.09.015
69. Decarli C, Murphy DGM, Teichberg D, Campbell G, Sobering GS. Local histogram correction of MRI spatially dependent image pixel intensity non-uniformity. J Magn Reson Imaging. (1996) 6:519–28. doi: 10.1002/jmri.1880060316
70. Zachariou V, Bauer CE, Seago ER, Raslau FD, Powell DK, Gold BT. Cortical iron disrupts functional connectivity networks supporting working memory performance in older adults. Neuroimage. (2020) 1:223. doi: 10.1016/j.neuroimage.2020.117309
71. Stine RA. Graphical interpretation of variance inflation factors. Am Stat. (1995) 49:53–6. doi: 10.1080/00031305.1995.10476113
72. Hoops S, Nazem S, Siderowf AD, Duda JE, Xie SX, Stern MB, et al. Validity of the MoCA and MMSE in the detection of MCI and dementia in Parkinson disease. Neurology. (2009) 73:1738–45. doi: 10.1212/WNL.0b013e3181c34b47
73. Aggarwal A, Kean E. Comparison of the Folstein mini mental state examination (MMSE) to the montreal cognitive assessment (MoCA) as a cognitive screening tool in an inpatient rehabilitation setting. Neurosci Med. (2010) 01:39–42. doi: 10.4236/nm.2010.12006
74. Larner AJ. Screening utility of the montreal cognitive assessment (MoCA): in place of – or as well as – the MMSE? Int Psychogeriatr. (2012) 24:391–6. doi: 10.1017/S1041610211001839
75. Cummings JL. Anatomic and behavioral aspects of frontal-subcortical circuits. Ann N Y Acad Sci. (1995) 769:1–13. doi: 10.1111/j.1749-6632.1995.tb38127.x
76. Alvarez JA, Emory E. Executive function and the frontal lobes: a meta-analytic review. Neuropsychol Rev. (2006) 16:17–42. doi: 10.1007/s11065-006-9002-x
77. Pearlson GD, Rabins PV, Burns A. Centrum semiovale white matter CT changes associated with normal aging, Alzheimer's disease and late life depression with and without reversible dementia. Psychol Med. (1991) 21:321–8. doi: 10.1017/S0033291700020420
78. Vataja R, Pohjasvaara T, Mäntylä R, Ylikoski R, Leppävuori A, Leskelä M, et al. MRI correlates of executive dysfunction in patients with ischaemic stroke. Eur J Neurol. (2003) 10:625–31. doi: 10.1046/j.1468-1331.2003.00676.x
79. Deary IJ, Bastin ME, Pattie A, Clayden JD, Whalley LJ, Starr JM, et al. White matter integrity and cognition in childhood and old age. Neurology. (2006) 66:505–12. doi: 10.1212/01.wnl.0000199954.81900.e2
80. Huang LA, Ling XY, Li C, Zhang SJ, Chi GB, Xu AD. Study of white matter at the centrum semiovale level with magnetic resonance spectroscopy and diffusion tensor imaging in cerebral small vessel disease. Genet Mol Res. (2014) 13:2683–90. doi: 10.4238/2014.April.8.11
81. Laveskog A, Wang R, Bronge L, Wahlund LO, Qiu C. Perivascular spaces in old age: assessment, distribution, and correlation with white matter hyperintensities. Am J Neuroradiol. (2018) 39:70–6. doi: 10.3174/ajnr.A5455
82. Gertje EC, van Westen D, Panizo C, Mattsson-Carlgren N, Hansson O. Association of enlarged perivascular spaces and measures of small vessel and Alzheimer's disease. Neurology. (2021) 96:e193–202. doi: 10.1212/WNL.0000000000011046
83. Huang P, Zhang R, Jiaerken Y, Wang S, Yu W, Hong H, et al. Deep white matter hyperintensity is associated with the dilation of perivascular space. J Cereb Blood Flow Metab. (2021) 41:2370–80. doi: 10.1177/0271678X211002279
84. Loos CMJ, Klarenbeek P, van Oostenbrugge RJ, Staals J. Association between perivascular spaces and progression of white matter hyperintensities in lacunar stroke patients. PLoS ONE. (2015) 10:e0137323. doi: 10.1371/journal.pone.0137323
85. Gouw AA, Seewann A, van der Flier WM, Barkhof F, Rozemuller AM, Scheltens P, et al. Heterogeneity of small vessel disease: a systematic review of MRI and histopathology correlations. J Neurol Neurosurg Psychiatry. (2011) 82:126–35. doi: 10.1136/jnnp.2009.204685
86. Potter GM, Doubal FN, Jackson CA, Chappell FM, Sudlow CL, Dennis MS, et al. Enlarged perivascular spaces and cerebral small vessel disease. Int J Stroke. (2015) 10:376–81. doi: 10.1111/ijs.12054
87. Charidimou A, Meegahage R, Fox Z, Peeters A, Vandermeeren Y, Laloux P, et al. Enlarged perivascular spaces as a marker of underlying arteriopathy in intracerebral hemorrhage: a multicentre MRI cohort study. J Neurol Neurosurg Psychiatry. (2013) 84:624–9. doi: 10.1136/jnnp-2012-304434
88. Martinez-Ramirez S, Pontes-Neto OM, Dumas AP, Auriel E, Halpin A, Quimby M, et al. Topography of dilated perivascular spaces in subjects from a memory clinic cohort. Neurology. (2013) 80:1551–6. doi: 10.1212/WNL.0b013e31828f1876
89. Kim HJ, Cho H, Park M, Kim JW, Ahn SJ, Lyoo CH, et al. MRI-visible perivascular spaces in the centrum semiovale are associated with brain amyloid deposition in patients with Alzheimer's disease–related cognitive impairment. Am J Neuroradiol. (2021) 42:1231–8. doi: 10.3174/ajnr.A7155
90. Razali R, Jean-Li L, Jaffar A, Ahmad M, Shah SA, Ibrahim N, et al. Is the Bahasa Malaysia version of the montreal cognitive assessment (MoCA-BM) a better instrument than the Malay version of the mini mental state examination (M-MMSE) in screening for mild cognitive impairment (MCI) in the elderly? Compr Psychiatry. (2014) 55:S70–5. doi: 10.1016/j.comppsych.2013.04.010
91. Aribisala BS, Wiseman S, Morris Z, Valdés-Hernández MC, Royle NA, Maniega SM, et al. Circulating inflammatory markers are associated with magnetic resonance imaging-visible perivascular spaces but not directly with white matter hyperintensities. Stroke. (2013) 45:605–7. doi: 10.1161/STROKEAHA.113.004059
92. Fang Y, Gu L-Y, Tian J, Dai S-B, Chen Y, Zheng R, et al. MRI-visible perivascular spaces are associated with cerebrospinal fluid biomarkers in Parkinson's disease. Aging. (2020) 12:25805–18. doi: 10.18632/aging.104200
93. Li Y, Li M, Yang L, Qin W, Yang S, Yuan J, et al. The relationship between blood-brain barrier permeability and enlarged perivascular spaces: a cross-sectional study. Clin Interv Aging. (2019) 14:871–8. doi: 10.2147/CIA.S204269
94. Zhang CE, Wong SM, van de Haar HJ, Staals J, Jansen JFA, Jeukens CRLPN, et al. Blood–brain barrier leakage is more widespread in patients with cerebral small vessel disease. Neurology. (2017) 88:426–32. doi: 10.1212/WNL.0000000000003556
95. Wardlaw JM, Makin SJ, Valdés Hernández MC, Armitage PA, Heye AK, Chappell FM, et al. Blood-brain barrier failure as a core mechanism in cerebral small vessel disease and dementia: evidence from a cohort study. Alzheimer's Dement. (2017) 13:634–43. doi: 10.1016/j.jalz.2016.09.006
Keywords: enlarged perivascular spaces—ePVS, cerebral small vessel disease, Montréal Cognitive Assessment—MoCA, neuroimaging biomarkers, white matter hyperintensities—WMH
Citation: Libecap TJ, Zachariou V, Bauer CE, Wilcock DM, Jicha GA, Raslau FD and Gold BT (2022) Enlarged Perivascular Spaces Are Negatively Associated With Montreal Cognitive Assessment Scores in Older Adults. Front. Neurol. 13:888511. doi: 10.3389/fneur.2022.888511
Received: 02 March 2022; Accepted: 06 June 2022;
Published: 01 July 2022.
Edited by:
Marco Pasi, Center Hospitalier Universitaire de Tours, FranceReviewed by:
Yousef Hannawi, The Ohio State University, United StatesCopyright © 2022 Libecap, Zachariou, Bauer, Wilcock, Jicha, Raslau and Gold. This is an open-access article distributed under the terms of the Creative Commons Attribution License (CC BY). The use, distribution or reproduction in other forums is permitted, provided the original author(s) and the copyright owner(s) are credited and that the original publication in this journal is cited, in accordance with accepted academic practice. No use, distribution or reproduction is permitted which does not comply with these terms.
*Correspondence: Brian T. Gold, YnJpYW4uZ29sZEB1a3kuZWR1
Disclaimer: All claims expressed in this article are solely those of the authors and do not necessarily represent those of their affiliated organizations, or those of the publisher, the editors and the reviewers. Any product that may be evaluated in this article or claim that may be made by its manufacturer is not guaranteed or endorsed by the publisher.
Research integrity at Frontiers
Learn more about the work of our research integrity team to safeguard the quality of each article we publish.