
94% of researchers rate our articles as excellent or good
Learn more about the work of our research integrity team to safeguard the quality of each article we publish.
Find out more
ORIGINAL RESEARCH article
Front. Neurol., 29 April 2022
Sec. Applied Neuroimaging
Volume 13 - 2022 | https://doi.org/10.3389/fneur.2022.858805
This article is part of the Research TopicInsights in Applied Neuroimaging: 2021View all 12 articles
 Zhe Sun1,2
 Dengrong Jiang3
 Peiying Liu3Marco Muccio1
 Chenyang Li1,2
 Yan Cao4
 Thomas M. Wisniewski5,6,7,8
 Hanzhang Lu3
 Yulin Ge1*
Background and Purpose: The vascular tortuosity (VT) of the internal carotid artery (ICA), and vertebral artery (VA) can impact blood flow and neuronal function. However, few studies involved quantitative investigation of VT based on magnetic resonance imaging (MRI). The main purpose of our study was to evaluate the age and gender effects on ICA and VA regarding the tortuosity and flow changes by applying automatic vessel segmentation, centerline tracking, and phase mapping on MR angiography.
Methods: A total of 247 subjects (86 males and 161 females) without neurological diseases participated in this study. All subjects obtained T1-weighted MRI, 3D time-of-flight MR angiography, and 2D phase-contrast (PC) MRI scans. To generate quantitative tortuosity metrics from TOF images, the vessel segmentation and centerline tracking were implemented based on Otsu thresholding and fast marching algorithms, respectively. Blood flow and velocity were measured using PC MRI. Among the 247 subjects, 144 subjects (≤ 60 years, 49 males/95 females) were categorized as the young group; 103 subjects (>60 years, 37 males/66 females) were categorized as the old group.
Results: Independent t-test showed that older subjects had higher tortuosity metrics, whereas lower blood flow and velocity than young subjects (p < 0.0025, Bonferroni-corrected). Cerebral blood flow calculated using the sum flux of four target arteries normalized by the brain mass also showed significantly lower values in older subjects (p < 0.001). The age was observed to be positively correlated with the VT metrics. Compared to the males, the females demonstrated higher geometric indices within VAs as well as faster age-related vascular profile changes. After adjusting age and gender as covariates, maximum blood velocity is negatively correlated with geometric measurements. No association was observed between blood flux and geometric measures.
Conclusions: Vascular auto-segmentation, centerline tracking, and phase mapping provide promising quantitative assessments of tortuosity and its effects on blood flow. The neck arteries demonstrate quantifiable and significant age-related morphological and hemodynamic alterations. Moreover, females showed more distinct vascular changes with age. Our work is built upon a comprehensive quantitative investigation of a large cohort of populations covering adult lifespan using MRI, the results can serve as reference ranges of each decade in the general population.
The internal carotid artery (ICA) and vertebral artery (VA) are main feeding arteries of the brain and play critical roles in supplying energy and maintaining normal neuronal function. It has been widely reported in the literatures that extracranial arteries are prone to demonstrate geometric and morphological variants with normal aging (1–3). Due to the long courses of extracranial arteries in the neck region, the age-related morphological variations represent distinctly as abnormal twisting, turns, and loops found in the elderly in contrast to the normal anatomical turns. These vascular morphological changes can limit the blood flow, which may lead to stroke and other ischemic events, such as the transit ischemic attack and vertigo (4–8). Thus, it is clinically important to assess vascular tortuosity (VT) for a better understanding how VT can affect the blood flow. Non-invasive clinical imaging techniques, particularly ultrasound and MRI, stand at the epicenter of VT and flow assessment in the elderly population. Compared to ultrasound, MRI is operator-independent with higher fidelity, larger field of view (FOV), and greater capacity of deep vessel detection (e.g., VA). While these age-related tortuosity changes raise the awareness of their etiology, pathophysiological mechanisms, and clinical monitoring, few published studies have quantified the VT and its correlation with blood flow using MRI.
The aging and the mechanical injury of vessel wall were proposed as the two important pathological processes of VT. With aging, degenerative changes of extracellular matrix and endothelium result in arterial wall remodeling, stiffness, and tortuosity (9). The mechanical factors also increase the incidence of VT secondary to the repetitive cardiac pulsatile flow effects accumulated over the lifespan in the elderly. Responding to constantly imposed forces of blood flow, the vessels become tortuous associated with elastin degradation and proinflammatory signaling activation (10, 11), Conversely, VT impedes flow effects and affect vascular wall shear stress (WSS) associated with platelets activation and thrombosis (12). These have been observed clinically with decreased cerebral blood flow (CBF) in the elderly with more tortuosity vessels (13, 14). Ultrasound studies have shown that blood velocities in ICAs were stable up to the age of 40–45 years and decreased afterward associated with increased tortuosity appearances (15, 16). However, the clear associations between tortuosity and flow changes in normal aging have not been established.
Time-of-flight (TOF) and phase-contrast (PC) imaging are two MR angiographic (MRA) techniques commonly used in the routine clinical settings for vascular characteristic inspection (17–20). The present study aims to comprehensively quantify the age-related VT of ICAs, and VAs and their blood flow by applying automated vessel segmentation, centerline tracking, and phase mapping on MRA. The methods developed in this study can potentially be implemented in clinical scans for grading the vessel integrity of major brain feeding arteries by referring to quantitative metrics of vascular characteristics.
After the institutional review board's approval, 251 subjects were initially recruited, and four of them were excluded due to the abnormal arteries on TOF–MRA or missing unilateral VA, which is a type of variant anatomy. Finally, 247 individuals (86 males and 161 females) were enrolled with age ranging from 20 to 88 years in this retrospective study. Among the 247 subjects, 144 participants younger than and including 60 years old were classified as the young group; 103 participants older than 60 years old were classified as the old group. The participants of our study were subset of the Dallas Lifespan Brain Study (DLBS) designed to understand the preservation and decline of cognitive function. All participants underwent screening and had no contraindications to MRI scan (pacemaker, implanted metallic objects, and claustrophobia) and were generally of good health, without serious medical conditions such as neurological disease, brain injury, shaking, or medications affecting cognitive functions (7). All participants were right-handed native English speaker with Mini-Mental State Exam (MMSE) score of 26 or greater. Among the 247 participants, 232 had blood pressure (BP) (i.e., systolic and diastolic) that was measured 5 times around the time of MRI scan. The mean systolic and diastolic BP of the five measurements was then used for the further analyses related to tortuosity (21). Among them, 33 participants with a diagnosis of hypertension were taking antihypertensive medications, most of which were angiotensin covering enzyme inhibitors, beta-blockers, and angiotensin II receptor antagonists (7).
The MR imaging was performed using a 3T MRI system with an 8-channel head coil. Also, T1-weighted magnetization-prepared-rapid-acquisition-of-gradient-echo (MPRAGE), 3D-TOF, and 2D non-gated PC–MRI scans were acquired for each subject. The MPRAGE sequence used the following imaging parameters: Repetition time (TR)/echo time (TE)/flip angle (FA) = 8.1 ms/3.7 ms/12°, voxel size = 1 mm × 1 mm × 1 mm. For the purpose of the vessel segmentation and PC–MRI positioning, the TOF was acquired with the following parameters: TR/TE/FA = 23 ms/3.45 ms/18°, voxel size = 1.0 mm × 1.0 mm × 1.5 mm, number of slices = 47, a 60-mm saturation band positioned above the imaging slab, scan time = 1 min 26 s. The top of the angiographic imaging slab was positioned at the level of the bottom of pons, with the bottom FOV margin at the level around cervical spine C4, covering the cervical segment of ICA. Based on the coronal maximum intensity projection (MIP) images from TOF, the non-gated PC–MRI scan covering the four feeding arteries was conducted around the level of cervical spine C3 above the carotid bifurcations with following parameters: TR/TE/FA = 20 ms/7 ms/15°, voxel size = 0.45 mm × 0.45 mm × 5 mm, velocity encoding (VENC) = 80 cm/s, scan duration = 30 s.
We segmented and tracked the centerline of the vessels from 3D-TOF angiogram using the in-house code run on MATLAB 2020a (MATLAB and statistics Toolbox Release 2020a, MathWorks, Inc. Natick, MA). Figure 1 shows the image postprocessing workflow. A preliminary ROI enclosing the targeting arteries was drawn. The artery region T(x) consisting pixels x was determined using the following equation:
where I(x) is the intensity of the object region (Ω) consisting of both the arteries and the surrounding tissues; μ and σ are the mean and standard deviation intensities of Ω, respectively. Since the signal intensities of the arteries are inhomogeneous, we need to start with a high value of j and decrease it gradually until an optimal value was reached. The optimal value of j, which varied between subjects, should be high enough to exclude surrounding tissue meanwhile low enough to include the arteries (22). Although j was determined subject-by-subject basis, we found an empirical search range of 6–4 in descending order was applicable for most cases. After the artery pixels were determined for each slice, they were connected if their faces or edges touched so as to get the 3D segmentation of arteries.
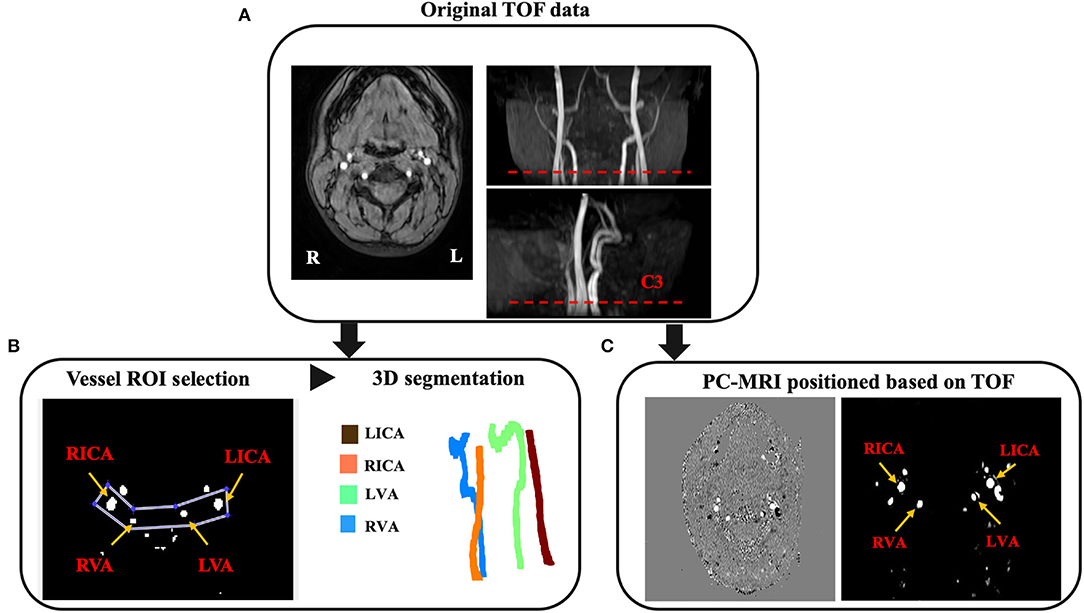
Figure 1. Image postprocessing workflow. (A) The TOF magnetic resonance angiography (MRA) including raw axial images, coronal and sagittal MIP images are acquired for the purpose of vessel segmentation and PC-MRI positioning. The PC-MRI scan plane is positioned around the level of cervical vertebrate C3 (red dash line), where above the carotid bifurcations. (B) The ROI enclosing target arteries and surrounding tissues are selected for the purpose of vessel segmentation and tortuosity measurement. Arteries can be detected based on the mean and standard deviation of the object region. (C) Corresponding phase image (left) and magnitude image (right) from the feeding arteries positioned at the level around C3 [red dash line in (A)].
Based on the arterial surface derived from 3D segmentation, the arterial centerline was acquired using multi-stencils fast marching algorithm, which calculates the shortest distance from a source point to all other pixels in an image volume by solving the Eikonal equation along stencils that cover neighboring points entirely (23). The centers of these level curves formed the skeleton representing the artery. The coordinates of the extracted arterial skeleton can be acquired to quantitatively assess the VT. We proposed to use tortuosity index (TI), bending length (BL), and inflection count metric (ICM) as quantitative VT indices (Figure 2). The TI is the ratio between the actual length (AL) and the direct length (DL). The BL is the maximum perpendicular distance between the AL and the DL, reflecting the extent of curving. The ICM is the product of turning points number (N) and TI, which takes turning frequency into consideration. Here, N was determined by visually checking the centerline skeleton.
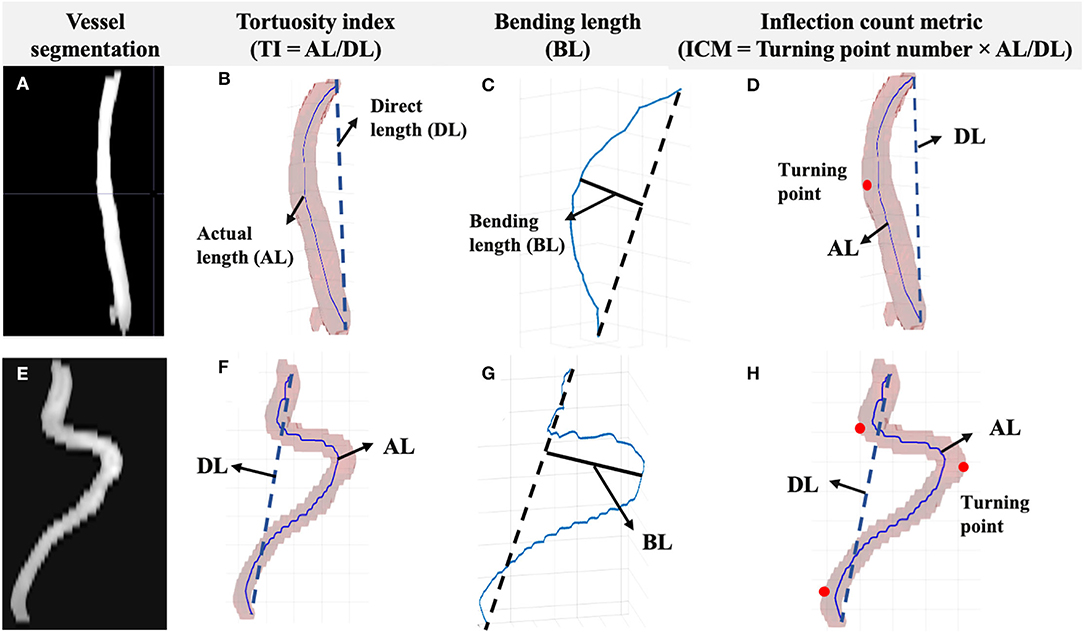
Figure 2. Segmentation and the centerline of the vessel were acquired. The measurements included TI, BL, and ICM. (A) Left ICA vessel segmentation of a young subject (≤ 60 years old). (B) The TI is the ratio between AL and DL. (C) The BL is the distance between the foremost points on the vessel path and the start-end points link. (D) The ICM is the product of turning points number (red dots) and TI. Corresponding vessel segmentation and measurements of an old subject (>60 years old) are shown in parts (E–H).
Each PC–MRI scan generated a phase image and a magnitude image. The data processing of PC–MRI followed previously reported method (24). Briefly, the region of interests (ROIs) were manually drawn on the magnitude images by circling the targeted artery (bilateral ICAs and VAs) based on the brightness of the voxels (25). A signal intensity threshold set to be 5 times the background noise was then applied to the magnitude image to get vessel mask. The mask was then applied to the phase image to calculate blood flux and maximum blood velocity (MaxV). The unit volume CBF (in ml/min/100 g) was calculated as the sum of blood flux of the four arteries normalized to the brain's parenchyma mass obtained from T1WI.
We used maximal intensity projection (MIP) images (both coronal and sagittal planes) generated from TOF–MR angiogram as a reference to evaluate the accuracy of arterial vessel segmentation. After overlaying the acquired centerline on the arterial segment, it would be easy to identify false branches and tell the tracking accuracy. All the segmented arteries and centerline images were visually inspected and the arteries with incomplete processing or aborted algorithms were excluded.
In addition, a scan–rescan study was performed to evaluate the reproducibility of 3D-TOF vessel tortuosity measurements. Seven young, healthy subjects (4 males, 3 females, 26.4 ± 3.7 years) underwent two MRI sessions with a 5-min break in between. During each session, 3D-TOF angiogram and PC-MRI scan were acquired. Inter-session coefficient of variation (CoV) of tortuosity measurements was calculated as follows:
where measurement1 and measurement2 represent the TI, BL, or ICM from two scan and rescan sessions, respectively. These two separate scans are supposed to consist of repositioning error, and TOF–MRA noise.
Two-tailed t-test was applied to identify VT and flow differences between young and old groups. Since 20 analyses on the same dependent variable were being performed, Bonferroni-corrected alpha (αcorrected = 0.0025) was calculated to control the Type I error and a value of p ≤ 0.0025 was considered statistically significant for multiple comparisons and correlation studies. The Pearson correlation coefficients (r) were calculated to reveal the relationship between age and each vascular feature respectively. The multivariate linear regression was also performed using age as independent variable, VT and flow measurements as dependent variables, and BP (mean systolic and diastolic) measurements as covariates. Since the previous study showed hypertension might be associated with arteriosclerotic and vessel wall changes, we included these analyses to remove the hypertension effects from aging. To determine whether there is a statistically significant difference of VT and flow measurements between hypertension and normotension, 33 age/gender-matched non-hypertensive subjects (age: 67.91 ± 11.85; 24 females/9 males) were chosen to compare with the 33 hypertensive subjects (age: 69.53 ± 12.4; 24 females/9 males) using Student's t-test. We further split the cohort into females and males. Two-tailed t-test was applied to identify VT and flow differences between male and female groups. Univariate linear regression analyses were performed to investigate relationship and coefficients between age and vascular features for different genders. The association between tortuosity and blood flow was calculated using multivariate linear regression, treating age, gender, and each VT measurement as regressors. GraphPad Prism 8 was used for the statistical analysis.
The descriptive statistics associated with blood pressure, and vascular profiles of ICA across the seven age decade groups are reported in Table 1. A detailed information of females and males in each decade group are reported in Supplementary Tables 1 and 2, respectively. Among 247 subjects (aged 53.23 ± 19.62 years, 86 males/161 females), we identified 144 younger subjects with age less than and including 60 years (aged 39.20 ± 12.11, 49 males/95 females) and 103 older subjects with age more than 60 years (aged 72.86 ± 7.5, 37 males/66 females). The mean systolic (137.8 ± 16.5 mm Hg) and diastolic (83.2 ± 9.6 mm Hg) BP of participants in old group was significantly higher than that of young subjects (116.7 ± 13.6 and 78.7 ± 9.6, respectively) (p < 0.001). Chi-square analysis did not reveal a statistically significant difference in gender for each age group.
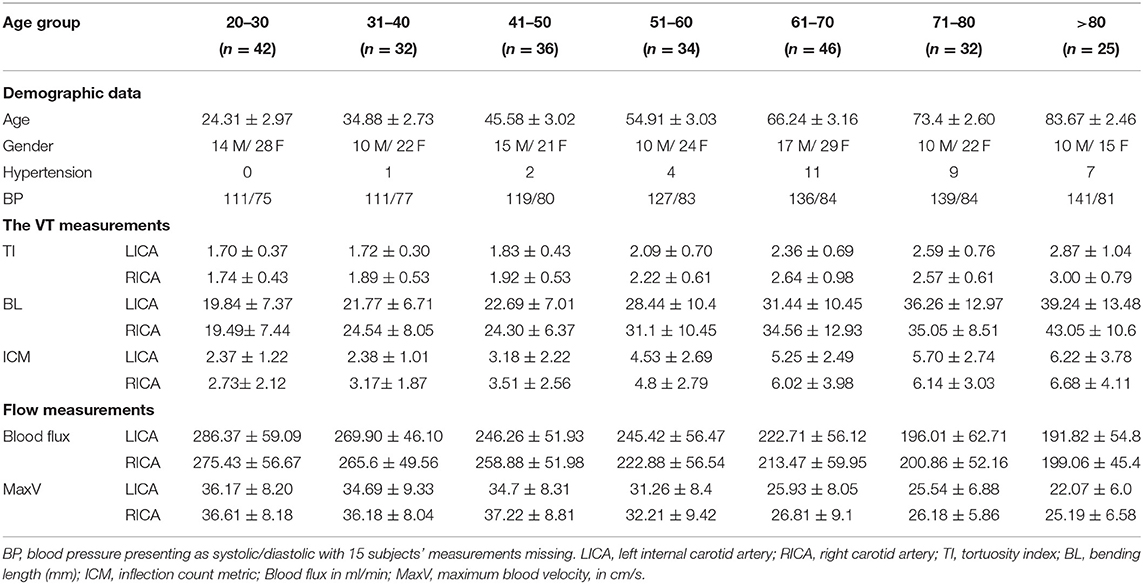
Table 1. The ICA VT and flow measurements of each age decade.
As shown in Figure 3, VTs were widely observed in the older subject group. Quantitatively, ICAs of older subjects demonstrated significantly higher TI (left = 2.56 ± 0.83, right = 2.70 ± 0.84), BL (left = 34.78 ± 12.3, right = 36.92 ± 11.7), and ICM (left = 5.65 ± 2.92, right = 6.28 ± 3.76) than younger subjects' TI (left = 1.83 ± 0.49, right = 1.93 ± 0.55), BL (left = 22.96 ± 8.6, right = 24.49 ± 9.11), and ICM values (left = 3.09 ± 2.08, right = 3.52 ± 2.46) (p < 0.001 for all; details can be found in Table 1); significantly higher ICM of left vertebral artery (LVA) (p < 0.001) and BL of right vertebral artery (RVA) (p < 0.001) could be observed in older subjects. The TI, BL values of LVA and TI, ICM of RVA did not show significant difference. The old subjects demonstrated significantly lower blood flux, and MaxV for all arteries compared to young subjects. Compared to global-wise reports, unit mass CBF was significantly lower in old (49.15 ± 10.56 ml/min/100 g) as compared to young participants (55.77 ± 9.89 ml/min/100 g) (p < 0.001). A detailed descriptive statistics and p-values can be found in Table 2.
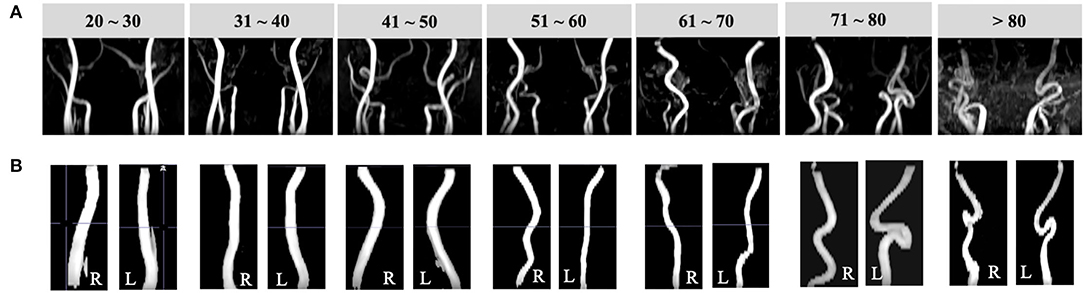
Figure 3. Illustrations of vessel segmentation for each decade over the adult lifespan. (A) Coronal TOF images (radiological view) of subjects from each decade demonstrate arteries become more tortuous with aging. (B) Left and right ICA segmentation results of subjects of age from 20 to 80 years.

Table 2. Comparison of VT and flow measurements between young (n = 144) and old (n = 103) groups.
According to the Pearson correlation results, TI (r of left: 0.52 and right: 0.52), BL (r of left: 0.55 and right: 0.61), and ICM (r of left: 0.52 and right: 0.43) were positively correlated with age for bilateral ICAs (p < 0.001). The ICM of bilateral VAs (r of left: 0.29 and right: 0.19, p < 0.001 and p = 0.002, respectively) and BL of RVA (r = 0.2, p = 0.002) were positively correlated with age. Significantly, the negative correlations were identified between the flow measurements and age for all arteries (p < 0.001). A detailed r and p-values were summarized in Table 3. Separate multivariate linear regression was performed and showed statistical significance for tortuosity measurements of bilateral ICAs, as well as ICM of bilateral VAs in relation with age after adjusting mean systolic and diastolic BP as covariates (p < 0.0025 for all measurements). Similarly, the multivariate linear regression result showed significant associations for blood flux and maximum velocity of all four arteries (p < 0.001) in relation with age.
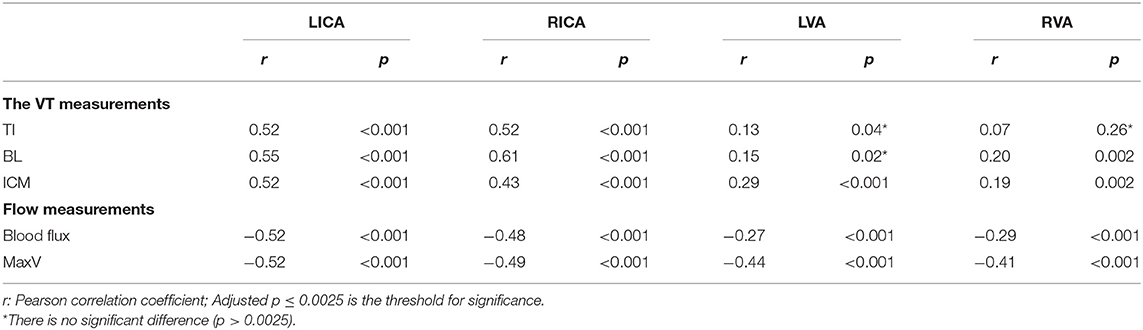
Table 3. Age in relation to the VT and blood flow measurements.
Student's t-test did not show statistically significant difference in VT and flow measurements for all vessels between hypertensive subjects and age- and gender-matched non-hypertensive subjects (p > 0.05 for all measurements). The multivariate linear regression showed systolic and diastolic BP measured before MRI did not significantly associated with VT and blood flow measurements (p > 0.05 for all measurements) after adjusting for age as a covariate.
To further investigate the gender effects, we then compared VT and flow measurements between males (age: 53.62 ± 20.07) and females (age: 53.04 ± 19.45) regardless of age. The VT and the flow of bilateral ICAs did not show any significant difference (p > 0.0025) between males and females. However, within the VA system, females showed significantly higher values of RVA TI (right = 1.37 ± 0.39), BL (left = 5.67 ± 2.87, right = 6.30 ± 3.13), and ICM (left = 1.94 ± 1.18, right = 2.28 ± 1.84) than those of males (TI: right = 1.22 ± 0.21; BL: left = 4.34 ± 2.28, right = 4.43 ± 2.28; ICM: left = 1.50 ± 0.64, right: 1.44 ± 0.68) (p < 0.001). Among flow measurements, males had lower MaxV for bilateral VAs (p < 0.0025). A detailed descriptive statistics and p-values can be found in Table 4.
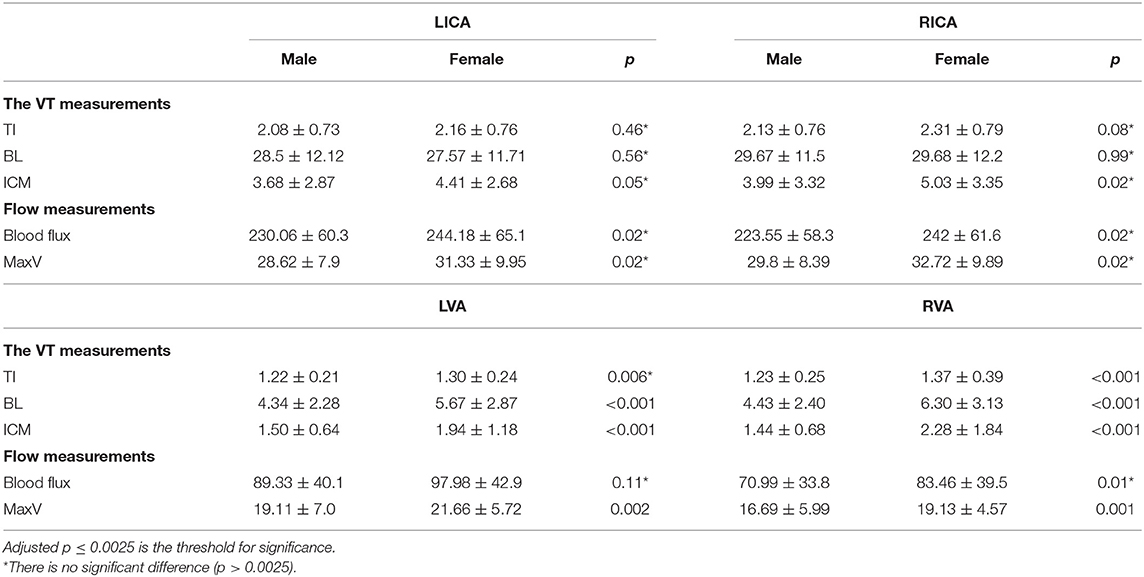
Table 4. Comparison of VT and flow measurements between males (n = 86) and females (n = 161) regardless of age.
We then applied linear regression model on four vessels to reveal the relationship between age and vascular characteristics in females and males separately. A detailed r2 and coefficients were summarized in Table 5. Females had higher absolute values of coefficients, reflecting faster changing patterns associated with age, excluding blood flux of ICAs. We then chose LICA as the representative vessel to show the different changing trends of vascular profiles in relation to the age for different genders (Figure 4). Although t-test did not reveal significant gender difference for bilateral ICAs tortuosity, the general trend still could be observed that females have relatively higher values at elder stage than males.
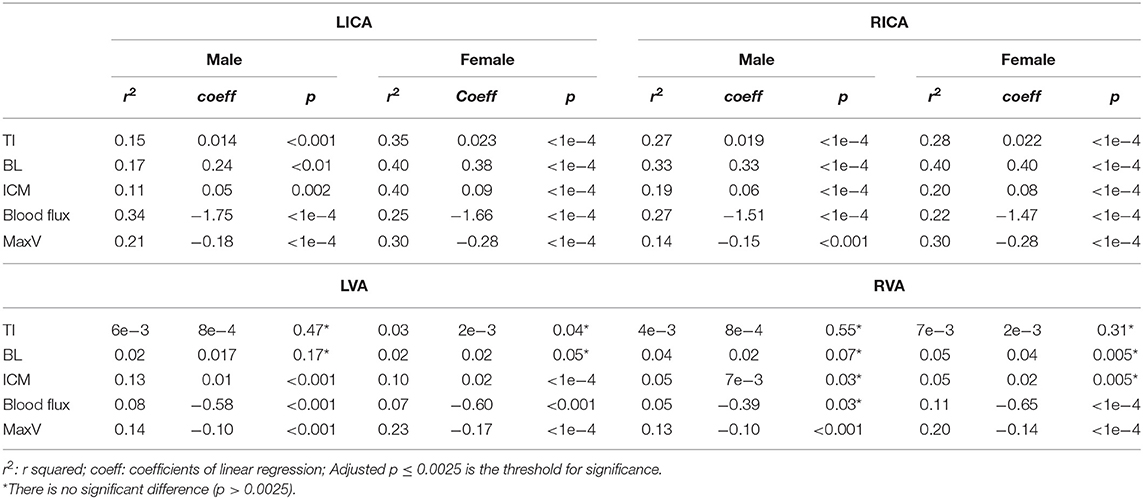
Table 5. The r2 and coefficients of univariate linear regression analysis between age and vascular characteristics for males (n = 86) and females (n = 161).
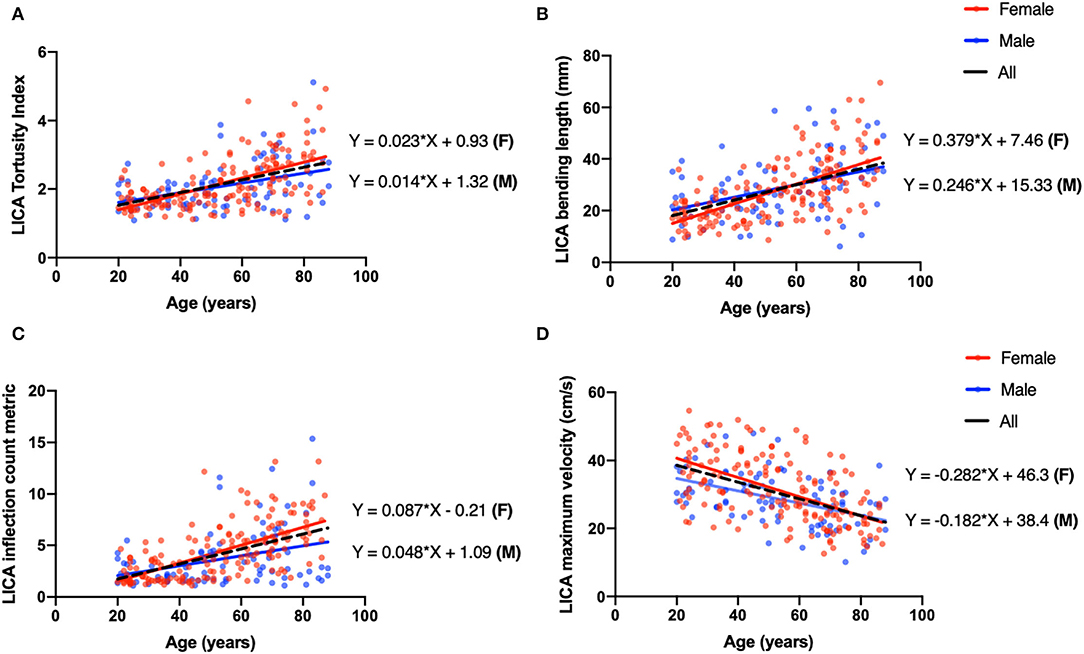
Figure 4. Univariate linear regression plot of left ICA (LICA) as a representative vessel to show the coefficient difference between males (blue) and females (red). (A) The TI of LICA has a positive correlation with age (coeff = 0.018, P < 0.001, black dash line), and the linear correlation coefficients for males and females are 0.014 and 0.023, respectively. (B) Bending length (BL) of LICA is negatively correlated with age (coeff = 0.30, p < 0.001, black dash line), and the linear correlation coefficients for males and females are 0.246 and 0.379, respectively. (C) The ICM of LICA has significantly positive correlation with age (coeff = 0.072, p < 0.001, black dash line). The coefficients for males and females are 0.048 and 0.087. (D) The MaxV of LICA is negatively correlated with age (coeff = −0.247, p < 0.001, black dash line), and coefficients for males and females are −0.182 and −0.282.
Multivariate linear regression was performed to predict flow properties using age, gender and each tortuosity measurement as independent predictors. The VT had no significant contribution to the blood flow predictions (p > 0.05). Significant regression equations were found for MaxV within bilateral ICAs (p < 0.001). We then calculated the correlation coefficients between tortuosity and flow measurements. All tortuosity measurements of ICAs showed significantly negative correlation results. A detailed coefficients with 95% CI, adjusted r2, and p-values are summarized in Table 6.
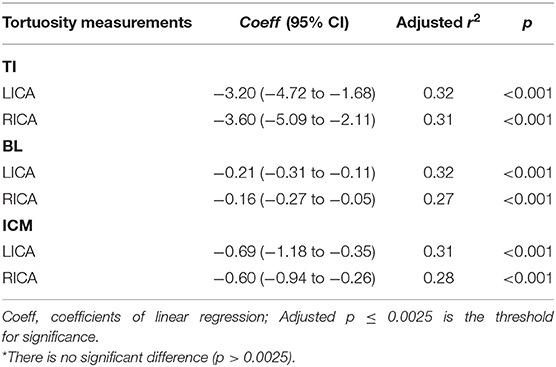
Table 6. The VT measurements in relation to the MaxV within ICAs.
Regarding the accuracy evaluation in the large dataset of 247 subjects, the algorithm successfully extracted vascular skeleton for 204 subjects of all four arteries, with a subject-based successful rate of 82.6%. Artery-wise, the algorithm successfully provided the vascular skeleton for 941 arteries out of a total of 988 (i.e., 247 × 4) arteries with a success rate of 95.2%. Further investigation showed that we can get satisfied arterial segmentation if appropriate threshold was chosen using multi-level algorithms. However, in cases that the centerline tracking algorithm was failed are likely due to the following reasons: (1) The artery has complicated geometry such as coiling where two segments overlapped with each other; (2) the target vessel (i.e., ICA) was very close to the external carotid artery (ECA) and the algorithm falsely identified the ECA as part of ICA. The aforementioned failed vascular tracking can be improved by increasing the signal threshold so that the signals from unwanted vessels can be excluded and the overlapping between two segments or two vessels can be eliminated.
Among these seven subjects with test–retest scans, the algorithm successfully provided the vascular skeleton for all arteries with no failure. The mean and standard error of inter-session CoV for TI, BL, and ICM measurements were 3.0% ± 0.76%, 7.70% ± 2.27%, and 3.0% ± 0.76%, respectively, across all 28 arteries.
The details of the reproducibility of PC–MRI blood flow quantification have been reported by Liu and Peng et al. (25–27). It has been reported that the inter-session CoV for the blood flux across all 28 arteries was 5.25 ± 2.93% and the inter-session CoV for the unit CBF was reported as 7.41 ± 2.99%.
We applied MRA techniques to neck major brain feeding arteries to reveal the VT and flow changes in a large cohort across the adult lifespan. Older subjects demonstrated higher values of tortuosity measurements. Tortuosity of bilateral VAs are less evident than ICAs, which might be due to the anatomical restriction from the transverse foramina of the cervical spine. Age-related higher VT measurements correlate with lower blood flux and velocity in extracranial arteries, suggesting tortuosity changes in the elderly may limit the efficient blood supply and influence neuronal functions, particularly when neural activity is increased with high energy demand. Further, the results in this study provide quantitative VT measurements in each decade, which can be used as reference values for future clinical studies of patients.
Previous studies suggested that the hypertension was associated with damage of arterial walls, which potentially lead to vessel morphological alterations (6, 28). In this study, we did not find the significant effect of hypertension on VT or flow measurements in our cohort. This discrepancy might be attributable to the following factors. First, the pathophysiological effects of hypertension are dependent on the size of vessels where the resistance and BP will be higher for small vessels with narrow lumen (29). The vessels that, when relaxed, measured lesser than 400 μm in lumen diameter are the major site of vascular resistance, which included a network of small arteries (lumen ≈ 100 to 400 μm) and arterioles (<100 μm). The ICAs and VAs, however, are large arteries with relatively low resistance, and this may be why the tortuosity measurements were less affected by the hypertension. Second, the participants in this normal lifespan study are all healthy subjects from DLBS cohort without history of neurological disorders, such as stroke, transient ischemic attack (TIA), cognitive disorders or MMSE lower than 26. Those pathological conditions potentially complicated the interactions between blood pressure, blood flow, and vasculature topology. Third, the number of hypertensive subjects is relatively small, only 13% had diagnosed hypertension whose symptoms were controlled by taking antihypertensive medication; some of them had normal BP at the time of MRI. They are expected to be part of the normal aging process. Last, the mechanisms of vessel wall remodeling from elevated pulse wave velocity associated with hypertension may be different from that of normal aging. Hypertensive-related changes in large elastic arteries, i.e., ICA, represent as thickening of the vascular wall and increased intima-media thickness (IMT) instead of elastin fracture and collagen deposition seen in normal aging (9, 30). Finally, few studies applied quantitative VT assessment method as used in this study; and most of the previous studies revealed the effects of hypertension purely based on categorical data. However, more studies with larger and chronic hypertensive population are necessary to better understand how hypertension affects the vascular topology.
Gender is another important factor affecting vascular properties. It has been suggested that females are prone to have VT, stiffer large arteries and higher pulse pressure (31–33). While our study did not observe significant difference between females and males in bilateral ICAs, more evident age-related changing patterns can be observed in females. Underlying mechanisms may include variations in sex steroid levels and less stable intervertebral joints in females (34). After menopause, females are prone to stiffer and more tortuous large arteries, resulting from declining female sex steroids secretion associated with decreased elastin/collagen ratios (35). Consequently, the arterial wall remodeling can alter the profile of blood flow.
We hypothesized that vessel morphological changes (e.g., twists and turns) may cause a reduction of arterial pressure and flow velocity in the vessel. Therefore, we analyzed the relationship between VT changes characterized on TOF-MRI and blood flow characterized on PC-MRI. Tortuosity measurements were negatively correlated with blood velocity after adjusting age and gender as covariance, whereas, no association was observed between VT and blood flow. It suggested that age contributes the most to the flow reduction instead of tortuous change based on the multiple regression model. We speculated it was sufficient for the vascular elasticity to regulate the vascular resistance induced by VT aiming to maintain sufficient blood flow under resting conditions (36), whereas this regulatory capacity decreases with aging. The reduced blood velocity is attributable to an elevated resistance and reduced pulse pressure induced by VT. The alteration of flow velocity consequently affects WSS, an indicator of atherogenesis and cognitive function impairment (37, 38), which is determined by the velocity gradient from the vessel wall toward the vessel center. The WSS reduction induced by VT increases the risk of plaque formation mediated by inflammatory factors (39). Several in vitro numerical simulation studies have validated that VT results in pressure and flow drops in the distal vessel segments regardless of the bending angles (40, 41). These consequences could further lead to intracranial hypoperfusion and ischemic status.
Extracranial VT changes were investigated extensively with different imaging modalities and our findings are in agreement with most reports, which are largely based on qualitative visual inspection (8, 42–44). There is still an unmet clinical need for quantitative assessment of major brain feeding arteries using clinical imaging. Unlike the most geometric data derived from 2D planar analysis (45–47), our study established an automatic algorithm for 3D vessel segmentation, centerline tracking and VT quantification. While there are several advanced segmentation algorithms developed for complicated vasculature, we applied simplicity multilevel threshold-based segmentation by taking advantage of its fast process and high accuracy (26). Averaged processing time of segmentation, centerline tracking combined with VT computation for a single vessel is within 2 min. In this study, we characterized VT objectively using three rational indices, which addressed the urgency to overcome subjective visual assessment and establish a quantitative tortuosity measurement scheme in clinical settings.
Since our work is built upon a comprehensive quantitative investigation of a large cohort of healthy populations using MRI, the results can potentially serve as normal reference values of each decade in healthy aging. While many studies have been conducted using ultrasound, the accuracy might be limited due to ultrasound's inability and inefficiency to detect thin vessels deep in the tissue or partially hidden behind the bone structures, such as VAs. Meanwhile, the operative-dependent variabilities including the angle of insonation and anatomic location might be introduced. The advantages of MRI over ultrasound include larger coverage, deep vessel detection, and smaller measurement variability (48). Owing to the clinical accessibility and fast acquisition (<5 min), it is practical to perform TOF and PC-MRI as routine scans for quick evaluation of neck vessels regarding intracranial health. The fast and user-interaction algorithm developed in this study makes it feasible to be implemented in MRI scan workstation in the future and provide real-time quantitative measurements of vascular tortuosity.
Some potential limitations of our study should be acknowledged. First, we do not have clinical data regarding some cardiovascular risk factors such as family history of vascular disease, smoking, alcohol use, and hyperlipidemia. Although these risk factors may also be associated with the vessel tortuosity measurements, it is worth noting that the participants in this DLBS study were healthier and more educated than the general population by pre-study screening. Therefore, they were considered as “best-case-scenario” model representing the normal aging effect in the general population with less unwanted noise that potentially confound the biological process (7). Second, in this cohort, there were more female than male participants with the gender ratio almost 2:1, which is primarily due to the reason that females are more willing to participate for this study. However, the detailed tortuosity measurements based on gender were provided in Supplementary Material, and we did not find any gender distribution differences between young and old groups. Third, the vessel diameter or the vessel size was not measured in this study primarily due to the lack of robustness of the techniques used in this study. Last, the tortuosity evaluation for intracranial arteries was not included in this study although morphological variations can present in both intracranial and extracranial arterial segments. This is because the age-related changes of extracranial carotid and vertebral arteries are more common and distinguished due to their eminent anatomical course (no branches) and long length in the neck region. The intracranial segments are often obscured by their complicated route and branches with variable spatial relation with cranial nerve and cavernous sinus (49, 50), which are difficult to be reliably segmented with the methods of this study. The assessment of age-related intracranial VT should be assessed in future studies with specific techniques that are more robust to intracranial segments.
In summary, the levels of age-related VT changes can be quantitatively assessed with the developed vessel segmentation and centerline tracking methods based on fast and non-invasive MRA clinical imaging. Increased tortuosity and decreased blood flow measurements were observed with aging. The blood flow velocity showed an inverse relationship with the tortuosity measurements. The quantitative evaluation of changes of these extracranial major feeding arteries can provide potential indicators of neurological disorders, which would both increase our general understanding of aging and improve clinical treatment and prevention through quantitative analysis of tortuosity levels.
The original contributions presented in the study are included in the article/Supplementary Material, further inquiries can be directed to the corresponding author.
The studies involving human participants were reviewed and approved by UT Southwestern Institutional Review Board. The patients/participants provided their written informed consent to participate in this study.
YG and HL contributed to the conceptualization and design of the study. ZS, DJ, PL, and YC contributed to the methodology and algorithms. ZS, DJ, and PL organized the database. ZS performed the statistical analysis. ZS and YG wrote the first draft of the manuscript. All authors contributed to manuscript revision, read, and approved the submitted version.
This study was funded by the National Institutes of Health Grants (RF1 NS11041, R56 AG060822, R01 NS108491, R13 AG067684, P30 AG066512, and P01 AG060882). This study is also supported by Alzheimer's Association (AARG-17-533484).
The authors declare that the research was conducted in the absence of any commercial or financial relationships that could be construed as a potential conflict of interest.
All claims expressed in this article are solely those of the authors and do not necessarily represent those of their affiliated organizations, or those of the publisher, the editors and the reviewers. Any product that may be evaluated in this article, or claim that may be made by its manufacturer, is not guaranteed or endorsed by the publisher.
The Supplementary Material for this article can be found online at: https://www.frontiersin.org/articles/10.3389/fneur.2022.858805/full#supplementary-material
1. Kamenskiy AV., Pipinos II, Carson JS, MacTaggart JN, Baxter BT. Age and disease-related geometric and structural remodeling of the carotid artery. J Vasc Surg. (2015) 62:1521–8. doi: 10.1016/j.jvs.2014.10.041
2. Wen W, Luo R, Tang X, Tang L, Huang HX, Wen X, et al. Age-related progression of arterial stiffness and its elevated positive association with blood pressure in healthy people. Atherosclerosis. (2015) 238:147–52. doi: 10.1016/j.atherosclerosis.2014.10.089
3. Kotsis V, Stabouli S, Karafillis I, Nilsson P. Early vascular aging and the role of central blood pressure. J Hypertens. (2011) 29:1847–53. doi: 10.1097/HJH.0b013e32834a4d9f
4. El Assar M, Angulo J, Vallejo S, Peiro C, Sanchez-Ferrer CF, Rodriguez-Manas L. Mechanisms involved in the aging-induced vascular dysfunction. Front Physiol. (2012) 3:132. doi: 10.3389/fphys.2012.00132
5. Han HC. Twisted blood vessels: symptoms, etiology and biomechanical mechanisms. J Vasc Res. (2012) 49:185–97. doi: 10.1159/000335123
6. Pancera P, Ribul M, Presciuttini B, Lechi A. Prevalence of carotid artery kinking in 590 consecutive subjects evaluated by Echocolordoppler. Is there a correlation with arterial hypertension? J Intern Med. (2000) 248:7–12. doi: 10.1046/j.1365-2796.2000.00611.x
7. Lu H, Xu F, Rodrigue KM, Kennedy KM, Cheng Y, Flicker B, et al. Alterations in cerebral metabolic rate and blood supply across the adult lifespan. Cereb Cortex. (2011) 21:1426–34. doi: 10.1093/cercor/bhq224
8. Del Corso L, Moruzzo D, Conte B, Agelli M, Romanelli AM, Pastine F, et al. Tortuosity, kinking, and coiling of the carotid artery: expression of atherosclerosis or aging? Angiology. (1998) 49:361–71. doi: 10.1177/000331979804900505
9. Xu X, Wang B, Ren C, Hu J, Greenberg DA, Chen T, et al. Age-related impairment of vascular structure and functions. Aging Dis. (2017) 8:590–610. doi: 10.14336/AD.2017.0430
10. Langille BL. Arterial remodeling: relation to hemodynamics. Can J Physiol Pharmacol. (1996) 74:834–41. doi: 10.1139/y96-082
11. Frosen J, Cebral J, Robertson AM, Aoki T. Flow-induced, inflammation-mediated arterial wall remodeling in the formation and progression of intracranial aneurysms. Neurosurg Focus. (2019) 47:E21. doi: 10.3171/2019.5.FOCUS19234
12. Chesnutt JK, Han HC. Tortuosity triggers platelet activation and thrombus formation in microvessels. J Biomech Eng. (2011) 133:121004. doi: 10.1115/1.4005478
13. Chen JJ, Rosas HD, Salat DH. Age-associated reductions in cerebral blood flow are independent from regional atrophy. Neuroimage. (2011) 55:468–78. doi: 10.1016/j.neuroimage.2010.12.032
14. Tarumi T, Zhang R. Cerebral blood flow in normal aging adults: cardiovascular determinants, clinical implications, and aerobic fitness. J Neurochem. (2018) 144:595–608. doi: 10.1111/jnc.14234
15. Kochanowicz J, Mariak Z, Rutkowski R, Turek G, Lyson T, Krejza J. Age and sex dependency of blood flow velocity in the internal carotid artery. Neurol Neurochir Pol. (2009) 43:3–8. Retrieved from: https://journals.viamedica.pl/neurologia_neurochirurgia_polska/index
16. Krejza J, Szydlik P, Liebeskind DS, Kochanowicz J, Bronov O, Mariak Z, et al. Age and sex variability and normal reference values for the V(MCA)/V(ICA) index. AJNR Am J Neuroradiol. (2005) 26:730–5. Retrieved from: http://www.ajnr.org/
17. Platzek I, Sieron D, Wiggermann P, Laniado M. Carotid artery stenosis: comparison of 3D time-of-flight MR angiography and contrast-enhanced MR angiography at 3T. Radiol Res Pract. (2014) 2014:508715. doi: 10.1155/2014/508715
18. Zhang J, Ding S, Zhao H, Sun B, Li X, Zhou Y, et al. Evaluation of chronic carotid artery occlusion by non-contrast 3D-MERGE MR vessel wall imaging: comparison with 3D-TOF-MRA, contrast-enhanced MRA, and DSA. Eur Radiol. (2020) 30:5805–14. doi: 10.1007/s00330-020-06989-1
19. Tanaka H, Watanabe Y, Nakamura H, Takahashi H, Arisawa A, Fujiwara T, et al. Multiple blood flow measurements before and after carotid artery stenting via phase-contrast magnetic resonance imaging: an observational study. PLoS ONE. (2018) 13:e0195099. doi: 10.1371/journal.pone.0195099
20. Yim PJ, Tilara A, Nosher JL. The paradoxical flow hypothesis of the carotid artery: supporting evidence from phase-contrast magnetic resonance imaging. J Stroke Cerebrovasc Dis. (2008) 17:101–8. doi: 10.1016/j.jstrokecerebrovasdis.2007.10.004
21. De Vis JB, Peng SL, Chen X, Li Y, Liu P, Sur S, et al. Arterial-spin-labeling (ASL) perfusion MRI predicts cognitive function in elderly individuals: a 4-year longitudinal study. J Magn Reson Imaging. (2018) 48:449–58. doi: 10.1002/jmri.25938
22. Otsu NA. Threshold selection method from gray-level histograms. IEEE Trans Syst Man Cybern. (1979) 9:62–6. doi: 10.1109/TSMC.1979.4310076
23. Hassouna MS, Farag AA. Multi-stencils fast marching methods: a highly accurate solution to the eikonal equation on cartesian domains. IEEE Trans Pattern Anal Mach Intell. (2007) 29:1563–74. doi: 10.1109/TPAMI.2007.1154
24. Xu F, Ge Y, Lu H. Noninvasive quantification of whole-brain cerebral metabolic rate of oxygen (CMRO2) by MRI. Magn Reson Med. (2009) 62:141–8. doi: 10.1002/mrm.21994
25. Peng SL, Su P, Wang FN, Cao Y, Zhang R, Lu H, et al. Optimization of phase-contrast MRI for the quantification of whole-brain cerebral blood flow. J Magn Reson Imaging. (2015) 42:1126–33. doi: 10.1002/jmri.24866
26. Liu P, Lu H, Filbey FM, Pinkham AE, McAdams CJ, Adinoff B, et al. Automatic and reproducible positioning of phase-contrast MRI for the quantification of global cerebral blood flow. PLoS ONE. (2014) 9:e95721. doi: 10.1371/journal.pone.0095721
27. Liu P, Xu F, Lu H. Test-retest reproducibility of a rapid method to measure brain oxygen metabolism. Magn Reson Med. (2013) 69:675–81. doi: 10.1002/mrm.24295
28. Spangler KM, Challa VR, Moody DM, Bell MA. Arteriolar tortuosity of the white matter in aging and hypertension. A microradiographic study. J Neuropathol Exp Neurol. (1994) 53:22–6. doi: 10.1097/00005072-199401000-00003
29. Intengan HD, Schiffrin EL. Structure and mechanical properties of resistance arteries in hypertension: role of adhesion molecules and extracellular matrix determinants. Hypertension. (2000) 36:312–8. doi: 10.1161/01.HYP.36.3.312
30. Laurent S, Boutouyrie P. The structural factor of hypertension: large and small artery alterations. Circ Res. (2015) 116:1007–21. doi: 10.1161/CIRCRESAHA.116.303596
31. Martins HFG, Mayer A, Batista P, Soares F, Almeida V, Pedro AJ, et al. Morphological changes of the internal carotid artery: prevalence and characteristics. A clinical and ultrasonographic study in a series of 19 804 patients over 25 years old. Eur J Neurol. (2018) 25:171–7. doi: 10.1111/ene.13491
32. Chiha J, Mitchell P, Gopinath B, Burlutsky G, Kovoor P, Thiagalingam A. Gender differences in the prevalence of coronary artery tortuosity and its association with coronary artery disease. Int J Cardiol Heart Vasc. (2017) 14:23–7. doi: 10.1016/j.ijcha.2016.11.005
33. Waddell TK, Dart AM, Gatzka CD, Cameron JD, Kingwell BA. Women exhibit a greater age-related increase in proximal aortic stiffness than men. J Hypertens. (2001) 19:2205–12. doi: 10.1097/00004872-200112000-00014
34. Stemper BD, Yoganandan N, Pintar FA, Maiman DJ, Meyer MA, DeRosia J, et al. Anatomical gender differences in cervical vertebrae of size-matched volunteers. Spine (2008) 33(2):E44–9. doi: 10.1097/BRS.0b013e318160462a
35. Natoli AK, Medley TL, Ahimastos AA, Drew BG, Thearle DJ, Dilley RJ, et al. Sex steroids modulate human aortic smooth muscle cell matrix protein deposition and matrix metalloproteinase expression. Hypertension. (2005) 46:1129–34. doi: 10.1161/01.HYP.0000187016.06549.96
36. Wacker CM, Bauer WR. Myocardial microcirculation in humans—new approaches using MRI. Herz. (2003) 28:74–81. doi: 10.1007/s00059-003-2451-6
37. van Es AC, van der Flier WM, Box FM, Middelkoop HA, Westendorp RG, van Buchem MA, et al. Carotid and basilar artery wall shear stress in Alzheimer's disease and mild cognitive impairment. Dement Geriatr Cogn Disord. (2009) 28:220–4. doi: 10.1159/000237740
38. Han D, Starikov A, Gransar H, Kolli KK, Lee JH, et al. Relationship between endothelial wall shear stress and high-risk atherosclerotic plaque characteristics for identification of coronary lesions that cause ischemia: a direct comparison with fractional flow reserve. J Am Heart Assoc. (2016) 5:4186. doi: 10.1161/JAHA.116.004186
39. Markl M, Wegent F, Zech T, Bauer S, Strecker C, Schumacher M, et al. In vivo wall shear stress distribution in the carotid artery: effect of bifurcation geometry, internal carotid artery stenosis, and recanalization therapy. Circ Cardiovasc Imaging. (2010) 3:647–55. doi: 10.1161/CIRCIMAGING.110.958504
40. Wang L, Zhao F, Wang D, Hu S, Liu J, Zhou Z, et al. Pressure drop in tortuosity/kinking of the internal carotid artery: simulation and clinical investigation. Biomed Res Int. (2016) 2016:2428970. doi: 10.1155/2016/2428970
41. Li Y, Shi Z, Cai Y, Feng Y, Ma G, Shen C, et al. Impact of coronary tortuosity on coronary pressure: numerical simulation study. PLoS ONE. (2012) 7:e42558. doi: 10.1371/journal.pone.0042558
42. Choudhry FA, Grantham JT, Rai AT, Hogg JP. Vascular geometry of the extracranial carotid arteries: an analysis of length, diameter, and tortuosity. J Neurointerv Surg. (2016) 8:536–40. doi: 10.1136/neurintsurg-2015-011671
43. Thomas JB, Antiga L, Che SL, Milner JS, Steinman DA, Spence JD, et al. Variation in the carotid bifurcation geometry of young versus older adults: implications for geometric risk of atherosclerosis. Stroke. (2005) 36:2450–6. doi: 10.1161/01.STR.0000185679.62634.0a
44. Lam RC, Lin SC, DeRubertis B, Hynecek R, Kent KC, Faries PL. The impact of increasing age on anatomic factors affecting carotid angioplasty and stenting. J Vasc Surg. (2007) 45:875–80. doi: 10.1016/j.jvs.2006.12.059
45. Togay-Isikay C, Kim J, Betterman K, Andrews C, Meads D, Tesh P, et al. Carotid artery tortuosity, kinking, coiling: stroke risk factor, marker, or curiosity? Acta Neurol Belg. (2005) 105:68–72.
46. Khasiyev F, Rundek T, Di Tullio MR, Wright CB, Sacco RL, Elkind MSV, et al. Systemic arterial correlates of cervical carotid artery tortuosity: the Northern Manhattan study. Clin Neuroradiol. (2021). doi: 10.1007/s00062-021-01044-y
47. Welby JP, Kim ST, Carr CM, Lehman VT, Rydberg CH, Wald JT, et al. Carotid artery tortuosity is associated with connective tissue diseases. AJNR Am J Neuroradiol. (2019) 40:1738–43. doi: 10.3174/ajnr.A6218
48. Duivenvoorden R, de Groot E, Elsen BM, Lameris JS, van der Geest RJ, Stroes ES, et al. In vivo quantification of carotid artery wall dimensions: 3.0-Tesla MRI versus B-mode ultrasound imaging. Circ Cardiovasc Imaging. (2009) 2:235–42. doi: 10.1161/CIRCIMAGING.108.788059
49. Metgudmath RB, Metgudmath AR, Metgudmath VV, Jainkeri V. Variations of the cervical internal carotid artery. Indian J Otolaryngol Head Neck Surg. (2013) 65:210–3. doi: 10.1007/s12070-011-0408-2
Keywords: aging, carotid artery, vascular tortuosity, blood flow, magnetic resonance angiography
Citation: Sun Z, Jiang D, Liu P, Muccio M, Li C, Cao Y, Wisniewski TM, Lu H and Ge Y (2022) Age-Related Tortuosity of Carotid and Vertebral Arteries: Quantitative Evaluation With MR Angiography. Front. Neurol. 13:858805. doi: 10.3389/fneur.2022.858805
Received: 20 January 2022; Accepted: 30 March 2022;
Published: 29 April 2022.
Edited by:
Chengcheng Zhu, University of Washington, United StatesCopyright © 2022 Sun, Jiang, Liu, Muccio, Li, Cao, Wisniewski, Lu and Ge. This is an open-access article distributed under the terms of the Creative Commons Attribution License (CC BY). The use, distribution or reproduction in other forums is permitted, provided the original author(s) and the copyright owner(s) are credited and that the original publication in this journal is cited, in accordance with accepted academic practice. No use, distribution or reproduction is permitted which does not comply with these terms.
*Correspondence: Yulin Ge, eXVsaW4uR2VAbnl1bGFuZ29uZS5vcmc=
Disclaimer: All claims expressed in this article are solely those of the authors and do not necessarily represent those of their affiliated organizations, or those of the publisher, the editors and the reviewers. Any product that may be evaluated in this article or claim that may be made by its manufacturer is not guaranteed or endorsed by the publisher.
Research integrity at Frontiers
Learn more about the work of our research integrity team to safeguard the quality of each article we publish.