
94% of researchers rate our articles as excellent or good
Learn more about the work of our research integrity team to safeguard the quality of each article we publish.
Find out more
ORIGINAL RESEARCH article
Front. Neurol., 01 April 2022
Sec. Stroke
Volume 13 - 2022 | https://doi.org/10.3389/fneur.2022.809343
This article is part of the Research TopicLeveraging Machine and Deep Learning Technologies for Clinical Applications in Stroke ImagingView all 7 articles
 Lucas A. Ramos1,2*
 Hendrikus van Os3
 Adam Hilbert1,4
 Silvia D. Olabarriaga2
 Aad van der Lugt5
 Yvo B. W. E. M. Roos6
 Wim H. van Zwam7Marianne A. A. van Walderveen8
 Marielle Ernst9
 Aeiko H. Zwinderman2
 Gustav J. Strijkers1
 Charles B. L. M. Majoie10
 Marieke J. H. Wermer3
 Henk A. Marquering1,10
Background: Accurate prediction of clinical outcome is of utmost importance for choices regarding the endovascular treatment (EVT) of acute stroke. Recent studies on the prediction modeling for stroke focused mostly on clinical characteristics and radiological scores available at baseline. Radiological images are composed of millions of voxels, and a lot of information can be lost when representing this information by a single value. Therefore, in this study we aimed at developing prediction models that take into account the whole imaging data combined with clinical data available at baseline.
Methods: We included 3,279 patients from the MR CLEAN Registry; a prospective, observational, multicenter registry of patients with ischemic stroke treated with EVT. We developed two approaches to combine the imaging data with the clinical data. The first approach was based on radiomics features, extracted from 70 atlas regions combined with the clinical data to train machine learning models. For the second approach, we trained 3D deep learning models using the whole images and the clinical data. Models trained with the clinical data only were compared with models trained with the combination of clinical and image data. Finally, we explored feature importance plots for the best models and identified many known variables and image features/brain regions that were relevant in the model decision process.
Results: From 3,279 patients included, 1,241 (37%) patients had a good functional outcome [modified Rankin Scale (mRS) ≤ 2] and 1,954 (60%) patients had good reperfusion [modified Thrombolysis in Cerebral Infarction (eTICI) ≥ 2b]. There was no significant improvement by combining the image data to the clinical data for mRS prediction [mean area under the receiver operating characteristic (ROC) curve (AUC) of 0.81 vs. 0.80] above using the clinical data only, regardless of the approach used. Regarding predicting reperfusion, there was a significant improvement when image and clinical features were combined (mean AUC of 0.54 vs. 0.61), with the highest AUC obtained by the deep learning approach.
Conclusions: The combination of radiomics and deep learning image features with clinical data significantly improved the prediction of good reperfusion. The visualization of prediction feature importance showed both known and novel clinical and imaging features with predictive values.
Approximately one-third of patients who suffer from acute ischemic stroke die or become functionally dependent, making stroke a very severe condition worldwide (1). An occlusion in one of the major cerebral arteries is present in one-third of patients, and is often referred as large vessel occlusion (LVO) (2). Endovascular treatment (EVT) is the standard treatment for LVO, and its great benefits have been proven extensively (3–6). However, despite successful treatment, ~30% of patients still present a poor outcome at 3 months. The outcome after treatment is dependent on multiple factors, from patient characteristics and condition to severity and location of the occlusion (7). Accurate prediction of patient outcome has been explored in several studies and it is of utmost importance to correctly identify patients who will and who will not have a good outcome after EVT. This information can be used to further personalize acute stroke care (7, 8).
Most prediction models found in literature focused on the small subsets of clinical features (7), although some recent studies have explored a broader set of variables (8, 9). In most cases, information in radiological images was included in the form of visual scores, such as Alberta stroke program early CT score (ASPECTS) and the collateral score. However, translating millions of voxels in a radiological image to one or several visual scores with a limited number of categories can potentially result in significant information loss.
In this study we explored a more extensive feature representation of radiological images, such as a multitude of handcrafted features (radiomics) and automatically learned features using deep learning approaches. We hypothesized that a more extensive image feature representation can lead to an improved outcome prediction of patients with ischemic stroke through leveraging information that is complementary to or more detailed than radiological scores. On the other hand, a deep learning approach allows the extraction of images features that are automatically learned by the network, reducing the risk of bias. We performed the combination of automatically extracted images features with patient data available at baseline, and evaluated their impact on the prediction accuracy of both clinical and radiological outcomes. Finally, we presented the feature importance for the best models and their impact in the predictions.
We included 3,279 patients from the MR CLEAN Registry, which is a prospective, observational, multicenter study, that consecutively included all EVT-treated patients with acute ischemic stroke in the Netherlands since the completion of the MR CLEAN trial in March 2014 (10). The central medical ethics committee of the Erasmus Medical Center Rotterdam, the Netherlands, evaluated the study protocol and granted permission (MEC-2014–235) to carry out the data collection as a registry (11). Patients provided permission for study participation through an opt-out procedure. Data that have been used for this study are available upon reasonable request from the MR CLEAN Registry committee (bXJjbGVhbkBlcmFzbXVzbWMubmw=).
All radiological and clinical variables available at baseline were included in the models. In total, 50 variables were selectively included. Ordinal variables, such as pre-stroke modified Rankin Scale (mRS), collaterals, ASPECTS, National Institutes of Health Stroke Scale (NIHSS), Clot Burden Score (CBS), and Glasgow Coma Scale were treated as linear continuous scores. For non-ordinal variables with multiple categories, we created separate binary variables for all categories. The final input size for the models consisted of 58 features. A complete list of variables available can be found in Table 1.
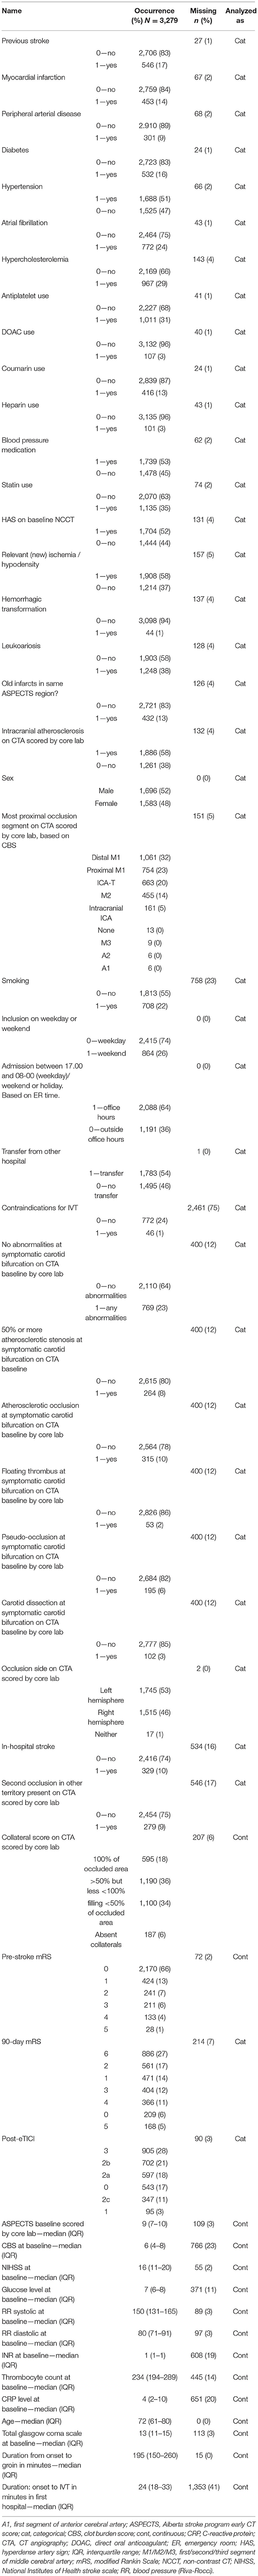
Table 1. Details of included variables.
We created the two sets of prediction models for the following outcome variables, (1) favorable functional outcome after 3 months, defined by the mRS ≤ 2 and (2) good reperfusion defined by the modified Thrombolysis in Cerebral Infarction (eTICI)-score after EVT (post-eTICI ≥ 2b).
We included CT angiography (CTA) scans from all patients available in the dataset, following the approach from (12), where the added value of CTA for outcome predictions has already been proven. The first step in pre-processing the images was to strip the skull, since it contains voxels that are not relevant for the prediction tasks (13). For this segmentation task, we used a U-Net (14), (a convolutional neural network designed for the segmentation of biomedical images) trained on skull segmentations that were created using the approach described in (15) and subsequently manually corrected.
Since the slice thickness and the orientation of the head varied significantly between different scans, we registered the images to a reference scan using rigid and affine transformations. For this, we used an atlas as a reference scan (16), with a size of 256 × 256 × 90 voxels. This atlas was developed using the Laboratory of Neuro Imaging Probabilistic Brain Atlas (LPBA40), which is publicly available (17). The atlas served not only as a reference for registration, but it also contains the annotation of 70 brain regions, which allowed the region-based feature extraction.
For the first approach, we computed radiomics features for each of the 70 brain regions of the scans that were registered to the atlas. An advantage of crafting features from specific regions is that we can easily trace back which regions of the brain were the most important for prediction. We used all 70 regions contained in the atlas. For each region, 18 first-order features (Supplementary Table I) were computed using the Pyradiomics library (18). This resulted in a total of 1,260 features. Since some regions overlapped and others were relatively small, we checked the correlation between the features using the Pearson correlation coefficient. Due to the large number of correlated features, we only kept the ones that were <50% correlated to the others (19) reducing the number of radiomics features to 68. This was necessary since multiple highly correlated features (multicollinearity) can hamper learning (19). For example, in the case of Logistic Regression (LR), multicollinearity can lead severe variations in the coefficients, making the results less robust and trustworthy. Moreover, the large number of features would also be a problem because of the limited sample size n = 3,001 (20). A complete list of the computed features is presented in the Supplementary Table I. These features were subsequently combined (concatenated) with the clinical data available at baseline and used to create prediction models for the outcomes. We selected the following state-of-the-art machine learning techniques from different families: random forest classifier (RFC) (21), support vector machine (SVM) (22), artificial neural networks (NN) (23), gradient boosting (XGB) (24), and logistic regression (LR).
In the deep learning approach, the skull-stripped scans were used to train convolutional neural networks (CNNs) to predict the outcome. We opted for using skull-stripped scans prior to the image registration to keep the information in the scans as raw as possible, and avoid changes in the Hounsfield units caused by the registration process. Moreover, we included transformations for data augmentation, such as rotation and flipping, which makes registration a futile step. Therefore, the registered scans were only used in radiomics approach. Since the input for deep learning models has to be uniform, and the voxel size among scans was not, we resampled the scans in all directions. The final input size to the network was 256 × 256 × 30 voxels. To increase the number of training samples and account for possible variations in the data, we performed data augmentation (vertical flipping and rotation) using the training set. We trained and optimized 3D CNNs to predict the favorable functional outcome and good reperfusion.
We selected the ResNet10 architecture since it has produced comparable results to the deeper architectures in medical imaging related tasks (25) while keeping training time feasible. For each network implemented, we added a Squeeze and Excitation (SE) module before the fully-connected layers (26), since it has been shown to greatly improve the results in diverse ResNet models in multiple prediction tasks. The SE module models interdependencies between channels by adding learnable weights channels-wise. This way, the contribution of certain features in a given channel can have more or less impact than the others in the final prediction. Finally, we combined the clinical features with the image features by concatenating the clinical features to the image features before the fully-connected layers of the CNN (27–29).
The models were trained from scratch with the SE module. Finally, we explored the effect of Transfer Learning in our models, leveraging the model developed in (25). In that model, the aim was to develop a robust ResNet by training it in a large amount of medical data (by putting together multiple datasets), such as CT and MRI scans. The resulting CNN was able to learn filters that can extract relevant image features and generalized well to other tasks, making it ideal for transfer learning to other datasets with less images.
The ResNet model was trained from scratch for 75 epochs, and for 50 epochs when Transfer Learning was used. Following the results presented in (30), we opted to train the models built from scratch for longer than those using Transfer Learning to allow for a more fair comparison. We optimize our models using the Focal Loss (31), since there was some class imbalance in our labels (~0.4/0.6 for both labels). Finally, we used an Adam optimizer (32), with a learning rate of 0.001 and the weight decay to 0.00006. The other hyper-parameters were left unchanged. The mini-batch size was kept at two due to memory limitations.
Several of the 58 clinical variables included in our experiments had missing values. We imputed the missing values (from the features and outcomes) using Multiple Imputation with Chained Equations (33), since it has shown the state-of-the-art results. Imputation was performed on the training and test sets separately, by training the imputation model on the training set and applying it to the test set to prevent the data leakage. The data were then scaled by subtracting the mean and divided by the standard deviation (SD), for the optimal performance of ML models. We used an inner and outer k-fold cross-validation strategy (nested cross-validation) to train, validate, and test our models. First, in the outer cross-validation loop, the dataset was split into training and testing using a 5-fold cross-validation strategy (4-folds are used for training and 1 for testing). The training set was then split again (inner-cross-validation) into training and validation, with 20% being used for validation. The validation set is used to assess the model performance during training, for early-stopping and for hyper-parameter optimization. All experiments (based on radiomics or deep learning) used the same cross-validation setup described above. The list of the hyper-parameters used to optimize the models is shown in the Supplementary Table II. The assessment and final reporting of performance was done on the test sets.
For each approach, we designed four experiments to predict the outcomes: first (coined clinical), using all clinical features available at baseline, therefore including patient demographics and image-derived scores, such as ASPECTS; second (coined image), using only the features hand-crafted or learned (radiomics or deep learning features) from the CTA scans; third (coined combination), by combining all the features from the first experiment with the features of the second (all clinical data available at baseline, such as image scores, and features learned from CTA scans), and fourth (coined no image score), by repeating the first and third experiments, but without any image derived scores, such as ASPECTS or collateral scores.
We evaluated the models using the area under the receiver operating characteristic (ROC) curve (AUC), the negative predictive value (NPV), the positive predictive value (PPV), the sensitivity, and specificity. To assess statistically significant differences between the models, we reported the confidence intervals (CIs) for all the cross-validation iterations and used McNemar's and Delong's tests (34, 35).
A diagram is presented in Figure 1 with an overview of the main imaging pre-processing steps and data combination approaches.
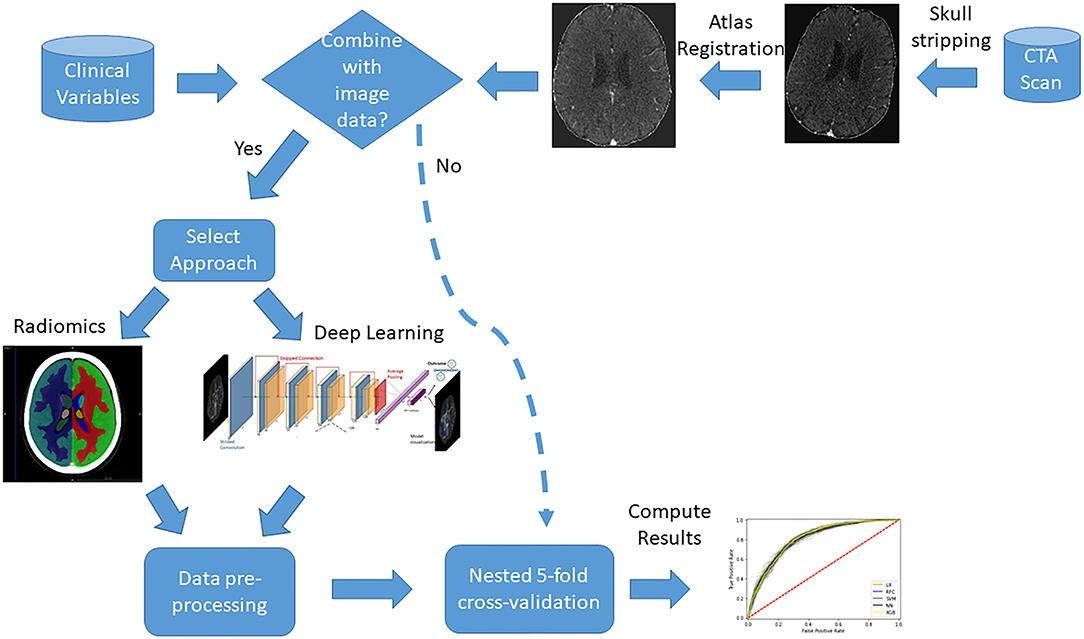
Figure 1. Diagram with an overview of the main data pre-processing steps and combination approaches.
All codes used for the development of models and data analysis are available at: https://github.com/L-Ramos/mrclean_combination.
To visualize the feature importance in our models, we used SHapley Additive exPlanations (SHAP), which is based on a game theory to explain the output of any machine learning model (36). In SHAP, the contribution of a feature is given by computing the average contribution of all features by permuting all of them. SHAP has many advantages over other feature visualization techniques, such as Local Interpretable Model-agnostic Explanations (LIME) (37). SHAP provides global explanations instead of sample-oriented ones, offers tools to evaluate the feature dependence and interactions and, the output explanations are generated based on the trained model provided by the user, instead of training a new model to explain the feature importance, which is the case for LIME. Finally, with SHAP, the impact of low and high values of a given feature in the final outcome can be more clearly evaluated with the plots, along with how important the feature is in predicting the correct class (36). Positive SHAP values (above zero in the x-axis) mean that the feature values are associated to the positive class (good functional outcome or reperfusion), while SHAP values below zero indicate the opposite.
Of 3,279 patients that were eligible for this study, 278 were excluded due to either failure during skull-stripping (133 patients), or because of incomplete scans, severe artifacts or due to failure during image registration (145 patients). In total, 3,001 patients were included, the mean age was 72 years old, and median baseline NIHSS was 16 (Table 1). At 90 days, 1,241 (37%) patients had a good functional outcome (mRS ≤ 2) with 214 missing values (7%). Regarding reperfusion (post-eTICI ≥ 2b), 1,954 (60%) patient had good reperfusion after treatment, with 90 missing values (3%). Figure 2 contains a few examples of skull-stripped scans (on the left) and a few examples of scans that were registered to the atlas (on the right). It is important to highlight that due to registration, the scans no longer have the same slice thickness and number of slices, so there is no one-to-one matching.
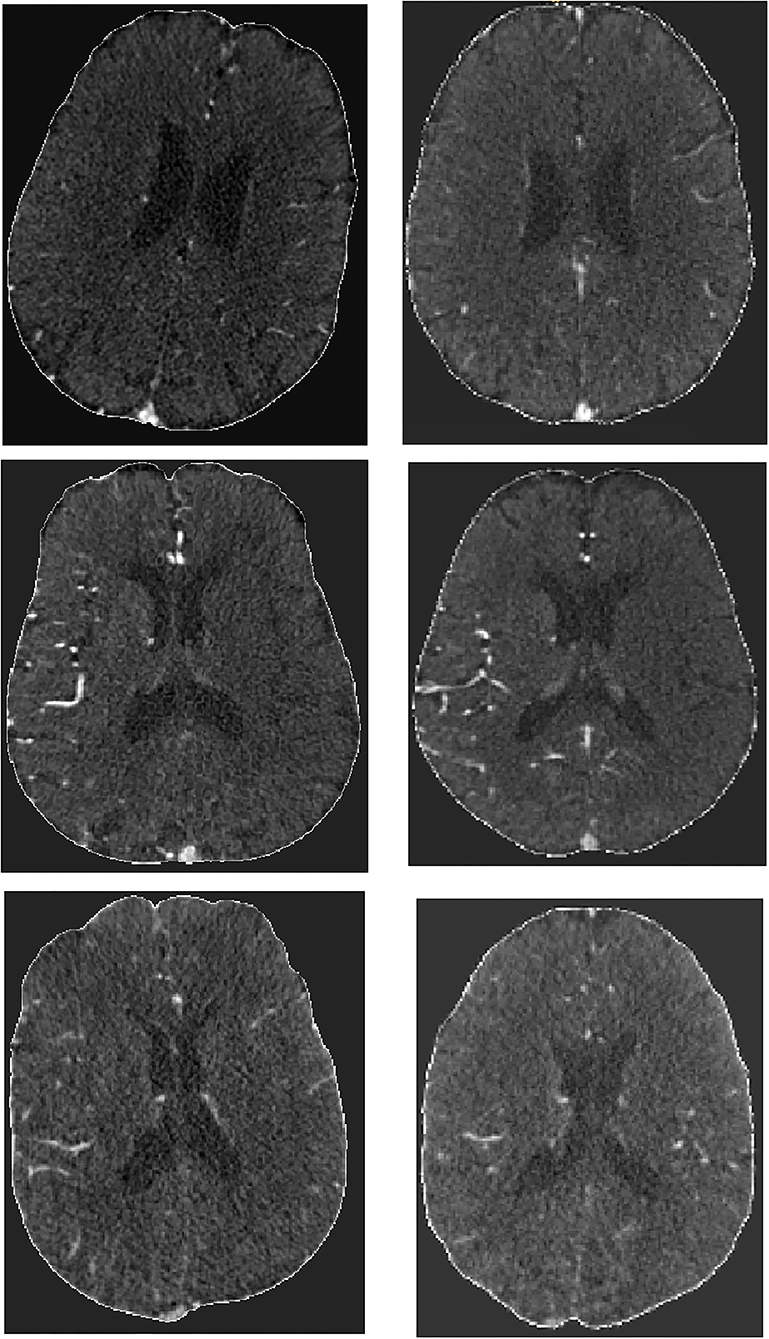
Figure 2. Example of skull stripped scans (Left) and post-registration results (Right).
We present the results of good functional outcome prediction using the radiomics approach in Table 2. The AUC value was the highest for the clinical experiment (0.81), though it does not differ significantly from the combination experiment. The AUC is the lowest for the image experiment (0.69). For the combination experiment, the best AUC was 0.80. Sensitivity was the highest for the clinical experiment (0.79), while specificity was the highest for the combination (0.77). The difference between the clinical and the combination experiments was not statistically significant (p = 0.12) for the RFC.
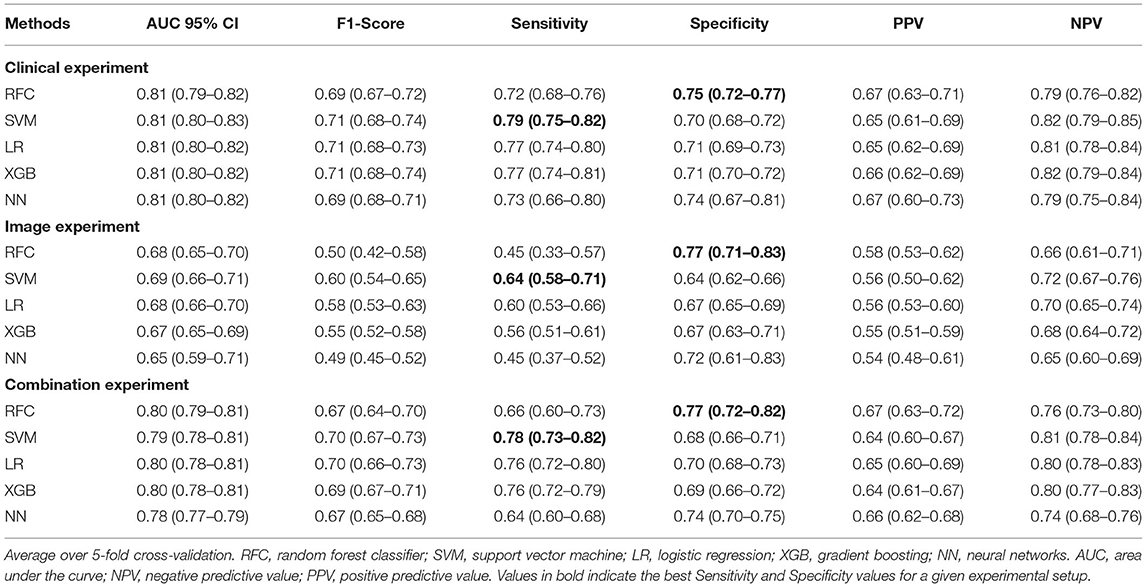
Table 2. Results of the clinical, image, and combination for the radiomics approach for predicting the good functional outcome (mRS ≤ 2).
There was no significant difference (drop of 0.01 or at most 0.02 in the average of all measures) in the results of the no image score experiment when compared with other experiments as shown in Supplementary Table III.
In Table 3, we show the results for good reperfusion prediction (post-eTICI ≥ 2b). The highest AUC was for the combination experiment (0.57), while the lowest was for the clinical experiment (0.51). Sensitivity was the highest (0.91) for the image experiment, but specificity was the lowest (0.11), showing that the RFC model might be biased toward one of the classes in this experiment. The same does not occur for all models in the image experiment, LR for instance, shows a good balance between sensitivity and specificity values for all experiments. The difference between the clinical and the combination experiments was statistically significant, p = 0.008 for the RFC. We provide results from the Delong test in Table 6, which confirmed that the difference between the clinical and combinations experiments was statistically significant.
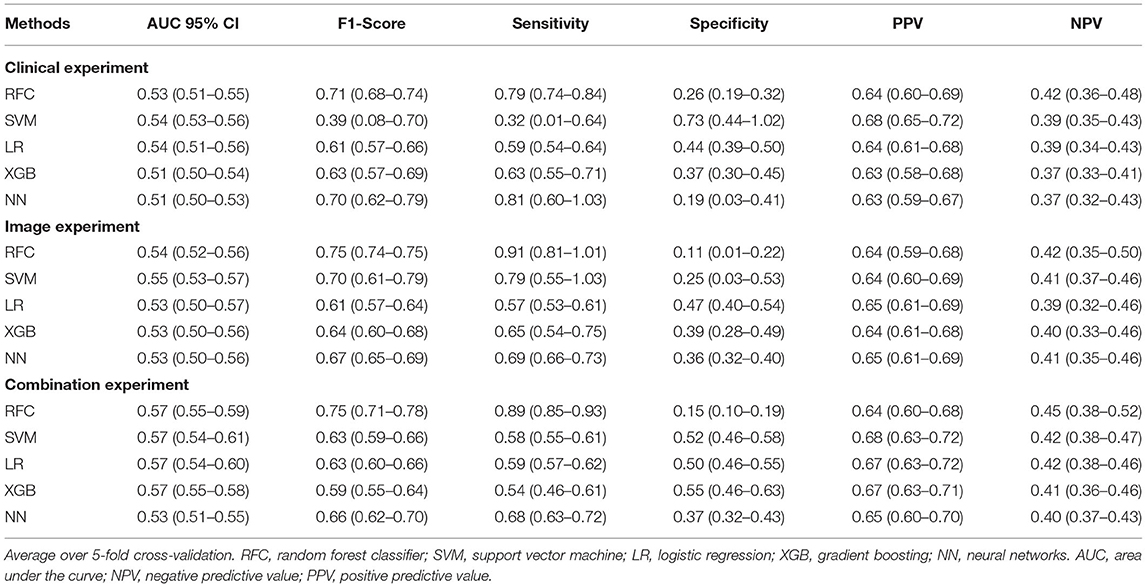
Table 3. Results of the clinical, image, and combination experiments for the radiomics approach for predicting the good reperfusion [post-modified Thrombolysis in Cerebral Infarction (eTICI) ≥ 2b].
We present the ROC curves for all models trained in the clinical experiment for predicting mRs in Figure 3A and a comparison between the clinical and combination experiment for predicting eTICI in Figure 3B. Moreover, we provide the confusion matrices for the clinical and combination experiments for mRs in Figure 4A and eTICI in Figure 4C.
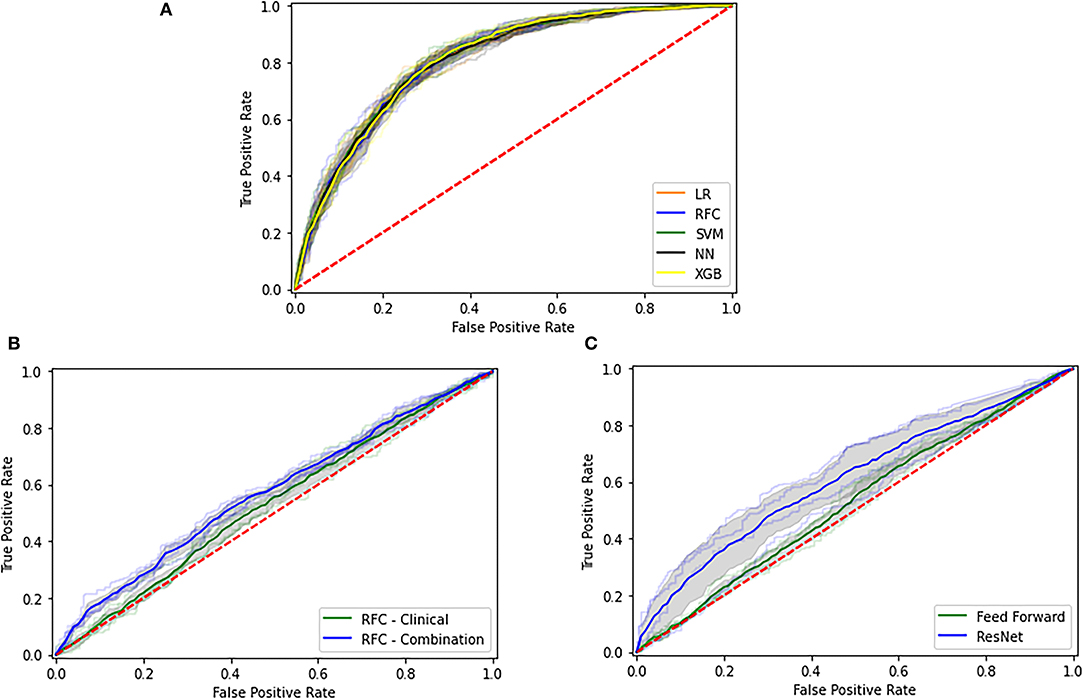
Figure 3. Receiver operating characteristic (ROC) for the different experimental setups. (A) The modified Rankin Scale (mRs) prediction for the clinical experiment, (B) Modified Thrombolysis in Cerebral Infarction (eTICI) prediction using the radiomics data, and (C) eTICI prediction using deep learning.
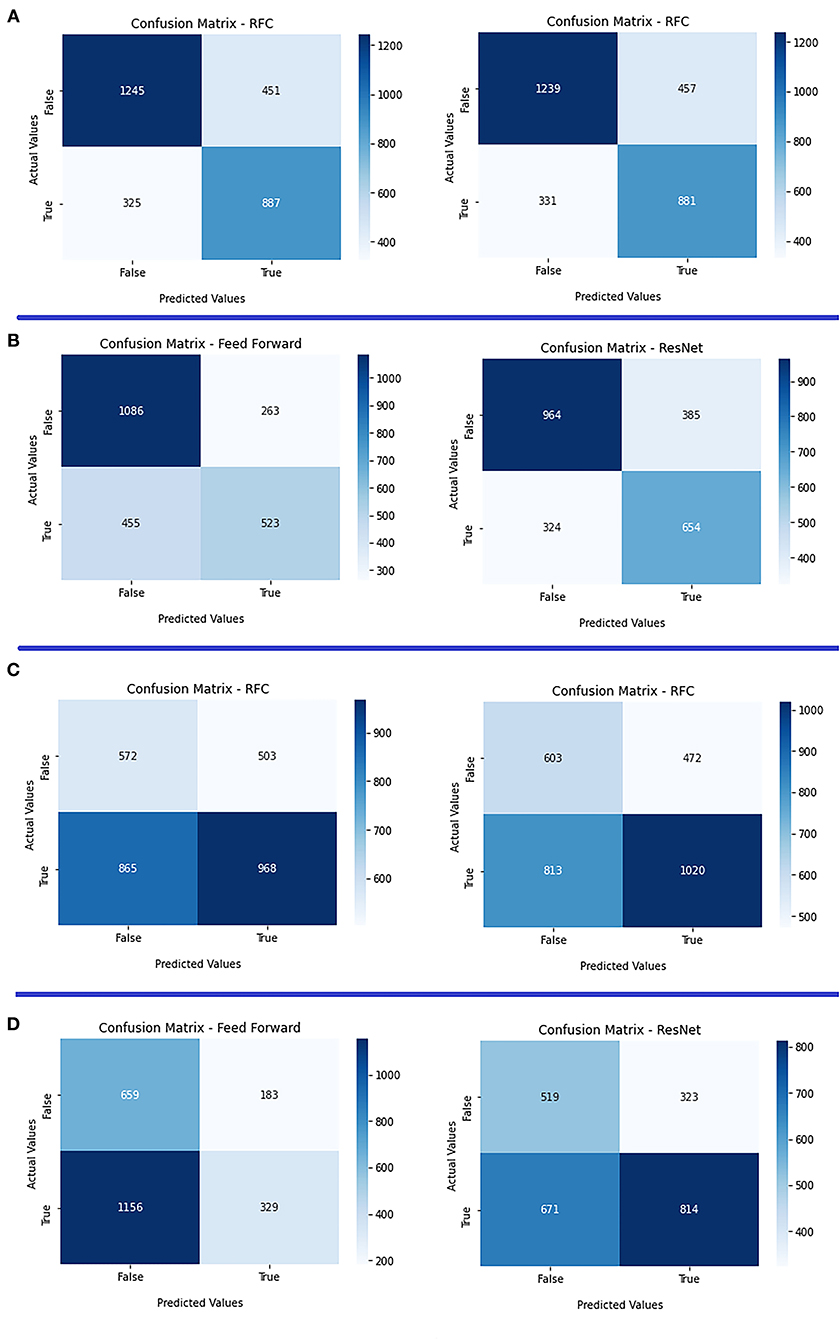
Figure 4. Confusion matrices of both radiomics and deep learning approaches. (A) Clinical experiment (left) vs. combination (right) for mRs prediction using the radiomics approach; (B) clinical experiment (left) vs. combination (right) for mRs prediction using the deep learning approach; (C) clinical experiment (left) vs. combination (right) for eTICI prediction using radiomics approach; and (D) clinical experiment (left) vs. combination (right) for eTICI prediction using the deep learning approach.
Finally, there was no significant difference in the measures for the no image scores experiment as shown in Supplementary Table IV.
In Figures 5, 6, we present feature importance using SHAP for the clinical (Figure 5) and the combination (Figure 6) experiments for RFC model and mRS prediction (for all 5-fold cross-validation iterations). We do not present feature importance for the Image experiment since results for this experiment were often inferior and in clinical practice, patient demographics are always taken into account for decision-making. The performance measures were the same across the models, therefore, we present feature importance for the RFC model only, since SHAP has extensive support for three-based models. Despite the addition of multiple radiomics features in the combination experiment, the top three most important features remain the same for both experiments (age, NIHSS at baseline, and pre-stroke mRS). Ii is clear that the low values of these three features are associated with good functional outcome. Collateral score and the GCS become more important when the radiomics features are combined to the clinical data. Other features, such as leukoariosis and sex seem to lose importance when the radiomics features are combined. Finally, radiomics features from the following regions seem to have a significant impact on the prediction model, despite the lack of improvements in the performance measures: precuneus cortex, middle frontal gyrus, superior temporal gyrus, temporal fusiform cortex, frontal orbital cortex, lateral occipital cortex, and subcallosal cortex.
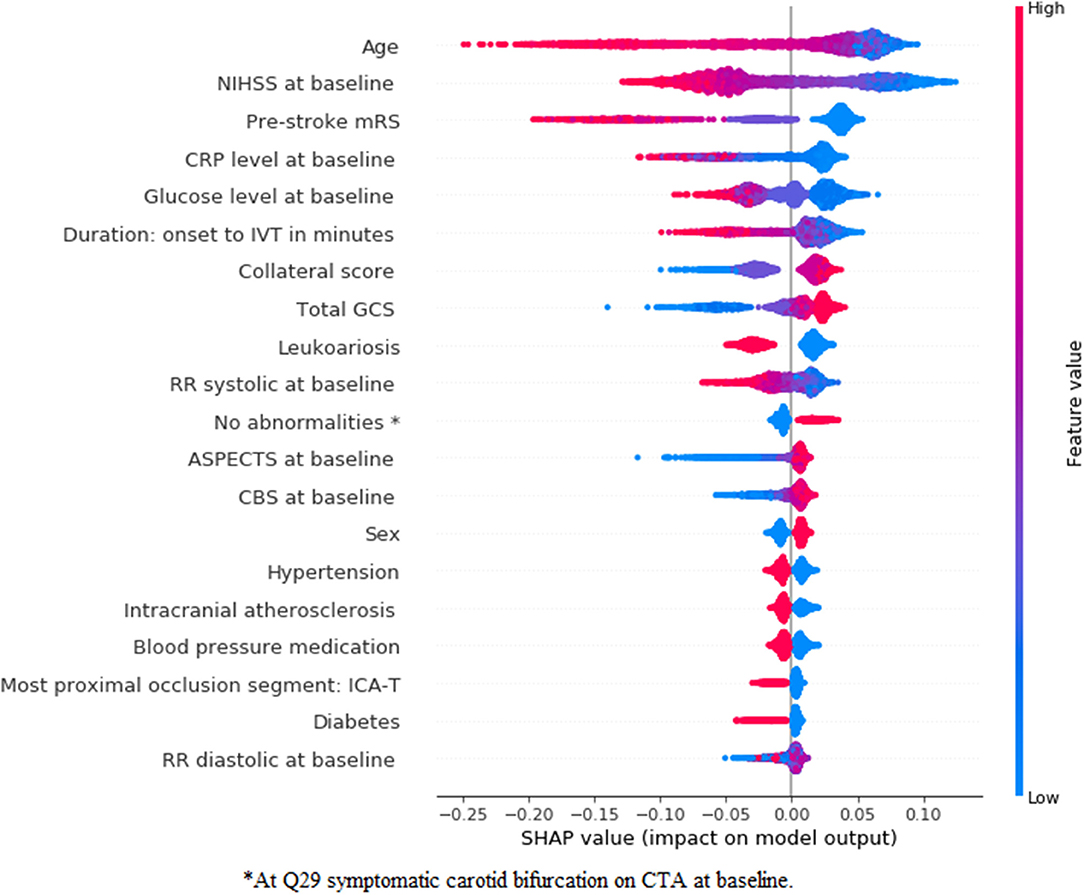
Figure 5. SHapley Additive exPlanations (SHAP) feature importance for the clinical experiment for mRS prediction using the random forest classifier (RFC) model. For visualization purposes, we included only the top 20 features. Features are shown in order of importance, from most important (top) to less important (bottom). The color legend on the right shows how the feature values influence outcome: high values are depicted in red, while low values are presented in blue. Positive SHAP values (above zero in the x-axis) mean that the feature values are associated to the positive outcome (in this case good functional outcome), while SHAP values below zero indicate the opposite. *At symptomatic carotid bifurcation on CT angiography (CTA) at baseline.
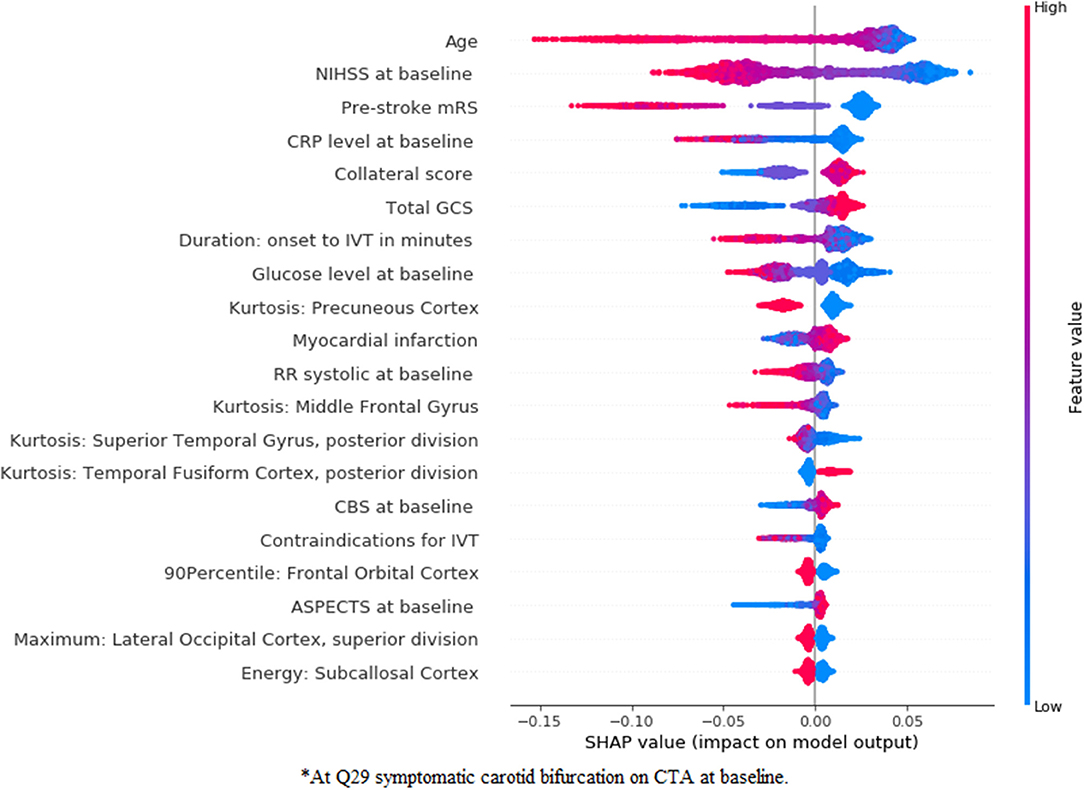
Figure 6. SHapley Additive exPlanations feature importance for the combination experiment for mRS prediction using an RFC model. For visualization purposes, we included only the top 20 features. Features are shown in order of importance, from most important (top) to less important (bottom). The color legend on the right shows how the feature values influence outcome: high values are depicted in red, while low values are presented in blue. Positive SHAP values (above zero in the x-axis) mean that the feature values are associated with the positive outcome (in this case good functional outcome), while SHAP values below zero indicate the opposite. *At symptomatic carotid bifurcation on CTA at baseline.
In Figures 7, 8, we show the feature importance using SHAP for the clinical (Figure 7) and combination (Figure 8) experiments for the prediction of good reperfusion using an RFC model. In this case, the most important features are different from each other when comparing both experiments. While the duration from onset to Intravenous Thrombolysis (IVT), the RR systolic, C-reactive protein (CRP) level, and age seem to be the most important for the clinical experiment, these features are all replaced by many radiomics features from multiple brain regions in the combination experiment. In addition, this difference can also explain the slightly increased performance of the combination experiment when compared with the clinical and image ones.
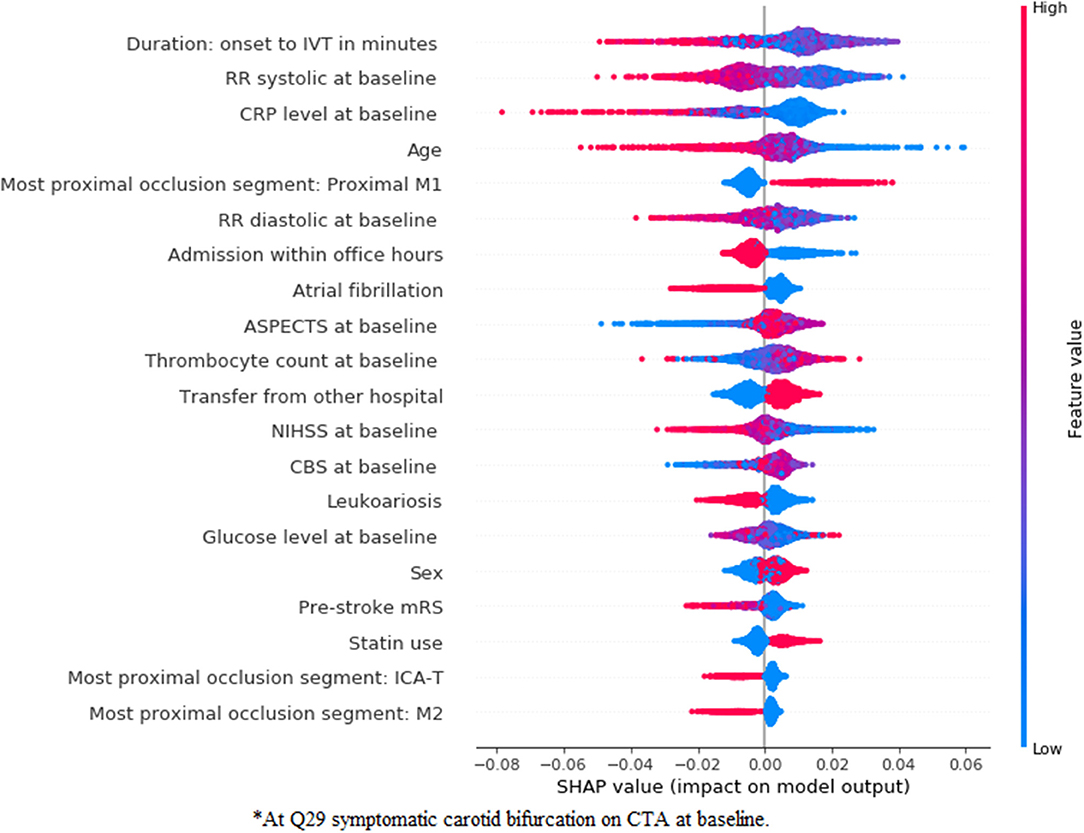
Figure 7. SHapley Additive exPlanations feature importance for the clinical experiment for the prediction of good reperfusion using an RFC model. For visualization purposes we included only the top 20 features. Features are shown in order of importance, from most important (top) to less important (bottom). The color legend on the right shows how the feature values influence outcome: high values are depicted in red, while low values are presented in blue. Positive SHAP values (above zero in the x-axis) mean that the feature values are associated to the positive outcome (in this case good r), while SHAP values below zero indicate the opposite. *At symptomatic carotid bifurcation on CTA at baseline.
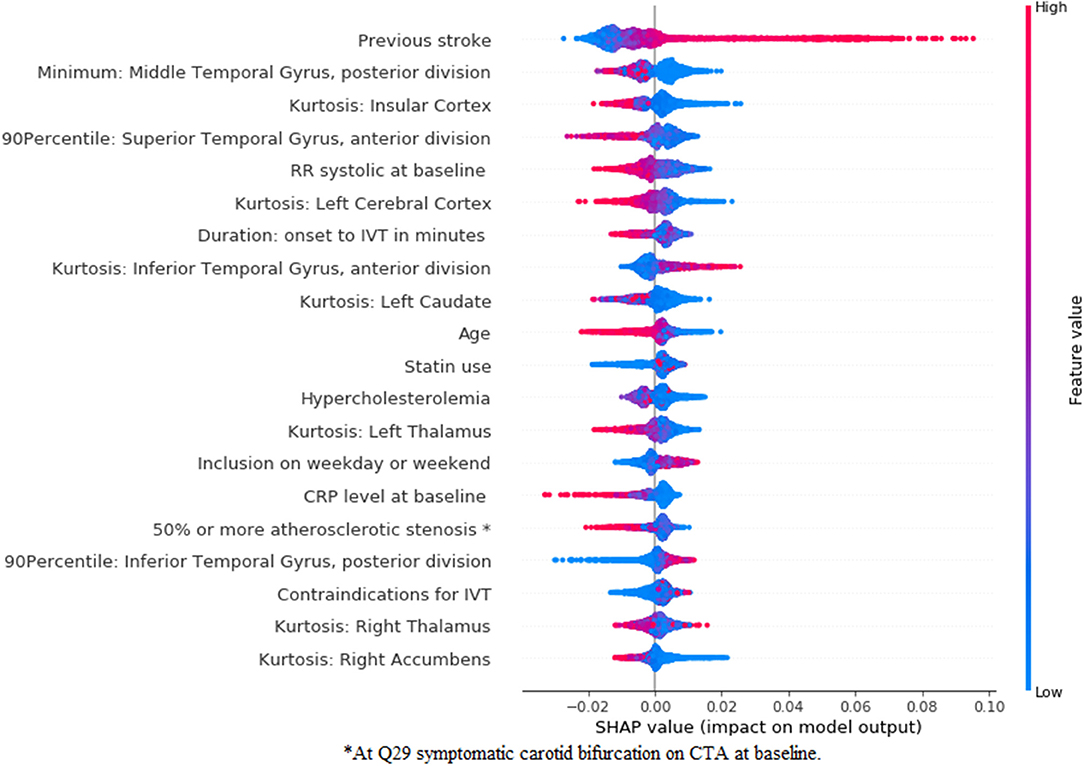
Figure 8. SHapley Additive exPlanations feature importance for the combination experiment for the prediction of good reperfusion using an RFC model. For visualization purposes, we included only the top 20 features. Features are shown in order of importance, from most important (top) to less important (bottom). The color legend on the right shows how the feature values influence outcome: high values are depicted in red, while low values are presented in blue. Positive SHAP values (above zero in the x-axis) mean that the feature values are associated to the positive outcome (in this case good r), while SHAP values below zero indicate the opposite. *At symptomatic carotid bifurcation on CTA at baseline.
In Table 4, we present the results for predicting good functional outcome using the deep learning approach. To keep the number of experiments feasible, we present results for the clinical and combination experiments. All the measures were similar for both the clinical and combination experiments. In the combination experiment, training the ResNet10 models from scratch resulted in a worse performance than when using Transfer Learning from other image datasets. Similar to the radiomics approach, there seems to be no improvement in the performance measures when combining the image learned image features with the clinical data (AUC of 0.77 for both). The difference between the results of clinical and the combination experiments was not significant, p = 0.285 for the ResNet10 trained using Transfer Learning.
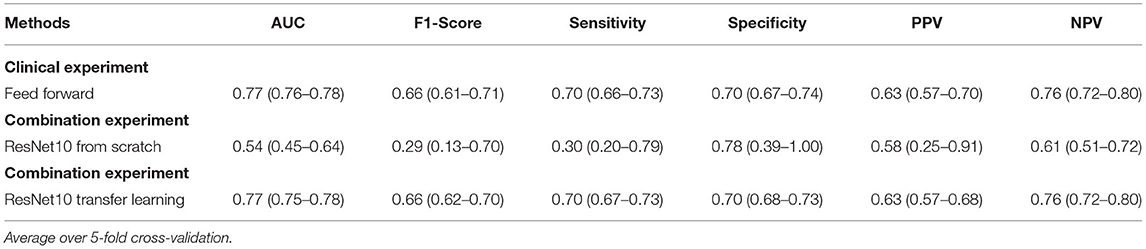
Table 4. Results of all experiments from the deep learning approaches for predicting the good functional outcome [modified Rankin Scale (mRS) ≤ 2].
Finally, we present in Table 5 the results for predicting good reperfusion. All evaluation measures are higher for the combination experiment, and, despite often overlapping CIs, the average AUC is 0.08 higher. Again, the Transfer Learning approach for the ResNet10 model yielded better results than training from scratch. The difference between the clinical and the combination experiments was statistically significant, p < 0.005 for the ResNet10 trained using Transfer Learning. We provide results from the Delong test in Table 6, which confirms that the difference between the clinical and combinations experiments was statistically significant.
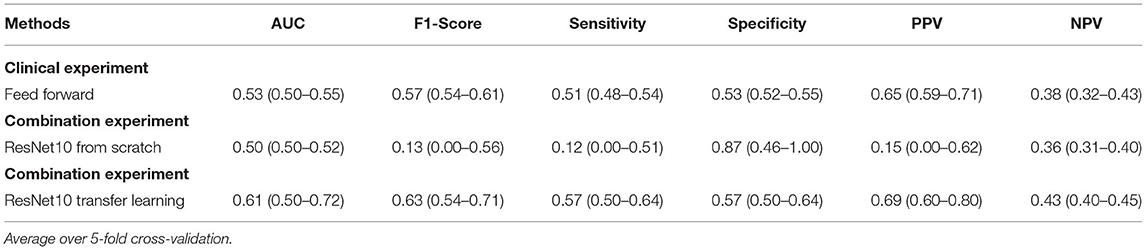
Table 5. Results of all experiments from the deep learning approach for predicting good reperfusion (post-eTICI ≥ 2b).
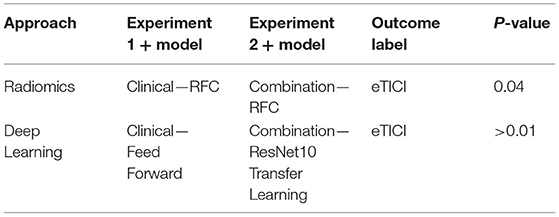
Table 6. Delong's test results for the best performing models from eTICI.
We present ROC curves for the clinical and combination experiments for predicting eTICI in Figure 3C. Moreover, we provide the confusion matrices of the deep learning approach for the clinical and combination experiments (mRs) in Figure 4B and eTICI in Figure 4D.
Our results suggest that there is a statistically significant improvement in discriminative performance for the prediction of good reperfusion (post-eTICI ≥ 2b) when data driven image features were combined with the clinical data, regardless of the approach (radiomics or deep learning). In contrary, the addition of image features does not improve the prediction of good functional outcome (mRS ≤ 2), regardless of the approach. Despite the lack of improvement in prediction accuracy for good functional outcome, radiomics features were relatively important for the models, when viewing 20 features with the highest feature importance.
In the terms of prediction accuracy, our results are in line with previous works on mRS and reperfusion prediction, where AUCs of ~0.80 and 0.57, respectively, were reported (7, 8). The current study is among the first to assess the combination of clinical and image features using both a radiomics and deep learning approaches for the prediction of good functional outcome and reperfusion. A previous study (38) explored a combination of clinical and image data using deep learning approaches to predict the good functional outcome at baseline, and found a significant improvement in the AUC, despite presenting AUC values lower than the ones reported here and in the literature (8). Despite not finding the same improvements as reported (38), our work included a much larger population (3,279 patients vs. 500, respectively). In addition, we performed extra cross-validation iterations, while (38) reported the results for only 1-fold, which might be due to chance.
Several methodological challenges need to be considered when interpreting the results of this study. First, only a relatively small number of deep learning models were used, and they were all based on the same architecture (ResNet10). Second, while other, deeper architectures are available and could yield better results, training a deeper architecture often requires more data and computing power. Since each validation iteration of our experiments takes ~24 h to compute on a single graphics processing unit (GPU) (and deeper 3D architectures would not fit the GPU memory), optimizing other models was out of the scope of this study. Moreover, given the size of our dataset, one could perform more cross-validation iterations, which would make our results more robust. Third, another limitation is the use of CTA modality, while other modalities could also be of added value, such as non contrast CT (NCCT). We chose to use CTA instead of NCCT because previous deep learning studies (12) already found a significant added value of CTAs for predicting the good outcome, but did not explore a 3D approach for the images or their combination with clinical data. Fourth, the large number of variables included can also be a downside, since some are not readily available at baseline, despite all being possible to compute before treatment (either from the patient history or recent imaging).
The strengths of our study include the large and heterogeneous population of patients with LVO as compared with previous studies that aimed at predicting the good functional outcome and reperfusion (7, 8, 12). A heterogeneous dataset is important since we aimed to develop models on data that are as close to the clinical practice as possible. Besides, we employed two different approaches for combining the data, a radiomics approach, offering a more interpretable and visual solution, and a deep learning approach, which is a more state-of-the-art solution, increasing our chances of finding significant improvements. Another strength of our study is the use of inner and outer cross-validation for optimizing and testing the models. We opted to use a nested-cross validation strategy due to the high risk of bias that having only one single random test set can cause, which can lead to wrong conclusions. By using multiple random test sets (that are unseen during the whole training process), we reduced the risk of random findings due to lucky dataset splits.
This study contributes to the understanding of imaging and clinical features that are associated with good functional outcome and reperfusion. Age, NIHSS at baseline, and pre-stroke mRS were found to be the top most important variables for functional outcome prediction, regardless of the data experiment, and have also been found to be relevant in previous studies (7, 8). In addition, with our imaging approaches we identified many relevant brain regions that have also been reported to be significantly associated to functional outcome (16). Predicting the functional outcome at baseline potentially provides the most benefit in clinical practice for assisting decision-making. However, at baseline many prognostic characteristics about the severity of the patient are unknown, making it a challenging task. Baseline variables that capture the severity of patients with stroke (such as, NIHSS and pre-stroke mRS) seem to provide the most insight for prediction, but high predictive values that have been previously reported in the literature (8) can only be achieved when post-treatment variables, such as reperfusion, are available. A perfect prediction of reperfusion could assist the interventionist in their decision to initiate or continue treatment. Moreover, such accurate prediction could assist the prediction of salvaged tissue, and motivate treatment beyond standard inclusion criteria or terminate futile procedures. The prediction of good perfusion for specific treatment devices may support the choice of which device to use during the intervention. The identified variables may furthermore support the understanding of treatments and the improvement of treatment strategies in the near future. Finally, one could consider the prediction of other EVT related outcome, such as treatment complications, that could be of great assistance during EVT.
Regarding feature importance for good reperfusion prediction, despite the poor predictive accuracy, various variables were identified to be relevant. In previous studies the predictors of successful reperfusion have been addressed and resulted in low prognostic value. In these studies, selected device, collaterals, time from onset to IVT, age, ASPECTS, NIHSS, among others, have already been reported to be predictive of reperfusion (39). Nevertheless, despite the risk of chance findings among the variables in Figures 7, 8, most of the variables deemed relevant have either already been reported in the literature, such as duration onset to IVT (40), age (41), occlusion location (42) (M1 occlusions are easier to treat and M2 occlusions increase the risk of symptomatic intracranial hemorrhage), high blood pressure being associated with poor reperfusion (43), among others. Moreover, the relationship between variables should also be taken into account when assessing feature importance, since known predictors, such as time from onset to treatment might have a direct interaction with transfer from another hospital, influencing their impact on the model. Since the main focus of our research was to assess the added value of combining baseline imaging features with the clinical ones, we did not explore the combination with post-treatment variables. Combining baseline images features with post-treatment variables would probably significantly reduce the added value of the (pre-treatment) image features, since the predictive value of post-treatment variables (such as, reperfusion during EVT, duration of EVT procedure, NIHSS at 24–48 h, among others) has already been shown in the literature (8). Nevertheless, such approach could be considered in future models. For future research, one should consider computing more complex radiomics, such as the gray level co-occurrence matrix or shape based features, since these have already been shown to be significantly associated to the outcome of patient with stroke (44). Regarding deep learning, deeper ResNet networks could be considered, provided that enough data are available to train such models, and a Transfer Learning approach should often be explored, since this can greatly surpass models trained from scratch as shown in this study.
We found a significant improvement in the prediction of good reperfusion when combining image to clinical features. Regarding functional outcome, the addition of image features had no impact on the prediction accuracy. Nevertheless, the prediction accuracy of our models for reperfusion prediction is still rather limited to be considered in clinical practice. The visualization of prediction feature importance showed both known and novel clinical and imaging features with predictive value.
The data analyzed in this study is subject to the following licenses/restrictions: due to the sensitive nature of the data, the datasets are not publicly available. Requests to access these datasets should be directed to bXJjbGVhbkBlcmFzbXVzbWMubmw=.
The studies involving human participants were reviewed and approved by Erasmus Medical Center Rotterdam - MEC-2014–235. The patients/participants provided their written informed consent to participate in this study.
LR: lead author, study design, analysis and interpretation, and critical revision manuscript for important intellectual content. HO and AH: study design, analysis and interpretation, and critical revision of manuscript for important intellectual content. AL, YR, WZ, MWa, ME, AZ, GS, and CM: data acquisition and critical revision of manuscript for important intellectual content. AZ, GS, SO, and HM: supervisors of lead author, study design, and critical revision of manuscript for important intellectual content.
The MR CLEAN Registry was funded and carried out by the Erasmus University Medical Centre, Amsterdam University Medical, and Maastricht University Medical Centre. The Registry was additionally funded by the Applied Scientific Institute for Neuromodulation (TWIN). ITEA3—Medolution: Project number 14003.
Erasmus MC received funds from AL. Amsterdam UMC received funds from Stryker for consultations by CM and YR. MUMC received funds from Stryker and Codman for consultations by WZ. CM reports grants from the TWIN Foundation, the CVON/Dutch Heart Foundation, and the European Commission. HM is cofounder and shareholder of Nico.lab. YR and CM own stock in Nico.lab.
The remaining authors declare that the research was conducted in the absence of any commercial or financial relationships that could be construed as a potential conflict of interest.
All claims expressed in this article are solely those of the authors and do not necessarily represent those of their affiliated organizations, or those of the publisher, the editors and the reviewers. Any product that may be evaluated in this article, or claim that may be made by its manufacturer, is not guaranteed or endorsed by the publisher.
We would like to thank all MR CLEAN Registry and trial centers and investigators, interventionists, core lab members, research nurses, Executive Committee, and Ph.D. student coordinators (MR CLEAN Registry Investigators—group authors).
The Supplementary Material for this article can be found online at: https://www.frontiersin.org/articles/10.3389/fneur.2022.809343/full#supplementary-material
2. Feigin VL, Lawes CMM, Bennett DA, Anderson CS. Stroke epidemiology: a review of population-based studies of incidence, prevalence, and case-fatality in the late 20th century. Lancet Neurol. (2003) 2:43–53. doi: 10.1016/S1474-4422(03)00266-7
3. Goyal M, Demchuk AM, Menon BK, Eesa M, Rempel JL, Thornton J, et al. Randomized assessment of rapid endovascular treatment of ischemic stroke. N Engl J Med. (2015) 372:1019–30. doi: 10.1056/NEJMoa1414905
4. Jovin TG, Chamorro A, Cobo E, de Miquel MA, Molina CA, Rovira A. Thrombectomy within eight hours after symptom onset in ischemic stroke. N Engl J Med. (2016) 22:36. doi: 10.1056/NEJMoa1503780
5. Saver JL, Goyal M, Bonafe A, Diener H-C, Levy EI, Pereira VM, et al. Stent-retriever thrombectomy after intravenous t-PA vs. t-PA alone in stroke. N Engl J Med. (2015) 372:2285–95. doi: 10.1056/NEJMoa1415061
6. Campbell BCV, Mitchell PJ, Kleinig TJ, Dewey HM, Churilov L, Yassi N, et al. Endovascular therapy for ischemic stroke with perfusion-imaging selection. N Engl J Med. (2015) 372:1009–18. doi: 10.1056/NEJMoa1414792
7. Venema E, Mulder MJHL, Roozenbeek B, Broderick JP, Yeatts SD, Khatri P, et al. Selection of patients for intra-arterial treatment for acute ischaemic stroke: development and validation of a clinical decision tool in two randomised trials. BMJ. (2017) 357:j1710. doi: 10.1136/bmj.j1710
8. Van Os HJA, Ramos LA, Hilbert A, Van Leeuwen M, Van Walderveen MAA, Kruyt ND, et al. Predicting outcome of endovascular treatment for acute ischemic stroke: potential value of machine learning algorithms. Front Neurol. (2018) 9:784. doi: 10.3389/fneur.2018.00784
9. Alaka SA, Menon BK, Brobbey A, Williamson T, Goyal M, Demchuk AM, et al. Functional outcome prediction in ischemic stroke: a comparison of machine learning algorithms and regression models. Front Neurol. (2020) 11:889. doi: 10.3389/fneur.2020.00889
10. Berkhemer OA, Fransen PSS, Beumer D, van den Berg LA, Lingsma HF, Yoo AJ, et al. A randomized trial of intraarterial treatment for acute ischemic stroke. N Engl J Med. (2015) 372:11–20. doi: 10.1056/NEJMoa1411587
11. Jansen IGH, Mulder MJHL, Goldhoorn RJB. Endovascular treatment for acute ischaemic stroke in routine clinical practice: prospective, observational cohort study (MR CLEAN Registry). BMJ. (2018) 360:k949. doi: 10.1136/bmj.k949
12. Hilbert A, Ramos LA, van Os HJA, Olabarriaga SD, Tolhuisen ML, Wermer MJH, et al. Data-efficient deep learning of radiological image data for outcome prediction after endovascular treatment of patients with acute ischemic stroke. Comput Biol Med. (2019) 115:103516. doi: 10.1016/j.compbiomed.2019.103516
13. Sales Barros R, Tolhuisen ML, Boers AMM, Jansen I, Ponomareva E, Dippel DWJ, et al. Automatic segmentation of cerebral infarcts in follow-up computed tomography images with convolutional neural networks. J Neurointerv Surg. (2019) 848–52. doi: 10.1136/neurintsurg-2019-015471
14. Ronneberger O, Fischer P, Brox T. U-Net: convolutional networks for biomedical image segmentation. Miccai. (2015) 234–41. doi: 10.1007/978-3-319-24574-4_28
15. Berge JK, Bergman RA. Variations in size and in symmetry of foramina of the human skull. Clin Anat. (2001) 14:406–13. doi: 10.1002/ca.1075
16. Ernst M, Boers AMM, Aigner A, Berkhemer OA, Yoo AJ, Roos YB, et al. Association of computed tomography ischemic lesion location with functional outcome in acute large vessel occlusion ischemic stroke. Stroke. (2017) 48:2426–33. doi: 10.1161/STROKEAHA.117.017513
17. Shattuck DW, Mirza M, Adisetiyo V, Hojatkashani C, Salamon G, Narr KL, et al. Construction of a 3D probabilistic atlas of human cortical structures. Neuroimage. (2008) 39:1064–80. doi: 10.1016/j.neuroimage.2007.09.031
18. Van Griethuysen JJM, Fedorov A, Parmar C, Hosny A, Aucoin N, Narayan V, et al. Computational radiomics system to decode the radiographic phenotype. Cancer Res. (2017) 77:e104–7. doi: 10.1158/0008-5472.CAN-17-0339
19. Yu L, Liu H. Feature Selection for high-dimensional data: a fast correlation based filter solution. In: Proceedings, Twentieth International Conference on Machine Learning. Washington, DC (2003).
20. Vittinghoff E, McCulloch CE. Relaxing the rule of ten events per variable in logistic and cox regression. Am J Epidemiol. (2007) 165:710–8. doi: 10.1093/aje/kwk052
22. Cortes C, Vapnik V. Support-vector networks. Mach Learn. (1995) 20:273–97. doi: 10.1007/BF00994018
24. Chen T, Guestrin C. XGBoost: a scalable tree boosting system. In: Proceedings of the 22nd ACM SIGKDD International Conference on Knowledge Discovery and Data Mining. New York, NY: Association for Computing Machinery (2016). p. 785–94. doi: 10.1145/2939672.2939785
25. Chen S, Ma K, Zheng Y. Med3D: Transfer learning for 3D medical image analysis. arXiv [Preprint]. (2019). arXiv: 1904.00625. Available online at: https://arxiv.org/pdf/1904.00625.pdf
26. Hu J, Shen L, Albanie S, Sun G, Wu E. Squeeze-and-excitation networks. IEEE Trans Pattern Anal Mach Intell. (2020) 42: 2011–23. doi: 10.1109/TPAMI.2019.2913372
27. Nunnari F, Bhuvaneshwara C, Ezema A, Sonntag D. A study on the fusion of pixels and patient metadata in CNN-based classification of skin lesion images. In: 4th International Cross-Domain Conference for Machine Learning and Knowledge Extraction (CD-MAKE). Machine Learning and Knowledge Extraction. Dublin, Ireland: Springer International Publishing (2020). p. 191–208. doi: 10.1007/978-3-030-57321-8_11
28. Ellen JS, Graff CA, Ohman MD. Improving plankton image classification using context metadata. Limnol Oceanogr Methods. (2019) 17:439–61. doi: 10.1002/lom3.10324
29. Nguyen LD, Lin D, Lin Z, Cao J. Deep CNNs for microscopic image classification by exploiting transfer learning and feature concatenation. In: Proceedings - IEEE International Symposium on Circuits and Systems. Florence: IEEE (2018). doi: 10.1109/ISCAS.2018.8351550
30. He K, Girshick R, Dollar P. Rethinking imageNet pre-training. In: Proceedings of the IEEE International Conference on Computer Vision. Seoul: IEEE (2019). doi: 10.1109/ICCV.2019.00502
31. Lin TY, Goyal P, Girshick R, He K, Dollar P. Focal Loss for Dense Object Detection. 2017 IEEE International Conference on Computer Vision (ICCV). Venice: IEEE (2017). doi: 10.1109/ICCV.2017.324
32. Kingma DP, Ba J. Adam: A method for stochastic optimization. In: ICLR 2015 Conference Track Proceedings. San Diego, CA (2014). p. 1–15.
33. Azur MJ, Stuart EA, Frangakis C, Leaf PJ. Multiple imputation by chained equations: what is it and howdoes it work. Int J Metrhods Psychiatr Res. (2012) 20:40–9. doi: 10.1002/mpr.329
34. McNemar Q. Note on the sampling error of the difference between correlated proportions or percentages. Psychometrika. (1947) 12:153–7. doi: 10.1007/BF02295996
35. Sun X, Xu W. Fast implementation of DeLong's algorithm for comparing the areas under correlated receiver operating characteristic curves. IEEE Signal Process Lett. (2014) 21:1389–93. doi: 10.1109/LSP.2014.2337313
36. Lundberg SM, Erion G, Chen H, DeGrave A, Prutkin JM, Nair B, et al. Explainable AI for trees: from local explanations to global understanding. Nat Mach Intell. (2019) 2:56–67. doi: 10.1038/s42256-019-0138-9
37. Ribeiro MT, Singh S, Guestrin C. “Why Should I Trust You?”: explaining the predictions of any classifier. In: KDD '16: Proceedings of the 22nd ACM SIGKDD International Conference on Knowledge Discovery and Data Mining. New York, NY: Association for Computing Machinery (2016). p. 1135–44. doi: 10.1145/2939672.2939778
38. Samak ZA, Mirmehdi M. Prediction of thrombectomy functional outcomes using multimodal data. In: MIUA 2020: Medical Image Understanding and Analysis. Springer International Publishing (2020). p. 267–79. doi: 10.1007/978-3-030-52791-4_21
39. Liggins JTP, Mlynash M, Jovin TG, Straka M, Kemp S, Bammer R, et al. Interhospital variation in reperfusion rates following endovascular treatment for acute ischemic stroke. J Neurointerv Surg. (2015) 7:231–3. doi: 10.1136/neurintsurg-2014-011115
40. Choi JC, Kim JG, Kang CH, Joon H, Kang J, Lee SJ, et al. Effect of transport time on the use of reperfusion therapy for patients with acute ischemic stroke in Korea. J Korean Med Sci. (2021) 36:1–12. doi: 10.3346/jkms.2021.36.e77
41. Malhotra A, Wu X, Payabvash S, Matouk CC, Forman HP, Gandhi D, et al. Comparative effectiveness of endovascular thrombectomy in elderly stroke patients. Stroke. (2019) 50:963–9. doi: 10.1161/STROKEAHA.119.025031
42. Saber H, Narayanan S, Palla M, Saver JL, Nogueira RG, Yoo AJ, et al. Mechanical thrombectomy for acute ischemic stroke with occlusion of the M2 segment of the middle cerebral artery: a meta-analysis. J Neurointerv Surg. (2018) 10:620–4. doi: 10.1136/neurintsurg-2017-013515
43. Van Den Berg SA, Uniken Venema SM, Mulder MJHL, Treurniet KM, Samuels N, Lingsma HF, et al. Admission blood pressure in relation to clinical outcomes and successful reperfusion after endovascular stroke treatment. Stroke. (2020) 51:3205–14. doi: 10.1161/STROKEAHA.120.029907
Keywords: ischemia stroke, radiomics, deep learning, data combination, outcome prediction
Citation: Ramos LA, Os Hv, Hilbert A, Olabarriaga SD, Lugt Avd, Roos YBWEM, Zwam WHv, Walderveen MAAv, Ernst M, Zwinderman AH, Strijkers GJ, Majoie CBLM, Wermer MJH and Marquering HA (2022) Combination of Radiological and Clinical Baseline Data for Outcome Prediction of Patients With an Acute Ischemic Stroke. Front. Neurol. 13:809343. doi: 10.3389/fneur.2022.809343
Received: 04 November 2021; Accepted: 08 March 2022;
Published: 01 April 2022.
Edited by:
Mauricio Reyes, University of Bern, SwitzerlandReviewed by:
Kais Gadhoumi, Duke University, United StatesCopyright © 2022 Ramos, Os, Hilbert, Olabarriaga, Lugt, Roos, Zwam, Walderveen, Ernst, Zwinderman, Strijkers, Majoie, Wermer and Marquering. This is an open-access article distributed under the terms of the Creative Commons Attribution License (CC BY). The use, distribution or reproduction in other forums is permitted, provided the original author(s) and the copyright owner(s) are credited and that the original publication in this journal is cited, in accordance with accepted academic practice. No use, distribution or reproduction is permitted which does not comply with these terms.
*Correspondence: Lucas A. Ramos, bHVjYXMucmFtb3MuYW1jQGdtYWlsLmNvbQ==
Disclaimer: All claims expressed in this article are solely those of the authors and do not necessarily represent those of their affiliated organizations, or those of the publisher, the editors and the reviewers. Any product that may be evaluated in this article or claim that may be made by its manufacturer is not guaranteed or endorsed by the publisher.
Research integrity at Frontiers
Learn more about the work of our research integrity team to safeguard the quality of each article we publish.