
94% of researchers rate our articles as excellent or good
Learn more about the work of our research integrity team to safeguard the quality of each article we publish.
Find out more
ORIGINAL RESEARCH article
Front. Neurol., 02 March 2022
Sec. Dementia and Neurodegenerative Diseases
Volume 13 - 2022 | https://doi.org/10.3389/fneur.2022.778419
This article is part of the Research TopicNeurOmics Technology: Advancing our Understanding of Neurodegenerative Diseases and DementiaView all 5 articles
 Michael R. DeChellis-Marks1
 Yue Wei2
 Ying Ding2
 Cody M. Wolfe3
 Joshua M. Krivinko1
 Matthew L. MacDonald1
 Oscar L. Lopez1,4
 Robert A. Sweet1,4*
 Julia Kofler5
Alzheimer's disease with psychosis (AD+P) is a heritable phenotypic variant of the disease which is associated with more rapid cognitive deterioration compared to Alzheimer's disease without psychosis (AD–P). Cognitive decline in AD correlates with synapse loss, and our previous studies suggest that those with AD+P have a differentially affected synaptic proteome relative to those with AD–P. In this study, we utilized RNA-sequencing of dorsolateral prefrontal cortex (DLPFC) in a cohort of 80 AD cases to evaluate novel transcriptomic signatures that may confer risk of psychosis in AD. We found that AD+P was associated with a 9% reduction in excitatory neuron proportion compared to AD–P [Mean (SD) AD+P 0.295 (0.061); AD–P 0.324 (0.052), p = 0.026]. mRNA levels contributed only modestly to altered synaptic proteins in AD+P relative to AD–P. Instead, network analysis identified altered expression of gene modules from protein ubiquitination, unfolded protein response, eukaryotic initiation factor 2 (EIF2) signaling and endoplasmic reticulum stress pathways in AD+P. We previously found that neuropathologies account for ~18% of the variance in the occurrence of psychosis in AD. Further inclusion of cell type proportions and differentially expressed modules increased the percent of the variance in psychosis occurrence accounted for in our AD cohort to 67.5%.
Psychosis in Alzheimer's disease (AD with psychosis, AD+P), defined as the presence of delusions and/or hallucinations, is a heritable phenotype, comprising 40–60% of those affected by AD (1). AD+P is associated with hastened cognitive decline and elevated mortality compared to AD without psychosis (AD–P) (2). AD+P patients endure greater cognitive impairment, are more likely to be institutionalized during illness, and are affected by neuropsychiatric disturbances (e.g., aggression, agitation, depression) at higher rates compared to AD–P counterparts (3, 4). Because psychosis in AD is heritable, it is likely to have a distinct neurobiology (5–9). Further elucidating the neurobiological basis of risk toward psychosis in AD may therefore provide leads to innovative preventions or treatments.
AD neuropathology is defined by fibrillar deposits of amyloid beta and phosphorylated tau. In most cases, however, one or more comorbid neuropathologies (10), including Lewy bodies (11), Transactive response DNA Binding Protein 43 kDa (TDP-43) inclusions (12), and cerebrovascular lesions are also present (13, 14). Previously we set out to establish a comprehensive model of the association of these pathologies with psychosis risk in AD. This stepwise logistical regression identified pathologies that significantly associated with psychosis, including: phosphotau burden, presence of TDP-43 inclusions, an index of microglial activation, and indices of ischemia. However, these neuropathologies only accounted for 18% of the variance in psychosis risk (15). Further, we reported that after accounting for the contribution of neuropathologies, AD+P was associated with lower levels of canonical postsynaptic density proteins in the DLPFC compared to AD–P (15). Synaptic protein levels are potentially impacted by multiple factors including expression levels of their corresponding mRNAs and rates of translation initiation and of protein degradation. In the context of neurodegenerative disease, synaptic protein levels are also strongly impacted by neuron loss (16).
Reduced gray matter volume and reduced indices of synaptic function in AD+P relative to AD–P have been replicated across multiple cerebral neocortical regions, particularly in bilateral frontal and prefrontal cortices (2). In this study we focused on the dorsolateral prefrontal cortex (DLPFC) of AD+P and AD–P subjects. We utilized RNA-sequencing to identify molecular correlates of the excess neuropathologic burden and altered synaptic proteostasis in AD+P. We found that excitatory neurons, as measured by unique excitatory neuron transcript levels, are more vulnerable in AD+P than in AD–P. In addition, we identified co-expressed mRNA modules that were differentially expressed between AD+P and AD–P when controlling for cell proportion and were enriched for mRNAs regulating protein availability. Our findings suggest that the prior observation of synaptic protein reduction in AD+P relative to AD–P subjects results from contributions of neuronal survival and post-transcriptional regulation.
We studied a cohort of 80 Alzheimer's disease subjects (Table 1 and Supplementary Data Sheet: Appendix 1) obtained through the brain bank of the Alzheimer's Disease Research Center (ADRC) at the University of Pittsburgh. All subjects, when living, provided informed consent to participate using protocols approved by the University of Pittsburgh Institutional Review Board. The study of postmortem tissue was approved by the University of Pittsburgh Committee for Oversight of Research and Clinical Training Involving Decedents. Subjects underwent comprehensive evaluations by experienced clinicians in the University of Pittsburgh ADR), including neurologic, neuropsychological, and psychiatric assessments as previously described (17, 18). Psychosis was evaluated with the CERAD behavioral rating scale (CBRS) (19). The CBRS was administered at initial and annual visits and in some subjects between annual visits by telephone (7, 20). Subjects were classified as AD+P if they had any hallucination or delusion symptom (CBRS item # 33–45) for 3 or more days in the previous month at any visit (5, 20–24). Subjects with a preexisting psychotic disorder (e.g., schizophrenia) were excluded from the study. Statistical analyses of demographic and clinical differences between groups used t-test or Chi-Squared test as appropriate.
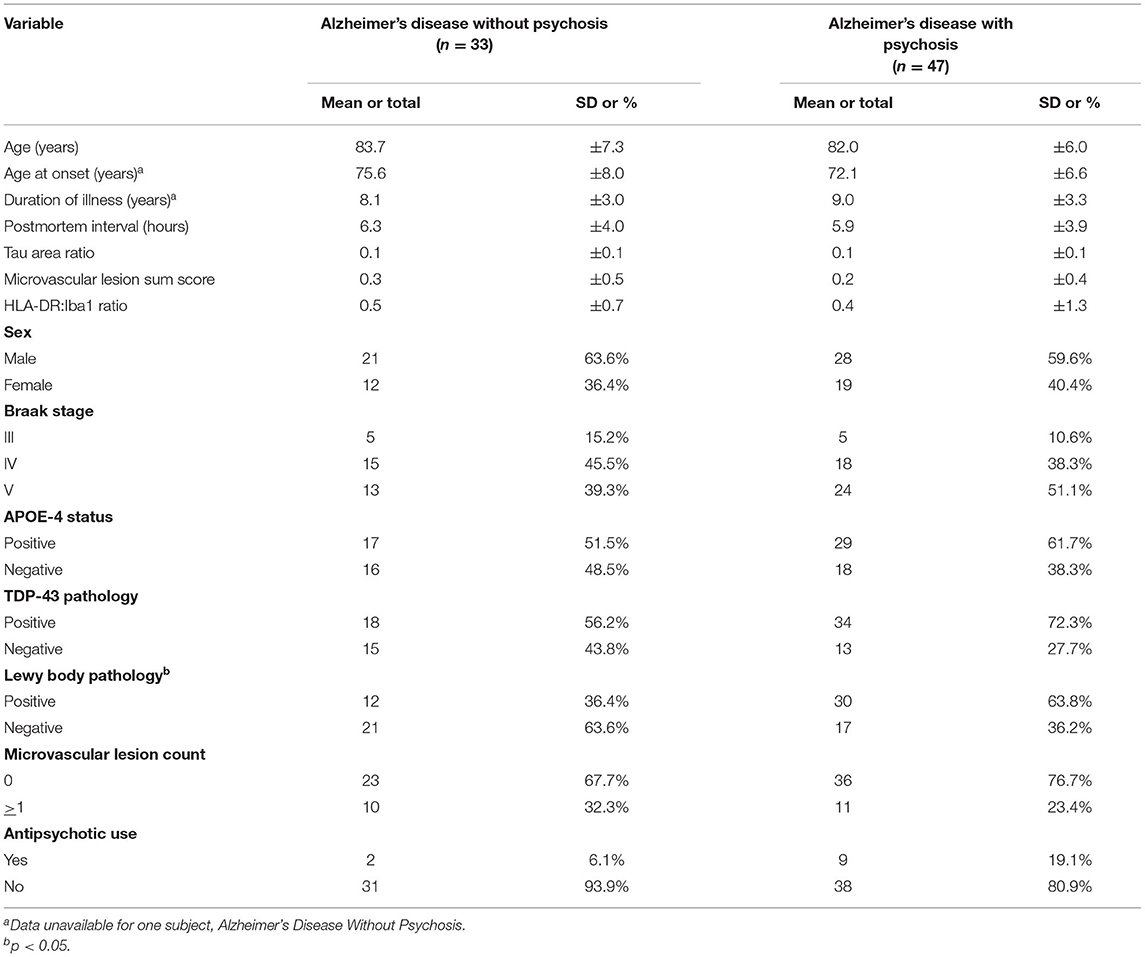
Table 1. Demographic, clinical, and tissue characteristics of subjects with Alzheimer's disease with and without psychosis examined by RNA-sequencing.
For ADRC subjects, frozen gray matter samples from the right superior frontal gyrus of the DLPFC were retrieved from the ADRC neuropathology core for RNA sequencing. The corresponding formalin-fixed left DLPFC was used for immunostaining and processed for neuropathologic studies as previously described [(15); Supplementary Data Sheet: Appendix 2, 3]. Neuropathologic diagnoses of Alzheimer disease were made according to NIA-Reagan criteria (25), with all cases meeting criteria for intermediate to high probability that their dementia was due to AD.
Neuropathological disease burden in the DLPFC was previously assessed in all 80 cases using quantitative immunohistochemistry (15). In short, serial 5 μm thick formalin-fixed, paraffin-embedded tissue sections were immunostained on an automated stainer (Discovery Ultra, Ventana, Tucson, AZ) using the following primary antibodies (Supplementary Data Sheet: Appendix 3): PHF-1, oligomeric tau T22, beta-amyloid NAB228, microglial markers Iba1 (Ionized calcium binding adaptor molecule 1), and HLA-DR (Human Leukocyte Antigen—DR isotype). No counterstaining was performed to ease signal quantification.
Whole slide digital images of the immunostained sections were created using a Mirax MIDI slide scanner (Zeiss, Jena, Germany) at 40× resolution (0.116 micron/pixel). Digital image analysis was performed using NearCyte software (Andrew Lesniak, University of Pittsburgh) as previously described (15). All analyses were done blinded to psychosis status.
Frozen tissue was bead-homogenized (Benchmark Scientific, Model No. D1030) in Trizol (Invitrogen; Carlsbad, CA), followed by phase separation using chloroform (20% vol:vol). RNA was then precipitated with isopropanol, washed in 75% ethanol, and resuspended in DEPC-treated water. RNA concentration and purity were assessed using Nanodrop optical density reader.
RNA sequencing was performed at the Next-Generation Sequencing Core at the University of Pennsylvania, Philadelphia, PA. Library preparation was performed using Illumina truSeq stranded total RNA (ribo-Zero) kits, followed by single-end, 100 bp sequencing on a HiSeq4000 sequencer. Because RNA Integrity Number (RIN) values were low for many samples (Supplementary Data Sheet Table S1), we used RNA-seq read count as our quality screen for sample inclusion. Samples from 85 AD subjects were submitted but 5 cases had extremely low counts of sequence reads (Supplementary Data Sheet Table S1) and were eliminated from further analyses. Neither RIN nor read counts differed significantly between AD+P and AD–P groups in the remaining 80 subjects (p = 0.87 and p = 0.28, respectively). Sequencing reads were checked using FastQC and aligned to the reference genome (human genome hg38) using TopHat2 (26). RNA-seq reads that had low sequencing quality or mapping quality were filtered out. Gene expressions were then quantified using Cufflinks (27) and a generative statistical model of RNAseq experiments was applied to estimate FPKM (expected Fragments Per Kilobases per Million mapped fragments). A total of 22,440 genes were identified and passed initial QC. After removing genes with missing names or those not quantified in more than 50% samples in both patient groups, 15,346 genes remained (Supplementary Data Sheet Table S2). Missing values of each remaining gene were imputed by the half of the minimum observed value across all samples. We then applied quantile normalization across samples using normalize Quantiles function from R package Limma, and the resulting data were utilized for the downstream analyses (28, 29).
We applied the est_frac function from R package MIND (30) to estimate the cell type proportions in our RNAseq data. It used the non-negative least square deconvolution approach proposed by Wang et al. (31). The signature matrix was taken from the adult single-cell RNAseq data from Darmanis et al. (32), which contains 666 genes and 6 cell types (astrocytes, endothelial cells, microglia, excitatory neurons, inhibitory neurons, and oligodendrocytes). The two-sample t-test was then applied to compare each cell type proportion between AD+P and AD–P samples.
Analysis of covariance (ANCOVA) was performed for each gene on the log2 transformed scale to compare between AD+P and AD–P, adjusted for neuropathological variables including tau area ratio, TDP-43 pathology status, HLA-DR:Iba1 ratio, microvascular lesion count and sum score. ANCOVA adjustments regarding neuropathological variables were included based on previous data which indicated each was associated with risk of psychosis (15). Analyses also adjusted for the proportion of endothelial cells, oligodendrocytes, and excitatory neurons (which were found to be different or marginally different (p < 0.10) between AD+P and AD–P from cell type proportion estimation) (Supplementary Files 1, 2). Other potential confounders (sex, APOE4, antipsychotic drug use) were evaluated for potential effects on gene expression (Supplementary Figure 1, see also Supplementary Data Sheet for Figure Legends). Because none of these three variables demonstrated significant main effects or interactions with psychosis impacting gene expression they were excluded from the ANCOVA models.
The covariate-adjusted fold change, p-value and FDR adjusted q-value were obtained. We further examined differentially expressed genes within each cell type by adapting CellDMC from R package EpiDISH on our RNAseq data [(33); Supplementary Figure 3, see also Supplementary Data Sheet for Figure Legends]. CellDMC was originally designed for identification of differentially methylated cell types in epigenome-wide association studies through an interaction model. We used the gene expression as the outcome and tested the interaction between cell type proportion and the psychosis status, with the same neuropathological variables adjusted.
Previously we reported that the mean ratio of synaptic proteins were increased in AD–P relative to AD+P (15). In our RNAseq data, 180 transcripts of the 190 synaptic proteins previously evaluated were present. First, we fit the same ANCOVA model (without cell type proportions adjusted) as in Krivinko et al. (15) for each of these 180 genes and obtained the log2 fold change. Then we computed the Spearman's correlation between the previously reported protein-level fold change and the transcriptomic-level fold change for these 180 genes. We further examined whether this protein-transcriptome correlation changed after cell type proportions being adjusted in the RNAseq ANCOVA analysis.
Gene co-expression network analysis was performed using the R package MEGENA (CRAN) (34). The module size was set to contain at least 15 genes. Pearson correlation was used for constructing the correlation matrix. The number of permutations for calculating FDRs for all correlation pairs and connectivity significance p-value was set to 100. After identification of modules and computing their corresponding module eigengenes (MEs), we constructed a model for the presence of psychosis. We first tested all MEs in individual logistic regressions, adjusting for the same neuropathological measures and three cell type proportions as covariates. The final model consisted of all MEs from the individual analyses with p < 0.1, and the same neuropathological variables and cell type proportions. The performance of the model is characterized by area under the curve (AUC) and R2 (i.e., % variance explained) (35). We compared the nested models with and without cell type proportions and/or MEs using the likelihood ratio test, as well as the DeLong's method for comparing AUCs (36), to assess whether including cell type proportions and MEs improve the model fitting and performance.
A gene list was generated by combining all genes that were listed in individual modules which had significant association with AD+P in the multivariate analysis. This list was submitted for Core Expression Analysis using Ingenuity Pathway Analysis (IPA, Qiagen). Top canonical pathways with Benjamini-Hochberg p < 0.05 and number of genes >4 were identified.
Cell type proportion was estimated for astrocytes, endothelial cells, microglia, excitatory neurons, inhibitory neurons, and oligodendrocytes (Figure 1). Notably, there was a decreased proportion of excitatory neurons in AD+P compared to AD–P (T = 2.27; df = 75, p = 0.026). Because the estimates of cell proportion are derive from read counts of multiple RNAs, we examined whether reduced excitatory neuron proportion in AD+P might be an artifact of low RNA-seq read counts, finding no significant association (Supplementary Figure 2, see also Supplementary Data Sheet for Figure Legends). RIN, which may reflect tissue integrity that could also impact cell proportions, was correlated with excitatory neuron proportions (Supplementary Figure 2, see also Supplementary Data Sheet for Figure Legends), but this correlation did not differ between groups (psychosis-by-RIN interaction p = 0.41). and thus did not account for the reduced proportions in AD+P. There was a modest inverse correlation of excitatory neuron proportion with tau burden (Supplementary Figure 3, see also Supplementary Data Sheet for Figure Legends). However, the relationship with tau burden was not significant in AD+P, in which group a number of subjects have low excitatory neuron proportions despite modest local tau burden. The relationship of excitatory neuron proportion to other neuropathology measures is shown in Supplementary Figure 3, see also Supplementary Data Sheet for Figure Legends.
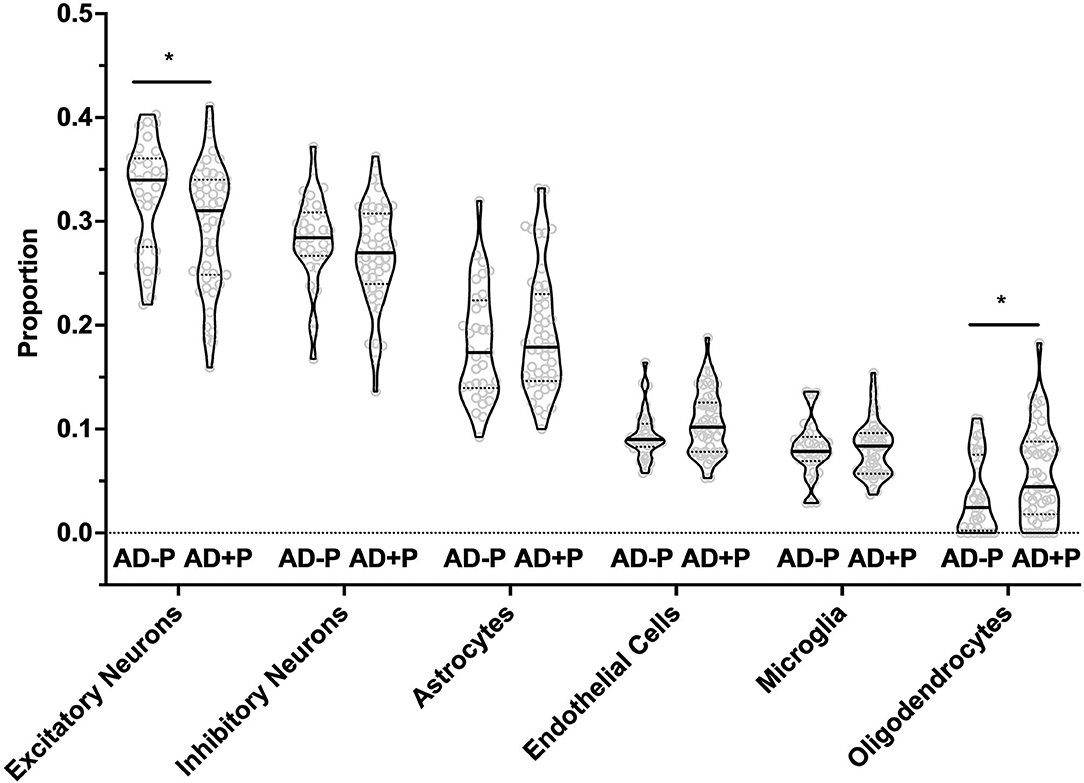
Figure 1. Excitatory Neurons, Oligodendrocytes, and Endothelial Cell proportions are altered in AD+P. Cell type proportion differences between AD+P and AD–P were determined using MIND signature gene matrix (32). Excitatory neuron proportion was significantly reduced in AD+P subjects compared to AD–P (T = 2.27 df = 75, p = 0.026). Conversely, oligodendrocyte (T = −2.17, df = 76, p = 0.033) and endothelial cell (T = −1.93, df = 78, p = 0.057) proportions were increased in AD+P compared to AD–P. Proportions of astrocytes, microglia, and inhibitory neurons did not differ between groups (astrocyte T = −0.90, df = 73, p = 0.372 microglia T = −0.03, df = 67, p = 0.978; inhibitory neuron T = 1.40, df = 74, p = 0.166). *Indicates p < 0.05.
The decrease in excitatory neuron proportion was offset by a corresponding increase in the proportion of oligodendrocytes (T = −2.17, df = 68, p = 0.033) and endothelial cells (T = −1.93, df = 78, p = 0.057, see also Supplementary Figure 4, see also Supplementary Data Sheet for Figure Legends). Consistent with our prior report that Iba1 volume fraction was not significantly different between AD+P and AD–P subjects (15), we found no change in microglia proportion (T = −0.03, df = 67, p = 0.978).
Our data set underwent differential expression (DE) analysis with adjustments for neuropathological covariates (15) and the proportions of excitatory neurons, oligodendrocytes, and endothelial cells. We identified 1,077 nominally DE genes (p < 0.05), across all cell types (Supplementary Figure 4, see also Supplementary Data Sheet for Figure Legends, Supplementary Data Sheet Table S3A, and Supplementary Files 1, 2). However, none of the 1,077 genes passed an FDR threshold of q < 0.1. Additionally, we probed DE genes by cell type. Depending on cell type, we identified a range of 604–1,287 nominally DE genes (Supplementary Data Sheet Table S3B and Supplementary File 3). Two genes passed FDR threshold: METTL22 (q = 0.099) in Inhibitory Neurons and DKC1 (q = 0.072) in Oligodendrocytes.
Co-expressed genes were clustered into 288 modules (Supplementary File 4). We tested each ME for strength of association with psychosis in a multiple regression model along with neuropathologic covariates and the cell type proportions that differed between AD+P and AD–P (endothelial cells, excitatory neurons, and oligodendrocytes). We identified significant differential expression of 27 MEs between AD–P and AD+P. To avoid redundancy, parent modules that showed significant differential expression were removed, bringing our total to 23 individual modules with p < 0.05 (Supplementary File 5). When these were then entered into a multivariate model only 8 modules remained significant (Supplementary Data Sheet Table S4). Functional annotation of the 8 modules identified several significantly enriched canonical pathways (Table 2). These include regulation of protein availability via protein ubiquitination system pathways, unfolded protein response, EIF2 signaling pathways, and endoplasmic reticulum stress pathways.
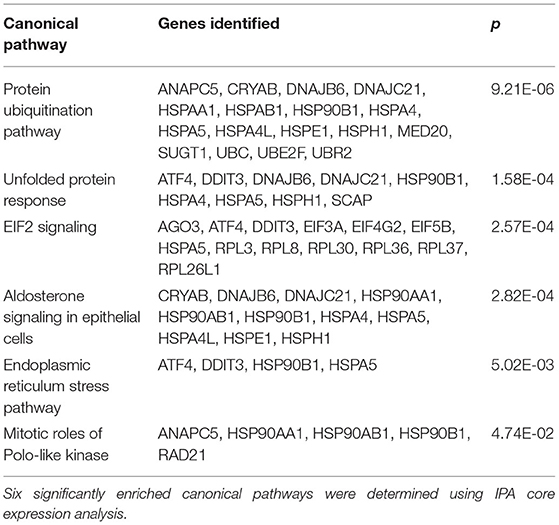
Table 2. Functional annotation analysis of differentially expressed gene modules.
We had previously reported in a subset of our case cohort that the mean ratio of 190 synaptic proteins was greater in AD–P relative to AD+P (Figure 2A) (15). We evaluated whether decreased synaptic protein abundance in AD+P relative to AD–P subjects results from a relative downregulation of corresponding mRNAs. We successfully measured the abundance of mRNAs corresponding to 180 of the 190 proteins and found that 69.4% of these mRNAs were downregulated in AD+P relative to AD–P. This pattern was not observed in non-synaptic mRNAs (Figure 2B; Chi-square test, p = 3.874E-7). However, the correlation between synaptic transcript and protein levels was modest (spearman's rho = 0.2257, p = 0.0024, Figure 2C, Supplementary File 6). Given the observed differences in cell type proportions between groups, we asked if alterations in cell type proportions might drive the differences in synaptic gene levels. When cell type proportions were introduced into quantile normalization to estimate transcript expression, there was no longer a relative downregulation of the synaptic genes in AD+P vs. AD–P (Figure 2D) and transcript levels were not correlated with protein levels (spearman's rho = 0.0302, p = 0.6868, Figure 2E and Supplementary File 6).
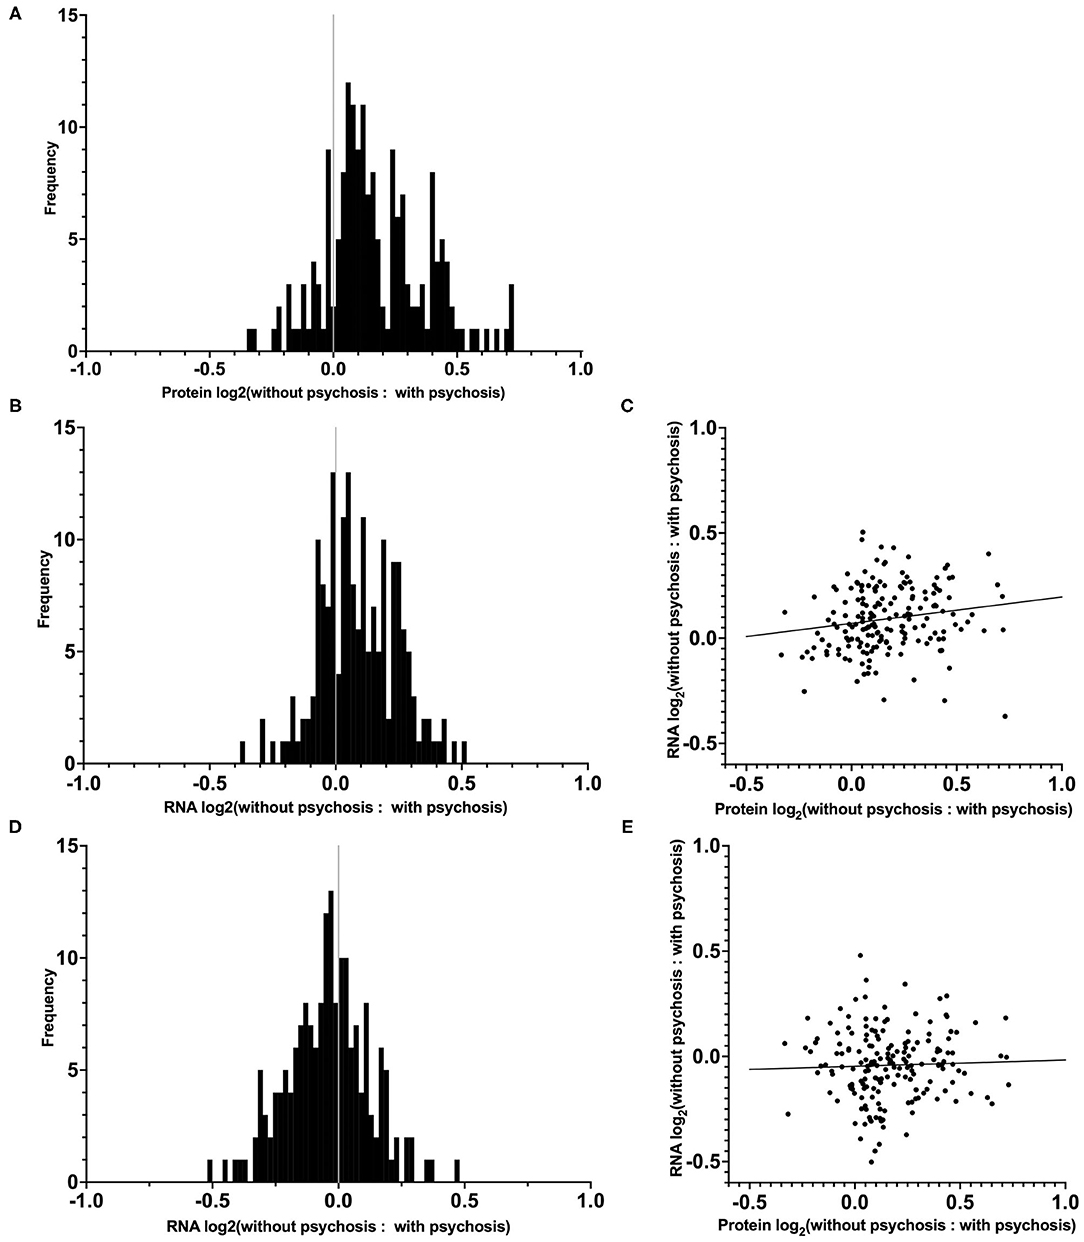
Figure 2. Distribution and correlation of synaptic transcript and protein levels in AD–P relative to AD+P subjects. (A) Distributions of log2 ratios are shown for 180 synaptic proteins (19) for which corresponding mRNA levels were quantified in the current study. (B) Distribution of RNA expression ratios of the 180 synaptic genes identified in our DE analysis, prior to cell type proportion adjustments. The proportion of synaptic transcripts upregulated in AD–P compared to AD+P was 69.4%, compared to 49.6% of non-synaptic transcripts (Chi-square test, p = 3.874E-7). (C) Correlation between the 180 synaptic protein and transcript expression ratios (AD–P: AD+P, spearman's rho = 0.2257, p = 0.0024). (D) Analysis of the same synaptic transcripts as in (B), accounting for the contribution of cell type proportions as covariates, eliminates their upregulation in AD–P. (E) Inclusion of cell type proportions as covariates in analysis of synaptic transcripts similarly abolishes the correlation between synaptic transcript and protein levels (spearman's rho = 0.0302, p = 0.6868).
We previously reported that a combination of neuropathologic variables (immunostaining for phospho-Tau, TDP-43, HLA-DR:Iba1 ratio, and microvascular lesion count plus a summary score of vascular pathologies) together accounted for 18% of the variance in psychosis risk in AD (15). We first undertook to repeat that analysis in the current sample of 80 AD subjects, a subset of the subjects in our prior report. The results of these analyses are shown in Table 3. Neuropathology alone accounted for 11.7% of the variance in psychosis in these subjects (Model 1). The addition of the three cell type proportions improved this to 29.9% with a corresponding improvement in the area under the curve (AUC) (Model 2). Finally, entry of both the 23 significant modules and 3 cell type proportions resulted in an increase in the percent of variance accounted for to 67.5% with an AUC of 0.923 (Model 3). For comparing the three models, the DeLong's AUC test shows a significant p-value for Model 2 vs. Model 1 (p = 0.021), Model 3 vs. Model 1 (p = 0.00014), and for Model 3 vs. Model 2 (p = 0.012). On the other hand, the likelihood ratio test shows Model 2 or Model 3 fits the data significantly better than Model 1 (p = 0.006 and 0.0008, respectively), and Model 3 fits the data marginally better than Model 2 as well (p = 0.063).
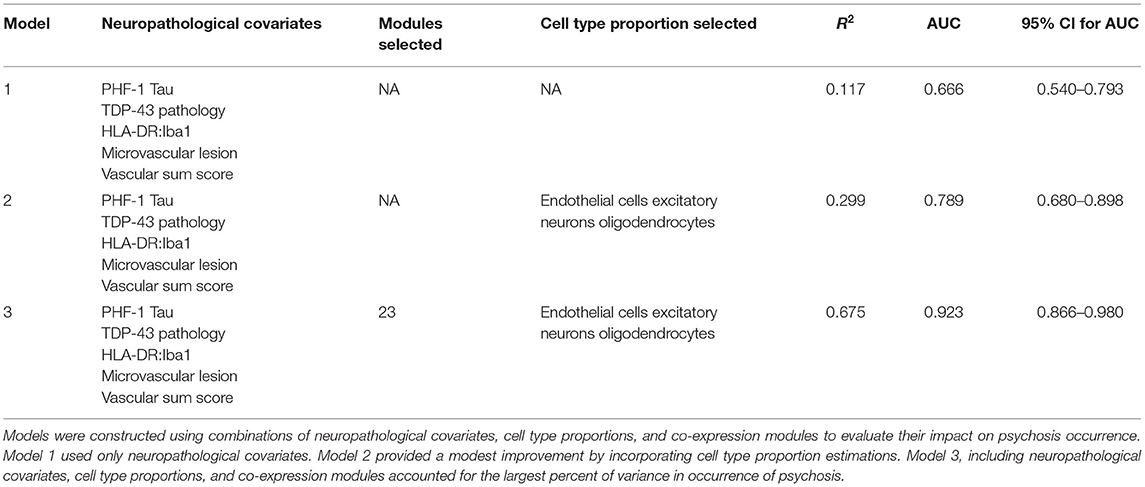
Table 3. Comparison of models of psychosis.
We have previously shown that only a minor fraction of the risk for psychosis in AD is attributable to the severity of multiple neuropathological lesions that are present in individuals with AD. We have also previously demonstrated that a decrease in post-synaptic protein abundance was associated with psychosis in AD. Here, we set out to improve our knowledge of neurobiological contributors to psychosis in AD and the mechanisms underlying the synaptic protein decrease by evaluating the transcriptome of AD subjects with and without psychosis. Our data suggests that decreases in excitatory neuron proportion beyond that present in AD subject without psychosis contributes to the underlying neurobiological perturbances associated with psychosis in AD. In addition, network analysis of the transcriptome identified a novel association with gene modules enriched for mRNAs regulating protein availability. Finally, inclusion of cell type proportions and differentially expressed module eigengenes significantly increased the fitness of our models beyond that of neuropathology alone, such that they now accounted for 67.5% of the variance in psychosis presence.
We estimated that there was a decrease of 9% in the excitatory neuron proportion in AD+P subjects compared to AD–P, after controlling for relevant neuropathologic burdens. Because the estimates of cell proportion are derived from measurements of levels of expressed excitatory neuron selective mRNAs, they could reflect either true cell loss or transcript downregulation (although, importantly, they did not appear to result from technical factors, Supplementary Figure 2, see also Supplementary Data Sheet for Figure Legends). Disentangling these two possibilities will require future single-cell RNA sequencing studies of AD+P. However, several lines of evidence support the former interpretation. DLPFC neuron loss occurs in Alzheimer's disease, including within individuals in the mild to moderate stages of disease as in the current study (37). Similarly, we have shown that levels of MAP2 protein, a marker of neuronal survival (38) vary across brain regions in association with the extent of disease-related neuron loss (16). Finally, in a subgroup of the current subjects, and controlling for neuropathologic burden, we reported a 32% decrease in MAP2 protein levels in AD+P subjects compared to AD–P subjects, while both AD phenotypes had significantly less MAP2 peptide levels than unaffected control subjects (15). Thus, it is most likely that both groups of AD subjects in the current study have a decrease in excitatory neuron number in DLPFC, and that the degree of this decrease is greater in AD+P than AD–P. Determining whether the excess loss in AD+P is general among all cortical excitatory neurons or selectively affects a subpopulation that is relatively spared in AD–P, remains an open question.
The above suggests that there is a modest increase in neurodegenerative mechanisms underlying psychosis in AD, due to both an increased burden of select pathologies and due to independent mechanisms. For example, we have recently identified that genetic variation in SUMF1, which encodes the formylglycine generating enzyme protein, SUMF1, is associated with psychosis risk in AD in a genome-wide analysis (39). SUMF1 activates multiple lysosomal sulfatases. Genetically driven reductions in SUMF1 expression or function lead to accumulation of glycosaminoglycans and sulfatides (40). Glycosaminoglycans promote formation of insoluble fibrils of amyloid-β and tau, providing a direct link between SUMF1 activity and the primary pathologies of AD (41). However, even in the absence of comorbid AD-related pathologies, SUMF1 knockout is sufficient to generate neuronal cell loss (42).
Previously, we found that AD+P subjects had a decreased level of synaptic proteins relative to AD–P subjects (15). Our current analysis indicates that mRNA levels contribute only modestly to the synaptic protein impairment in AD+P relative to AD–P. Moreover, because the correlation of transcript levels with protein levels was eliminated when controlling for cell type proportions, the modest contribution of transcript abundance to synaptic protein levels seems to derive from enhanced excitatory neuron loss in AD+P, rather than from a decreased rate of transcription per se. Because synaptic proteostasis is a highly dynamic process, where the effects of transcription are modified by local translation, protein trafficking, and degradation, it is likely that these post-transcriptional mechanisms underlie synaptic protein availability in AD+P.
Additionally, our current data suggests a possible role for altered post-transcriptional mechanisms which limit synaptic protein availability in association with psychosis in AD. In our analysis of differentially expressed gene modules, protein ubiquitination pathways, unfolded protein response pathways, eukaryotic initiation factor 2 (EIF2) signaling pathways and endoplasmic reticulum stress pathways were significantly enriched (Table 2). These pathways play a critical role in regulating protein translation and degradation in neurons, including activity-dependent translation and degradation in support of synaptic plasticity (43–49). Thus, our findings suggest that synaptic proteostasis regulation is a key player contributing toward risk of psychosis in AD.
In this study, we aimed to further nominate neurobiological mechanisms contributing to psychosis in AD. Our current findings suggest that excitatory neurons are selectively vulnerable in the DLPFC of AD+P subjects relative to AD–P. Further, our findings point to the roles of post-transcriptional mechanisms underlying synaptic deficits in AD+P and identify ubiquitination, unfolded protein response, eukaryotic initiation factor 2 (EIF2) signaling, and endoplasmic reticulum stress pathways as possibly contributing to altered synaptic protein abundance in AD+P. Given that the reduction in synaptic indices in AD+P relative to AD–P subjects is common throughout the neocortex (2), the current findings, despite regional variations in gene expression and neuropathology burden, are likely to be conserved in other neocortical regions.
The datasets presented in this study can be found in online repositories. The names of the repository/repositories and accession number(s) can be found below: https://www.ncbi.nlm.nih.gov/, PRJNA797425.
The studies involving human participants were reviewed and approved by University of Pittsburgh Institutional Review Board. The patients/participants provided their written informed consent to participate in this study.
MD-M analyzed the RNA-sequencing data, performed functional annotation analysis, and wrote the manuscript. YW and YD performed raw data processing of RNA-sequencing data, gene network analysis, cell type proportions, and differential gene expression analysis. CW assisted with RNA sample prep and analysis. JK conducted all neuropathologic assessments and with RS designed and oversaw all aspects of the conduct of the study. JK and MM provided the analyses of the synaptic proteome data. RS and OL contributed to the recruitment and assessment of all study subjects while alive. All authors reviewed and approved the final manuscript.
This work was supported by NIH grants AG005133 (OL, RS, and JK), AG066468 (OL, RS, and JK) MH116046 (RS, JK, MD-M, MM, YD, and YW), K01 MH107756 (MM).
The content is solely the responsibility of the authors and does not necessarily represent the official views of the National Institute of Mental Health, the National Institutes of Health, or the United States Government.
The authors declare that the research was conducted in the absence of any commercial or financial relationships that could be construed as a potential conflict of interest.
All claims expressed in this article are solely those of the authors and do not necessarily represent those of their affiliated organizations, or those of the publisher, the editors and the reviewers. Any product that may be evaluated in this article, or claim that may be made by its manufacturer, is not guaranteed or endorsed by the publisher.
The Supplementary Material for this article can be found online at: https://www.frontiersin.org/articles/10.3389/fneur.2022.778419/full#supplementary-material
1. Sweet RA, Nimgaonkar VL, Devlin B, Jeste DV. Psychotic symptoms in Alzheimer disease: evidence for a distinct phenotype. Mol Psychiatry. (2003) 8:383–92. doi: 10.1038/sj.mp.4001262
2. Murray PS, Kumar S, Demichele-Sweet MA, Sweet RA. Psychosis in Alzheimer's disease. Biol Psychiatry. (2014) 75:542–52. doi: 10.1016/j.biopsych.2013.08.020
3. Sweet RA, Pollock BG, Sukonick DL, Mulsant BH, Rosen J, Klunk WE, et al. The 5-HTTPR polymorphism confers liability to a combined phenotype of psychotic and aggressive behavior in Alzheimer disease. Int Psychogeriatr. (2001) 13:401–9. doi: 10.1017/S1041610201007827
4. Gilley DW, Wilson RS, Bennett DA, Bernard BA, Fox JH. Predictors of behavioral disturbance in Alzheimer's disease. J Gerontol. (1991) 46:362–71. doi: 10.1093/geronj/46.6.P362
5. DeMichele-Sweet MAA, Weamer EA, Klei L, Vrana DT, Hollingshead DJ, Seltman HJ, et al. Genetic risk for schizophrenia and psychosis in Alzheimer disease. Mol Psychiatry. (2018) 23:963–72. doi: 10.1038/mp.2017.81
6. Barral S, Vardarajan BN, Reyes-Dumeyer D, Faber KM, Bird TD, Tsuang D, et al. Genetic variants associated with susceptibility to psychosis in late-onset Alzheimer's disease families. Neurobiol Aging. (2015) 36:3116.e9–e16. doi: 10.1016/j.neurobiolaging.2015.08.006
7. Sweet RA, Bennett DA, Graff-Radford NR, Mayeux R. National Institute On Aging Late-Onset Alzheimer's Disease family study, assessment and familial aggregation of psychosis in Alzheimer's disease from the National Institute on aging late onset Alzheimer's disease family study. Brain. (2010) 133:1155–62. doi: 10.1093/brain/awq001
8. Sweet RA, Nimgaonkar VL, Devlin B, Lopez OL, DeKosky ST. Increased familial risk of the psychotic phenotype of Alzheimer disease. Neurology. (2002) 58:907–11. doi: 10.1212/WNL.58.6.907
9. Bacanu S-A, Devlin B, Chowdari KV, DeKosky ST, Nimgaonkar VL, Sweet RA. Heritability of psychosis in Alzheimer Disease. Am J Geriatr Psychiatry. (2005) 13:624–7. doi: 10.1097/00019442-200507000-00011
10. Kapasi A, DeCarli C, Schneider JA. Impact of multiple pathologies on the threshold for clinically overt dementia. Acta Neuropathol. (2017) 134:171–86. doi: 10.1007/s00401-017-1717-7
11. Hamilton RL Lewy Lewy bodies in Alzheimer's Disease: a neuropathological review of 145 cases using alpha-Synuclein Immunohistochemistr. Brain Pathol. (2000) 10:378–84. doi: 10.1111/j.1750-3639.2000.tb00269.x
12. Tremblay C, St-Amour I, Schneider J, Bennett DA, Calon F. Accumulation of transactive response DNA binding protein 43 in mild cognitive impairment and Alzheimer disease. J Neuropathol Exp Neurol. (2011) 70:788–98. doi: 10.1097/NEN.0b013e31822c62cf
13. Sarro L, Tosakulwong N, Schwarz CG, Graff-Radford J, Przybelski SA, Lesnick TG, et al. An investigation of cerebrovascular lesions in dementia with Lewy bodies compared to Alzheimer's disease. Alzheimers Dement. (2017) 13:257–66. doi: 10.1016/j.jalz.2016.07.003
14. Snyder HM, Corriveau RA, Craft S, Faber JE, Greenberg SM, Knopman D, et al. Vascular contributions to cognitive impairment and dementia including Alzheimer's disease. Alzheimers Dement. (2015) 11:710–7. doi: 10.1016/j.jalz.2014.10.008
15. Krivinko JM, Erickson SL, Ding Y, Sun Z, Penzes P, MacDonald ML, et al. Synaptic proteome compensation and resilience to psychosis in Alzheimer's Disease. Am J Psychiatry. (2018) 175:999–1009. doi: 10.1176/appi.ajp.2018.17080858
16. Sweet RA, MacDonald ML, Kirkwood CM, Ding Y, Schempf T, Jones-Laughner J, et al. Apolipoprotein E*4 (APOE*4) genotype is associated with altered levels of glutamate signaling proteins and synaptic coexpression networks in the prefrontal cortex in mild to moderate Alzheimer Disease. Mol Cell Proteomics. (2016) 15:2252–62. doi: 10.1074/mcp.M115.056580
17. Sweet RA, Hamilton RL, Lopez OL, Klunk WE, Wisniewski SR, Kaufer DI, et al. Psychotic symptoms in Alzheimer's disease are not associated with more severe neuropathologic features. Int Psychogeriatr. (2000) 12:547–58. doi: 10.1017/S1041610200006657
18. Lopez OL, Becker JT, Chang Y-F, Sweet RA, Aizenstein H, Snitz B, et al. The long-term effects of conventional and atypical antipsychotics in patients with probable Alzheimer's disease. Am J Psychiatry. (2013) 170:1051–8. doi: 10.1176/appi.ajp.2013.12081046
19. Tariot PN, Mack JL, Patterson MB, Edland SD, Weiner MF, Fillenbaum G, et al. The behavior rating scale for dementia of the consortium to establish a registry for Alzheimer's Disease. The Behavioral Pathology Committee of the Consortium to Establish a Registry for Alzheimer's Disease. Am J Psychiatry. (1995) 152:1349–57. doi: 10.1176/ajp.152.9.1349
20. DeMichele-Sweet MAA, Klei L, Devlin B, Ferrell RE, Weamer EA, Emanuel JE, et al. No association of psychosis in Alzheimer disease with neurodegenerative pathway genes. Neurobiol Aging. (2011) 32:555.e9–555.e11. doi: 10.1016/j.neurobiolaging.2010.10.003
21. Weamer EA, DeMichele-Sweet MA, Cloonan YK, Lopez OL, Sweet RA. Incident psychosis in subjects with mild cognitive impairment or Alzheimer's Disease. J Clin Psychiatry. (2016) 77:e1564–69. doi: 10.4088/JCP.15m10617
22. Weamer EA, Emanuel JE, Varon D, Miyahara S, Wilkosz PA, Lopez OL, et al. The relationship of excess cognitive impairment in MCI and early Alzheimer's disease to the subsequent emergence of psychosis. Int Psychogeriatr. (2009) 21:78–85. doi: 10.1017/S1041610208007734
23. Wilkosz PA, Kodavali C, Weamer EA, Miyahara S, Lopez OL, Nimgaonkar VL, et al. Prediction of psychosis onset in Alzheimer disease: the role of depression symptom severity and the HTR2A T102C polymorphism. Am J Med Genet B Neuropsychiatr Genet. (2007) 1054–62. doi: 10.1002/ajmg.b.30549
24. Wilkosz PA, Miyahara S, Lopez OL, DeKosky ST, Sweet RA. Prediction of psychosis onset in Alzheimer Disease: the role of cognitive impairment, depressive symptoms, and further evidence for psychosis subtypes. Am J Geriatr Psychiatry. (2006) 14:352–60. doi: 10.1097/01.JGP.0000192500.25940.1b
25. Hyman BT, Trojanowski JQ. Editorial on consensus recommendations for the postmortem diagnosis of Alzheimer Disease from the National Institute of Aging and the Reagan Institute Working Group o Diagnostic Criteria for the Neuropathological Assessment of Alzheimer Disease. J Neuropathol Exp Neurol. (1997) 56:1095–7. doi: 10.1097/00005072-199710000-00002
26. Kim D, Pertea G, Trapnell C, Pimentel H, Kelley R, Salzberg SL. TopHat2: accurate alignment of transcriptomes in the presence of insertions, deletions and gene fusions. Genome Biol. (2013) 14:R36. doi: 10.1186/gb-2013-14-4-r36
27. Trapnell C, Williams BA, Pertea G, Mortazavi A, Kwan G, van Baren MJ, et al. Transcript assembly and quantification by RNA-Seq reveals unannotated transcripts and isoform switching during cell differentiation. Nat Biotechnol. (2010) 28:511–5. doi: 10.1038/nbt.1621
28. Ritchie ME, Phipson B, Wu D, Hu Y, Law CW, Shi W, et al. limma powers differential expression analyses for RNA-sequencing and microarray studies. Nucleic Acids Res. (2015) 43:e47. doi: 10.1093/nar/gkv007
29. Mostafavi S, Gaiteri C, Sullivan SE, White CC, Tasaki S, Xu J, et al. A molecular network of the aging human brain provides insights into the pathology and cognitive decline of Alzheimer's disease. Nat Neurosci. (2018) 21:811–9. doi: 10.1038/s41593-018-0154-9
30. Wang J, Devlin B, Roeder K. Using multiple measurements of tissue to estimate subject- and cell-type-specific gene expression. Bioinformatics. (2020) 36:782–8. doi: 10.1093/bioinformatics/btz619
31. Wang M, Beckmann ND, Roussos P, Wang E, Zhou X, Wang Q, et al. The Mount Sinai cohort of large-scale genomic, transcriptomic and proteomic data in Alzheimer's disease. Sci Data. (2018) 5:180185. doi: 10.1038/sdata.2018.185
32. Darmanis S, Sloan SA, Zhang Y, Enge M, Caneda C, Shuer LM, et al. A survey of human brain transcriptome diversity at the single cell level. Proc Natl Acad Sci USA. (2015) 112:7285–90. doi: 10.1073/pnas.1507125112
33. Zheng SC, Breeze CE, Beck S, Teschendorff AE. Identification of differentially methylated cell types in epigenome-wide association studies. Nat Methods. (2018) 15:1059–66. doi: 10.1038/s41592-018-0213-x
34. Song WM, Zhang B. Multiscale embedded gene co-expression network analysis. PLoS Comput Biol. (2015) 11:e1004574. doi: 10.1371/journal.pcbi.1004574
35. Hanley JA, McNeil BJ. The meaning and use of the area under a receiver operating characteristic (ROC) curve. Radiology. (1982) 143:29–36. doi: 10.1148/radiology.143.1.7063747
36. DeLong ER, DeLong DM, Clarke-Pearson DL. Comparing the areas under two or more correlated receiver operating characteristic curves: a nonparametric approach. Biometrics. (1988) 44:837–45. doi: 10.2307/2531595
37. Bussire T, Gold G, Kvari E, Giannakopoulos P, Bouras C, Perl DP, et al. Stereologic analysis of neurofibrillary tangle formation in prefrontal cortex area 9 in aging and Alzheimer's disease. Neuroscience. (2003) 117:577–92. doi: 10.1016/S0306-4522(02)00942-9
38. Kirkwood CM, MacDonald ML, Schempf TA, Vatsavayi AV, Ikonomovic MD, Koppel JL, et al. Altered Levels of Visinin-Like Protein 1 Correspond to Regional Neuronal Loss in Alzheimer Disease and Frontotemporal Lobar Degeneration. J Neuropathol Exp Neurol. (2016) 75:175–82. doi: 10.1093/jnen/nlv018
39. DeMichele-Sweet MAA, Klei L, Creese B, Weamer EA, McClain L, Sims R, et al. Genome-wide association identifies the First Risk Loci for Psychosis in Alzheimer Disease. Mol Psychiatry. (2021) 26:5797–811. (2020). doi: 10.1101/2020.08.07.20139261
40. Schlotawa L, Adang LA, Radhakrishnan K, Ahrens-Nicklas RC. Multiple sulfatase deficiency: a disease comprising Mucopolysaccharidosis, Sphingolipidosis, and more caused by a defect in posttranslational modification. Int J Mol Sci. (2020) 21:3448. doi: 10.3390/ijms21103448
41. Díaz-Nido J, Wandosell F, Avila J. Glycosaminoglycans and beta-amyloid, prion and tau peptides in neurodegenerative diseases. Peptides. (2002) 23:1323–32. doi: 10.1016/S0196-9781(02)00068-2
42. Settembre C, Annunziata I, Spampanato C, Zarcone D, Cobellis G, Nusco E, et al. Systemic inflammation and neurodegeneration in a mouse model of multiple sulfatase deficiency. Proc Natl Acad Sci USA. (2007) 104:4506–11. doi: 10.1073/pnas.0700382104
43. Bellato HM, Hajj GNM. Translational control by eIF2α in neurons: Beyond the stress response. Cytoskeleton. (2016) 73:551–65. doi: 10.1002/cm.21294
44. Martin KC, Zukin RS. RNA trafficking and local protein synthesis in dendrites: an overview. J Neurosci. (2006) 26:7131–4. doi: 10.1523/JNEUROSCI.1801-06.2006
45. Costa-Mattioli M, Gobert D, Stern E, Gamache K, Colina R, Cuello C, et al. eIF2alpha phosphorylation bidirectionally regulates the switch from short- to long-term synaptic plasticity and memory. Cell. (2007) 129:195–206. doi: 10.1016/j.cell.2007.01.050
46. Lin B, Alganem K, O'Donovan SM, Jin Z, Naghavi F, Miller OA, et al. Activation of acid-sensing ion channels by carbon dioxide regulates amygdala synaptic protein degradation in memory reconsolidation. Mol Brain. (2021) 14:78. doi: 10.1186/s13041-021-00786-7
47. Oliveira MM, Lourenco MV, Longo F, Kasica NP, Yang W, Ureta G, et al. Correction of eIF2-dependent defects in brain protein synthesis, synaptic plasticity, and memory in mouse models of Alzheimer's disease. Sci Signal. (2021) 14:eabc5429. doi: 10.1126/scisignal.abc5429
48. Saito A, Cai L, Matsuhisa K, Ohtake Y, Kaneko M, Kanemoto S, et al. Neuronal activity-dependent local activation of dendritic unfolded protein response promotes expression of brain-derived neurotrophic factor in cell soma. J Neurochem. (2018) 144:35–49. doi: 10.1111/jnc.14221
Keywords: Alzheimer's disease, psychosis, transcriptomic (RNA-seq), post-transcription, postmortem, dorsolateral prefrontal cortex (DLPFC)
Citation: DeChellis-Marks MR, Wei Y, Ding Y, Wolfe CM, Krivinko JM, MacDonald ML, Lopez OL, Sweet RA and Kofler J (2022) Psychosis in Alzheimer's Disease Is Associated With Increased Excitatory Neuron Vulnerability and Post-transcriptional Mechanisms Altering Synaptic Protein Levels. Front. Neurol. 13:778419. doi: 10.3389/fneur.2022.778419
Received: 16 September 2021; Accepted: 04 February 2022;
Published: 02 March 2022.
Edited by:
Lori B. Chibnik, Massachusetts General Hospital and Harvard Medical School, United StatesReviewed by:
Eline Pecho-Vrieseling, University of Basel, SwitzerlandCopyright © 2022 DeChellis-Marks, Wei, Ding, Wolfe, Krivinko, MacDonald, Lopez, Sweet and Kofler. This is an open-access article distributed under the terms of the Creative Commons Attribution License (CC BY). The use, distribution or reproduction in other forums is permitted, provided the original author(s) and the copyright owner(s) are credited and that the original publication in this journal is cited, in accordance with accepted academic practice. No use, distribution or reproduction is permitted which does not comply with these terms.
*Correspondence: Robert A. Sweet, c3dlZXRyYUB1cG1jLmVkdQ==
Disclaimer: All claims expressed in this article are solely those of the authors and do not necessarily represent those of their affiliated organizations, or those of the publisher, the editors and the reviewers. Any product that may be evaluated in this article or claim that may be made by its manufacturer is not guaranteed or endorsed by the publisher.
Research integrity at Frontiers
Learn more about the work of our research integrity team to safeguard the quality of each article we publish.