 Xiaohan Lv
 Zhenjie Teng
 Zhiyang Jia
 Yanhong Dong2
 Peiyuan Lv
- 1Department of Neurology, Hebei Medical University, Shijiazhuang, China
- 2Department of Neurology, Hebei General Hospital, Shijiazhuang, China
- 3Department of Neurology, Hebei Provincial Key Laboratory of Cerebral Networks and Cognitive Disorders, Shijiazhuang, China
- 4Department of Ophthalmology, Hebei General Hospital, Shijiazhuang, China
Purpose: To investigate the relationship between the retinal thickness in different subfields and the volume of white matter hyperintensity (WMH), with the hope to provide new evidence for the potential association between the retina and the brain.
Methods: A total of 185 participants aged over 40 years were included in our study. Magnetic resonance imaging (MRI) was used to image the WMH, and WMH volume was quantitatively measured by a specific toolbox. The thickness of the total retina, the retinal nerve fiber layer (RNFL), and the ganglion cell and inner plexiform layer (GCIP) was measured by optical coherence tomography (OCT) in nine subfields. The association between retinal thickness and WMH volume was demonstrated using binary logistic regression and Pearson correlation analysis.
Results: Participants were divided into two groups by the WMH volume (‰, standardized WMH volume) median. In the quartile-stratified binary logistic regression analysis, we found that the risk of higher WMH volume showed a positive linear trend correlation with the thickness of total retina (95% CI: 0.848 to 7.034; P for trend = 0.044)/ GCIP (95% CI: 1.263 to 10.549; P for trend = 0.038) at the central fovea, and a negative linear trend correlation with the thickness of nasal inner RNFL (95% CI: 0.086 to 0.787; P for trend = 0.012), nasal outer RNFL (95% CI: 0.058 to 0.561; P for trend = 0.004), and inferior outer RNFL (95% CI: 0.081 to 0.667; P for trend = 0.004), after adjusting for possible confounders. Correlation analysis results showed that WMH volume had a significant negative correlation with superior outer RNFL thickness (r = −0.171, P = 0.02) and nasal outer RNFL thickness (r = −0.208, P = 0.004).
Conclusion: It is suggested that central fovea and outer retina thickness are respectively associated with WMH volume. OCT may be a biological marker for early detection and longitudinal monitoring of WMH.
Introduction
White matter hyperintensity (WMH) is a manifestation of cerebral small vessel disease. It is divided into periventricular white matter hyperintensity (PWMH) and deep white matter hyperintensity (DWMH) according to the location. Its pathology remains unknown. Current studies suggest that it is related to white matter (WM) demyelination, axon loss, and gliosis caused by blood–brain barrier leakage, hypoperfusion, vessel endothelial dysfunction, inflammatory response, oxidative stress, and venous drainage disturbance (1–5). DWMH is more related to ischemic factors and showed more axonal loss, infarction, and tissue loss in postmortem studies. PWMH is closely related to inflammatory factors and showed more edema and gliosis compared to DWMH (6, 7). WMH impairs cognitive function, motor function, mood, and urinary function. It may increase the risk of stroke and dementia, burdening family and society (8). Currently, the clinical evaluation of WMH largely depends on magnetic resonance imaging (MRI). However, MRI is expensive, complicated, and difficult to cooperate with patients, so more economical methods are needed for WMH scans.
The retina is composed of nine retinal neuroepithelial layers [inner limiting membrane, retinal nerve fiber layer (RNFL), ganglion cell layer (GCL), inner plexiform layer (IPL), inner nuclear layer, outer plexiform layer, outer nuclear layer, external limiting membrane, and photoreceptor segments] and retinal pigment epithelial layer (9). Optical coherence tomography (OCT) is a non-invasive imaging technique based on low coherence interferometry that makes it possible to view high-resolution images of the retina in vivo. OCT system generates cross-sectional images of the retina that show the reflectivity information captured in depth by means of whiter or darker bands (10). RNFL is composed of ganglion cell axons that travel in bundles until the optic nerve. It is responsible for transmitting visual information to the visual cortex. GCL is composed of the nuclei of ganglion, while IPL is formed by the synaptic connections between ganglion cells, bipolar cells, and amacrine cells (9). The macular fovea is an avascular depressed area in the retinal posterior pole. It is the most visually sensitive part of the retina and is responsible for our ability to read, distinguish colors, and for our spatial resolution capacity (9). In the ophthalmology field, OCT is widely used to detect the early stages of diseases and track the progression after the treatment of retinal pathologies (11).
The retina is regarded to be an extension of the brain. They have the same properties in embryology, physiology, and morphology. First, the retina develops from the diencephalon during the embryonic stage (10). Next, given that ocular arteries descend from the internal carotid artery, the vessels of the retina have many anatomical and physiological traits in common with the vessels of the brain. Researchers have confirmed that retinal vasculopathy and WMH had similar vascular risk factors (12). Furthermore, tight junctions between endothelial cells and peripheral astrocytes, Müller cells, and pericytes build the blood–retinal barrier together, which is reminiscent of the blood–brain barrier (13). The aqueous humor contains abundant immunoregulatory and anti-inflammatory mediators, which resemble the cerebrospinal fluid (CSF) (14). In summary, the retina has similar features to the brain and thus provides a window to explore intracranial lesions.
Optical coherence tomography has been used to explore some cerebral diseases, like Alzheimer's disease (AD), multiple sclerosis, Parkinson's disease, and neuromyelitis optical spectrum disorder (15–18). A previous study found that healthy subjects with a high genetic risk for the development of AD showed early changes in the macular area, where RNFL and IPL were significantly thinner than the control group (15). There is a direct correlation between RNFL thickness and medial temporal lobe volume, especially with the hippocampus volume (19). The decrease of RNFL thickness in the macular area can be observed before the damage to the central nervous memory system, indicating that it may be an early biomarker of AD or cognitive impairment (20). As for the thinner IPL found in the high-risk group of AD, the writer attributed it to the decreased cholinergic activity in this layer (15, 21, 22). Besides, in more advanced stages of AD, ganglion cell and inner plexiform layer (GCIP) complex showed a decrease in thickness in all the subfields compared with the control group (23). Similarly, multiple sclerosis and Parkinson's disease also exhibit accelerated RNFL and GCIP thinning throughout the disease course, particularly in the early stage (16, 17). Neuromyelitis optica spectrum disorder is mainly manifested as the GCIP loss independent of optic neuritis attacks (18). OCT and its related technologies may represent a novel tool to diagnose and distinguish those cerebral diseases (24). According to the above-mentioned studies, we finally selected the thickness of the total retina, RNFL, and GCIP for analysis.
Recent studies have found that retinal changes might be closely related to WMH (25–35). It is known that only retinal vessels can be observed non-invasively in vivo. Recent studies have demonstrated the association between WMH and retinal vessel diameter (25), retinopathy (26, 27), altered retinal vessel bifurcation (28) measured by retinal fundus image, and retinal microvascular density measured by optical coherence tomography angiography (OCTA) (29–31), suggesting that microvascular impairment is a cause of WMH. In retinal sublayers, RNFL contains axons, and might reflect the condition of WM. GCIP contains cell bodies and synaptic structures and might reflect the condition of gray matter (GM) (32). Qu et al. found that retinal degeneration in the RNFL and GCIP was independently associated with WMH, and deteriorated with the severity of the WMH (33). A recent study also showed that abnormalities in retinal microvascular density, morphological parameters, and RNFL thickness were correlated with the incidence of moderate-severe WMH (34). Carolina et al. evaluated the WM integrity tract by diffusion tensor imaging and found that GCL and IPL thickness could reflect the whole-brain WM dysfunction in patients with multiple sclerosis (35).
In this study, WMH volume was quantitatively determined, while the retina was divided into nine subfields by OCT. We aim to quantitatively analyze the association between the retinal thickness in different subfields and the volume of WMH to provide new evidence for the potential retina–brain association.
Materials and methods
Participants
In this cross-sectional study, we recruited participants from the inpatients of the department of neurology in Hebei General Hospital from October 2019 to April 2022. In total, 185 participants aged over 40 years without dementia underwent complete 3T MRI sequences necessary for evaluating WMH volume and OCT examination necessary for evaluating retinal thickness. Exclusion criteria were as follows: (1) neurological diseases, such as acute and large-area stroke, tumor, epilepsy, mental disorders, central nervous system demyelinating disease, or trauma; (2) any cognitive deterioration history or ever had a diagnosis of dementia; (3) Barthel Activities of Daily Living Index [scale 0–100, 10 items including feeding, personal toileting, bathing, dressing and undressing, getting on and off a toilet, controlling bladder, controlling bowel, moving from wheelchair to bed and returning, walking on level surface (or propelling a wheelchair if unable to walk), and ascending and descending stairs] < 80 (36); (4) contraindications to MRI; (5) primary eye diseases, such as severe diabetic and hypertensive retinopathy, cataract, glaucoma, macular degeneration, intraocular pressure > 21 mmHg, high myopia, or prior ocular surgery; and (6) other hematological and metabolic diseases.
Clinical assessment
A number of variables, including age, gender, body mass index (BMI), medical history [hypertension, diabetes, coronary heart disease (CHD), and stroke], current smoking, alcohol use, systolic blood pressure (SBP), and diastolic blood pressure (DBP), were collected. We recorded laboratory indicators, including total cholesterol (TC), triglyceride (TG), low-density lipoprotein cholesterol (LDL-C), high-density lipoprotein cholesterol (HDL-C), fasting plasma glucose (FPG), and uric acid (UA).
Magnetic resonance imaging data acquisition and standardized white matter hyperintensity volume evaluation
All eligible participants underwent 3.0 tesla MR scanners (Signa, GE Healthcare, USA) [T1-weighted, T2-weighted, and fluid-attenuated inversion recovery (FLAIR)] with a slice thickness of 5 mm. WMH is the high signal area on T2-weighted and FLAIR (37).
The WMH was visually evaluated on FLAIR based on the Fazekas scale by an experienced neuro-radiologist. PWMH is WMH contiguous with the margins of each lateral ventricle, while DWMH is WMH separate from the ventricles (38). PWMH score: 0 = absence, 1 = caps or pencil thin lining, 2 = smooth halo, and 3 = irregular distribution with extension into deep WM. DWMH score: 0 = absence, 1 = punctate foci, 2 = beginning confluence of foci, and 3 = large confluent areas.
Structural MRI data were preprocessed by default parameters as implemented in the CAT12 toolbox (Computation Anatomy Toolbox, version 1184, Structural Brain Mapping Group, Jena University Hospital, Germany; http://dbm.neuro.uni-jena.de/cat/) established on SPM12 (Statistical Parametric Mapping 12, Institute of Neurology, London, UK) in Matlab (Matrix Laboratory, version 2021a, The MathWorks, USA) (39). Images were bias-corrected, segmented, and spatially normalized according to the DARTEL algorithm (40). A Gaussian kernel of 8 mm full width at half-maximum was used for the spatial smoothness of MRI data. The CAT12 “check data quality using covariance” procedure was used for quality assurance. We obtained the adjusted volume of GM/ WM/ CSF, and total intracranial volume was determined as the sum of CSF, WM, and GM.
The WMH volume was segmented by the Lesion Growth Algorithm (LGA) from the LST toolbox (Lesion Segmentation Toolbox, version 3.0.0, Morphometry Group, Department of Neurology, Technische Universität München, Germany; www.statistical-modelling.de/lst.html) (41). This toolbox was established on SPM12 based on the probabilistic modeling and the region growing algorithm. The algorithm first segmented the T1-weighted images into GM/ WM/ CSF. Lesion belief maps were created by combining these data with the intensities on FLAIR. By thresholding these maps with a pre-chosen initial threshold (κ), initial binary lesion maps were obtained, which were subsequently grown along the voxels that appeared hyperintense on the FLAIR image. We finally obtained the lesion probability maps and the total WMH volume of bilateral cerebral hemispheres (Figure 1).
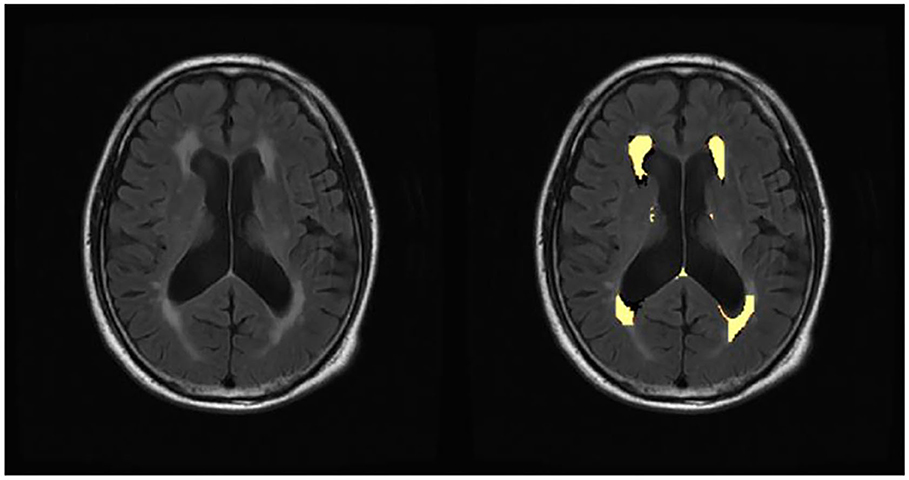
Figure 1. Automated white matter hyperintensity segmentations on sample subject fluid-attenuated inversion recovery scan by lesion growth algorithm.
Standardized WMH volume = actual WMH volume/ total intracranial volume (42). WMH volume (‰) was used to represent the standardized WMH volume in our study.
Optical coherence tomography image acquisition and retinal thickness measure
Retinal images were taken for all subjects by the OCT imaging system. The Swept Source OCT (Topcon DRI OCT Triton, version 10.18, Topcon Corporation, Tokyo, Japan) with 3D scans (6.0 × 6.0 mm, 1,024 × 128) was used to obtain OCT scans centered at the fovea. The scans were obtained without pharmacological mydriasis under dark room conditions. All the OCT scans were reviewed by an experienced ophthalmologist to exclude poor-quality OCT scans. We excluded OCT scans of poor quality according to the OSCAR-IB criteria (43). The OCT scans were automatically segmented by the built-in software (Topcon Ophthalmic Data System IMAGEnet 6, version 1.2x, Topcon Corporation, Tokyo, Japan). According to the early treatment diabetic retinopathy study (ETDRS) grids, nine areas were divided by three concentric circles (diameter: 1 mm, 3 mm, and 6 mm) and lines in the “± 45 degree” direction. The thickness of the total retina, RNFL, and GCIP in inner/ outer superior, inner/ outer nasal, inner/ outer inferior, and inner/ outer temporal quadrants were recorded for each participant (Figure 2). Both eyes of each subject were scanned, and the average of both eyes was used in this study.
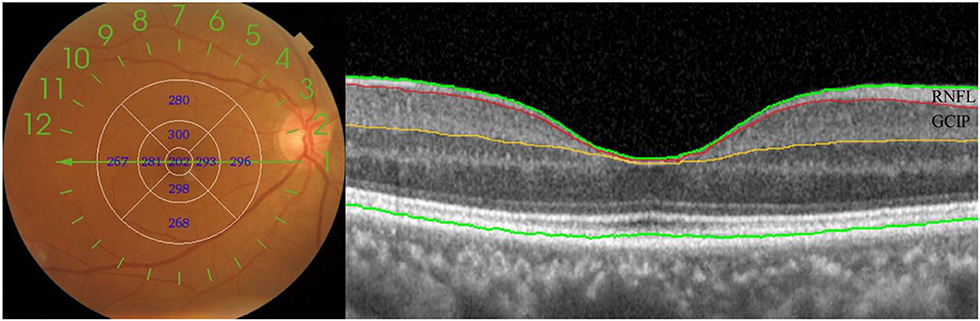
Figure 2. Optical coherence tomography of the retinal imaging. Nine subfields and retinal sublayers in macula. RNFL, retinal nerve fiber layer; GCIP, ganglion cell and inner plexiform layer.
Statistical analyses
Continuous variables were presented as mean ± standard deviation or median (interquartile range) as appropriate. Categorical variables were presented as frequencies and percentages. The T-tests or Mann–Whitney U-tests were used for continuous variables, and χ2-tests were used for categorical variables. The thickness of the retina was analyzed by the T-tests. The pattern diagrams of ETDRS grids were drawn to display the changes in retina thickness more vividly (Figure 3). Thickening of the retina was shown in red and thinning was shown in blue, with the color strengthening as the change increased (15). The association between retinal thickness and WMH volume was investigated by binary logistic regression. A test for linear trend was conducted with the use of quartiles of the retinal thickness variables, with P < 0.1 in the binary logistic regression, as continuous variables by assigning the medians of the quartiles to the variables. The association between retinal thickness and WMH volume was further tested using the Pearson correlation analysis. SPSS version 26.0 (IBM Corporation, Armonk, New York, USA) was used for all analyses, with a P-value of < 0.05 as the significance level.
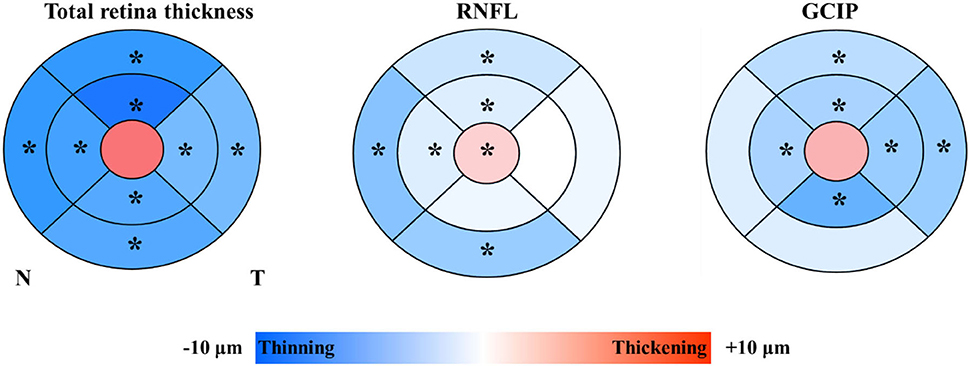
Figure 3. Colorimetric differences in different subfields between the lower white matter hyperintensity volume group and the higher white matter hyperintensity volume group. In red, thickening; in blue, thinning. RNFL, retinal nerve fiber layer; GCIP, ganglion cell and inner plexiform layer. *P < 0.05.
Results
Participant characteristics
We included 185 participants in this research. The participants were divided into two groups by the WMH volume (‰, standardized WMH volume) median. A total of 92 participants were grouped as the lower WMH volume group [WMH volume < 0.9496‰, mean age = 58.51 (9.18) years, male = 43.3%], and 93 participants were grouped as the higher WMH volume group [WMH volume ≥ 0.9496‰, mean age = 68.14 (10.05) years, male = 58.1%].
The characteristics of participants in the lower WMH volume group and the higher WMH volume group are summarized in Table 1. Individuals in the higher WMH volume group were significantly older, more likely to be male, and have a history of hypertension, CHD, and stroke than those in the lower WMH volume group. The higher WMH volume group presented higher SBP but lower LDL-C than the lower WMH volume group.
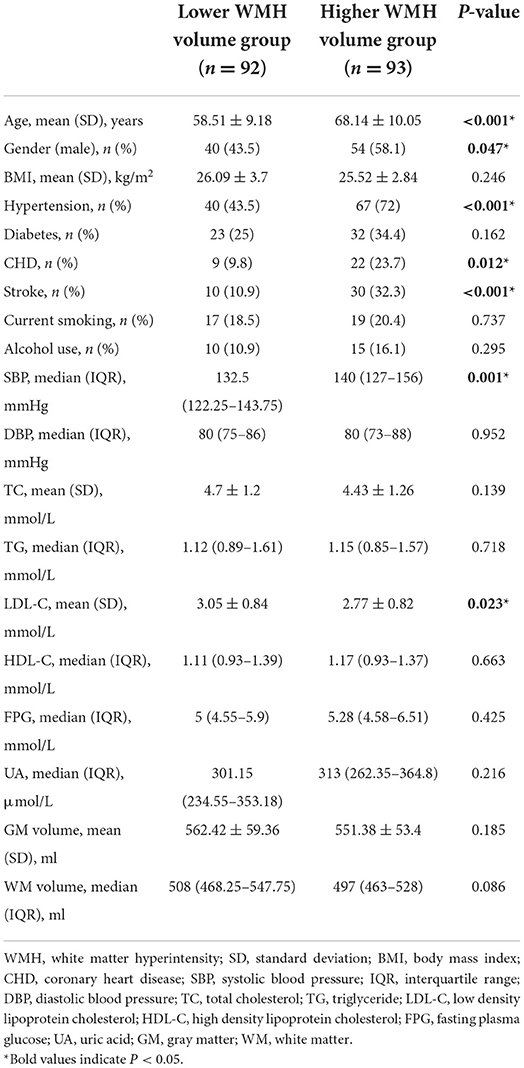
Table 1. Comparison of baseline characteristics between the lower white matter hyperintensity volume group and the higher white matter hyperintensity volume group.
Comparison of the retinal thickness in different subfields between the lower white matter hyperintensity volume group and the higher white matter hyperintensity volume group
Participants with higher WMH volume showed significantly thicker RNFL at the central fovea (P = 0.016), and thinner superior inner total retina (P < 0.001)/ RNFL (P = 0.034)/ GCIP (P = 0.014), nasal inner total retina (P = 0.006)/ RNFL (P = 0.039)/ GCIP (P = 0.027), inferior inner total retina (P = 0.007)/ GCIP (P = 0.018), temporal inner total retina (P = 0.017)/ GCIP (P = 0.033), superior outer total retina (P = 0.001)/ RNFL (P = 0.007) /GCIP (P = 0.006), nasal outer total retina (P < 0.001)/ RNFL (P < 0.001), inferior outer total retina (P = 0.003)/ RNFL (P = 0.001), and temporal outer total retina (P = 0.006)/ GCIP (P = 0.004) thickness, when compared to the participants with lower WMH volume (Table 2, Figure 3). No significant difference was seen in the thickness of total retina (P = 0.146)/ GCIP (P = 0.078) at the central fovea, inferior inner RNFL (P = 0.196), temporal inner RNFL (P = 0.972), nasal outer GCIP (P = 0.085), inferior outer GCIP (P = 0.105), and temporal outer RNFL (P = 0.188) when both groups were compared (Table 2, Figure 3).
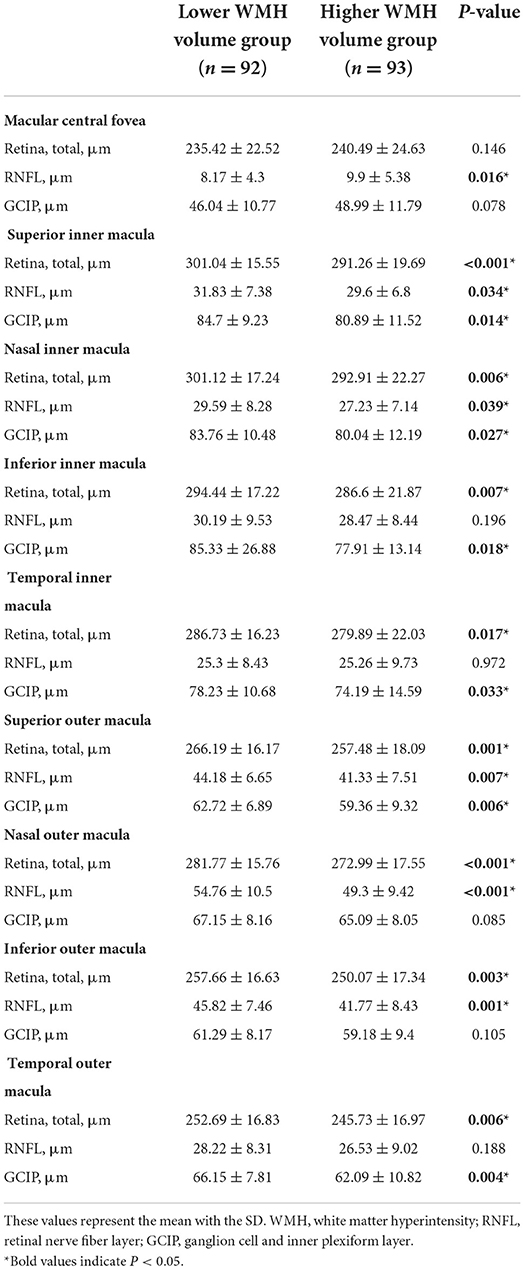
Table 2. Comparison of the retinal thickness in different subfields between the lower white matter hyperintensity volume group and the higher white matter hyperintensity volume group.
Association between the retinal thickness in different subfields and the risk of higher white matter hyperintensity volume
In binary logistic regression, thicker total retina (OR: 1.018; 95% CI: 1.002 to 1.035; P = 0.026)/ GCIP (OR: 1.034; 95% CI: 1 to 1.068; P = 0.048) at the central fovea, and thinner nasal inner RNFL (OR: 0.952; 95% CI: 0.907 to 0.999; P = 0.048), nasal outer RNFL (OR: 0.937; 95% CI: 0.901 to 0.976; P = 0.002), inferior outer RNFL (OR: 0.933; 95% CI: 0.887 to 0.981; P = 0.006), and temporal outer GCIP (OR: 0.952; 95% CI: 0.908 to 0.997; P = 0.039) were associated with an increase in the risk of higher WMH volume, after adjusting for age, gender, hypertension, CHD, stroke, SBP, and LDL-C (Table 3). In the quartile-stratified analysis, we found that the risk of higher WMH volume showed a positive linear trend correlation with total retina and GCIP thickness at the central fovea, and a negative linear trend correlation with nasal inner RNFL, nasal outer RNFL, and inferior outer RNFL thickness (Table 4, Figure 4). The ORs of higher WMH volume of the highest quartile of retinal thickness compared with the lowest were 2.442 (95% CI: 0.848–7.034; P for trend = 0.044) for total retina thickness at the central fovea, 3.65 (95% CI: 1.263–10.549; P for trend = 0.038) for GCIP thickness at the central fovea, 0.26 (95% CI: 0.086–0.787; P for trend = 0.012) for nasal inner RNFL thickness, 0.181 (95% CI: 0.058–0.561; P for trend = 0.004) for nasal outer RNFL thickness, and 0.232 (95% CI: 0.081–0.667; P for trend = 0.004) for inferior outer RNFL thickness, after adjusting for age, gender, hypertension, CHD, stroke, SBP, and LDL-C. The correlation analysis results showed that WMH volume had a significantly negative correlation with superior outer RNFL thickness (r = −0.171, P = 0.02) and nasal outer RNFL thickness (r = −0.208, P = 0.004; Table 5, Figure 5).
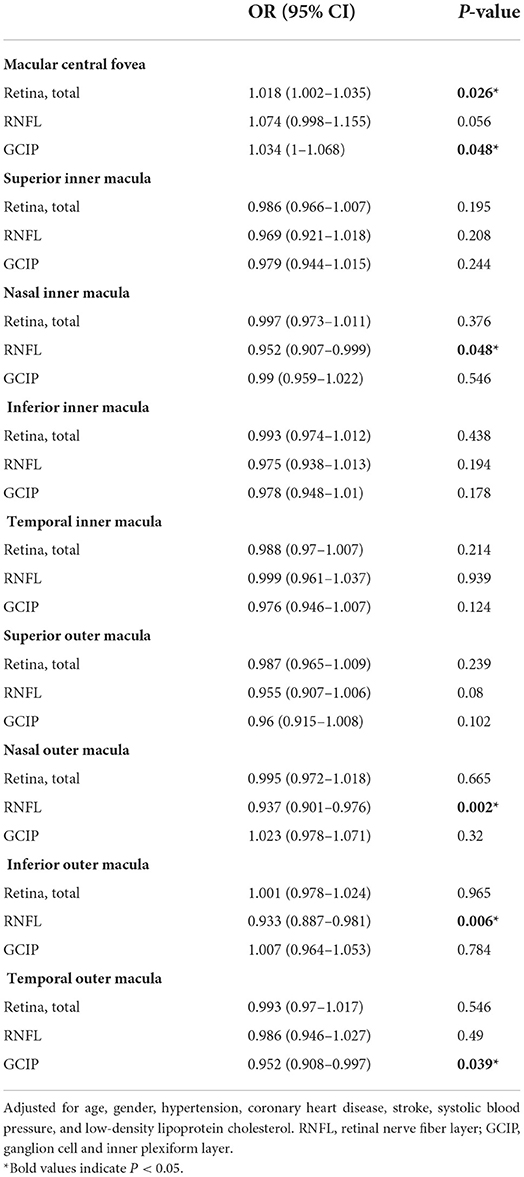
Table 3. Logistic regression analysis of retinal thickness in different subfield-related factors for higher white matter hyperintensity volume.
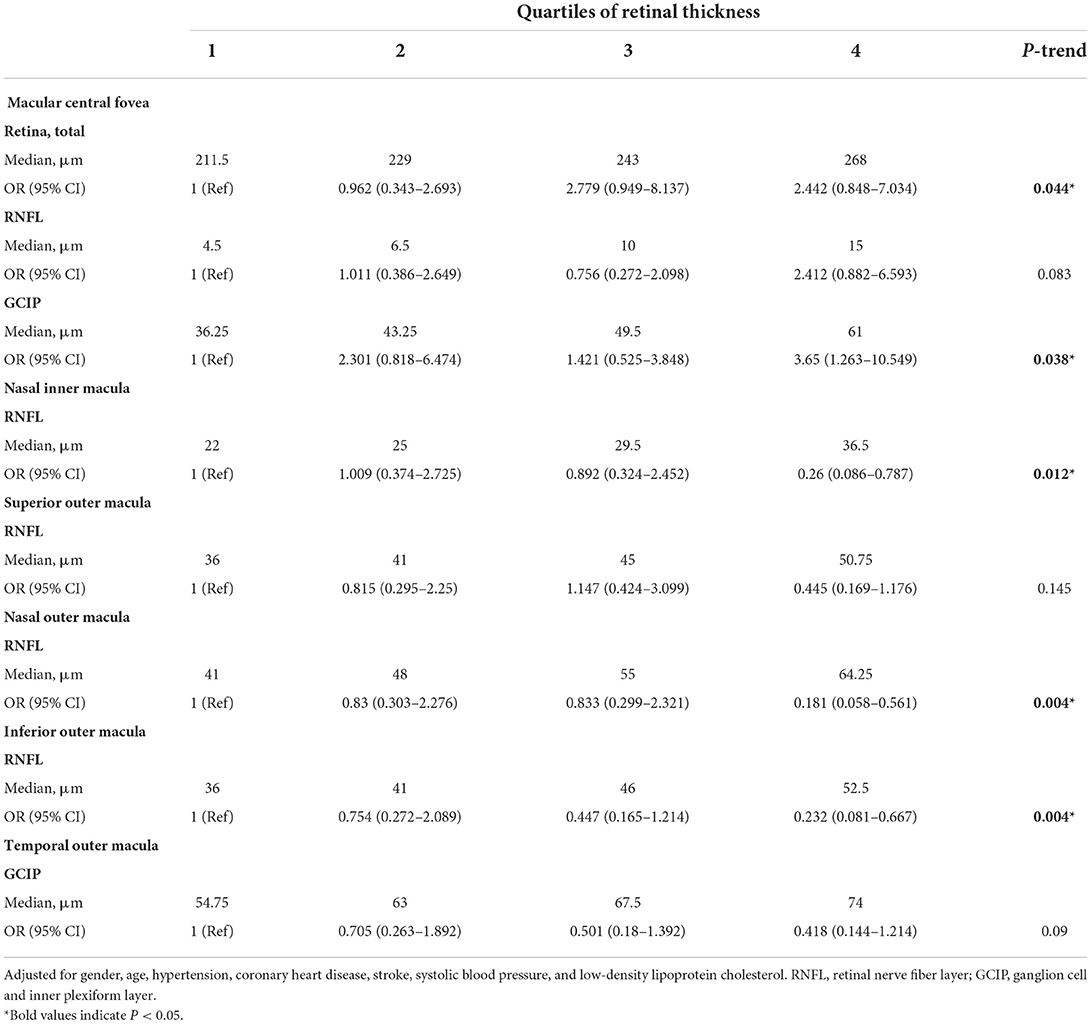
Table 4. ORs (and 95% CIs) of higher white matter hyperintensity volume by quartiles of retinal thickness in different subfields.
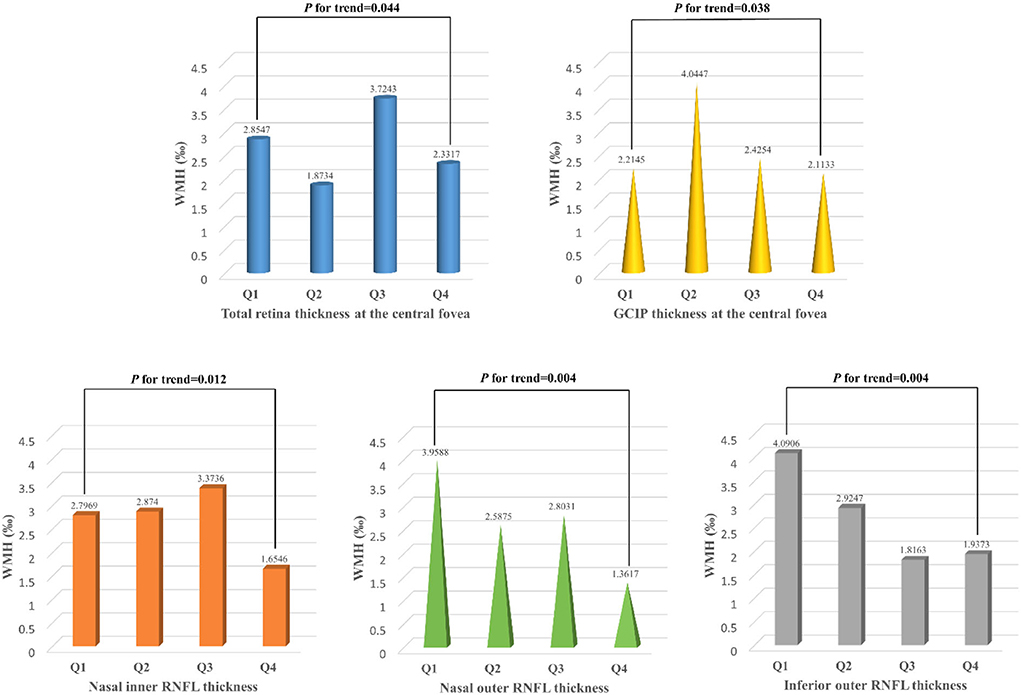
Figure 4. White matter hyperintensity volume of participants with different quartiles of the total retina and GCIP thickness at the central fovea, nasal inner RNFL, nasal outer RNFL, and inferior outer RNFL thickness. WMH, white matter hyperintensity; RNFL, retinal nerve fiber layer; GCIP, ganglion cell and inner plexiform layer. Total retinal thickness (P for trend = 0.044) and GCIP thickness (P for trend = 0.038) at the central fovea were positively associated with the risk of higher WMH volume, while nasal inner RNFL (P for trend = 0.012), nasal outer RNFL (P for trend = 0.004), and inferior outer RNFL (P for trend = 0.004) thickness were negatively associated with the risk of higher WMH volume.
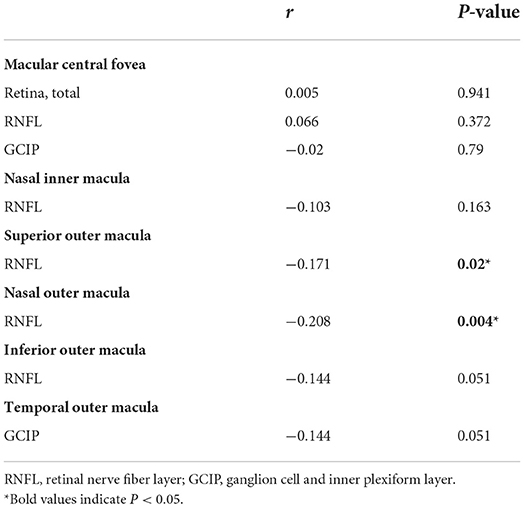
Table 5. Correlation analysis between white matter hyperintensity volume and retinal thickness.
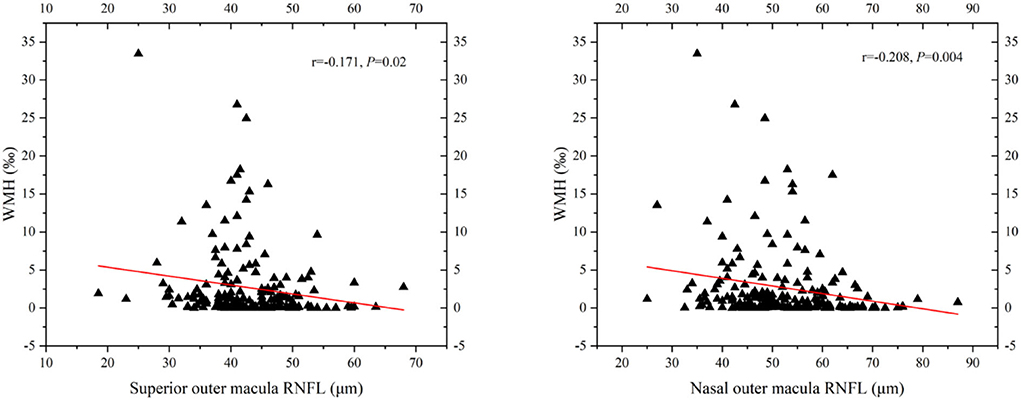
Figure 5. Scatterplot demonstrating the relationship between RNFL thickness and WMH volume (‰). WMH, white matter hyperintensity; RNFL, retinal nerve fiber layer. WMH volume had significant negative correlation with superior outer RNFL thickness (r = −0.171, P = 0.02) and nasal outer RNFL thickness (r = −0.208, P = 0.004).
Association between the retinal thickness in different subfields and the risk of moderate-severe periventricular and deep white matter hyperintensity
We divided the participants into the mild group (Fazekas 0–1) and the moderate-severe group (Fazekas 2–3) according to the PWMH score and DWMH score, respectively. In binary logistic regression, thicker total retina (OR: 1.017; 95% CI: 1.001–1.033; P = 0.039)/ RNFL (OR: 1.089; 95% CI: 1.009–1.175; P = 0.028) at the central fovea and thinner nasal outer RNFL (OR: 0.958; 95% CI: 0.924–0.994; P = 0.024) were associated with an increase in the risk of moderate-severe PWMH, while thinner superior outer RNFL (OR: 0.94; 95% CI: 0.891–0.991; P = 0.023), nasal outer RNFL (OR: 0.935; 95% CI: 0.899–0.973; P = 0.001), inferior outer RNFL (OR: 0.926; 95% CI: 0.881–0.974; P = 0.003), and temporal outer GCIP (OR: 0.921; 95% CI: 0.879–0.966; P = 0.001) were associated with an increase in the risk of moderate-severe DWMH, after adjusting for age, gender, hypertension, CHD, stroke, SBP, and LDL-C (Table 6).
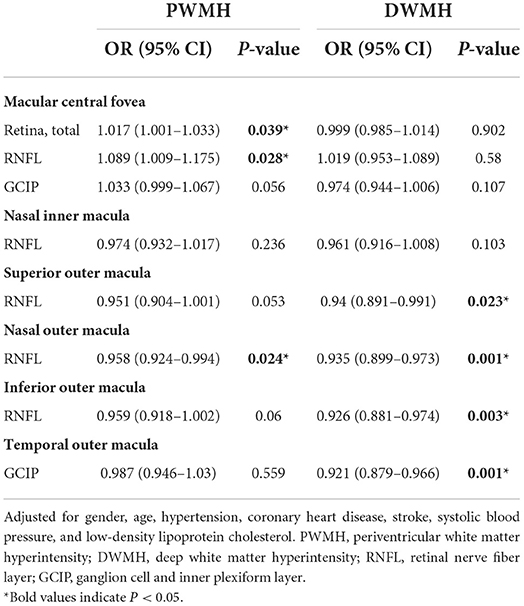
Table 6. Logistic regression analysis of retinal thickness in different subfield-related factors for moderate-severe periventricular and deep white matter hyperintensity.
Discussion
We investigated the relationship between the retinal thickness in different subfields and the WMH volume in this study. We found that the risk of higher WMH volume showed a positive linear trend correlation with total retina and GCIP thickness at the central fovea, and a negative linear trend correlation with nasal inner, nasal outer, and inferior outer RNFL thickness. WMH volume had a significantly negative correlation with superior outer and nasal outer RNFL thickness. In addition, DWMH was more correlated with the thinning of outer RNFL, while PWMH was more correlated with the thickening of the retina at the central fovea. Our results further verified the potential association between the retina and the brain. Retinal thickness measured by OCT may become a non-invasive, affordable, and convenient indicator for WMH.
The association between thinner RNFL and higher WMH volume may be due to the mechanism of chronic ischemia. Researchers showed that vascular risk factors (e.g., diabetes, hypertension, anemia, carotid plaque, dyslipidemia, and inflammatory cytokine level) leading to reduced blood flow, tissue ischemia, and hypoxia could also cause retinal changes and ultimately affect vision, which is similar to the pathological mechanism of WMH (12, 44). OCTA is a novel technique used to image retinal microvascular impairment rapidly and non-invasively. Increasing evidence shows that microvascular density evaluated by OCTA is associated with the degree of WMH, notably the DWMH, which is related to the thinning of RNFL (29, 34). It suggests that microvascular damage occurs in both the retina and brain, results in impaired neurovascular coupling, and eventually leads to nerve fiber lesions (30, 31, 45). Furthermore, retrograde neuroaxonal degeneration is considered to be another possible explanation for the thinning of RNFL (46). However, more and more reports have indicated that retinal neurodegeneration may precede microvascular damage caused by brain-related diseases, and could lead to a secondary decrease in blood flow density (30, 47). Its mechanism is still unclear, and further studies are needed. In summary, RNFL thickness changes are expected to be one of the biological markers to reflect the axonal damage and DWMH caused by vascular factors in the super-early stage.
In this study, WMH volume had a significant negative correlation with superior outer and nasal outer RNFL thickness, rather than in the other quadrants. The precise cause of the area difference in RNFL thickness reduction is unknown at this time. It might be due to the special direction of the nerve fibers in the macula. Nerve fibers in the nasal quadrant arrive at the optic disk directly. Nerve fibers in the temporal quadrant are bounded by horizontal meridians, which, respectively, curve around the macular fovea and reach the optic disk (10). Among healthy individuals, the retinal thickness in the nasal quadrant is the thickest and the temporal quadrant is the thinnest (48). There are more nerve fibers in the nasal quadrant, whose demand for oxygen and nutrients is larger. As a result, nerve fibers in the nasal quadrant are more prone to ischemia and hypoxia than in the temporal quadrant. Similarly, previous studies showed that DWMH was more related to ischemic factors (6). On the contrary, in the temporal quadrant, axons are not arranged with such a high density. They usually run among ganglion cells, not constituting an independent layer. The thin hyperreflective band observed in the temporal quadrant may not truly reflect the thickness of RNFL (9). This may explain the significant reduction of GCIP, rather than RNFL, found in the temporal outer macula in the higher WMH group.
Our research presented that the thickening of the total retina and GCIP at the central fovea significantly increased the risk of higher WMH volume. We suspect that this is associated with neural inflammation. Multiple studies have shown that the levels of inflammatory factors were positively correlated with retina thickness at the central fovea (49–51). Cytokines could damage the connexins between endothelial cells, increase the permeability of vessels, and induce leukocyte aggregation. It would break the blood–retinal barrier (52, 53). Proteins, liquids, and other substances accumulate in the retina, resulting in its thickening. Cytokines activate microglia and astrocytes, further promoting inflammatory response and leading to neuronal dysfunction and apoptosis (54, 55). This process is similar to the mechanism of PWMH. In addition, several studies showed that inflammatory response mainly affected the thickness of macular fovea, which might be due to Müller cells. Müller cells are responsible for the functional and metabolic support of their associated neurons and provide neurons with trophic substances and metabolic waste removal (55). In the macular fovea area, Müller cell density is five times higher when compared to the periphery. Müller cells are highly elongated in this area and follow a “Z-shape” trajectory to extend around (53). Their prolongations are closely bound to neuronal axons by junction proteins, as a “molecular filter” to prevent macromolecules from aggregating in the retina (56). When junction proteins are broken, proteins and other substances would leak into the retina (55). Furthermore, abnormal aquaporin (AQP) in Müller cells also affects local retinal thickness. AQP-4 is highly expressed in the glial cells of the brain. It constitutes a “glymphatic pathway” for the waste clearance of the brain (45). Similarly, AQP-4 expressed along macular Müller cells also constitutes a “glymphatic pathway” to transport proteins to the retina (57). The disorder of AQP-4 in Müller cells contributes to the drainage dysfunction in the macular area and the swelling of cells. Differently, studies have found that there was a defect in the blood–retinal barrier at the optic disk allowing the unobstructed drainage of proteins to prevent inflammatory edema (58). Interestingly, PWMH is also closely related to inflammatory factors and is more edematous compared to DWMH (7). In conclusion, changes in macular fovea thickness may offer a new view in understanding the pathology of WMH caused by inflammatory factors.
Another possible explanation for the relationship between the thickening of the central fovea and higher WMH volume might be the deposition of amyloid-β (Aβ). Studies found that Aβ deposits may occur in the retina, even before the deposits in the brain (59). Bernardes et al. reported that the mice harboring three human mutant genes of AD showed a thicker RNFL + GCL until 4 months old (48). Aβ deposits may contribute to the inflammatory processes, neuronal degeneration, and aging in the retina and finally change retinal thickness (60, 61).
Similar observations have documented that the thinning of RNFL was related to the degree of WMH (30, 33, 34, 62). However, a prospective study unexpectedly showed that WMH aggravation was not related to the decrease in RNFL thickness (63). As for GCIP, the study of Qu et al. presented reduced GCIP in the hypertensive WMH group, which was inconsistent with our results (33). We speculate that this difference may be due to different retinal zoning methods, short follow-up, and limited sample capacity. Unlike these studies, we skillfully divided the macular retina into nine subfields, considering the different cell distributions in different retinal regions. Moreover, we measured the volume of WMH for a more scientific and rigorous reflection of the WMH state.
Retinal thickness changes are in many cases compensatory among subfields and sublayers. It is closely related to the measuring method. A previous study found that geometrically predetermined regions (e.g., concentric rings or ETDRS grids) might cause thickening and thinning within the same region to cancel each other out and lead to the clinically relevant differences being masked. In contrast, the color-coded quantitative maps could allow point-to-point comparisons between groups and provide more precise regions of change (59). Moreover, at the same point, the thickness of a certain layer would also affect the thickness of adjacent layers (59). The thickening of GCIP in this study cannot be excluded as the result of thinning of other contiguous layers. Therefore, quantitative maps of the whole retinal layers should be used to reflect the retinal changes in WMH individuals with greater accuracy.
There are several limitations to our study. First, retrospective studies can just investigate the associations. Prospective studies are necessary to demonstrate our results. Second, the sample capacity of this study is restricted. The hypothesis must be validated in a large study. Third, we did not measure the thickness of other retinal sublayers separately and RNFL in the peripapillary area, so we cannot explore their relationship with WMH and the compensatory among sublayers. Complementary studies where each retinal layer is studied separately, as well as the RNFL in the peripapillary area, are needed. Furthermore, PWMH and DWMH have different mechanisms, but the LST toolbox cannot distinguish between them. More sophisticated software is needed to measure WMH volume in different regions. Furthermore, we did not measure the thickness of the outer retinal sublayers separately, so we cannot explore the relationship between outer retinal sublayers and WMH. Further large prospective studies with more exact instruments to prove the longitudinal association between all retinal sublayers thickness and WMH are required to solve these problems.
Conclusion
In conclusion, we found that the increase in the risk of higher WMH volume was associated with the thickening of total retina and GCIP at the central fovea, and the thinning of nasal inner, nasal outer, and inferior outer RNFL. WMH volume had a significant negative correlation with superior outer and nasal outer RNFL thickness. DWMH was more correlated with the thinning of outer RNFL, while PWMH was more correlated with the thickening of the retina at the central fovea. This study provides new evidence for the potential retina–brain association. OCT, as a non-invasive, reproducible, affordable, and convenient technique, may prove to be a biological marker for the early detection and longitudinal monitoring of WMH. Additionally, dynamic observation of retinal thickness changes could also be used to studies on the mechanism of some brain-related diseases. To fully elucidate the relationship between retinal thickness and WMH, further longitudinal and randomized studies with larger sample capacity are needed.
Data availability statement
The raw data supporting the conclusions of this article will be made available by the authors, without undue reservation.
Ethics statement
The studies involving human participants were reviewed and approved by Ethical Committee of Hebei General Hospital (approval number 2022105). Written informed consent for participation was not required for this study in accordance with the national legislation and the institutional requirements. Written informed consent was not obtained from the individual(s) for the publication of any potentially identifiable images or data included in this article.
Author contributions
PL proposed the conception of the study and revised the manuscript. XL performed the data acquisition and wrote the manuscript. ZT contributed to the analysis and interpretation of data. ZJ, YD, and JX offered clinical suggestions and performed the data validation. All authors contributed to the article and approved the submitted version.
Acknowledgments
We thank the professionals who participated in this study. We thank the Hebei Provincial High-end Talent Funding Project (6833452 and 83587216), the Clinical Medicine Excellent Talents Training Project of Hebei Province (2019-139-5), the Science and Technology Innovative Research Team of Hebei Province Funding Project (2020-9 5-2), and the Hebei Province Introducing Intelligence Project (2020-19-2) for grant support.
Conflict of interest
The authors declare that the research was conducted in the absence of any commercial or financial relationships that could be construed as a potential conflict of interest.
Publisher's note
All claims expressed in this article are solely those of the authors and do not necessarily represent those of their affiliated organizations, or those of the publisher, the editors and the reviewers. Any product that may be evaluated in this article, or claim that may be made by its manufacturer, is not guaranteed or endorsed by the publisher.
References
1. Umemura T, Kawamura T, Umegaki H, Mashita S, Kanai A, Sakakibara T, et al. Endothelial and inflammatory markers in relation to progression of ischaemic cerebral small-vessel disease and cognitive impairment: a 6-year longitudinal study in patients with type 2 diabetes mellitus. J Neurol Neurosur Psychiatry. (2011) 82:1186–94. doi: 10.1136/jnnp.2010.217380
2. Nan D, Cheng Y, Feng L, Zhao M, Ma D, Feng J. Potential mechanism of venous system for leukoaraiosis: from post-mortem to in vivo research. Neurodegener Dis. (2019) 19:101–8. doi: 10.1159/000505157
3. Lin L, Zhang Y, Zeng Q, Lin L, Geng X, Wang S. Atherosclerosis, inflammatory factor changes, cognitive disorder and vascular endothelial functions in patients with different grades of leukoaraiosis. Clin Hemorheol Microcirc. (2019) 73:591–7. doi: 10.3233/CH-190597
4. Kerkhofs D, Wong SM, Zhang E, Staals J, Jansen JFA, van Oostenbrugge RJ, et al. Baseline blood-brain barrier leakage and longitudinal microstructural tissue damage in the periphery of white matter hyperintensities. Neurology. (2021) 96:2192–200. doi: 10.1212/WNL.0000000000011783
5. Young VG, Halliday GM, Kril JJ. Neuropathologic correlates of white matter hyperintensities. Neurology. (2008) 71:804–11. doi: 10.1212/01.wnl.0000319691.50117.54
6. Ni L, Zhou F, Qing Z, Zhang X, Li M, Zhu B, et al. The asymmetry of white matter hyperintensity burden between hemispheres is associated with intracranial atherosclerotic plaque enhancement grade. Front Aging Neurosci. (2020) 12–22:163. doi: 10.3389/fnagi.2020.00163
7. Iordanishvili E, Schall M, Loucao R, Zimmermann M, Kotetishvili K, Shah NJ, et al. Quantitative MRI of cerebral white matter hyperintensities: a new approach towards understanding the underlying pathology. Neuroimage. (2019) 202:116077–88. doi: 10.1016/j.neuroimage.2019.116077
8. Hu HY, Ou YN, Shen XN, Qu Y, Ma YH, Wang ZT, et al. White matter hyperintensities and risks of cognitive impairment and dementia: a systematic review and meta-analysis of 36 prospective studies. Neurosci Biobehav Rev. (2021) 120:16–27. doi: 10.1016/j.neubiorev.2020.11.007
9. Cuenca N, Ortuno-Lizaran I, Sanchez-Saez X, Kutsyr O, Albertos-Arranz H, Fernandez-Sanchez L, et al. Interpretation of OCT and OCTA images from a histological approach: clinical and experimental implications. Prog Retin Eye Res. (2020) 77:100828. doi: 10.1016/j.preteyeres.2019.100828
10. Zhao Y, Zhao J, Gu Y, Chen B, Guo J, Xie J, et al. Outer retinal layer thickness changes in white matter hyperintensity and parkinson's disease. Front Neurosci. (2021) 15:1–9. doi: 10.3389/fnins.2021.741651
11. van Velthoven ME, Faber DJ, Verbraak FD, van Leeuwen TG, de Smet MD. Recent developments in optical coherence tomography for imaging the retina. Prog Retin Eye Res. (2007) 26:57–77. doi: 10.1016/j.preteyeres.2006.10.002
12. Iyigundogdu I, Derle E, Asena L, Kural F, Kibaroglu S, Ocal R, et al. Relationship between white matter hyperintensities and retinal nerve fiber layer, choroid, and ganglion cell layer thickness in migraine patients. Cephalalgia. (2018) 38:332–9. doi: 10.1177/0333102417694882
13. Cunha-Vaz J, Bernardes R, Lobo C. Blood-retinal barrier. Eur J Ophthalmol. (2011) 21(Suppl.6):S3–9. doi: 10.5301/EJO.2010.6049
14. Galmiche C, Moal B, Marnat G, Sagnier S, Schweitzer C, Dousset V, et al. Delayed gadolinium leakage in ocular structures: a potential marker for age- and vascular risk factor-related small vessel disease? Invest Radiol. (2021) 56:425–32. doi: 10.1097/RLI.0000000000000757
15. Lopez-Cuenca I, de Hoz R, Salobrar-Garcia E, Elvira-Hurtado L, Rojas P, Fernandez-Albarral JA, et al. Macular thickness decrease in asymptomatic subjects at high genetic risk of developing Alzheimer's disease: an OCT study. J Clin Med. (2020) 9:1–13. doi: 10.3390/jcm9061728
16. Ratchford JN, Saidha S, Sotirchos ES, Oh JA, Seigo MA, Eckstein C, et al. Active MS is associated with accelerated retinal ganglion cell/inner plexiform layer thinning. Neurology. (2013) 80:47–54. doi: 10.1212/WNL.0b013e31827b1a1c
17. Chrysou A, Jansonius NM, van Laar T. Retinal layers in Parkinson's disease: a meta-analysis of spectral-domain optical coherence tomography studies. Parkinsonism Relat Disord. (2019) 64:40–9. doi: 10.1016/j.parkreldis.2019.04.023
18. Oertel FC, Specovius S, Zimmermann HG, Chien C, Motamedi S, Bereuter C, et al. Retinal optical coherence tomography in neuromyelitis optica. Neurol Neuroimmunol Neuroinflamm. (2021) 8:1–13. doi: 10.1212/NXI.0000000000001068
19. Shi Z, Cao X, Hu J, Jiang L, Mei X, Zheng H, et al. Retinal nerve fiber layer thickness is associated with hippocampus and lingual gyrus volumes in nondemented older adults. Prog Neuropsychopharmacol Biol Psychiatry. (2020) 99:109824. doi: 10.1016/j.pnpbp.2019.109824
20. Santos CY, Johnson LN, Sinoff SE, Festa EK, Heindel WC, Snyder PJ. Change in retinal structural anatomy during the preclinical stage of Alzheimer's disease. Alzheimers Dement. (2018) 10:196–209. doi: 10.1016/j.dadm.2018.01.003
21. Beach TG, Kuo YM, Spiegel K, Emmerling MR, Sue LI, Kokjohn K, et al. The cholinergic deficit coincides with Aß deposition at the earliest histopathologic stages of Alzheimer disease. J Neuropathol Exp Neurol. (2000) 59:308–13. doi: 10.1093/jnen/59.4.308
22. Potter PE, Rauschkolb PK, Pandya Y, Sue LI, Sabbagh MN, Walker DG, et al. Pre- and post-synaptic cortical cholinergic deficits are proportional to amyloid plaque presence and density at preclinical stages of Alzheimer's disease. Acta Neuropathol. (2011) 122:49–60. doi: 10.1007/s00401-011-0831-1
23. Cunha LP, Lopes LC, Costa-Cunha LV, Costa CF, Pires LA, Almeida AL, et al. Macular thickness measurements with frequency domain-OCT for quantification of retinal neural loss and its correlation with cognitive impairment in Alzheimer's disease. PLoS ONE. (2016) 11:e0153830. doi: 10.1371/journal.pone.0153830
24. Nunes A, Silva G, Duque C, Januario C, Santana I, Ambrosio AF, et al. Retinal texture biomarkers may help to discriminate between Alzheimer's, Parkinson's, and healthy controls. PLoS ONE. (2019) 14:e0218826. doi: 10.1371/journal.pone.0218826
25. Ikram MK, De Jong FJ, Van Dijk EJ, Prins ND, Hofman A, Breteler MM, et al. Retinal vessel diameters and cerebral small vessel disease: the Rotterdam Scan Study. Brain. (2006) 129:182–8. doi: 10.1093/brain/awh688
26. Dumitrascu OM, Demaerschalk BM, Valencia Sanchez C, Almader-Douglas D, O'Carroll CB, Aguilar MI, et al. Retinal microvascular abnormalities as surrogate markers of cerebrovascular ischemic disease: a meta-analysis. J Stroke Cerebrovasc Dis. (2018) 27:1960–8. doi: 10.1016/j.jstrokecerebrovasdis.2018.02.041
27. Hanff TC, Sharrett AR, Mosley TH, Shibata D, Knopman DS, Klein R, et al. Retinal microvascular abnormalities predict progression of brain microvascular disease: an atherosclerosis risk in communities magnetic resonance imaging study. Stroke. (2014) 45:1012–7. doi: 10.1161/STROKEAHA.113.004166
28. McGrory S, Ballerini L, Doubal FN, Staals J, Allerhand M, Valdes-Hernandez MDC, et al. Retinal microvasculature and cerebral small vessel disease in the Lothian Birth Cohort 1936 and Mild Stroke Study. Sci Rep. (2019) 9:6320–31. doi: 10.1038/s41598-019-42534-x
29. Fu W, Zhou X, Wang M, Li P, Hou J, Gao P, et al. Fundus changes evaluated by OCTA in patients with cerebral small vessel disease and their correlations: a cross-sectional study. Front Neurol. (2022) 13:843198. doi: 10.3389/fneur.2022.843198
30. Peng C, Kwapong WR, Xu S, Muse FM, Yan J, Qu M, et al. Structural and microvascular changes in the macular are associated with severity of white matter lesions. Front Neurol. (2020) 11:521–9. doi: 10.3389/fneur.2020.00521
31. Gao Y, Kwapong WR, Zhang Y, Yan Y, Jin X, Tao Y, et al. Retinal microvascular changes in white matter hyperintensities investigated by swept source optical coherence tomography angiography. BMC Ophthalmol. (2022) 22:77–84. doi: 10.1186/s12886-021-02143-7
32. Mutlu U, Bonnemaijer PWM, Ikram MA, Colijn JM, Cremers LGM, Buitendijk GHS, et al. Retinal neurodegeneration and brain MRI markers: the Rotterdam Study. Neurobiol Aging. (2017) 60:183–91. doi: 10.1016/j.neurobiolaging.2017.09.003
33. Qu M, Kwapong WR, Peng C, Cao Y, Lu F, Shen M, et al. Retinal sublayer defect is independently associated with the severity of hypertensive white matter hyperintensity. Brain Behav. (2020) 10:1–9. doi: 10.1002/brb3.1521
34. Zhou X, Li T, Qu W, Pan D, Qiu Q, Wu L, et al. Abnormalities of retinal structure and microvasculature are associated with cerebral white matter hyperintensities. Eur J Neurol. (2022) 29:2289–98. doi: 10.1111/ene.15378
35. Alves C, Batista S, d'Almeida OC, Sousa L, Cunha L, Bernardes R, et al. The retinal ganglion cell layer predicts normal-appearing white matter tract integrity in multiple sclerosis: a combined diffusion tensor imaging and optical coherence tomography approach. Hum Brain Mapp. (2018) 39:1712–20. doi: 10.1002/hbm.23946
36. Li H, Han D, Wang H, Shu D, Xu L, Hou L, et al. The relationship between vitamin D and activity of daily living in the elderly. Int J Gen Med. (2022) 15:6357–64. doi: 10.2147/IJGM.S366203
37. Wardlaw JM, Smith EE, Biessels GJ, Cordonnier C, Fazekas F, Frayne R, et al. Neuroimaging standards for research into small vessel disease and its contribution to ageing and neurodegeneration. Lancet Neurol. (2013) 12:822–38. doi: 10.1016/S1474-4422(13)70124-8
38. Griffanti L, Jenkinson M, Suri S, Zsoldos E, Mahmood A, Filippini N, et al. Classification and characterization of periventricular and deep white matter hyperintensities on MRI: a study in older adults. Neuroimage. (2018) 170:174–81. doi: 10.1016/j.neuroimage.2017.03.024
39. Ashburner J, Friston KJ. Voxel-based morphometry–the methods. Neuroimage. (2000) 11:805–21. doi: 10.1006/nimg.2000.0582
40. Ashburner J. A fast diffeomorphic image registration algorithm. Neuroimage. (2007) 38:95–113. doi: 10.1016/j.neuroimage.2007.07.007
41. Schmidt P, Gaser C, Arsic M, Buck D, Forschler A, Berthele A, et al. An automated tool for detection of FLAIR-hyperintense white-matter lesions in Multiple Sclerosis. Neuroimage. (2012) 59:3774–83. doi: 10.1016/j.neuroimage.2011.11.032
42. Ryden L, Sacuiu S, Wetterberg H, Najar J, Guo X, Kern S, et al. Atrial fibrillation, stroke, and silent cerebrovascular disease: a population-based MRI study. Neurology. (2021) 97:e1608–19. doi: 10.1212/WNL.0000000000012675
43. Tewarie P, Balk L, Costello F, Green A, Martin R, Schippling S, et al. The OSCAR-IB consensus criteria for retinal OCT quality assessment. PLoS ONE. (2012) 7:e34823. doi: 10.1371/journal.pone.0034823
44. Ikram M, de Jong F, Vingerling J, de Jong P. Are retinal arteriolar or venular diameters associated with markers for cardiovascular disorders? the Rotterdam Study. Invest Ophthalmol Vis Sci. (2004) 45:2129–34. doi: 10.1167/iovs.03-1390
45. Nakada T, Kwee IL, Igarashi H, Suzuki Y. Aquaporin-4 functionality and virchow-robin space water dynamics: physiological model for neurovascular coupling and glymphatic flow. Int J Mol Sci. (2017) 18:1–14. doi: 10.3390/ijms18081798
46. Gabilondo I, Martinez-Lapiscina EH, Martinez-Heras E, Fraga-Pumar E, Llufriu S, Ortiz S, et al. Trans-synaptic axonal degeneration in the visual pathway in multiple sclerosis. Ann Neurol. (2014) 75:98–107. doi: 10.1002/ana.24030
47. Chhablani J, Sharma A, Goud A, Peguda HK, Rao HL, Begum VU, et al. Neurodegeneration in type 2 diabetes: evidence from spectral-domain optical coherence tomography. Invest Ophthalmol Vis Sci. (2015) 56:6333–8. doi: 10.1167/iovs.15-17334
48. Ferreira H, Martins J, Moreira PI, Ambrosio AF, Castelo-Branco M, Serranho P, et al. Longitudinal normative OCT retinal thickness data for wild-type mice, and characterization of changes in the 3xTg-AD mice model of Alzheimer's disease. Agin. (2021) 13:9433–54. doi: 10.18632/aging.202916
49. Noma H, Mimura T, Shimada K. Role of inflammation in previously untreated macular edema with branch retinal vein occlusion. BMC Ophthalmol. (2014) 14:67–75. doi: 10.1186/1471-2415-14-67
50. Kim M, Kim Y, Lee SJ. Comparison of aqueous concentrations of angiogenic and in fl ammatory cytokines based on optical coherence tomography patterns of diabetic macular edema. Indian J Ophthalmol. (2015) 63:312–7. doi: 10.4103/0301-4738.158069
51. Noma H, Mimura T, Tatsugawa M, Shimada K. Aqueous flare and inflammatory factors in macular edema with central retinal vein occlusion: a case series. BMC Ophthalmol. (2013) 13:78–83. doi: 10.1186/1471-2415-13-78
52. Omri S, Behar-Cohen F, Rothschild PR, Gelize E, Jonet L, Jeanny JC, et al. PKCzeta mediates breakdown of outer blood-retinal barriers in diabetic retinopathy. PLoS ONE. (2013) 8:e81600. doi: 10.1371/journal.pone.0081600
53. Daruich A, Matet A, Moulin A, Kowalczuk L, Nicolas M, Sellam A, et al. Mechanisms of macular edema: beyond the surface. Prog Retin Eye Res. (2018) 63:20–68. doi: 10.1016/j.preteyeres.2017.10.006
54. Grigsby JG, Cardona SM, Pouw CE, Muniz A, Mendiola AS, Tsin AT, et al. The role of microglia in diabetic retinopathy. J Ophthalmol. (2014) 2014:705783–97. doi: 10.1155/2014/705783
55. Bringmann A, Wiedemann P. Muller glial cells in retinal disease. Ophthalmologica. (2012) 227:1–19. doi: 10.1159/000328979
56. Matet A, Savastano MC, Rispoli M, Bergin C, Moulin A, Crisanti P, et al. En face optical coherence tomography of foveal microstructure in full-thickness macular hole: a model to study perifoveal Muller cells. Am J Ophthalmol. (2015) 159:1142–51. doi: 10.1016/j.ajo.2015.02.013
57. Amann B, Kleinwort KJ, Hirmer S, Sekundo W, Kremmer E, Hauck SM, et al. Expression and distribution pattern of aquaporin 4, 5 and 11 in retinas of 15 different species. Int J Mol Sci. (2016) 17:1145–56. doi: 10.3390/ijms17071145
58. Mathieu E, Gupta N, Ahari A, Zhou X, Hanna J, Yucel YH. Evidence for cerebrospinal fluid entry into the optic nerve via a glymphatic pathway. Invest Ophthalmol Vis Sci. (2017) 58:4784–91. doi: 10.1167/iovs.17-22290
59. Janez-Escalada L, Janez-Garcia L, Salobrar-Garcia E, Santos-Mayo A, de Hoz R, Yubero R, et al. Spatial analysis of thickness changes in ten retinal layers of Alzheimer's disease patients based on optical coherence tomography. Sci Rep. (2019) 9:13000. doi: 10.1038/s41598-019-49353-0
60. Marquié M, Valero S, Castilla-Marti M, Martínez J, Rodríguez-Gómez O, Sanabria Á, et al. Association between retinal thickness and β-amyloid brain accumulation in individuals with subjective cognitive decline: Fundació ACE Healthy Brain Initiative. Alzheimers Res Ther. (2020) 12:37–51. doi: 10.1186/s13195-020-00602-9
61. Guimaraes P, Serranho P, Martins J, Moreira PI, Ambrosio AF, Castelo-Branco M, et al. Retinal aging in 3x Tg-AD mice model of Alzheimer's disease. Front Aging Neurosci. (2022) 14:832195. doi: 10.3389/fnagi.2022.832195
62. Kim M, Park KH, Kwon JW, Jeoung JW, Kim TW, Kim DM. Retinal nerve fiber layer defect and cerebral small vessel disease. Invest Ophthalmol Vis Sci. (2011) 52:6882–6. doi: 10.1167/iovs.11-7276
Keywords: retinal thickness, white matter hyperintensity volume, optical coherence tomography, chronic ischemia, inflammatory response
Citation: Lv X, Teng Z, Jia Z, Dong Y, Xu J and Lv P (2022) Retinal thickness changes in different subfields reflect the volume change of cerebral white matter hyperintensity. Front. Neurol. 13:1014359. doi: 10.3389/fneur.2022.1014359
Received: 08 August 2022; Accepted: 26 September 2022;
Published: 17 October 2022.
Edited by:
Pengfei Zhang, Dalian University of Technology, ChinaReviewed by:
Xinyi Cao, Shanghai Jiao Tong University, ChinaInés López-Cuenca, Universidad Complutense de Madrid, Spain
Joao Miguel Castelhano, University of Coimbra, Portugal
Copyright © 2022 Lv, Teng, Jia, Dong, Xu and Lv. This is an open-access article distributed under the terms of the Creative Commons Attribution License (CC BY). The use, distribution or reproduction in other forums is permitted, provided the original author(s) and the copyright owner(s) are credited and that the original publication in this journal is cited, in accordance with accepted academic practice. No use, distribution or reproduction is permitted which does not comply with these terms.
*Correspondence: Peiyuan Lv, cGVpeXVhbmx1MkAxNjMuY29t