- 1Department of Neurology, The First Affiliated Hospital of Wannan Medical College, Wuhu, China
- 2Department of Neurology, The Second Affiliated Hospital of Fujian Medical University, Quanzhou, China
- 3Department of Neurology, The Affiliated Central Hospital of Shenzhen Longhua District, Guangdong Medical University, Shenzhen, China
- 4Department of Neurology, People's Hospital of Longhua, Shenzhen, China
- 5Department of Neurology, Jinling Hospital, Medical School of Nanjing University, Nanjing, China
- 6Division of Life Sciences and Medicine, Stroke Center and Department of Neurology, The First Affiliated Hospital of USTC, University of Science and Technology of China, Hefei, China
Background: Elevated blood pressure (BP) can cause blood–brain barrier disruption and facilitates brain edema formation. We aimed to investigate the association of BP level after thrombectomy with the development of malignant cerebral edema (MCE) in patients treated with endovascular thrombectomy (EVT).
Methods: Consecutive patients who underwent EVT for an anterior circulation ischemic stroke were enrolled from three comprehensive stroke centers. BP was measured hourly during the first 24 h after thrombectomy. MCE was defined as swelling causing a midline shift on the follow-up imaging within 5 days after EVT. Associations of various BP parameters, including mean BP, maximum BP (BPmax), and BP variability (BPV), with the development of MCE were analyzed.
Results: Of the 498 patients (mean age 66.9 ± 11.7 years, male 58.2%), 97 (19.5%) patients developed MCE. Elevated mean systolic BP (SBP) (OR, 1.035; 95% CI, 1.006–1.065; P = 0.017) was associated with a higher likelihood of MCE. The best SBPmax threshold that predicted the development of MCE was 165 mmHg. Additionally, increases in BPV, as evaluated by SBP standard deviation (OR, 1.061; 95% CI, 1.003–1.123; P = 0.039), were associated with higher likelihood of MCE.
Interpretation: Elevated mean SBP and BPV were associated with a higher likelihood of MCE. Having a SBPmax > 165 mm Hg was the best threshold to discriminate the development of MCE. These results suggest that continuous BP monitoring after EVT could be used as a non-invasive predictor for clinical deterioration due to MCE. Randomized clinical studies are warranted to address BP goal after thrombectomy.
Introduction
Malignant cerebral edema (MCE) is one of the serious clinical events in large-vessel occlusion stroke (LVOS), as it can lead to rapid neurologic deterioration (1). In recent years, endovascular thrombectomy (EVT) has been confirmed to improve functional outcomes for selected patients with LVOS of the anterior circulation (2). However, MCE is still a common phenomenon after thrombectomy (3). Moreover, the presence of MCE indicates a reduced likelihood of good functional outcomes and a higher likelihood of mortality (3, 4). Therefore, it is important to identify factors that can predict MCE in patients who have undergone EVT. A meta-analysis showed that younger age, a higher National Institutes of Health Stroke Scale (NIHSS) score, and large ischemic signs on computed tomography are reliable predictors for MCE (5). Nevertheless, these factors cannot be intervened.
Blood pressure (BP) management following treatment of LVOS patients with EVT is an important scientific question (6). In a recently published meta-analysis, an elevated systolic BP (SBP) level after EVT was associated with poor outcomes in patients with LVOS (7). Moreover, moderate BP control (<160/90 mmHg) seems to be associated with better clinical outcomes and lowers the odds of 3-month mortality (8, 9). Theoretically, elevated BP could cause blood–brain barrier (BBB) disruption and facilitate cerebral edema (CED) formation (10). Moreover, higher BP after reperfusion may exacerbate the reperfusion injury (11). These mechanisms may result in the development of MCE. However, data on the association of BP level after EVT with the development of MCE are relatively scarce.
Therefore, in this study, we investigated the association between mean BP level after thrombectomy and the development of MCE in patients treated with EVT. Moreover, determined the best post-EVT maximum BP (BPmax) threshold that predicts the development of MCE. Finally, we evaluated the effect of BP variability (BPV) on the development of MCE.
Methods
Study Participants
This study was a retrospective analysis of a prospective registry. We enrolled anterior circulation LVOS patients who underwent EVT at three comprehensive stroke centers (Jinling Hospital between January 2014 and December 2018, Yijishan Hospital between July 2015 and December 2019 and the second affiliated Hospital of Fujian Medical University between January 2016 and December 2019). The study was approved by the local ethics committee.
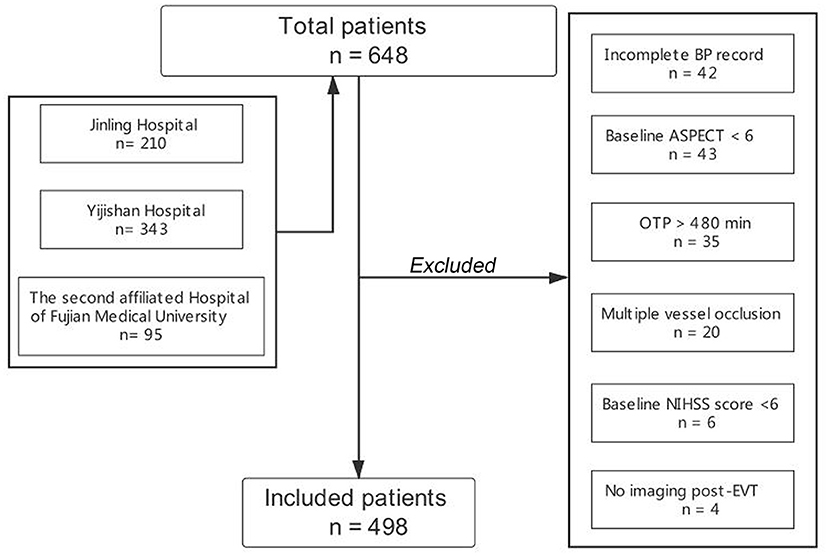
Patients were included if they fulfilled the following inclusion criteria: (1) age ≥ 18 years; (2) onset to puncture time (OTP) ≤ 480 min; (3) admission NIHSS score ≥ 6, admission Alberta Stroke Program Early CT (ASPECT) score ≥ 6, and pre-stroke modified Rankin Scale (mRS) score <2; and (4) patients with LVOS, including the internal carotid artery (ICA), the middle cerebral artery (MCA) or the anterior cerebral artery (ACA) occlusion. We excluded patients with multiple vessel occlusion (MVO), incomplete BP record, and without post-procedural imaging. Additionally, EVT was performed under local anesthesia in all centers. The flow chart of the inclusion of the study population is displayed in Figure 1.
Data Collection
All consecutive patients were prospectively documented. The clinical data included age, sex, medical history of hypertension, diabetes mellitus type 2, admission NIHSS and ASPECT scores, and the Trial of ORG 10172 in Acute Stroke Treatment (TOAST) classification.
BP data were consecutively recorded 24 h after EVT. BP goal was determined by the operator upon the end of thrombectomy or according to institutional protocol. BP was measured by non-invasive BP monitoring devices each hour during the first 24 h after EVT. Mean BP, BPmax, and BPV during the first 24 h were analyzed. BPmax was defined as the highest BP value in 24 h after EVT.
We calculated BPV for both SBP and diastolic BP (DBP) using three statistical methodologies: standard deviation (SD), coefficient of variation (CV), and successive variation (SV). SD was defined as the dispersion of a dataset relative to its mean and is calculated as the square root of the variance by determining the variation between each data point relative to the mean. CV was defined as the ratio of the SD and the mean. SV was calculated as the square root of the average squared difference between two successive BP measurements.
In addition, data on the use of continuous intravenous antihypertensive agents were collected for analysis.
The procedural variables were recorded by the operators, including OTP, onset to reperfusion time (OTR), occlusion location, the first thrombectomy approach (stent retriever first, aspiration first, angioplasty, or stent first), bridging therapy, recanalization status, and collateral status.
Recanalization status was evaluated by the modified Thrombolysis in Cerebral Infarction (mTICI) grading system. Successful recanalization was defined as an mTICI score of 2b or 3. Collateral circulation was assessed according to retrograde contrast opacification of vessels within the occluded area on delayed pre-treatment digital subtraction angiography (DSA) images (12). The collateral grading was classified as follows: Grade 0 was assigned if there was no significant reconstitution in the territory of the occluded vessel or if the collateral flow reached less than one-third of the occluded vessel territory, grade 1 was assigned if the collateral flow reached less than two-thirds and more than one-third of the occluded vessel territory, and grade 2 was assigned if the collateral flow reached more than two-thirds of the occluded vessel territory or the proximal main stem. Good collateral circulation was defined as grade 2, and poor collateral circulation was defined as grade 0–1.
Definition of Malignant Cerebral Edema
For all included patients, the imaging characteristics were assessed by two experienced neurologists/interventionists (ZM Zhou and Q Yang), who were blinded to the clinical data. In the event of discrepancies, the final result was determined by consensus opinion. Referring to previous studies (13), CED subtypes were defined as follows: CED-1 was defined as brain swelling comprising less than one-third of the hemisphere, CED-2 was defined as swelling comprising more than one-third of the hemisphere, and CED-3 was defined as swelling causing midline shift. MCE were defined as CED-3. In these patients, CED was evaluated via the follow-up head computed tomography within 5 days after EVT.
Statistical Analysis
Continuous variables are presented as the mean ± standard deviation (SD) or as the median (interquartile range, IQR). Categorical variables are presented as percentages. Continuous variables were analyzed using the Mann-Whitney U test. Categorical variables were analyzed using the chi-square test or Fisher's exact test as appropriate. The threshold of SBPmax that best discriminated the development of MCE was determined by the area under the receiver operating characteristic curve (ROC) and Youden index. Multivariate logistic regression models were computed for the prediction of odds of MCE. The variables with P < 0.1 from the univariate analysis were entered into the logistic regression. Regression coefficients and odds ratios (OR) with two-sided 95% confidence intervals (CIs) for each of the variables included in the model were finally calculated. Repeated BP measurements were analyzed using the generalized estimating equation (GEE) method. All statistical analyses were computed using SPSS 25 (IBM Corp., Armonk, NY, USA).
Results
During the study period, 648 anterior circulation LVOS patients who underwent EVT were registered in the three centers. A total of 498 patients were enrolled in the final cohort for analysis after excluding 150 patients due to incomplete BP record (n = 42), admission ASPECT score <6 (n = 43), no imaging after EVT (n = 4), OTP > 480 min (n = 35), patients with MVO (n = 20), and admission NIHSS score <6 (n = 6).
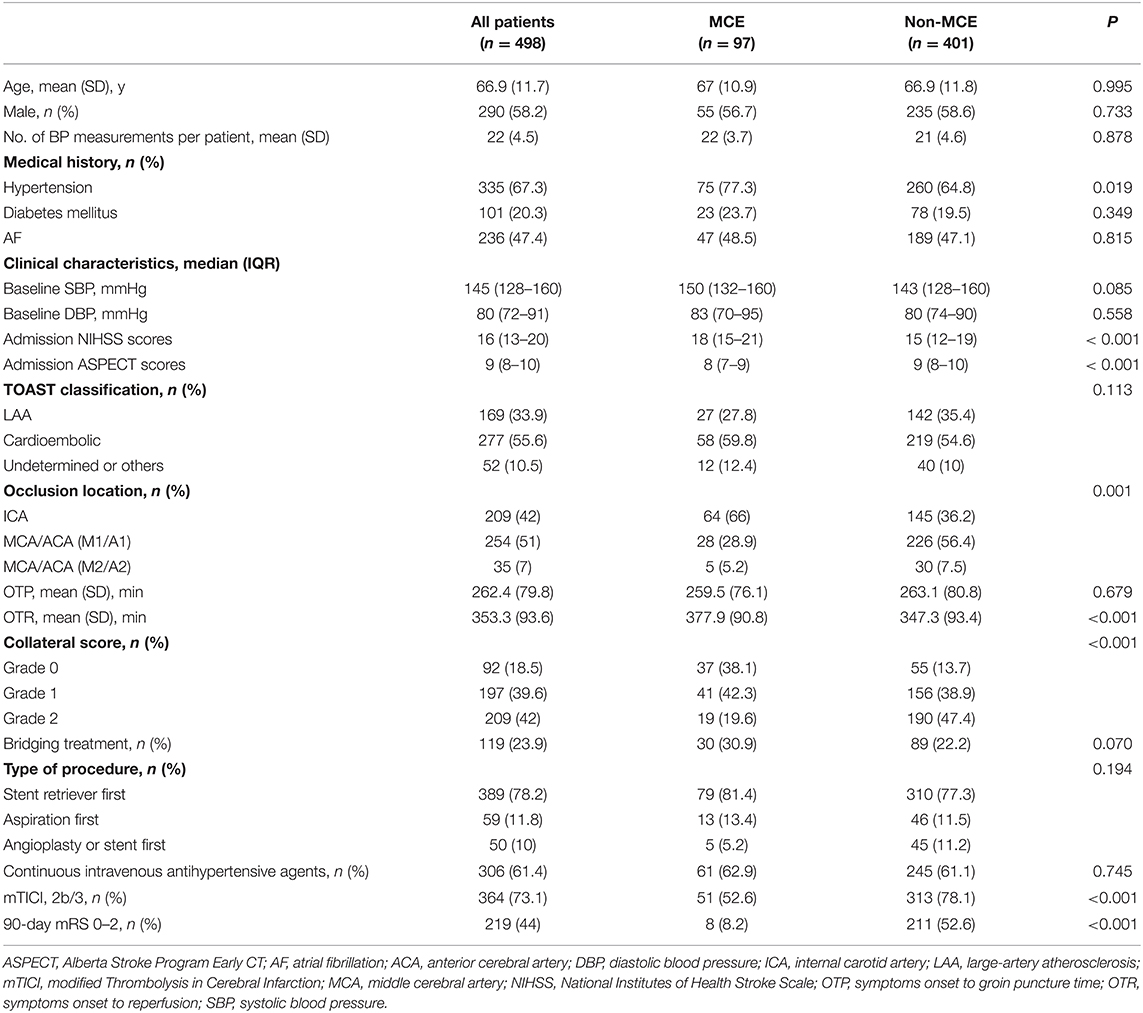
Of 498 patients, the mean age was 66.9 ± 11.7 years and 290 (58.2%) were male. The median NIHSS and ASPECT scores on admission were 16 (IQR13-20) and 9 (IQR8-10), respectively. The mean OTP time was 262.4 ±79.8 min, and the mean OTR time was 353.3± 93.6 min. Among the included patients, 219 (44%) had 3-month mRS 0–2. The baseline characteristics of the patients are shown in Table 1.
Serial BP Measurements and MCE
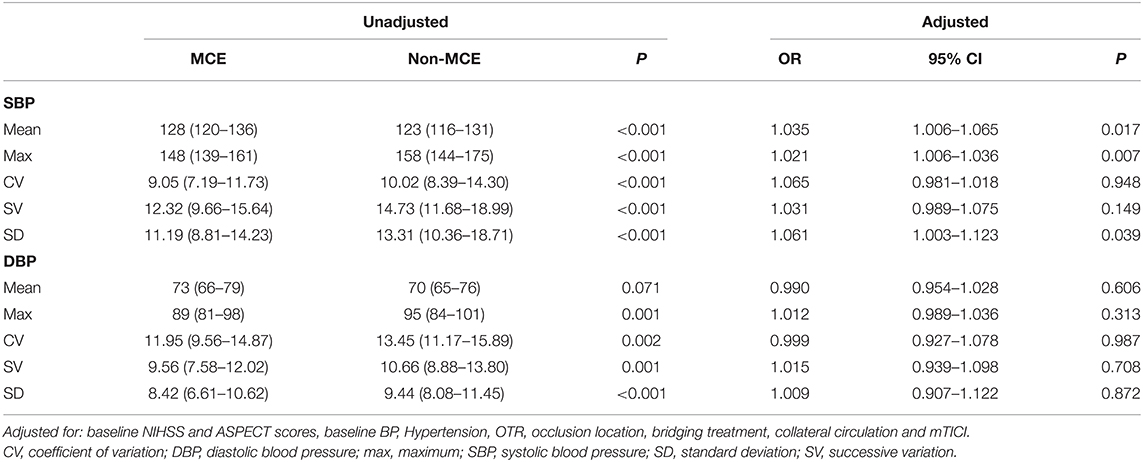
Among the enrolled patients, 97 (19.5%) patients developed MCE. We did not find differences in baseline BP between the patients with MCE and without MCE. However, patients with MCE had significantly higher mean SBP (128 mmHg vs. 123 mmHg, P < 0.001) after EVT than those without MCE. Moreover, in the multivariate logistic regression models, increases in mean SBP (OR, 1.035; 95% CI, 1.006–1.065; P = 0.017) were associated with a higher likelihood of MCE.
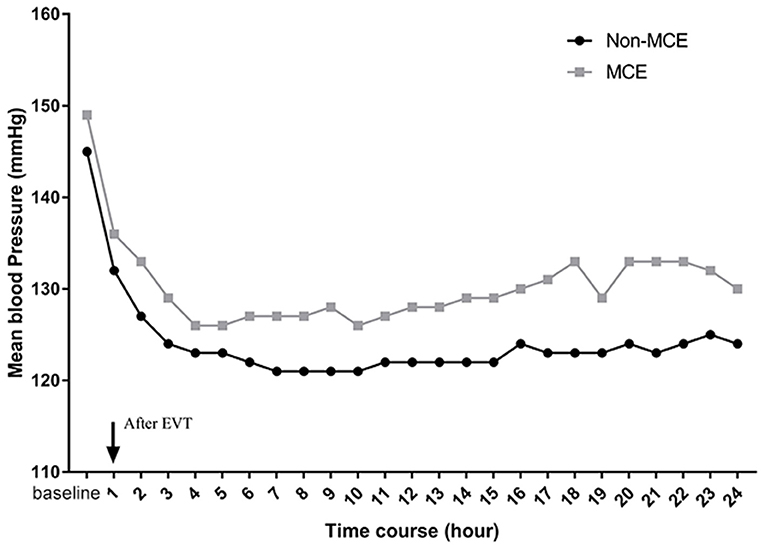
Additionally, a significant association was observed between BP serial measurements after thrombectomy and MCE (Figure 2). In patients with MCE, SBP throughout the 24 h post-EVT was higher than that in patients without MCE (P = 0.036 by the GEE method for MCE).
The Optimal Threshold of MCE-Predicting BPmax Value
After adjusting the admission NIHSS and ASPECT scores, the history of hypertension, baseline BP, OTR, occlusion location, bridging treatment, collateral circulation and mTICI, higher BPmax (OR, 1.021; 95% CI, 1.006–1.036; P = 0.007) were associated with a higher risk of developing MCE. The ROC-derived optimal cut-off value with Youden's index for predicting MCE was 165 mm Hg (41.2% sensitivity, 95% CI, 31.5–51.7%, 81.8% specificity, 95% CI, 77.6–85.4%; area under the curve 0.615; 95% CI, 0.549–0.681, P < 0.001). Binary logistic regression analysis showed that patients with SBPmax >165 mm Hg (OR, 2.729; 95% CI, 1.526–4.880; P = 0.001) was also associated with a higher likelihood of MCE. The distribution of CED in patients with SBPmax of ≤ 165 mm Hg and >165 mm Hg is shown in Figure 3.
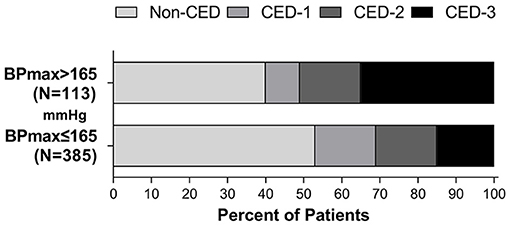
Figure 3. Distribution of CED in patients with a SBPmax of ≤ 165 mm Hg and >165 mmHg during the first 24 h after EVT.
In subgroup analyses, no heterogeneity in the effect of SBPmax >165 mm Hg on the development of MCE was observed according to subgroups of patients based on history of hypertension, collateral status, continuous intravenous antihypertensive agents, bridge therapy, occlusion site and recanalization status after correction for multiplicity (Figure 4). However, the adjusted ORs were not significant for patients with successful recanalization (OR, 1.991; 95% CI, 0.970–4.086; P = 0.061), those without history of hypertension (OR, 1.861; 95% CI, 0.370–9.356; P = 0.451), those with ICA occlusion (OR, 1.920; 95% CI, 0.845–4.365; P = 0.119) and in those without intravenous antihypertensive agent (OR, 2.097; 95% CI, 0.557–7.892; P = 0.274).
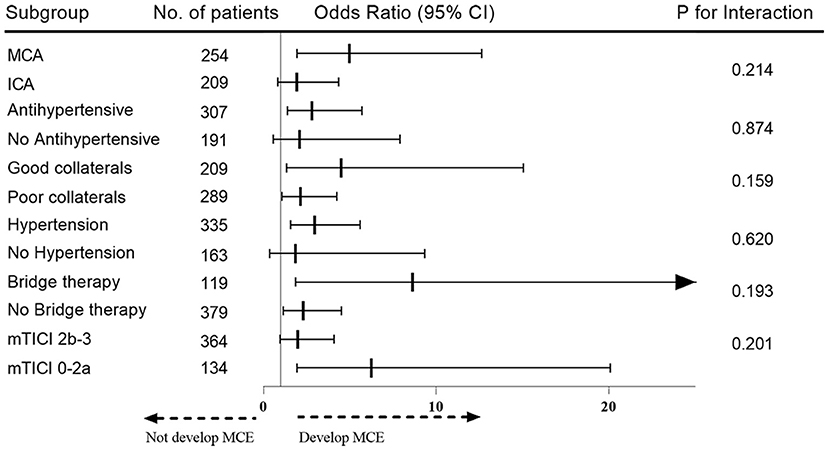
Figure 4. Subgroup analysis for heterogeneity of effect of SBPmax >165 mmHg on the development of MCE. The odds of developing MCE for each subgroup is depicted with a square and a line, representing a 95% CI on the forest plot on the right.
Blood Pressure Variability and MCE
We further evaluated the effect of BPV on the development of MCE. In the multivariate logistic regression models, increases in SBPSD (OR, 1.061; 95% CI, 1.003–1.123; P = 0.039) were associated with higher likelihood of MCE. There was no association for SBPCV, SBPSV, or any DBP parameters with the outcome parameters in the multivariate logistic models. Associations of BP parameters with MCE are shown in Table 2.
Discussion
In this multicenter observational study, the main findings were as follows: First, patients with a higher mean SBP during the first 24 h after EVT were more likely to develop MCE. Moreover, the serial SBP measurements demonstrated that patients with MCE had significantly higher SBP values than those without MCE. Second, the best SBPmax threshold that predicted the development of MCE was 165 mmHg. Furthermore, subgroup analyses also revealed similar direction and size for the effect of post-EVT SBPmax >165 mm Hg on the development of MCE. Third, BPV, as evaluated by SBPSD, was associated with the development of MCE in EVT-treated patients.
MCE is the leading cause of neurologic deterioration or death within the first days after ischemic stroke (1). Our previous study revealed that MCE is a common clinical condition in patients who underwent EVT and significantly impacts on clinical outcomes (4). Similar to the previous study, we found that MCE after EVT was not uncommon (19.5%).
BP management following EVT in LVOS patients is increasingly being taken seriously (6). Furthermore, BP is a readily modifiable parameter with the potential to improve outcomes. Recent studies have shown that elevated SBP level and variability after EVT are associated with poor outcomes among patients with LVOS (14, 15). Moreover, lowering of BP within the first 24 h after EVT may have a positive impact on clinical outcomes in treated patients (16). However, studies examining the association of BP parameters after procedure with MCE are largely lacking.
In the present study, we found that LVOS patients with a higher mean SBP during the first 24 h after EVT were more likely to develop MCE. This result is in accordance with previous studies (10, 17). Vemmos et al. reported that elevated SBP values in the acute period are associated with subsequent brain edema formation in ischemic and hemorrhagic stroke patients (10). Additionally, Serena et al. found that in patients with large MCA infarction, an increased risk of fatal brain edema is associated with history of hypertension (17). However, the pathophysiological mechanisms of higher BP leading to MCE are not fully understood.
A possible explanation of our findings is that elevated SBP during the first 24 h after EVT causes BBB disruption and facilitates brain edema formation (1). MCE is initially cytotoxic characterized by intracellular water accumulation and later vasogenic, in which water moves across the BBB into the extracellular interstitial space (18). An early experimental study indicated that elevated BP may facilitate edema formation by increasing BBB permeability (19). Additionally, the reperfusion injury may play an important role in the development of MCE after EVT (20–22). Yang and Betz found that BBB disruption was exacerbated after reperfusion and vasogenic edema was associated with increased the BBB disruption after reperfusion in a rodent model (21). Finally, in the setting of ischemic stroke, elevated BP could promote a deleterious proinflammatory state (11), which may result in the development of brain edema. However, the mechanism needs further study.
Another interesting finding of this study was the pattern of SBP trends in the 24 h post-EVT. After EVT, there was a decline in SBP. The results were similar to those of recent studies. For example, Cho et al. found that SBP decreased steeply during the first 5–7 h after EVT and then achieved a plateau for 24 h (23). A multicenter prospective cohort study (Blood Pressure after Endovascular Therapy for Ischemic Stroke, BEST) also demonstrated a decline in BP in patients with LVOS after EVT (15). Additionally, our study further indicated that, in patients with MCE, SBP throughout the 24 h post-EVT was higher than that in patients without MCE. Although iatrogenic BP lowing after EVT may affect the understanding of this finding, we did not find any significant difference in the use of intravenous antihypertensive drugs between the two groups. In addition, in our study, the best SBPmax threshold that predicted the development of MCE was 165 mmHg. BEST study also showed that a peak SBP around 160 mm Hg in the 24 h post-EVT best dichotomizes good vs. bad functional outcomes (15). Moreover, a recent large sample study demonstrated that post-thrombectomy SBP <160 mmHg following successful revascularization with EVT seem to be related with better clinical outcomes than SBP <180 mmHg (9). Thus, the current study further expanded our understanding of the association of BP control with outcomes in patients with EVT.
In addition, in the subgroup analyses, we revealed a similar direction and size for the effect of post-EVT SBPmax >165 mm Hg on the development of MCE. However, the adjusted OR were not significant for patients with successful recanalization, without history of hypertension, without intravenous antihypertensive agent and ICA occlusion. A possible explanation is that patients with successful recanalization have a lower rate of MCE [14% (51/364) vs. 34.3% (46/134)]. Additionally, the lack of association in patients without a history of hypertension or intravenous antihypertensive agents may be due to having a normal BP after EVT in these patients. Collateral circulation may be the main impact factor for the insignificant effect of BP on MCE in patients with ICA occlusion.
Notably, in addition to the mean SBP and SBPmax, we also found that BP variability (SBPSD) was associated with the development of MCE. This result were in line with the findings of Skalidi et al.' study (24), which showed that increased values of the 24-h time rate of systolic BP variation are independently associated with formation of edema in acute stroke patients. Additionally, our study showed that the best SBPmax threshold that predicted the development of MCE was 165 mmHg, however, the difference in mean SBP (128 vs. 123 mm Hg) between the groups seems to be rather trivial. We speculate that the main reason for this phenomenon may be that the BPV is larger in the MCE group. These preliminary findings implied that in order to improve the outcomes of EVT patients, it is necessary to not only specify appropriate BP targets but also reduce BPV.
There are some limitations to this study. First, this was a retrospective study with a modest sample size, and we did not unify the protocol for post-thrombectomy BP management. Hence, the results should be interpreted with caution. Second, intraoperative BP is also an important parameter affecting the clinical outcome after EVT. Unfortunately, the intraprocedural BP was not analyzed. Third, we did not exclude patients with parenchymal hemorrhage, which may affect the assessment of MCE. However, such patients are rare. To our knowledge, we are the first group to investigate the association of post-procedural BP with the course of MCE in patients treated with EVT. Our study further expanded our understanding of the management of BP in patients with EVT.
In conclusion, higher mean SBP during the first 24 h after EVT is associated with the development of MCE in LVOS patients. Having an SBPmax >165 mm Hg was prospectively identified to best discriminate the development of MCE. Moreover, increasing BPV may pose a higher risk of developing MCE. These findings suggest that continuous BP monitoring after EVT could be used as a non-invasive predictor for clinical deterioration due to MCE. Randomized clinical studies are warranted to address BP goal after thrombectomy.
Data Availability Statement
The raw data supporting the conclusions of this article will be made available by the authors, without undue reservation.
Ethics Statement
The study was approved by the Ethics Committee of the First Affiliated Hospital of Wannan Medical College (201900039). The patients/participants provided their written informed consent to participate in this study.
Author Contributions
All authors have contributed to the theoretical formalism, designing the study, data collection, data analysis, and writing the manuscript.
Funding
This work was supported by the National Natural Science Foundation of China (Nos. 81870946 and 81530038), National Key Research and Development Program (No. 2017YFC1307901), and the Fundamental Research Funds for the Central Universities (No. WK9110000056).
Conflict of Interest
The authors declare that the research was conducted in the absence of any commercial or financial relationships that could be construed as a potential conflict of interest.
Publisher's Note
All claims expressed in this article are solely those of the authors and do not necessarily represent those of their affiliated organizations, or those of the publisher, the editors and the reviewers. Any product that may be evaluated in this article, or claim that may be made by its manufacturer, is not guaranteed or endorsed by the publisher.
References
1. Huttner HB, Schwab S. Malignant middle cerebral artery infarction: clinical characteristics, treatment strategies, and future perspectives. Lancet Neurol. (2009) 8:949–58. doi: 10.1016/S1474-4422(09)70224-8
2. Goyal M, Menon BK, van Zwam WH, Dippel DWJ, Mitchell PJ, Demchuk AM, et al. Endovascular thrombectomy after large-vessel ischaemic stroke: a meta-analysis of individual patient data from five randomised trials. Lancet. (2016) 387:1723–31. doi: 10.1016/S0140-6736(16)00163-X
3. Kimberly WT, Dutra BG, Boers AMM, Alves HCB, Berkhemer OA, van deng Berg L, et al. Association of reperfusion with brain edema in patients with acute ischemic stroke: a secondary analysis of the MR CLEAN trial. JAMA Neurol. (2018) 75:453–61. doi: 10.1001/jamaneurol.2017.5162
4. Huang X, Yang Q, Shi X, Xu X, Ge L, Ding X, et al. Predictors of malignant brain edema after mechanical thrombectomy for acute ischemic stroke. J Neurointerv Surg. (2019) 11:994–8. doi: 10.1136/neurintsurg-2018-014650
5. Wu S, Yuan R, Wang Y, Wei C, Zhang S, Yang X, et al. Early prediction of malignant brain edema after ischemic stroke. Stroke. (2018) 49:2918–27. doi: 10.1161/STROKEAHA.118.022001
6. Bosel J. Optimal blood pressure for stroke thrombectomy: high time for prospective data! Stroke. (2019) 50:2648–9. doi: 10.1161/STROKEAHA.119.026550
7. Malhotra K, Goyal N, Katsanos AH, Filippatou A, Mistry EA, Khatri P, et al. Association of blood pressure with outcomes in acute stroke thrombectomy. Hypertension. (2020) 75:730–9. doi: 10.1161/HYPERTENSIONAHA.119.14230
8. Goyal N, Tsivgoulis G, Pandhi A, Chang JJ, Dillard K, Ishfaq MF, et al. Blood pressure levels post mechanical thrombectomy and outcomes in large vessel occlusion strokes. Neurology. (2017) 89:540–7. doi: 10.1212/WNL.0000000000004184
9. Anadani M, Arthur AS, Tsivgoulis G, Simpson KN, Alawieh A, Orabi Y, et al. Blood pressure goals and clinical outcomes after successful endovascular therapy: a multicenter study. Ann Neurol. (2020) 87:830–9. doi: 10.1002/ana.25716
10. Vemmos KN, Tsivgoulis G, Spengos K, Zakopoulos N, Synetos A, Kotsis V, et al. Association between 24-h blood pressure monitoring variables and brain oedema in patients with hyperacute stroke. J Hypertens. (2003) 21:2167–73. doi: 10.1097/00004872-200311000-00027
11. Maier B, Kubis N. Hypertension and its impact on stroke recovery: from a vascular to a parenchymal overview. Neural Plast. (2019) 2019:6843895. doi: 10.1155/2019/6843895
12. Christoforidis GA, Mohammad Y, Kehagias D, Avutu B, Slivka AP. Angiographic assessment of pial collaterals as a prognostic indicator following intra-arterial thrombolysis for acute ischemic stroke. AJNR Am J Neuroradiol. (2005) 26:1789–97.
13. Strbian D, Meretoja A, Putaala J, Kaste M, Tatlisumak T, Helsinki Stroke Thrombolysis Registry Group. Cerebral edema in acute ischemic stroke patients treated with intravenous thrombolysis. Int J Stroke. (2013) 8:529–34. doi: 10.1111/j.1747-4949.2012.00781.x
14. Mistry EA, Mistry AM, Nakawah MO, Khattar NK, Fortuny EM, Cruz AS, et al. Systolic blood pressure within 24 hours after thrombectomy for acute ischemic stroke correlates with outcome. J Am Heart Assoc. (2017) 6:e006167. doi: 10.1161/JAHA.117.006167
15. Mistry EA, Sucharew H, Mistry AM, Mehta T, Arora N, Starosciak Ak, et al. Blood pressure after endovascular therapy for ischemic stroke (BEST): a multicenter prospective cohort study. Stroke. (2019) 50:3449–55. doi: 10.1161/STROKEAHA.119.026889
16. Cernik D, Sanak D, Divisova P, Kocher M, Cihlar F, Zapletalova J, et al. Impact of blood pressure levels within first 24 hours after mechanical thrombectomy on clinical outcome in acute ischemic stroke patients. J Neurointerv Surg. (2019) 11:735–9. doi: 10.1136/neurintsurg-2018-014548
17. Serena J, Blanco M, Castellanos M, Silva Y, Vivancos J, Moro MA, et al. The prediction of malignant cerebral infarction by molecular brain barrier disruption markers. Stroke. (2005) 36:1921–6. doi: 10.1161/01.STR.0000177870.14967.94
18. Krieger DW, Demchuk AM, Kasner SE, Jauss M, Hantson L. Early clinical and radiological predictors of fatal brain swelling in ischemic stroke. Stroke. (1999) 30:287–92. doi: 10.1161/01.STR.30.2.287
19. Hatashita S, Hoff JT, Ishii S. Focal brain edema associated with acute arterial hypertension. J Neurosurg. (1986) 64:643–9. doi: 10.3171/jns.1986.64.4.0643
20. Nielsen TH, Stahl N, Schalen W, Reinstrup P, Toft P, Nordstrom CH. Recirculation usually precedes malignant edema in middle cerebral artery infarcts. Acta Neurol Scand. (2012) 126:404–10. doi: 10.1111/j.1600-0404.2012.01664.x
21. Yang GY, Betz AL. Reperfusion-induced injury to the blood-brain barrier after middle cerebral artery occlusion in rats. Stroke. (1994) 25:1658–64. doi: 10.1161/01.STR.25.8.1658
22. Cheripelli BK, Huang X, MacIsaac R, Muir KW. Interaction of recanalization, intracerebral hemorrhage, and cerebral edema after intravenous thrombolysis. Stroke. (2016) 47:1761–7. doi: 10.1161/STROKEAHA.116.013142
23. Cho BH, Kim JT, Lee JS, Park MS, Kang KW, Choi KH, et al. Associations of various blood pressure parameters with functional outcomes after endovascular thrombectomy in acute ischaemic stroke. Eur J Neurol. (2019) 26:1019–27. doi: 10.1111/ene.13951
Keywords: stroke, thrombectomy, cerebral edema, blood pressure, large vessel occlusion
Citation: Huang X, Xu J, Yang K, Xu Y, Yuan L, Cai Q, Xu X, Yang Q, Zhou Z, Zhu S and Liu X (2021) Blood Pressure After Endovascular Thrombectomy and Malignant Cerebral Edema in Large Vessel Occlusion Stroke. Front. Neurol. 12:707275. doi: 10.3389/fneur.2021.707275
Received: 09 May 2021; Accepted: 20 September 2021;
Published: 20 October 2021.
Edited by:
Osama O. Zaidat, Northeast Ohio Medical University, United StatesReviewed by:
Ahmed Mohamed Elhfnawy, Klinik für Neurologie, Uniklinikum Giessen und Marburg, GermanyMehmet Akif Topçuoǧlu, Hacettepe University, Turkey
Anantha Ramana Vellipuram, Texas Tech University Health Sciences Center El Paso, United States
Copyright © 2021 Huang, Xu, Yang, Xu, Yuan, Cai, Xu, Yang, Zhou, Zhu and Liu. This is an open-access article distributed under the terms of the Creative Commons Attribution License (CC BY). The use, distribution or reproduction in other forums is permitted, provided the original author(s) and the copyright owner(s) are credited and that the original publication in this journal is cited, in accordance with accepted academic practice. No use, distribution or reproduction is permitted which does not comply with these terms.
*Correspondence: Shuanggen Zhu, emh1c2hnNzYwOEBzaW5hLmNvbQ==; Xinfeng Liu, eGZsaXUyQHZpcC4xNjMuY29t
†These authors have contributed equally to this work
 Xianjun Huang
 Junfeng Xu1†
 Lili Yuan
 Qiankun Cai
 Xinfeng Liu