 Nik Krajnc
 Gabriel Bsteh
 Thomas Berger
95% of researchers rate our articles as excellent or good
Learn more about the work of our research integrity team to safeguard the quality of each article we publish.
Find out more
SYSTEMATIC REVIEW article
Front. Neurol. , 26 August 2021
Sec. Multiple Sclerosis and Neuroimmunology
Volume 12 - 2021 | https://doi.org/10.3389/fneur.2021.666868
Conversion to secondary progressive (SP) course is the decisive factor for long-term prognosis in relapsing multiple sclerosis (MS), generally considered the clinical equivalent of progressive MS-associated neuroaxonal degeneration. Evidence is accumulating that both inflammation and neurodegeneration are present along a continuum of pathologic processes in all phases of MS. While inflammation is the prominent feature in early stages, its quality changes and relative importance to disease course decreases while neurodegenerative processes prevail with ongoing disease. Consequently, anti-inflammatory disease-modifying therapies successfully used in relapsing MS are ineffective in SPMS, whereas specific treatment for the latter is increasingly a focus of MS research. Therefore, the prevention, but also the (anticipatory) diagnosis of SPMS, is of crucial importance. The problem is that currently SPMS diagnosis is exclusively based on retrospectively assessing the increase of overt physical disability usually over the past 6–12 months. This inevitably results in a delay of diagnosis of up to 3 years resulting in periods of uncertainty and, thus, making early therapy adaptation to prevent SPMS conversion impossible. Hence, there is an urgent need for reliable and objective biomarkers to prospectively predict and define SPMS conversion. Here, we review current evidence on clinical parameters, magnetic resonance imaging and optical coherence tomography measures, and serum and cerebrospinal fluid biomarkers in the context of MS-associated neurodegeneration and SPMS conversion. Ultimately, we discuss the necessity of multimodal approaches in order to approach objective definition and prediction of conversion to SPMS.
Multiple sclerosis (MS) is an autoimmune demyelinating disease affecting the central nervous system, which results from the interaction of genetic and environmental factors that remain only partially understood (1, 2). The majority of patients (85%) initially follow a relapsing-remitting course (RRMS), defined by acute exacerbations and periods of relative clinical stability in between (3). In ~10–15%, patients suffer from a progressive decline in neurological function, called primary progressive multiple sclerosis (PPMS) (4, 5). Natural history of RRMS encompasses conversion to a secondary progressive course (SPMS), which is a gradual process characterized by irreversible disability progression, independent of relapses (6). SPMS conversion is the decisive factor for long-term prognosis in MS, generally considered the clinical equivalent of progressive MS-associated neuroaxonal degeneration with limited and qualitatively changed inflammatory ability (7–10). Although once nearly 10% of patients with RRMS converted to SPMS within 5 years, 25% in 10 years, and 75% in 30 years, the 10-, 15-, and 20-year risk of conversion to SPMS seems to be much lower nowadays (2, 9, and 27%, respectively), due to earlier diagnosis and possible treatment options (11–13). However, anti-inflammatory disease-modifying interval therapies (DMT) successfully used in RRMS are ineffective in SPMS (without superimposed relapses), whereas specific treatment for SPMS is increasingly a focus of MS research. Therefore, the prevention, but also the (anticipatory) diagnosis of SPMS, is of crucial importance.
The problem is that SPMS diagnosis is yet exclusively based on retrospectively assessing the increase of overt physical disability usually over the past 6–12 months. Currently, the most widely used definition of SPMS is the occurrence of disability progression of ≥1 Expanded Disability Status Scale (EDSS) steps (when the EDSS score ≤ 5.5) or ≥0.5 EDSS steps (when the EDSS score ≥6) in the absence of a relapse, and a minimum EDSS score of 4 and pyramidal functional system score of 2 (14). Besides, the inflammatory and neurodegenerative process that have been once thought to be almost strictly separated in relapsing and progressive MS, respectively, are now thought to be a part of a continuum, in which inflammatory activity prevails at the beginning of the disease, but can occur in the later stages of the disease, too—and vice versa. Recent studies have confirmed that disability progression can be seen even in patients with RRMS in the absence of relapses (15, 16). This “silent progression” is associated with brain and retinal atrophy, and suggests that neurodegeneration, which is the driving mechanism of disability progression in patients with SPMS, likely begins much sooner than generally recognized (17, 18).
Defining SPMS retrospectively inevitably results in a delay of diagnosis, reportedly of up to 3 years, resulting in periods of uncertainty and, thus, also making early therapy adaptation (including timely escalation) to prevent SPMS conversion impossible (19, 20). Hence, there is an urgent need for reliable and objective biomarkers to prospectively predict and define SPMS conversion.
An objective definition and reliable prediction of SPMS conversion is especially important in an era in which new therapies with potential neuroprotective effects are introduced. In this way, late RRMS and early SPMS may represent a window of opportunity for intervention to delay or even prevent disability progression. Therefore, the primary objective of this systematic review was to assess the role of potential clinical and paraclinical biomarkers to determine conversion to SPMS.
A review of the literature concerning biomarkers in secondary progressive MS was performed using PubMed with no restriction placed on country or publication date. Search terms included the following: biomarkers, Expanded Disability Status Scale, Multiple Sclerosis Functional Composite, Symbol Digit Modalities Test, Low-Contrast Letter Acuity, olfactory function, magnetic resonance imaging, brain atrophy, slowly expanding lesion, spinal cord atrophy, optical coherence tomography, peripapillary retinal nerve fiber layer, macular ganglion cell-inner plexiform layer, neurofilaments, glial fibrillary acidic protein, soluble triggering receptor 2, OR chitinase 3-like 1 AND disease progression AND multiple sclerosis. Relevant articles were also found by scanning the references of found articles (backward search) and locating newer articles that included the original cited paper (forward search). The last search was performed on the October 31, 2020. The search yielded 4,508 articles.
Our selection criteria were language (English), focus of the study (to determine the progression of MS), and an original contribution of the publication, regardless of the interventional or non-interventional nature of the study. Data from reports were extracted from each report separately. Case reports were excluded with an exception of one case report presented with qualitative data. After selection criteria were applied, 4,261 articles were excluded. We found 247 eligible articles, among which 91 were included in the review (Table 1, Figure 1).

Table 1. Number of articles after applying selection criteria for each biomarker of conversion to secondary progressive multiple sclerosis (SPMS).
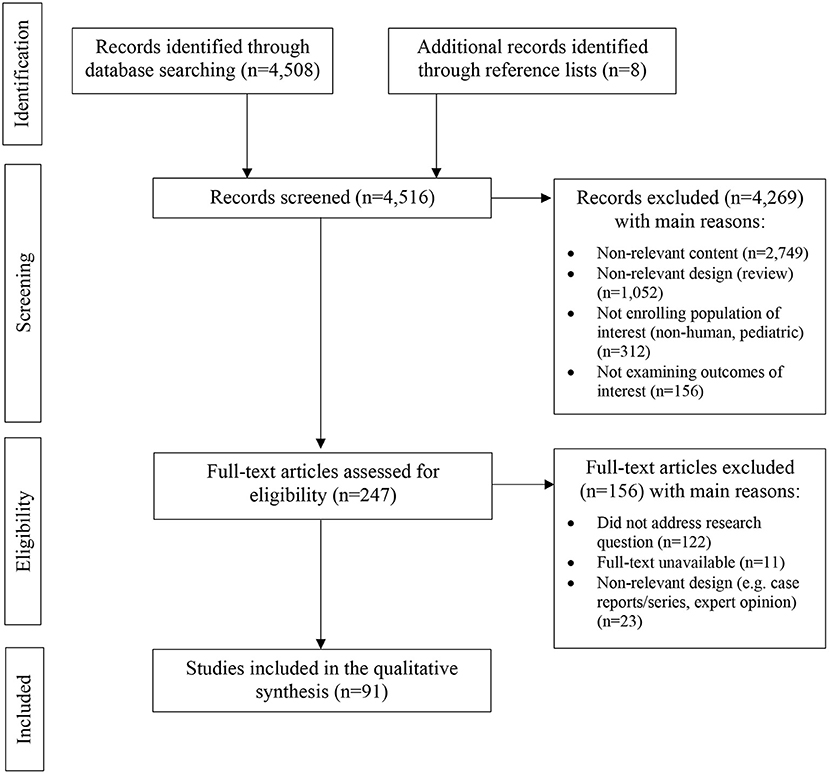
Figure 1. PRISMA flow diagram demonstrating included and excluded studies, and the reasons for exclusion in the systematic review.
The methodological quality of the studies included in this review was graded using the Grades of Recommendation, Assessment, Development, and Evaluation (GRADE) tool for best-evidence synthesis (Table 2). The systematic review was prepared according to the latest PRISMA (Preferred Reporting Items for Systematic Reviews and Meta-Analyses) guidelines.
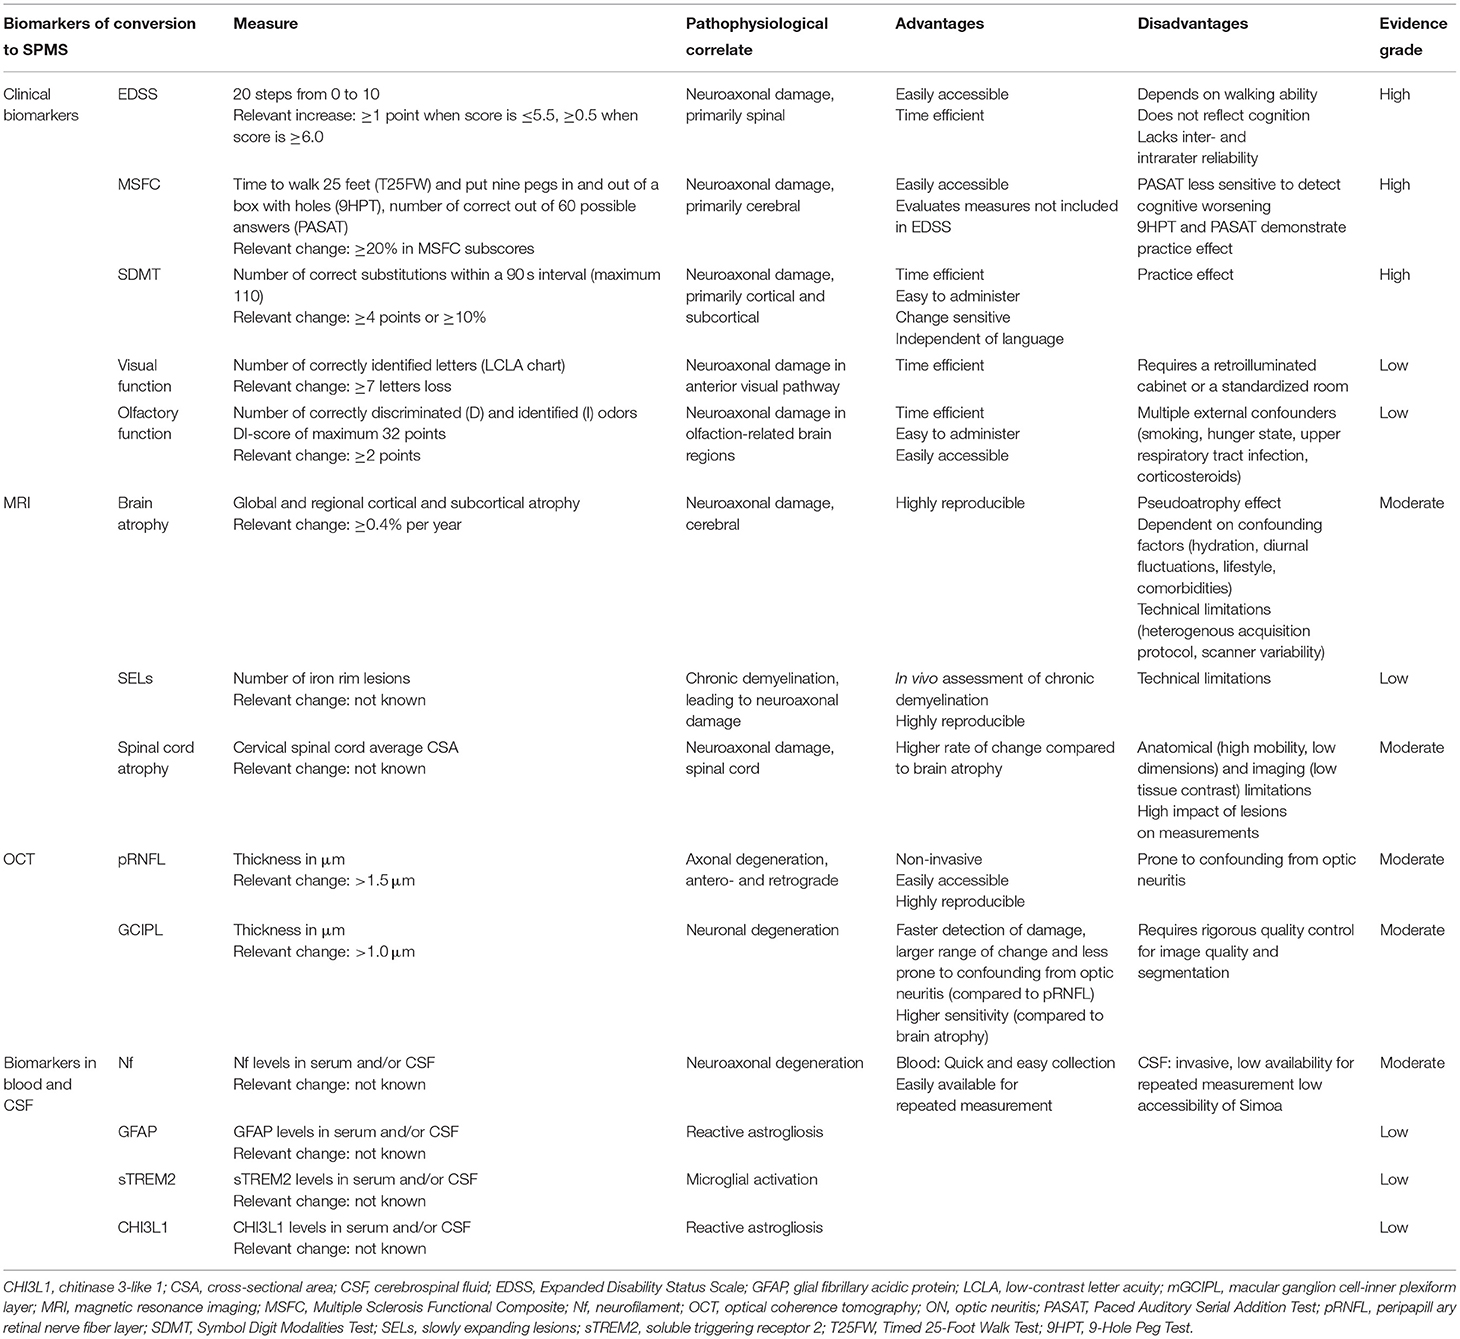
Table 2. The clinical and paraclinical biomarkers of conversion to secondary progressive multiple sclerosis (SPMS).
In most clinical trials, EDSS has been and is used to measure disability progression. It consists of 20 steps ranging from 0 to 10, assessing MS-related impairment based on neurological examination (EDSS score <4.0), walking ability (EDSS score 4.0–6.0), or other functional impairments (EDSS score ≥6.5) (21). However, it has proven less sensitive in detecting all clinically relevant contributors to disability progression in SPMS patients, especially upper-extremity and cognitive dysfunction (22, 23). Besides that, the mid-range of the EDSS overvalues long-distance ambulation and lacks inter- and intrarater reliability (24–26). In the London (Ontario) cohort, the median time from EDSS score 6.0 to 8.0 was 7.9 years, arguing against using the EDSS as the primary outcome in trials in which more disabled patients with SPMS are included (27).
The Multiple Sclerosis Functional Composite (MSFC) is a composite score assessing short-distance ambulation [Timed 25-Foot Walk Test (T25FW)], upper-extremity function [9-Hole Peg Test (9HPT)], and cognitive function [Paced Auditory Serial Addition Test (PASAT)].
T25FW and 9HPT measure time to walk 25 feet and to put nine pegs in and out of a box with holes, respectively. They are able to identify disability progression in SPMS patients more frequently than EDSS (28, 29). The threshold for T25FW and 9HPT to detect clinically meaningful disability progression is reported at 20% or more (30–32). Still, the PASAT, a test of auditory information processing speed, flexibility, and calculation ability, has not been shown to sensitively detect cognitive worsening in SPMS (33, 34). As the 9HPT and PASAT have well-demonstrated practice effects, meaning that participants learn how to perform the test and improve their scores with each repetition, the T25FW seems to be the most reliable clinical test to sense disease progression (35, 36).
In the IMPACT (The MS Progressive Avonex Clinical Trial) and ASCEND (Effect of Natalizumab on Disease Progression in Secondary Progressive Multiple Sclerosis) clinical trials, evaluating the efficacy of intramuscular interferon beta 1a and natalizumab treatment in SPMS, respectively, the T25FW was the single outcome measure with the greatest proportion of patients showing disability progression (37, 38). While the 9HTP also shows a small but significant rate of change over time, it is more prone to fluctuations (39). The EDSS-Plus composite score (EDSS, T25FW, and 9HPT) is roughly twice as sensitive as EDSS alone in detecting disability progression in SPMS patients (59.5 vs. 24.7%, respectively) (30). With EDSS 3.0–6.5, and a T25FW of 8 s or more, the progression rate above 40% was met in both clinical trials (40). However, although the focus of the clinical trials mentioned was disability progression in already diagnosed SPMS rather than the conversion from RRMS to SPMS, a composite score could be used as a sensitive biomarker in determining the conversion to SPMS.
Beside physical impairment, 40–65% of patients with progressive MS have some degree of cognitive impairment (41). Cognitive function correlates even closer with quality of life than the measures of physical impairment but is frequently underestimated when only EDSS is used (42). The areas most affected comprise information processing speed, complex attention, memory, and executive function (43). The cognitive impairment is correlated with the atrophy of cortical and subcortical areas, the corpus callosum, and the superior longitudinal fasciculus (44, 45).
With a specificity of 60% and a sensitivity of 91%, the Symbol Digit Modalities Test (SDMT) presents a sentinel test for cognitive impairment in patients with MS (46, 47). It evaluates the sustained attention, the capacity of concentration, and the visuomotor speed. When compared to the PASAT, the SDMT proved superior with a higher sensitivity (48–50). In general, a four-point or 10% change in SDMT is considered clinically relevant (51). It correlates less strongly with EDSS and the other performance measures (T25FW, 9HPT), providing additional information by assessing the function not captured by the other measures (52). Among different neuropsychological and language performances, the SDMT showed to have the greatest effect size between RRMS and SPMS (53). In this respect, the SDMT is used as the primary endpoint to assess cognitive changes in patients with SPMS, e.g., in the AMASIA study [Impact of Mayzent® (Siponimod) on Secondary Progressive Multiple Sclerosis Patients in a Long-Term Non-Interventional Study in Germany] (54). However, it displays a significant practice effect when brief inter-assessment intervals are used, which becomes less pronounced with the progression of the disease (55, 56). Therefore, a change in key is proposed to make the interpretation of the results less biased. Still, a recent study suggested that SDMT scores improve throughout follow-up, possibly due to a practice effect, and in that way does not reflect the steady cognitive decline that patients with SPMS experience (57).
The anterior visual pathway is affected in more than 90% of MS patients over the course of the disease (58). Among a variety of available measures of visual function, visual contrast threshold is the most promising in MS, defined as the minimum amount of contrast necessary for an individual to discern an object from its background. Visual contrast is assessed by Sloan low-contrast letter acuity (LCLA) charts, which are based on Early Treatment Diabetic Retinopathy Study high-contrast visual acuity (HCLA) charts, but using gray letters with 2.5 and 1.25% contrast level as opposed to black letters (100% contrast level) (59). The charts provide a continuous measure with seven letters of LCLA loss considered to be meaningful and beyond the threshold of test-retest variability (60).
LCLA has been found to be altered in patients with MS, even when HCLA appears normal (61). It shows good structure-function-correlation both with retinal atrophy and lesions in the posterior visual pathway (62–64). Therefore, there have been calls for the inclusion of LCLA in MSFC to reflect visual function (49, 65). The IMPACT study was the first clinical trial to use LCLA as an exploratory visual outcome, reporting good correlation with disability, MSFC and EDSS (65, 66). Recently, progressive visual impairment has been proposed as an additional modality in defining SPMS conversion in a case report (67).
Impairment of olfactory function is an increasingly recognized feature of MS with different modalities reflecting different aspects of MS pathology (68–70). The capacity to correctly identify odors (identification) and discriminate them (discrimination) is predominantly affected in progressive and more advanced MS (69). It slowly deteriorates over time in association with progressing physical disability (68). In contrast, olfactory threshold is impaired in early, active MS, and predicts short-term inflammatory disease activity (71–73).
The sum score of discrimination and identification (DI score) has been shown to correlate with disease duration, physical disability, reduced cognitive function, and reduced retinal thickness of MS patients (69, 74). Moreover, a recent study has shown a robust correlation between impairment of DI score and decreased gray matter concentration in the putamen and temporomesial brain regions in MS patients (75). The olfactory dysfunction is related to several cognitive measures, including SDMT (76).
Gray matter atrophy quantified by means of MRI volumetry is a well-established imaging marker of neurodegeneration in MS (77). It is typically measured from standard 3D T1-weighted images, using fully automated approaches, among which the SIENA method (Structural Image Evaluation of Normalized Atrophy) and Brain Boundary Shift Integral (BBSI) are most commonly used (78–81). SIENA performs segmentation of brain from non-brain tissue, estimates the outer skull surface as a normalizing factor, and aligns the two scans to correct for changes in image geometry. The registered segmented brain images are used to find local atrophy, measured on the basis of the movement of image edges (81). It has a good test–retest reliability with an error of 0.17% on an MS data set (82). Segmentation-based algorithms used in a semiautomatic way (with manual correction) are considered as reference standard techniques, but are time consuming and less reproducible (83).
Gray matter atrophy occurs in all phenotypes of MS and is associated with disability accumulation (84). Recently, cut-offs to distinguish pathological brain atrophy related to MS from the physiological change have been established, with 0.40% per year performing best for detecting physical disability progression (65% sensitivity, 80% specificity) (85). Cortical atrophy seems to accelerate in progressive MS compared to RRMS (−0.87 vs. −0.48%, respectively) (86). Some brain areas display earlier atrophy compared to others, namely, cingulate cortex, insular and temporal cortical gray matter, and the deep gray matter (putamen, caudate nucleus) (84, 87). Cortical atrophy patterns show stronger association with clinical (especially cognitive) dysfunction than global cortical atrophy (86, 87).
Thalamic volume is another MRI volumetric measure of neurodegeneration in MS. Thalamic atrophy at baseline is associated with higher risk for 5-year EDSS increase as well as for not reaching criteria of no evidence of disease activity (NEDA-3) after 2 years (88, 89). Atrophy of anterior thalamic nucleus is also associated with decreased cognitive processing speed (90). However, the rate of decline shows little variation throughout the disease at an estimated −0.71% per year (95% CI = −0.77 to −0.64%) (91). Among regional brain atrophy, corpus callosum seems to be one of the most sensitive MRI markers for memory and processing speed (92). In contrast to the rate of thalamic atrophy, a study of the MAGNIMS study group showed SPMS to have a higher rate of temporal (−1.21%) and parietal (−1.24%) gray matter atrophy. However, only the atrophy rate in the deep gray matter was associated with disability accumulation (p < 0.001) (84).
There are several external confounding factors that need to be taken into account when analyzing brain atrophy, including hydration changes, diurnal fluctuations, lifestyle (smoking, alcohol consumption), menstrual cycle, and comorbidities (93–97). Whereas inflammation can transiently increase brain volume in the short-term, DMT reduce edema, causing accelerated, non-tissue-related brain volume loss, known as pseudoatrophy (98). However, these confounding factors only result in minor volume changes. Besides the confounding factors, there are also technical barriers that pose a challenge in the adoption of atrophy in clinical practice. These include heterogeneity in acquisition protocol, distortion differences, and scanner variability, to name a few (99, 100).
In MS, some lesions remyelinate early after the demyelinating event, evolving into remyelinated shadow plaques which is protective against axonal degeneration (101, 102). While those predominate in early RRMS, some lesions develop into smoldering plaques or slowly expanding lesions (SELs) which are more prominent in progressive MS (12–28% plaques) and seem to indicate progressive disease activity (103–106). They are associated with incomplete remyelination which results in irreparable myelin loss, leading to axonal degeneration (107, 108).
Histopathologically, SELs are characterized by an inactive center with no or few macrophages, surrounded by an iron rim containing microglia/macrophages with a pro-inflammatory activation status. While most studies on SEL have been conducted on 7T MRI, which has limited availability, it has been consistently shown that SEL can also be sensitively detected on 3T MRI using several different sequences, among which the susceptibility-weighted imaging (SWI) is the most reliable (109–114). SELs expand toward the surrounding white matter in comparison with non-iron lesions, which significantly shrink over time (115). They seem to be more destructive, too, reflected by T1 hyperintensities (black holes) which are associated with greater reduction in myelin and axonal density (116–118).
Patients with multiple SELs (≥4 SELs) have more aggressive disease (higher lesion load and ventricular volumes, lower brain and basal ganglia volumes) and reach higher motor (EDSS) and cognitive disability (SDMT, PASAT) or transit to disease progression at a younger age (119, 120). Another study confirmed that SELs significantly predict clinical progression, evaluated by EDSS, T25FW, and 9HPT (121).
As edge-related iron accumulation might separate SEL from the lesions with a higher remyelination potential, SWI-based iron imaging may present a useful imaging biomarker for progressive MS.
Besides that, SELs seem to have a good imaging–pathologic correlation, which is why we think they could be used routinely to determine disease progression or even conversion to SPMS.
Spinal cord atrophy (SCA) is another promising biomarker of MS-associated neurodegeneration. A recently published meta-analysis has confirmed the correlation between SCA and clinical disability, assessed by EDSS (122). When comparing the cross-sectional area (CSA) of a spinal cord, it can differentiate between RRMS and progressive types of MS (p < 0.001) (123). SCA also progresses faster in patients exhibiting disease progression at 2 years (124). A recent study has confirmed that SPMS and RRMS patients differ in cervical spinal cord average CSA (p = 0.03) as well as in C7 area (p = 0.002) (125). Atrophy of the upper cervical cord is most evident in the antero-posterior direction, and attains a cranio-caudal pattern with the progression of the disease (126, 127). It presents a sensitive biomarker, especially as the estimated annual rate of SCA is greater when compared to the rate of brain atrophy in patients with MS (−1.78 vs. −0.5%) (123, 128).
However, assessment of the SCA is technically more difficult than brain segmentation due to anatomical (higher mobility, smaller dimensions) and imaging (lower tissue contrast) features of the spinal cord. Focal lesions also add variance to SCA measures, with acute lesions and chronic lesions causing swelling and shrinking, respectively (129). SCA is usually measured on T1-weighted gradient recalled sequences, with the mean upper cervical cord area, a measurement of CSA at the level between the C2 and C3 vertebrae, being most commonly used (130–132). A study of Liu and coworkers showed that the C2/C3 CSA is comparable to the CSA 2.5 cm below the inferior margin of pons, which may be of interest in longitudinal studies or trials where spinal cord measurements were not included as an original outcome measure, but could be obtained from the brain scans (133).
Optical coherence tomography (OCT) is a non-invasive and accessible technique that uses near-infrared light to create images of the retina (134). It can measure the thickness of peripapillary retinal nerve fiber layer (pRNFL) and ganglion cell-inner plexiform layer (GCIPL), which are both robust indicators of neuroaxonal degeneration in MS (135). Since time domain OCT (TD-OCT) has been supplanted by spectral domain OCT (SD-OCT), which provides a better image resolution and enables the use of segmentation algorithms, validity has so much increased that small changes in the micrometer spectrum can be reliably reproduced (136). Among fully automated segmentation techniques, two commonly utilized are Cirrus and Spectralis (137). Both Spectralis and Cirrus proved to have high reproducibility and repeatability in both pRNFL and GCIPL measurements, especially when eye tracking and averaging of multiple images are used (138–140).
Several studies have shown that pRNFL and GCIPL are significantly reduced in patients with MS regardless of prior optic neuritis (ON) (136, 141, 142). They are associated with both present and future physical and cognitive disabilities as well as brain atrophy, while short-term relapse activity (apart from ON) has little or no effect on pRNFL and GCIPL thinning (74, 135, 143–145). A baseline pRNFL thickness in the eyes without prior ON of ≤ 87 μm (Cirrus) or 88 μm (Spectralis) approximately doubled the risk of disability worsening and cognitive decline during the following 2–5 years (74, 144). Similar results were found for a baseline GCIPL thickness below 77 μm (Spectralis) (146).
OCT can potentially help differentiate between MS subtypes, with RRMS patients having significantly lower RNFL thinning compared to patients with SPMS. There was no statistically significant difference between the RNFL thickness in patients with both subtypes of progressive MS (SPMS, PPMS) (147). With a specificity of 90% and a sensitivity of 76.1%, annual pRNFL thinning rate of more than 1.5 μm is able to distinguish between stable and progressive MS; the risk is increased by 15-fold (148). A recent study found that an annual loss in GCIPL above a cut-off ≥1 μm accurately identifies clinically progressing patients with 87% sensitivity and 90% specificity, and presents a strong predictor of clinical progression (146).
One of the limitations of pRNFL measurement is its dependence on optic disc swelling at the time of ON, and its reduction after the episode of ON, which makes GCIPL superior for detection of early atrophy following ON (149, 150). Besides that, RNFL is not homogenous but thicker around the optic disc, decreasing the reliability of scan acquisition (151). Progressive thinning of GCIPL, and to a lesser extent, pRNFL in absence of inflammatory episodes makes the measure a compelling model for MS associated neurodegeneration and, thus, a promising candidate biomarker for definition and prediction of conversion to SPMS.
Neurofilaments (Nf) are major components of the neuronal cytoskeleton and neuroaxonal damage causes their release into the extracellular space and further into the cerebrospinal fluid (CSF) and the blood. Thus, Nf have recently garnered increasing attention as a biomarker of axonal injury (152).
In MS, NfL levels in the CSF are associated with the occurrence of neurological disability, MRI lesions, and treatment status in MS (153, 154). CSF NfL levels at the time of diagnosis seem to be an early predictive biomarker of long-term clinical outcome and conversion from RRMS to SPMS (155, 156).
Until recently, Nf studies were limited to CSF as detection systems were not sensitive enough to quantitate the physiologically lower levels of Nf in the peripheral blood. This restricts clinical applicability since obtaining CSF requires lumbar puncture, which is an invasive procedure and necessitates stringent indication for diagnostic purpose (152). Also, repeated measurement is hardly feasible as repeated lumbar punctures are difficult to justify and seldomly tolerated by patients (152).
The advent of the SIngle MOlecule Array (Simoa®) technology enables highly sensitive quantitation of the Nf light (NfL) subunit in the peripheral blood (153). Importantly, several studies have demonstrated that CSF and serum NfL (sNfL) levels are highly correlated paving the road for application of NfL as biomarker available for serial measurement (152). sNfL levels correlate with disability and increase over time, even in the absence of prior/subsequent disability progression, and are associated with various MRI parameters of neuroaxonal degeneration (T1 black holes, brain and spinal cord atrophy) (157–160). However, several current limitations need to be addressed: Nf levels are age-dependent and may be confounded by certain concomitant disorders (e.g., physical activity, trauma, small vessel disease); Nf correlations are based on group-wise rather than individual evaluations (161).
Therefore, serum Nf are a promising candidate biomarker for definition and prediction of SPMS conversion, but utility in clinical routine practice awaits confirmation.
Glial fibrillary acidic protein (GFAP) is one of the major intermediate cytoskeletal proteins of astrocytes and presents a well-established marker of reactive astrogliosis. The upregulation of GFAP is critically important for the formation of extended and thickened astrocytic processes observed in reactive astrogliosis at the site of the injury (162). The latter is not necessarily connected with glial scar formation, and its re- or demyelinating potential depends on a number of factors, including the timing after injury, the microenvironment of the lesion, and its interaction with other cell types and factors influencing their activation (163–165). However, extensive astrocytosis leads to the formation of the astroglial scar which plays a role in the progression of MS (166).
Patients with progressive MS have significantly higher levels of GFAP in CSF compared to the patients with clinically isolated syndrome or early RRMS (167). GFAP levels in CSF and serum correlate with neurological disability (EDSS) and disease progression; the mean annual increase of GFAP is significantly higher in SPMS patients compared to RMS and correlates with sNfL and the MRI lesion count, especially in progressive MS patients (168–170).
The triggering receptor expressed on myeloid cells 2 (TREM2) is found on the cell surface of macrophages and microglia cells. Activation of TREM2 is associated with reduced tissue destruction in animal models (171). In contrast, the soluble form of TREM2 (sTREM2) detectable in CSF appears to reflect the extent of microglial activation, with elevated sTREM2 concentrations indicating increased microglial activation (170, 171).
An essential aspect of the pathophysiology of SPMS conversion is seen in a microcompartmentalization of inflammation within the central nervous system, which is primarily mediated by macrophages and microglia (172). Intriguingly, a small study has recently described an increase in sTREM2 in CSF in patients with progressive MS (173). Therefore, sTREM2 could be important as a biomarker of SPMS conversion. So far, however, sTREM2 has only been determined by an enzyme-linked immunosorbent assay (ELISA) test, which does not yield valid results in serum. A study of sTREM2 using the ultrasensitive Simoa method in serum or CSF has not yet been performed.
Chitinase 3-like 1 (CHI3L1), also known as YKL-40, is a member of the chitinase-like glycoprotein family and is predominantly produced by reactive astrocytes (174). Although its biological and physiological function in the central nervous system remains unclear, some studies have suggested that CHI3L1 is expressed in astrocytes and microglia in a variety of acute neuroinflammatory conditions, including traumatic brain injury and MS, being involved into tissue remodeling during inflammation (174–177).
CHI3L1 levels in CSF were reported to be elevated in SPMS patients and to predict SPMS conversion when NfL levels were also increased (178, 179). Interestingly, CHI3L1 levels in SPMS were similar to the level in active RRMS patients, which supports the hypothesis that inflammation remains important in the chronic phase of the disease (180). However, higher CHI3L1 levels are seen in both SPMS and PPMS patients compared to RRMS, providing a possible biomarker to differentiate between RRMS and progressive MS in general (178, 179). Accordingly, higher levels of CHI3L1 are associated with higher EDSS and related neurologic disability (181).
To date, several potential clinical and paraclinical biomarkers have been researched in order to determine and predict conversion from RRMS to SPMS. The most promising clinical biomarkers are T25FW and SDMT, which evaluate both function of the lower extremities and cognition and show a good correlation with other biomarkers of MS-associated neurodegeneration. Among paraclinical biomarkers, brain and spinal cord atrophy, sNfL, GCIPL and pRNFL thinning, and decreased DI score present an easy-accessible and repeatable biomarker in determining progression of the disease. With reaching a higher degree of disability, we should aim to take more paraclinical outcome measures into consideration, especially as they show some degree of worsening even in the absence of clinical progression of the disease. However, currently available evidence for most of these biomarkers is still low.
Going forward, by conducting prospective high-quality standard studies combining multiple parameters within a multimodal approach, we could gain a more holistic view of the pathophysiology underlying SPMS conversion. Consequently, diagnostic accuracy could be improved, shortening the time to diagnosis and providing a window of opportunity for intervention to delay disability progression.
However, although a combination of the mentioned biomarkers would likely present the most sensitive tool to assess disease progression, using a large number of methods is unrealistic in everyday clinical practice. Thus, the goal would be to better define the accessible paraclinical biomarkers of conversion to SPMS, such as MRI, OCT, and biomarkers in blood, and combine the most reliable and predictive markers with clinical measurements for disease progression.
An objective and reliable definition of SPMS and a high-risk profile for SPMS conversion would enable a new approach to the management of patients with MS: DMT could be adapted or escalated in a timelier manner in order to delay or even prevent SPMS conversion, and symptomatic treatment could be intensified. In the hopefully not too distant future, these definitions might guide design and inclusion criteria when studying neuroprotective or neurorepairing agents.
The original contributions presented in the study are included in the article/supplementary material, further inquiries can be directed to the corresponding author/s.
NK: literature search and lead drafting the manuscript. GB: supervision of literature search and drafting of the manuscript. TB: overall supervision and review of the manuscript for intellectual content. All authors contributed to the article and approved the submitted version.
NK has participated in meetings sponsored by and received speaker honoraria or travel funding from Roche, Novartis, and Merck. GB has participated in meetings sponsored by, received speaker honoraria or travel funding from Biogen, Celgene, Lilly, Merck, Novartis, Roche, Sanofi-Genzyme, and Teva, and received honoraria for consulting Biogen, Celgene, Roche, and Teva. TB has participated in meetings sponsored by and received honoraria (lectures, advisory boards, consultations) from pharmaceutical companies marketing treatments for MS: Allergan, Almirall, Bayer, Biogen, Biologix, Bionorica, Celgene, MedDay, Merck, Novartis, Octapharma, Roche, Sanofi-Genzyme, Teva, and TG Pharmaceuticals. His institution has received financial support in the past 12 months by unrestricted research grants (Biogen, Merck, Novartis, Sanofi-Genzyme, Teva) and for participation in clinical trials in multiple sclerosis sponsored by Alexion, Biogen, Merck, Novartis, Octapharma, Roche, Sanofi-Genzyme, Teva.
All claims expressed in this article are solely those of the authors and do not necessarily represent those of their affiliated organizations, or those of the publisher, the editors and the reviewers. Any product that may be evaluated in this article, or claim that may be made by its manufacturer, is not guaranteed or endorsed by the publisher.
The manuscript was written during the fellowship period of the NK, supported by the ECTRIMS Clinical Training Fellowship Programme.
BBSI, Brain Boundary Shift Integral; CHI3L1, chitinase 3-like 1; CSA, cross-sectional area; CSF, cerebrospinal fluid; DI, discrimination and identification; DMT, disease-modifying therapy; EDSS, Expanded Disability Status Scale; ELISA, enzyme-linked immunosorbent assay; GCIPL, ganglion cell-inner plexiform layer; GFAP, glial fibrillary acidic protein; HCLA, high-contrast visual acuity; LCLA, low-contrast letter acuity; MRI, magnetic resonance imaging; MS, multiple sclerosis; MSFC, Multiple Sclerosis Functional Composite; NEDA, no evidence of disease activity; Nf, neurofilament; NfL, neurofilament light subunit; OCT, optical coherence tomography; ON, optic neuritis; PASAT, Paced Auditory Serial Addition Test; PPMS, primary progressive multiple sclerosis; pRNFL, peripapillary retinal nerve fiber layer; RRMS, relapsing-remitting multiple sclerosis; SCA, spinal cord atrophy; SDMT, Symbol Digit Modalities Test; SD-OCT, spectral domain optical coherence tomography; SELs, slowly expanding lesions; SIENA, Structural Image Evaluation of Normalized Atrophy; sNfL, serum neurofilament light subunit; SPMS, secondary progressive multiple sclerosis; sTREM2, soluble triggering receptor 2; SWI, susceptibility-weighted imaging; TD-OCT, timed domain optical coherence tomography; TREM, triggering receptor expressed on myeloid cells 2; T25FW, Timed 25-Foot Walk Test; 9HPT, 9-Hole Peg Test.
1. Sawcer S, Franklin RJ, Ban M. Multiple sclerosis genetics. Lancet Neurol. (2014) 13:700–9. doi: 10.1016/S1474-4422(14)70041-9
2. Belbasis L, Bellou V, Evangelou E, Ioannidis JP, Tzoulaki I. Environmental risk factors and multiple sclerosis: an umbrella review of systematic reviews and meta-analyses. Lancet Neurol. (2015) 14:263–73. doi: 10.1016/S1474-4422(14)70267-4
3. Katz Sand I. Classification, diagnosis, and differential diagnosis of multiple sclerosis. Curr Opin Neurol. (2015) 28:193–205. doi: 10.1097/WCO.0000000000000206
4. Macaron G, Ontaneda D. Diagnosis and management of progressive multiple sclerosis. Biomedicines. (2019) 7:56. doi: 10.3390/biomedicines7030056
5. Montalban X. Primary progressive multiple sclerosis. Curr Opin Neurol. (2005) 18:261–6. doi: 10.1097/01.wco.0000169742.37159.e9
6. Oh J, Alikhani K, Bruno T, Devonshire V, Giacomini PS, Giuliani F, et al. Diagnosis and management of secondary-progressive multiple sclerosis: time for change. Neurodegener Dis Manag. (2019) 9:301–17. doi: 10.2217/nmt-2019-0024
7. Confavreux C, Vukusic S, Moreau T, Adeleine P. Relapses and progression of disability in multiple sclerosis. N Engl J Med. (2000) 343:1430–8. doi: 10.1056/NEJM200011163432001
8. Runmarker B, Andersen O. Prognostic factors in a multiple sclerosis incidence cohort with twenty-five years of follow-up. Brain. (1993) 116 (Pt 1):117–34. doi: 10.1093/brain/116.1.117
9. Weinshenker BG, Bass B, Rice GP, Noseworthy J, Carriere W, Baskerville J, et al. The natural history of multiple sclerosis: a geographically based study. 2. Predictive value of the early clinical course. Brain. (1989) 112 (Pt 6):1419–28. doi: 10.1093/brain/112.6.1419
10. Bsteh G, Ehling R, Lutterotti A, Hegen H, Di Pauli F, Auer M, et al. Long term clinical prognostic factors in relapsing-remitting multiple sclerosis: insights from a 10-year observational study. PLoS ONE. (2016) 11:e0158978. doi: 10.1371/journal.pone.0158978
11. Bogosian A, Morgan M, Moss-Morris R. Multiple challenges for people after transitioning to secondary progressive multiple sclerosis: a qualitative study. BMJ Open. (2019) 9:e026421. doi: 10.1136/bmjopen-2018-026421
12. Manouchehrinia A, Zhu F, Piani-Meier D, Lange M, Silva DG, Carruthers R, et al. Predicting risk of secondary progression in multiple sclerosis: a nomogram. Mult Scler. (2019) 25:1102–12. doi: 10.1177/1352458518783667
13. Ouallet JC. Do disease-modifying drugs (DMD) have a positive impact on the occurrence of secondary progressive multiple sclerosis? Comment Rev Neurol. (2020) 176:500–4. doi: 10.1016/j.neurol.2020.03.005
14. Lorscheider J, Buzzard K, Jokubaitis V, Spelman T, Havrdova E, Horakova D, et al. Defining secondary progressive multiple sclerosis. Brain. (2016) 139 (Pt. 9):2395–405. doi: 10.1093/brain/aww173
15. Dekker I, Leurs CE, Hagens MHJ, van Kempen ZLE, Kleerekooper I, Lissenberg-Witte BI, et al. Long-term disease activity and disability progression in relapsing-remitting multiple sclerosis patients on natalizumab. Mult Scler Relat Disord. (2019) 33:82–7. doi: 10.1016/j.msard.2019.05.017
16. University of California SFMSET Cree BAC Hollenbach JA Bove R Kirkish G Sacco S . Silent progression in disease activity-free relapsing multiple sclerosis. Ann Neurol. (2019) 85:653–66. doi: 10.1002/ana.25463
17. Kappos L, Wolinsky JS, Giovannoni G, Arnold DL, Wang Q, Bernasconi C, et al. Contribution of relapse-independent progression vs relapse-associated worsening to overall confirmed disability accumulation in typical relapsing multiple sclerosis in a pooled analysis of 2 randomized clinical trials. JAMA Neurol. (2020) 77:1132–40. doi: 10.1001/jamaneurol.2020.1568
18. Bsteh G, Hegen H, Altmann P, Auer M, Berek K, Pauli FD, et al. Retinal layer thinning is reflecting disability progression independent of relapse activity in multiple sclerosis. Mult Scler J Exp Transl Clin. (2020) 6:2055217320966344. doi: 10.1177/2055217320966344
19. Katz Sand I, Krieger S, Farrell C, Miller AE. Diagnostic uncertainty during the transition to secondary progressive multiple sclerosis. Mult Scler. (2014) 20:1654–7. doi: 10.1177/1352458514521517
20. Rojas JI, Patrucco L, Alonso R, Garcea O, Deri N, Carnero Contentti E, et al. Diagnostic uncertainty during the transition to secondary progressive multiple sclerosis: multicenter study in Argentina. Mult Scler. (2020) 27:579–84. doi: 10.1177/1352458520924586
21. Kurtzke JF. Rating neurologic impairment in multiple sclerosis: an expanded disability status scale (EDSS). Neurology. (1983) 33:1444–52. doi: 10.1212/WNL.33.11.1444
22. Cadavid D, Tang Y, O'Neill G. [Responsiveness of the expanded disability status scale (EDSS) to disease progression and therapeutic intervention in progressive forms of multiple sclerosis]. Rev Neurol. (2010) 51:321–9. doi: 10.33588/rn.5106.2010390
23. Hyland M, Rudick RA. Challenges to clinical trials in multiple sclerosis: outcome measures in the era of disease-modifying drugs. Curr Opin Neurol. (2011) 24:255–61. doi: 10.1097/WCO.0b013e3283460542
24. Rudick RA, Polman CH, Cohen JA, Walton MK, Miller AE, Confavreux C, et al. Assessing disability progression with the multiple sclerosis functional composite. Mult Scler. (2009) 15:984–97. doi: 10.1177/1352458509106212
25. Amato MP, Fratiglioni L, Groppi C, Siracusa G, Amaducci L. Interrater reliability in assessing functional systems and disability on the kurtzke scale in multiple sclerosis. Arch Neurol. (1988) 45:746–8. doi: 10.1001/archneur.1988.00520310052017
26. Noseworthy JH, Vandervoort MK, Wong CJ, Ebers GC. Interrater variability with the expanded disability status scale (edss) and functional systems (FS) in a multiple sclerosis clinical trial. The Canadian cooperation MS study group. Neurology. (1990) 40:971–5. doi: 10.1212/WNL.40.6.971
27. Kremenchutzky M, Rice GP, Baskerville J, Wingerchuk DM, Ebers GC. The natural history of multiple sclerosis: a geographically based study 9: observations on the progressive phase of the disease. Brain. (2006) 129 (Pt. 3):584–94. doi: 10.1093/brain/awh721
28. Demir S. Multiple Sclerosis Functional Composite. Noro Psikiyatr Ars. (2018) 55 (Suppl. 1):S66–S8. doi: 10.29399/npa.23349
29. Bin Sawad A, Seoane-Vazquez E, Rodriguez-Monguio R, Turkistani F. Evaluation of the expanded disability status scale and the multiple sclerosis functional composite as clinical endpoints in multiple sclerosis clinical trials: quantitative meta-analyses. Curr Med Res Opin. (2016) 32:1969–74. doi: 10.1080/03007995.2016.1222516
30. Cadavid D, Cohen JA, Freedman MS, Goldman MD, Hartung HP, Havrdova E, et al. The EDSS-Plus, an improved endpoint for disability progression in secondary progressive multiple sclerosis. Mult Scler. (2017) 23:94–105. doi: 10.1177/1352458516638941
31. Kragt JJ, van der Linden FA, Nielsen JM, Uitdehaag BM, Polman CH. Clinical impact of 20% worsening on timed 25-foot walk and 9-hole peg test in multiple sclerosis. Mult Scler. (2006) 12:594–8. doi: 10.1177/1352458506070768
32. Bosma LV, Kragt JJ, Brieva L, Khaleeli Z, Montalban X, Polman CH, et al. Progression on the multiple sclerosis functional composite in multiple sclerosis: what is the optimal cut-off for the three components? Mult Scler. (2010) 16:862–7. doi: 10.1177/1352458510370464
33. Rudick RA, Cutter G, Reingold S. The multiple sclerosis functional composite: a new clinical outcome measure for multiple sderosis trials. Mult Scler. (2002) 8:359–65. doi: 10.1191/1352458502ms845oa
34. Orbach R, Zhao Z, Wang YC, O'Neill G, Cadavid D. Comparison of disease activity in SPMS and PPMS in the context of multicenter clinical trials. PLoS ONE. (2012) 7:e45409. doi: 10.1371/journal.pone.0045409
35. Rosti-Otajarvi E, Hamalainen P, Koivisto K, Hokkanen L. The reliability of the MSFC and its components. Acta Neurol Scand. (2008) 117:421–7. doi: 10.1111/j.1600-0404.2007.00972.x
36. Solari A, Radice D, Manneschi L, Motti L, Montanari E. The multiple sclerosis functional composite: different practice effects in the three test components. J Neurol Sci. (2005) 228:71–4. doi: 10.1016/j.jns.2004.09.033
37. Cohen JA, Cutter GR, Fischer JS, Goodman AD, Heidenreich FR, Kooijmans MF, et al. Benefit of interferon beta-1a on MSFC progression in secondary progressive MS. Neurology. (2002) 59:679–87. doi: 10.1212/WNL.59.5.679
38. Kapoor R, Ho PR, Campbell N, Chang I, Deykin A, Forrestal F, et al. Effect of natalizumab on disease progression in secondary progressive multiple sclerosis (ASCEND): a phase 3, randomised, double-blind, placebo-controlled trial with an open-label extension. Lancet Neurol. (2018) 17:405–15. doi: 10.1016/S1474-4422(18)30069-3
39. Bosma LV, Sonder JM, Kragt JJ, Polman CH, Uitdehaag BM. Detecting clinically-relevant changes in progressive multiple sclerosis. Mult Scler. (2015) 21:171–9. doi: 10.1177/1352458514540969
40. Koch MW, Mostert J, Uitdehaag B, Cutter G. Clinical outcome measures in SPMS trials: an analysis of the IMPACT and ASCEND original trial data sets. Mult Scler. (2019) 26:1540–9. doi: 10.1177/1352458519876701
41. Messinis L, Kosmidis MH, Lyros E, Papathanasopoulos P. Assessment and rehabilitation of cognitive impairment in multiple sclerosis. Int Rev Psychiatry. (2010) 22:22–34. doi: 10.3109/09540261003589372
42. Hojsgaard Chow H, Schreiber K, Magyari M, Ammitzboll C, Bornsen L, Romme Christensen J, et al. Progressive multiple sclerosis, cognitive function, and quality of life. Brain Behav. (2018) 8:e00875. doi: 10.1002/brb3.875
43. Oreja-Guevara C, Ayuso Blanco T, Brieva Ruiz L, Hernandez Perez MA, Meca-Lallana V, Ramio-Torrenta L. Cognitive dysfunctions and assessments in multiple sclerosis. Front Neurol. (2019) 10:581. doi: 10.3389/fneur.2019.00581
44. Manca R, Stabile MR, Bevilacqua F, Cadorin C, Piccione F, Sharrack B, et al. Cognitive speed and white matter integrity in secondary progressive multiple sclerosis. Mult Scler Relat Disord. (2019) 30:198–207. doi: 10.1016/j.msard.2019.02.021
45. Eijlers AJC, van Geest Q, Dekker I, Steenwijk MD, Meijer KA, Hulst HE, et al. Predicting cognitive decline in multiple sclerosis: a 5-year follow-up study. Brain. (2018) 141:2605–18. doi: 10.1093/brain/awy202
46. Van Schependom J, D'Hooghe M B, Cleynhens K, D'Hooge M, Haelewyck MC, De Keyser J, et al. The symbol digit modalities test as sentinel test for cognitive impairment in multiple sclerosis. Eur J Neurol. (2014) 21:1219–25.e71–2. doi: 10.1111/ene.12463
47. Kalb R, Beier M, Benedict RH, Charvet L, Costello K, Feinstein A, et al. Recommendations for cognitive screening and management in multiple sclerosis care. Mult Scler. (2018) 24:1665–80. doi: 10.1177/1352458518803785
48. Strober L, DeLuca J, Benedict RH, Jacobs A, Cohen JA, Chiaravalloti N, et al. Symbol digit modalities test: a valid clinical trial endpoint for measuring cognition in multiple sclerosis. Mult Scler. (2019) 25:1781–90. doi: 10.1177/1352458518808204
49. Ontaneda D, LaRocca N, Coetzee T, Rudick R, Force NMT. Revisiting the multiple sclerosis functional composite: proceedings from the national multiple sclerosis society (NMSS) task force on clinical disability measures. Mult Scler. (2012) 18:1074–80. doi: 10.1177/1352458512451512
50. Lopez-Gongora M, Querol L, Escartin A. A one-year follow-up study of the symbol digit modalities test (SDMT) and the paced auditory serial addition test (PASAT) in relapsing-remitting multiple sclerosis: an appraisal of comparative longitudinal sensitivity. BMC Neurol. (2015) 15:40. doi: 10.1186/s12883-015-0296-2
51. Benedict RH, DeLuca J, Phillips G, LaRocca N, Hudson LD, Rudick R, et al. Validity of the symbol digit modalities test as a cognition performance outcome measure for multiple sclerosis. Mult Scler. (2017) 23:721–33. doi: 10.1177/1352458517690821
52. Goldman MD, LaRocca NG, Rudick RA, Hudson LD, Chin PS, Francis GS, et al. Evaluation of multiple sclerosis disability outcome measures using pooled clinical trial data. Neurology. (2019) 93:e1921–31. doi: 10.1212/WNL.0000000000008519
53. Ntoskou K, Messinis L, Nasios G, Martzoukou M, Makris G, Panagiotopoulos E, et al. Cognitive and language deficits in multiple sclerosis: comparison of relapsing remitting and secondary progressive subtypes. Open Neurol J. (2018) 12:19–30. doi: 10.2174/1874205X01812010019
54. Ziemssen T, Hoffmann O, Klotz L, Schreiber H, Weber MS, Rauser B. Gaining first insights on secondary progressive multiple sclerosis patients treated with siponimod in clinical routine: protocol of the noninterventional study AMASIA. JMIR Res Protoc. (2020) 9:e19598. doi: 10.2196/19598
55. Pereira DR, Costa P, Cerqueira JJ. Repeated assessment and practice effects of the written symbol digit modalities test using a short inter-test interval. Arch Clin Neuropsychol. (2015) 30:424–34. doi: 10.1093/arclin/acv028
56. Roar M, Illes Z, Sejbaek T. Practice effect in symbol digit modalities test in multiple sclerosis patients treated with natalizumab. Mult Scler Relat Disord. (2016) 10:116–22. doi: 10.1016/j.msard.2016.09.009
57. Koch MW, Mostert J, Repovic P, Bowen JD, Uitdehaag B, Cutter G. Is the symbol digit modalities test a useful outcome in secondary progressive multiple sclerosis? Eur J Neurol. (2021) 28:2115–20. doi: 10.1111/ene.14732
58. Ikuta F, Zimmerman HM. Distribution of plaques in seventy autopsy cases of multiple sclerosis in the United States. Neurology. (1976) 26 (6 Pt. 2):26–8. doi: 10.1212/WNL.26.6_Part_2.26
59. Galetta KM, Balcer LJ. Measures of visual pathway structure and function in MS: clinical usefulness and role for MS trials. Mult Scler Relat Disord. (2013) 2:172–82. doi: 10.1016/j.msard.2012.12.004
60. Beck RW, Maguire MG, Bressler NM, Glassman AR, Lindblad AS, Ferris FL. Visual acuity as an outcome measure in clinical trials of retinal diseases. Ophthalmology. (2007) 114:1804–9. doi: 10.1016/j.ophtha.2007.06.047
61. Balcer LJ, Raynowska J, Nolan R, Galetta SL, Kapoor R, Benedict R, et al. Validity of low-contrast letter acuity as a visual performance outcome measure for multiple sclerosis. Mult Scler. (2017) 23:734–47. doi: 10.1177/1352458517690822
62. Talman LS, Bisker ER, Sackel DJ, Long DA Jr, Galetta KM, et al. Longitudinal study of vision and retinal nerve fiber layer thickness in multiple sclerosis. Ann Neurol. (2010) 67:749–60. doi: 10.1002/ana.22005
63. Walter SD, Ishikawa H, Galetta KM, Sakai RE, Feller DJ, Henderson SB, et al. Ganglion cell loss in relation to visual disability in multiple sclerosis. Ophthalmology. (2012) 119:1250–7. doi: 10.1016/j.ophtha.2011.11.032
64. Reich DS, Smith SA, Gordon-Lipkin EM, Ozturk A, Caffo BS, Balcer LJ, et al. Damage to the optic radiation in multiple sclerosis is associated with retinal injury and visual disability. Arch Neurol. (2009) 66:998–1006. doi: 10.1001/archneurol.2009.107
65. Balcer LJ, Baier ML, Cohen JA, Kooijmans MF, Sandrock AW, Nano-Schiavi ML, et al. Contrast letter acuity as a visual component for the multiple sclerosis functional composite. Neurology. (2003) 61:1367–73. doi: 10.1212/01.WNL.0000094315.19931.90
66. Baier ML, Cutter GR, Rudick RA, Miller D, Cohen JA, Weinstock-Guttman B, et al. Low-contrast letter acuity testing captures visual dysfunction in patients with multiple sclerosis. Neurology. (2005) 64:992–5. doi: 10.1212/01.WNL.0000154521.40686.63
67. Giordano A, Colombo B, Spinelli EG, Gelibter S, Guerrieri S, Leocani L, et al. Progressive visual function impairment as the predominant symptom of the transition phase to secondary progressive multiple sclerosis: a case report. Mult Scler Relat Disord. (2018) 24:69–71. doi: 10.1016/j.msard.2018.06.011
68. Bsteh G, Hegen H, Ladstatter F, Berek K, Amprosi M, Wurth S, et al. Change of olfactory function as a marker of inflammatory activity and disability progression in MS. Mult Scler. (2019) 25:267–74. doi: 10.1177/1352458517745724
69. Bsteh G, Berek K, Hegen H, Teuchner B, Auer M, Wurth S, et al. Smelling multiple sclerosis: different qualities of olfactory function reflect either inflammatory activity or neurodegeneration. Mult Scler. (2020) 26:57–68. doi: 10.1177/1352458518814113
70. Silva AM, Santos E, Moreira I, Bettencourt A, Coutinho E, Goncalves A, et al. Olfactory dysfunction in multiple sclerosis: association with secondary progression. Mult Scler. (2012) 18:616–21. doi: 10.1177/1352458511427156
71. Rolet A, Magnin E, Millot JL, Berger E, Vidal C, Sileman G, et al. Olfactory dysfunction in multiple sclerosis: evidence of a decrease in different aspects of olfactory function. Eur Neurol. (2013) 69:166–70. doi: 10.1159/000345482
72. Bsteh G, Hegen H, Ladstatter F, Berek K, Amprosi M, Wurth S, et al. Transient impairment of olfactory threshold in acute multiple sclerosis relapse. Mult Scler Relat Disord. (2018) 23:74–7. doi: 10.1016/j.msard.2018.05.006
73. Lutterotti A, Vedovello M, Reindl M, Ehling R, DiPauli F, Kuenz B, et al. Olfactory threshold is impaired in early, active multiple sclerosis. Mult Scler. (2011) 17:964–9. doi: 10.1177/1352458511399798
74. Bsteh G, Hegen H, Teuchner B, Amprosi M, Berek K, Ladstatter F, et al. Peripapillary retinal nerve fibre layer as measured by optical coherence tomography is a prognostic biomarker not only for physical but also for cognitive disability progression in multiple sclerosis. Mult Scler. (2019) 25:196–203. doi: 10.1177/1352458517740216
75. Bsteh G, Steiger R, Tuovinen N, Hegen H, Berek K, Wurth S, et al. Impairment of odor discrimination and identification is associated with disability progression and gray matter atrophy of the olfactory system in MS. Mult Scler. (2020) 26:706–15. doi: 10.1177/1352458519838205
76. Carotenuto A, Costabile T, Moccia M, Falco F, Scala MR, Russo CV, et al. Olfactory function and cognition in relapsing-remitting and secondary-progressive multiple sclerosis. Mult Scler Relat Disord. (2019) 27:1–6. doi: 10.1016/j.msard.2018.09.024
77. Sastre-Garriga J, Pareto D, Rovira A. Brain atrophy in multiple sclerosis: clinical relevance and technical aspects. Neuroimaging Clin N Am. (2017) 27:289–300. doi: 10.1016/j.nic.2017.01.002
78. De Stefano N, Battaglini M, Smith SM. Measuring brain atrophy in multiple sclerosis. J Neuroimaging. (2007) 17 (Suppl. 1):10S−5S. doi: 10.1111/j.1552-6569.2007.00130.x
79. Amiri H, de Sitter A, Bendfeldt K, Battaglini M, Gandini Wheeler-Kingshott CAM, Calabrese M, et al. Urgent challenges in quantification and interpretation of brain grey matter atrophy in individual MS patients using MRI. Neuroimage Clin. (2018) 19:466–75. doi: 10.1016/j.nicl.2018.04.023
80. Smith SM, Zhang Y, Jenkinson M, Chen J, Matthews PM, Federico A, et al. Accurate, robust, and automated longitudinal and cross-sectional brain change analysis. Neuroimage. (2002) 17:479–89. doi: 10.1006/nimg.2002.1040
81. Smith SM, De Stefano N, Jenkinson M, Matthews PM. Normalized accurate measurement of longitudinal brain change. J Comput Assist Tomogr. (2001) 25:466–75. doi: 10.1097/00004728-200105000-00022
82. Smeets D, Ribbens A, Sima DM, Cambron M, Horakova D, Jain S, et al. Reliable measurements of brain atrophy in individual patients with multiple sclerosis. Brain Behav. (2016) 6:e00518. doi: 10.1002/brb3.518
83. Durand-Dubief F, Belaroussi B, Armspach JP, Dufour M, Roggerone S, Vukusic S, et al. Reliability of longitudinal brain volume loss measurements between 2 sites in patients with multiple sclerosis: comparison of 7 quantification techniques. AJNR Am J Neuroradiol. (2012) 33:1918–24. doi: 10.3174/ajnr.A3107
84. Eshaghi A, Prados F, Brownlee WJ, Altmann DR, Tur C, Cardoso MJ, et al. Deep gray matter volume loss drives disability worsening in multiple sclerosis. Ann Neurol. (2018) 83:210–22. doi: 10.1002/ana.25145
85. De Stefano N, Stromillo ML, Giorgio A, Bartolozzi ML, Battaglini M, Baldini M, et al. Establishing pathological cut-offs of brain atrophy rates in multiple sclerosis. J Neurol Neurosurg Psychiatry. (2016) 87:93–9. doi: 10.1136/jnnp-2014-309903
86. Eijlers AJC, Dekker I, Steenwijk MD, Meijer KA, Hulst HE, Pouwels PJW, et al. Cortical atrophy accelerates as cognitive decline worsens in multiple sclerosis. Neurology. (2019) 93:e1348–59. doi: 10.1212/WNL.0000000000008198
87. Steenwijk MD, Geurts JJ, Daams M, Tijms BM, Wink AM, Balk LJ, et al. Cortical atrophy patterns in multiple sclerosis are non-random and clinically relevant. Brain. (2016) 139 (Pt. 1):115–26. doi: 10.1093/brain/awv337
88. Hanninen K, Viitala M, Paavilainen T, Karhu JO, Rinne J, Koikkalainen J, et al. Thalamic atrophy predicts 5-year disability progression in multiple sclerosis. Front Neurol. (2020) 11:606. doi: 10.3389/fneur.2020.00606
89. Hanninen K, Viitala M, Paavilainen T, Karhu JO, Rinne J, Koikkalainen J, et al. Thalamic atrophy without whole brain atrophy is associated with absence of 2-year NEDA in multiple sclerosis. Front Neurol. (2019) 10:459. doi: 10.3389/fneur.2019.00459
90. Bergsland N, Zivadinov R, Dwyer MG, Weinstock-Guttman B, Benedict RH. Localized atrophy of the thalamus and slowed cognitive processing speed in MS patients. Mult Scler. (2016) 22:1327–36. doi: 10.1177/1352458515616204
91. Azevedo CJ, Cen SY, Khadka S, Liu S, Kornak J, Shi Y, et al. Thalamic atrophy in multiple sclerosis: a magnetic resonance imaging marker of neurodegeneration throughout disease. Ann Neurol. (2018) 83:223–34. doi: 10.1002/ana.25150
92. Papathanasiou A, Messinis L, Zampakis P, Papathanasopoulos P. Corpus callosum atrophy as a marker of clinically meaningful cognitive decline in secondary progressive multiple sclerosis. Impact on employment status. J Clin Neurosci. (2017) 43:170–5. doi: 10.1016/j.jocn.2017.05.032
93. Duning T, Kloska S, Steinstrater O, Kugel H, Heindel W, Knecht S. Dehydration confounds the assessment of brain atrophy. Neurology. (2005) 64:548–50. doi: 10.1212/01.WNL.0000150542.16969.CC
94. Nakamura K, Brown RA, Narayanan S, Collins DL, Arnold DL, Alzheimer's Disease Neuroimaging I. Diurnal fluctuations in brain volume: statistical analyses of MRI from large populations. Neuroimage. (2015) 118:126–32. doi: 10.1016/j.neuroimage.2015.05.077
95. Enzinger C, Fazekas F, Matthews PM, Ropele S, Schmidt H, Smith S, et al. Risk factors for progression of brain atrophy in aging: six-year follow-up of normal subjects. Neurology. (2005) 64:1704–11. doi: 10.1212/01.WNL.0000161871.83614.BB
96. De Stefano N, Airas L, Grigoriadis N, Mattle HP, O'Riordan J, Oreja-Guevara C, et al. Clinical relevance of brain volume measures in multiple sclerosis. CNS Drugs. (2014) 28:147–56. doi: 10.1007/s40263-014-0140-z
97. Zivadinov R, Raj B, Ramanathan M, Teter B, Durfee J, Dwyer MG, et al. Autoimmune comorbidities are associated with brain injury in multiple sclerosis. AJNR Am J Neuroradiol. (2016) 37:1010–6. doi: 10.3174/ajnr.A4681
98. Zivadinov R, Reder AT, Filippi M, Minagar A, Stuve O, Lassmann H, et al. Mechanisms of action of disease-modifying agents and brain volume changes in multiple sclerosis. Neurology. (2008) 71:136–44. doi: 10.1212/01.wnl.0000316810.01120.05
99. Zivadinov R, Jakimovski D, Gandhi S, Ahmed R, Dwyer MG, Horakova D, et al. Clinical relevance of brain atrophy assessment in multiple sclerosis. Implications for its use in a clinical routine. Expert Rev Neurother. (2016) 16:777–93. doi: 10.1080/14737175.2016.1181543
100. Sastre-Garriga J, Pareto D, Battaglini M, Rocca MA, Ciccarelli O, Enzinger C, et al. MAGNIMS consensus recommendations on the use of brain and spinal cord atrophy measures in clinical practice. Nat Rev Neurol. (2020) 16:171–82. doi: 10.1038/s41582-020-0314-x
101. Goldschmidt T, Antel J, Konig FB, Bruck W, Kuhlmann T. Remyelination capacity of the MS brain decreases with disease chronicity. Neurology. (2009) 72:1914–21. doi: 10.1212/WNL.0b013e3181a8260a
102. Irvine KA, Blakemore WF. Remyelination protects axons from demyelination-associated axon degeneration. Brain. (2008) 131 (Pt. 6):1464–77. doi: 10.1093/brain/awn080
103. Kutzelnigg A, Lucchinetti CF, Stadelmann C, Bruck W, Rauschka H, Bergmann M, et al. Cortical demyelination and diffuse white matter injury in multiple sclerosis. Brain. (2005) 128 (Pt. 11):2705–12. doi: 10.1093/brain/awh641
104. Frischer JM, Weigand SD, Guo Y, Kale N, Parisi JE, Pirko I, et al. Clinical and pathological insights into the dynamic nature of the white matter multiple sclerosis plaque. Ann Neurol. (2015) 78:710–21. doi: 10.1002/ana.24497
105. Prineas JW, Kwon EE, Cho ES, Sharer LR, Barnett MH, Oleszak EL, et al. Immunopathology of secondary-progressive multiple sclerosis. Ann Neurol. (2001) 50:646–57. doi: 10.1002/ana.1255
106. Chawla S, Kister I, Wuerfel J, Brisset JC, Liu S, Sinnecker T, et al. Iron and non-iron-related characteristics of multiple sclerosis and neuromyelitis optica lesions at 7T MRI. AJNR Am J Neuroradiol. (2016) 37:1223–30. doi: 10.3174/ajnr.A4729
107. Kornek B, Storch MK, Weissert R, Wallstroem E, Stefferl A, Olsson T, et al. Multiple sclerosis and chronic autoimmune encephalomyelitis: a comparative quantitative study of axonal injury in active, inactive, and remyelinated lesions. Am J Pathol. (2000) 157:267–76. doi: 10.1016/S0002-9440(10)64537-3
108. Bramow S, Frischer JM, Lassmann H, Koch-Henriksen N, Lucchinetti CF, Sorensen PS, et al. Demyelination versus remyelination in progressive multiple sclerosis. Brain. (2010) 133:2983–98. doi: 10.1093/brain/awq250
109. Dal-Bianco A, Grabner G, Kronnerwetter C, Weber M, Hoftberger R, Berger T, et al. Slow expansion of multiple sclerosis iron rim lesions: pathology and 7 T magnetic resonance imaging. Acta Neuropathol. (2017) 133:25–42. doi: 10.1007/s00401-016-1636-z
110. Elliott C, Wolinsky JS, Hauser SL, Kappos L, Barkhof F, Bernasconi C, et al. Slowly expanding/evolving lesions as a magnetic resonance imaging marker of chronic active multiple sclerosis lesions. Mult Scler. (2019) 25:1915–25. doi: 10.1177/1352458518814117
111. Absinta M, Sati P, Fechner A, Schindler MK, Nair G, Reich DS. Identification of chronic active multiple sclerosis lesions on 3T MRI. AJNR Am J Neuroradiol. (2018) 39:1233–8. doi: 10.3174/ajnr.A5660
112. Haacke EM, Makki M, Ge Y, Maheshwari M, Sehgal V, Hu J, et al. Characterizing iron deposition in multiple sclerosis lesions using susceptibility weighted imaging. J Magn Reson Imaging. (2009) 29:537–44. doi: 10.1002/jmri.21676
113. Barkhof F, Bruck W, De Groot CJ, Bergers E, Hulshof S, Geurts J, et al. Remyelinated lesions in multiple sclerosis: magnetic resonance image appearance. Arch Neurol. (2003) 60:1073–81. doi: 10.1001/archneur.60.8.1073
114. Calvi A, Haider L, Prados F, Tur C, Chard D, Barkhof F. In vivo imaging of chronic active lesions in multiple sclerosis. Mult Scler. (2020) 23:1352458520958589. doi: 10.1177/1352458520958589
115. Absinta M, Sati P, Schindler M, Leibovitch EC, Ohayon J, Wu T, et al. Persistent 7-tesla phase rim predicts poor outcome in new multiple sclerosis patient lesions. J Clin Invest. (2016) 126:2597–609. doi: 10.1172/JCI86198
116. Dal-Bianco A, Grabner G, Kronnerwetter C, Weber M, Kornek B, Kasprian G, et al. Long-term evolution of multiple sclerosis iron rim lesions in 7 T MRI. Brain. (2021) 144:833–47. doi: 10.1093/brain/awaa436
117. van Waesberghe JH, Kamphorst W, De Groot CJ, van Walderveen MA, Castelijns JA, Ravid R, et al. Axonal loss in multiple sclerosis lesions: magnetic resonance imaging insights into substrates of disability. Ann Neurol. (1999) 46:747–54. doi: 10.1002/1531-8249(199911)46:5<747::AID-ANA10>3.0.CO;2-4
118. van Walderveen MA, Kamphorst W, Scheltens P, van Waesberghe JH, Ravid R, Valk J, et al. Histopathologic correlate of hypointense lesions on T1-weighted spin-echo MRI in multiple sclerosis. Neurology. (1998) 50:1282–8. doi: 10.1212/WNL.50.5.1282
119. Absinta M, Sati P, Masuzzo F, Nair G, Sethi V, Kolb H, et al. Association of chronic active multiple sclerosis lesions with disability in vivo. JAMA Neurol. (2019) 76:1474–83. doi: 10.1001/jamaneurol.2019.2399
120. Luchetti S, Fransen NL, van Eden CG, Ramaglia V, Mason M, Huitinga I. Progressive multiple sclerosis patients show substantial lesion activity that correlates with clinical disease severity and sex: a retrospective autopsy cohort analysis. Acta Neuropathol. (2018) 135:511–28. doi: 10.1007/s00401-018-1818-y
121. Elliott C, Belachew S, Wolinsky JS, Hauser SL, Kappos L, Barkhof F, et al. Chronic white matter lesion activity predicts clinical progression in primary progressive multiple sclerosis. Brain. (2019) 142:2787–99. doi: 10.1093/brain/awz212
122. Song X, Li D, Qiu Z, Su S, Wu Y, Wang J, et al. Correlation between EDSS scores and cervical spinal cord atrophy at 3T MRI in multiple sclerosis: a systematic review and meta-analysis. Mult Scler Relat Disord. (2020) 37:101426. doi: 10.1016/j.msard.2019.101426
123. Casserly C, Seyman EE, Alcaide-Leon P, Guenette M, Lyons C, Sankar S, et al. Spinal cord atrophy in multiple sclerosis: a systematic review and meta-analysis. J Neuroimaging. (2018) 28:556–86. doi: 10.1111/jon.12553
124. Lukas C, Knol DL, Sombekke MH, Bellenberg B, Hahn HK, Popescu V, et al. Cervical spinal cord volume loss is related to clinical disability progression in multiple sclerosis. J Neurol Neurosurg Psychiatry. (2015) 86:410–8. doi: 10.1136/jnnp-2014-308021
125. Zeydan B, Gu X, Atkinson EJ, Keegan BM, Weinshenker BG, Tillema JM, et al. Cervical spinal cord atrophy: an early marker of progressive MS onset. Neurol Neuroimmunol Neuroinflamm. (2018) 5:e435. doi: 10.1212/NXI.0000000000000435
126. Lundell H, Svolgaard O, Dogonowski AM, Romme Christensen J, Selleberg F, Soelberg Sorensen P, et al. Spinal cord atrophy in anterior-posterior direction reflects impairment in multiple sclerosis. Acta Neurol Scand. (2017) 136:330–7. doi: 10.1111/ane.12729
127. Rocca MA, Valsasina P, Meani A, Gobbi C, Zecca C, Rovira A, et al. Clinically relevant cranio-caudal patterns of cervical cord atrophy evolution in MS. Neurology. (2019) 93:e1852–e66. doi: 10.1212/WNL.0000000000008466
128. Moccia M, Ruggieri S, Ianniello A, Toosy A, Pozzilli C, Ciccarelli O. Advances in spinal cord imaging in multiple sclerosis. Ther Adv Neurol Disord. (2019) 12:1756286419840593. doi: 10.1177/1756286419840593
129. Biberacher V, Boucard CC, Schmidt P, Engl C, Buck D, Berthele A, et al. Atrophy and structural variability of the upper cervical cord in early multiple sclerosis. Mult Scler. (2015) 21:875–84. doi: 10.1177/1352458514546514
130. Losseff NA, Webb SL, O'Riordan JI, Page R, Wang L, Barker GJ, et al. Spinal cord atrophy and disability in multiple sclerosis. A new reproducible and sensitive MRI method with potential to monitor disease progression. Brain. (1996) 119 (Pt. 3):701–8. doi: 10.1093/brain/119.3.701
131. Daams M, Weiler F, Steenwijk MD, Hahn HK, Geurts JJ, Vrenken H, et al. Mean upper cervical cord area (MUCCA) measurement in long-standing multiple sclerosis: relation to brain findings and clinical disability. Mult Scler. (2014) 20:1860–5. doi: 10.1177/1352458514533399
132. Kim G, Khalid F, Oommen VV, Tauhid S, Chu R, Horsfield MA, et al. T1- vs. T2-based MRI measures of spinal cord volume in healthy subjects and patients with multiple sclerosis. BMC Neurol. (2015) 15:124. doi: 10.1186/s12883-015-0387-0
133. Liu Z, Yaldizli O, Pardini M, Sethi V, Kearney H, Muhlert N, et al. Cervical cord area measurement using volumetric brain magnetic resonance imaging in multiple sclerosis. Mult Scler Relat Disord. (2015) 4:52–7. doi: 10.1016/j.msard.2014.11.004
134. Britze J, Frederiksen JL. Optical coherence tomography in multiple sclerosis. Eye. (2018) 32:884–8. doi: 10.1038/s41433-017-0010-2
135. Saidha S, Sotirchos ES, Oh J, Syc SB, Seigo MA, Shiee N, et al. Relationships between retinal axonal and neuronal measures and global central nervous system pathology in multiple sclerosis. JAMA Neurol. (2013) 70:34–43. doi: 10.1001/jamaneurol.2013.573
136. Petzold A, Balcer LJ, Calabresi PA, Costello F, Frohman TC, Frohman EM, et al. Retinal layer segmentation in multiple sclerosis: a systematic review and meta-analysis. Lancet Neurol. (2017) 16:797–812. doi: 10.1016/S1474-4422(17)30278-8
137. Seigo MA, Sotirchos ES, Newsome S, Babiarz A, Eckstein C, Ford E, et al. In vivo assessment of retinal neuronal layers in multiple sclerosis with manual and automated optical coherence tomography segmentation techniques. J Neurol. (2012) 259:2119–30. doi: 10.1007/s00415-012-6466-x
138. Wu H, de Boer JF, Chen TC. Reproducibility of retinal nerve fiber layer thickness measurements using spectral domain optical coherence tomography. J Glaucoma. (2011) 20:470–6. doi: 10.1097/IJG.0b013e3181f3eb64
139. Pemp B, Kardon RH, Kircher K, Pernicka E, Schmidt-Erfurth U, Reitner A. Effectiveness of averaging strategies to reduce variance in retinal nerve fibre layer thickness measurements using spectral-domain optical coherence tomography. Graefes Arch Clin Exp Ophthalmol. (2013) 251:1841–8. doi: 10.1007/s00417-013-2337-0
140. Wadhwani M, Bali SJ, Satyapal R, Angmo D, Sharma R, Pandey V, et al. Test-retest variability of retinal nerve fiber layer thickness and macular ganglion cell-inner plexiform layer thickness measurements using spectral-domain optical coherence tomography. J Glaucoma. (2015) 24:e109–15. doi: 10.1097/IJG.0000000000000203
141. Britze J, Pihl-Jensen G, Frederiksen JL. Retinal ganglion cell analysis in multiple sclerosis and optic neuritis: a systematic review and meta-analysis. J Neurol. (2017) 264:1837–53. doi: 10.1007/s00415-017-8531-y
142. Winges KM, Murchison CF, Bourdette DN, Spain RI. Longitudinal optical coherence tomography study of optic atrophy in secondary progressive multiple sclerosis: results from a clinical trial cohort. Mult Scler. (2019) 25:55–62. doi: 10.1177/1352458517739136
143. Saidha S, Al-Louzi O, Ratchford JN, Bhargava P, Oh J, Newsome SD, et al. Optical coherence tomography reflects brain atrophy in multiple sclerosis: a four-year study. Ann Neurol. (2015) 78:801–13. doi: 10.1002/ana.24487
144. Martinez-Lapiscina EH, Arnow S, Wilson JA, Saidha S, Preiningerova JL, Oberwahrenbrock T, et al. Retinal thickness measured with optical coherence tomography and risk of disability worsening in multiple sclerosis: a cohort study. Lancet Neurol. (2016) 15:574–84. doi: 10.1016/S1474-4422(16)00068-5
145. Narayanan D, Cheng H, Bonem KN, Saenz R, Tang RA, Frishman LJ. Tracking changes over time in retinal nerve fiber layer and ganglion cell-inner plexiform layer thickness in multiple sclerosis. Mult Scler. (2014) 20:1331–41. doi: 10.1177/1352458514523498
146. Bsteh G, Berek K, Hegen H, Altmann P, Wurth S, Auer M, et al. Macular ganglion cell-inner plexiform layer thinning as a biomarker of disability progression in relapsing multiple sclerosis. Mult Scler. (2020) 27:684–94. doi: 10.1177/1352458520935724
147. Oberwahrenbrock T, Schippling S, Ringelstein M, Kaufhold F, Zimmermann H, Keser N, et al. Retinal damage in multiple sclerosis disease subtypes measured by high-resolution optical coherence tomography. Mult Scler Int. (2012) 2012:530305. doi: 10.1155/2012/530305
148. Bsteh G, Hegen H, Teuchner B, Berek K, Wurth S, Auer M, et al. Peripapillary retinal nerve fibre layer thinning rate as a biomarker discriminating stable and progressing relapsing-remitting multiple sclerosis. Eur J Neurol. (2019) 26:865–71. doi: 10.1111/ene.13897
149. Kupersmith MJ, Garvin MK, Wang JK, Durbin M, Kardon R. Retinal ganglion cell layer thinning within one month of presentation for non-arteritic anterior ischemic optic neuropathy. Invest Ophthalmol Vis Sci. (2016) 57:3588–93. doi: 10.1167/iovs.15-18736
150. Serbecic N, Aboul-Enein F, Beutelspacher SC, Graf M, Kircher K, Geitzenauer W, et al. Heterogeneous pattern of retinal nerve fiber layer in multiple sclerosis. High resolution optical coherence tomography: potential and limitations. PLoS ONE. (2010) 5:e13877. doi: 10.1371/journal.pone.0013877
151. Kim JS, Ishikawa H, Sung KR, Xu J, Wollstein G, Bilonick RA, et al. Retinal nerve fibre layer thickness measurement reproducibility improved with spectral domain optical coherence tomography. Br J Ophthalmol. (2009) 93:1057–63. doi: 10.1136/bjo.2009.157875
152. Khalil M, Teunissen CE, Otto M, Piehl F, Sormani MP, Gattringer T, et al. Neurofilaments as biomarkers in neurological disorders. Nat Rev Neurol. (2018) 14:577–89. doi: 10.1038/s41582-018-0058-z
153. Disanto G, Barro C, Benkert P, Naegelin Y, Schadelin S, Giardiello A, et al. Serum neurofilament light: a biomarker of neuronal damage in multiple sclerosis. Ann Neurol. (2017) 81:857–70. doi: 10.1002/ana.24954
154. Novakova L, Zetterberg H, Sundstrom P, Axelsson M, Khademi M, Gunnarsson M, et al. Monitoring disease activity in multiple sclerosis using serum neurofilament light protein. Neurology. (2017) 89:2230–7. doi: 10.1212/WNL.0000000000004683
155. Bhan A, Jacobsen C, Myhr KM, Dalen I, Lode K, Farbu E. Neurofilaments and 10-year follow-up in multiple sclerosis. Mult Scler. (2018) 24:1301–7. doi: 10.1177/1352458518782005
156. Ferrazzano G, Crisafulli SG, Baione V, Tartaglia M, Cortese A, Frontoni M, et al. Early diagnosis of secondary progressive multiple sclerosis: focus on fluid and neurophysiological biomarkers. J Neurol. (2020). doi: 10.1007/s00415-020-09964-4. [Epub ahead of print].
157. Kuhle J, Kropshofer H, Haering DA, Kundu U, Meinert R, Barro C, et al. Blood neurofilament light chain as a biomarker of MS disease activity and treatment response. Neurology. (2019) 92:e1007–15. doi: 10.1212/WNL.0000000000007032
158. Barro C, Benkert P, Disanto G, Tsagkas C, Amann M, Naegelin Y, et al. Serum neurofilament as a predictor of disease worsening and brain and spinal cord atrophy in multiple sclerosis. Brain. (2018) 141:2382–91. doi: 10.1093/brain/awy154
159. Sellebjerg F, Royen L, Soelberg Sorensen P, Oturai AB, Jensen PEH. Prognostic value of cerebrospinal fluid neurofilament light chain and chitinase-3-like-1 in newly diagnosed patients with multiple sclerosis. Mult Scler. (2019) 25:1444–51. doi: 10.1177/1352458518794308
160. Ferraro D, Guicciardi C, De Biasi S, Pinti M, Bedin R, Camera V, et al. Plasma neurofilaments correlate with disability in progressive multiple sclerosis patients. Acta Neurol Scand. (2020) 141:16–21. doi: 10.1111/ane.13152
161. Khalil M, Pirpamer L, Hofer E, Voortman MM, Barro C, Leppert D, et al. Serum neurofilament light levels in normal aging and their association with morphologic brain changes. Nat Commun. (2020) 11:812. doi: 10.1038/s41467-020-14612-6
162. Yang Z, Wang KK. Glial fibrillary acidic protein: from intermediate filament assembly and gliosis to neurobiomarker. Trends Neurosci. (2015) 38:364–74. doi: 10.1016/j.tins.2015.04.003
163. Williams A, Piaton G, Lubetzki C. Astrocytes–friends or foes in multiple sclerosis? Glia. (2007) 55:1300–12. doi: 10.1002/glia.20546
164. Correale J, Farez MF. The role of astrocytes in multiple sclerosis progression. Front Neurol. (2015) 6:180. doi: 10.3389/fneur.2015.00180
165. Sofroniew MV, Vinters HV. Astrocytes: biology and pathology. Acta Neuropathol. (2010) 119:7–35. doi: 10.1007/s00401-009-0619-8
166. Kalatha T, Hatzifilippou E, Arnaoutoglou M, Balogiannis S, Koutsouraki E. Glial and neuroaxonal biomarkers in a multiple sclerosis (MS) cohort. Hell J Nucl Med. (2019) 22 (Suppl. 2):113–21.
167. Novakova L, Axelsson M, Malmestrom C, Imberg H, Elias O, Zetterberg H, et al. Searching for neurodegeneration in multiple sclerosis at clinical onset: diagnostic value of biomarkers. PLoS ONE. (2018) 13:e0194828. doi: 10.1371/journal.pone.0194828
168. Axelsson M, Malmestrom C, Nilsson S, Haghighi S, Rosengren L, Lycke J. Glial fibrillary acidic protein: a potential biomarker for progression in multiple sclerosis. J Neurol. (2011) 258:882–8. doi: 10.1007/s00415-010-5863-2
169. Hogel H, Rissanen E, Barro C, Matilainen M, Nylund M, Kuhle J, et al. Serum glial fibrillary acidic protein correlates with multiple sclerosis disease severity. Mult Scler. (2020) 26:210–9. doi: 10.1177/1352458518819380
170. Abdelhak A, Huss A, Kassubek J, Tumani H, Otto M. Serum GFAP as a biomarker for disease severity in multiple sclerosis. Sci Rep. (2018) 8:14798. doi: 10.1038/s41598-018-33158-8
171. Piccio L, Buonsanti C, Cella M, Tassi I, Schmidt RE, Fenoglio C, et al. Identification of soluble TREM-2 in the cerebrospinal fluid and its association with multiple sclerosis and CNS inflammation. Brain. (2008) 131 (Pt. 11):3081–91. doi: 10.1093/brain/awn217
172. Inojosa H, Proschmann U, Akgun K, Ziemssen T. A focus on secondary progressive multiple sclerosis (SPMS): challenges in diagnosis and definition. J Neurol. (2019) 268:1210–21. doi: 10.1007/s00415-019-09489-5
173. Abdelhak A, Hottenrott T, Morenas-Rodriguez E, Suarez-Calvet M, Zettl UK, Haass C, et al. Glial activation markers in CSF and serum from patients with primary progressive multiple sclerosis: potential of serum GFAP as disease severity marker? Front Neurol. (2019) 10:280. doi: 10.3389/fneur.2019.00280
174. Canto E, Tintore M, Villar LM, Costa C, Nurtdinov R, Alvarez-Cermeno JC, et al. Chitinase 3-like 1: prognostic biomarker in clinically isolated syndromes. Brain. (2015) 138 (Pt. 4):918–31. doi: 10.1093/brain/awv017
175. Bonneh-Barkay D, Zagadailov P, Zou H, Niyonkuru C, Figley M, Starkey A, et al. YKL-40 expression in traumatic brain injury: an initial analysis. J Neurotrauma. (2010) 27:1215–23. doi: 10.1089/neu.2010.1310
176. Hinsinger G, Galeotti N, Nabholz N, Urbach S, Rigau V, Demattei C, et al. Chitinase 3-like proteins as diagnostic and prognostic biomarkers of multiple sclerosis. Mult Scler. (2015) 21:1251–61. doi: 10.1177/1352458514561906
177. Bonneh-Barkay D, Wang G, Starkey A, Hamilton RL, Wiley CA. In vivo CHI3L1 (YKL-40) expression in astrocytes in acute and chronic neurological diseases. J Neuroinflammation. (2010) 7:34. doi: 10.1186/1742-2094-7-34
178. Gil-Perotin S, Castillo-Villalba J, Cubas-Nunez L, Gasque R, Hervas D, Gomez-Mateu J, et al. Combined cerebrospinal fluid neurofilament light chain protein and chitinase-3 like-1 levels in defining disease course and prognosis in multiple sclerosis. Front Neurol. (2019) 10:1008. doi: 10.3389/fneur.2019.01008
179. Canto E, Reverter F, Morcillo-Suarez C, Matesanz F, Fernandez O, Izquierdo G, et al. Chitinase 3-like 1 plasma levels are increased in patients with progressive forms of multiple sclerosis. Mult Scler. (2012) 18:983–90. doi: 10.1177/1352458511433063
180. Burman J, Raininko R, Blennow K, Zetterberg H, Axelsson M, Malmestrom C. YKL-40 is a CSF biomarker of intrathecal inflammation in secondary progressive multiple sclerosis. J Neuroimmunol. (2016) 292:52–7. doi: 10.1016/j.jneuroim.2016.01.013
Keywords: multiple sclerosis, progression, neurodegeneration, biomarkers, brain atrophy, neurofilaments, optical coherence tomography
Citation: Krajnc N, Bsteh G and Berger T (2021) Clinical and Paraclinical Biomarkers and the Hitches to Assess Conversion to Secondary Progressive Multiple Sclerosis: A Systematic Review. Front. Neurol. 12:666868. doi: 10.3389/fneur.2021.666868
Received: 11 February 2021; Accepted: 06 July 2021;
Published: 26 August 2021.
Edited by:
Letizia Leocani, San Raffaele Hospital (IRCCS), ItalyReviewed by:
Alice Mariottini, University of Florence, ItalyCopyright © 2021 Krajnc, Bsteh and Berger. This is an open-access article distributed under the terms of the Creative Commons Attribution License (CC BY). The use, distribution or reproduction in other forums is permitted, provided the original author(s) and the copyright owner(s) are credited and that the original publication in this journal is cited, in accordance with accepted academic practice. No use, distribution or reproduction is permitted which does not comply with these terms.
*Correspondence: Gabriel Bsteh, Z2FicmllbC5ic3RlaEBtZWR1bml3aWVuLmFjLmF0
Disclaimer: All claims expressed in this article are solely those of the authors and do not necessarily represent those of their affiliated organizations, or those of the publisher, the editors and the reviewers. Any product that may be evaluated in this article or claim that may be made by its manufacturer is not guaranteed or endorsed by the publisher.
Research integrity at Frontiers
Learn more about the work of our research integrity team to safeguard the quality of each article we publish.