
94% of researchers rate our articles as excellent or good
Learn more about the work of our research integrity team to safeguard the quality of each article we publish.
Find out more
ORIGINAL RESEARCH article
Front. Neurol., 20 May 2021
Sec. Neuro-Otology
Volume 12 - 2021 | https://doi.org/10.3389/fneur.2021.658053
This article is part of the Research TopicNystagmus in Vestibular and Cerebellar DisordersView all 6 articles
 William V. C. Figtree1
 Jasmine C. Menant2,3
 Allan T. Chau1,3Patrick P. Hübner1,3
 Stephen R. Lord2,3
 Americo A. Migliaccio1,3,4,5*†
People aged over 50 are the most likely to present to a physician for dizziness. It is important to identify the main cause of dizziness in order to develop the best treatment approach. Our goal was to determine the prevalence of benign paroxysmal positional vertigo (BPPV), and peripheral and central vestibular function in people that had experienced dizziness within the past year aged over 50. One hundred and ninety three community-dwelling participants aged 51–92 (68 ± 8.7 years; 117 females) were tested using the clinical and video head impulse test (cHIT and vHIT) to test high-frequency vestibular organ function; the head thrust dynamic visual acuity (htDVA) test to test high-frequency visual-stability; the dizziness handicap inventory (DHI) to measure the impact of dizziness; as well as sinusoidal and unidirectional rotational chair testing to test low- to mid-frequency peripheral and central vestibular function. From these assessments we computed the following measures: HIT gain; htDVA score; DHI score; sinusoidal (whole-body; 0.1–2 Hz with 30°/s peak-velocity) vestibulo-ocular reflex (VOR) gain and phase; transient (whole-body, 150°/s2 acceleration to 50°/s constant velocity) VOR gain and time constant; optokinetic nystagmus (OKN) gain and time constant (whole-body, 50°/s constant velocity rotation). Our study showed that BPPV, and peripheral or central vestibular hypofunction were present in 34% of participants, suggesting a vestibular cause to their dizziness. Over half (57%) of these with a likely vestibular cause had BPPV, which is more than twice the percentage reported in other dizzy clinic studies. Our findings suggest that the physical DHI score and VOR time constant were best at detecting those with non-BPPV vestibular loss, but should always be used in conjunction with cHIT or vHIT, and that the htDVA score and vHIT gain were best at detecting differences between ipsilesional and contralesional sides.
The vestibular system plays a key role in maintaining balance, stable gait, and stable vision during head movement via the vestibulo-ocular reflex (VOR). Vestibular disorders result in dizziness and imbalance, which contributes to an increased risk of falls and associated morbidity (1–4). Typically, injury to the vestibular system is localized to the peripheral vestibular organ and nerve, whereas aging is thought to affect the complete vestibular system including the vestibular nuclei of the brainstem with their commissural connections and the vestibulo cerebellum and associated pathways (5). Although neural changes due to aging have been observed within the vestibular system, it is not clear whether they directly correspond to behavioral changes in dizziness, imbalance, gait, falls, and visual instability during head movement (6, 7). For example, the prevalence of imbalance and dizziness in the elderly is ~30% (8); however, it is not clear whether that figure is mainly due to vestibular, psychological, muscular, or cardiovascular causes. The few studies that have examined the contributory causes of dizziness report contrasting findings [e.g., (9)]. Studies that have investigated the prevalence of vestibular impairment among people with dizziness have all been predominantly in a primary care setting and /or specialist ENT clinics; little data are available on the prevalence of vestibular causes of dizziness among an older community-dwelling population. This is an important issue to address because identifying the primary cause leads to targeted and effective rehabilitation, e.g., vestibular rehabilitation has been shown to improve the quality of life of patients suffering from imbalance and dizziness (10). Improvements in identifying these people are important so that they can receive timely rehabilitation treatment and potentially avoid further debilitating and life-threatening injuries.
We recently reported findings for 76 participants over the age of 50 who experienced significant dizziness within the past year (11)—the age group most likely to present to a physician with dizziness (1). That report revealed 38% of participants had a detectable peripheral vestibular disorder (29/76) and 1% a central vestibular disorder (1/76) that was the likely cause of their dizziness. Of those with a vestibular cause, 63% (19/30) had benign paroxysmal positional vertigo (BPPV), which was higher than previously reported—~25% in dizzy clinic populations (12, 13). Head thrust dynamic visual acuity (htDVA; 10) and sinusoidal (particularly 0.5–1 Hz) and transient VOR testing were identified as the most effective tests for detecting people with BPPV or vestibular hypofunction, whereas optokinetic nystagmus (OKN) testing and the dizziness handicap inventory (DHI) were only effective in detecting non-BPPV vestibular hypofunction (11).
A limitation of the Chau et al. (11) study was the small sample size. The present study builds on that work with data from an additional 117 participants. Here we aim to better: (i) identify the prevalence of BPPV, and peripheral and central vestibular hypofunction in people over the age of 50 who have experienced significant dizziness within the past year; (ii) compare performance in the DHI questionnaire and clinical tests of vestibular function between three vestibular status groups (vestibular “Lesion,” “BPPV,” or “Non-vestibular”) as decided by an expert panel and; (iii) determine the relationship between these test measures and age. For the tests that show a significant difference between Lesion and Non-vestibular group measures, thresholds are calculated and the sensitivity and specificity of the test are reported.
We studied 193 people with self-reported dizziness who had experienced at least one significant dizziness episode within the past year; 117 females and 76 males, aged 51–92 years old (mean = 68 ± 8.7). These were consecutive participants drawn from a larger sample of 305 people involved in a randomized-controlled trial of dizziness intervention (14). Recruitment methods and inclusion/exclusion criteria were identical to those we previously reported (11). In brief, participants were included if they experienced dizziness not currently treated (self-reported), lived independently in the community or a retirement village, and were aged at least 50 years. Participants were excluded if they experienced severe depressive symptoms or anxiety, a degenerative neurological condition, cognitive impairment, or a condition that required urgent treatment. All participants gave written and informed consent prior to participating in the study and the experimental protocol was approved by the Human Research Ethics Committee at the University of New South Wales.
Participants first filled in a questionnaire about their dizziness history; it comprised a mix of dichotomous and open-ended questions about dizziness symptoms, the first time they experienced dizziness, most recent event, and the results of any medical investigations conducted. They then underwent tests in the following order: cardiovascular, clinical vestibular (eye examination, smooth pursuit, skew deviation, head-shaking nystagmus, clinical head impulse testing, Dix-Hallpike and roll test), walking trials, choice-stepping reaction time, physiological profile assessment, balance, and laboratory vestibular tests (video head impulse test, head thrust dynamic visual acuity, rotary chair testing). The present study focuses on presenting the results of the clinical and laboratory vestibular tests.
Orthostatic hypotension was assessed with the tilt-table test (15). Orthostatic hypotension was defined as a reduction of 20 mmHg or more in systolic blood pressure or to ≤90 mmHg within 3 min of tilting (16). Delayed orthostatic hypotension was defined as a reduction of 20 mmHg or more in systolic blood pressure or of 10 mmHg or more in diastolic blood pressure after 3 min of upright tilt (17). Participants also undertook an electrocardiogram, which was reviewed by a medical doctor for the presence of any abnormality (e.g., arrhythmia) (16).
Anxiety was measured using the Generalized Anxiety Disorder 7 Item Scale (score ≥8 indicates clinically significant symptoms) (18) and depression using the Patient Health Questionnaire 9 Item Scale (score ≥10 indicates clinically significant symptoms) (19).
Participants were assessed using the Short-Form Physiological Profile Assessment, which comprises five tests evaluating important functions of the human balance system: peripheral sensation, visual contrast sensitivity, lower limb strength, simple reaction time, and postural sway. Descriptions of the apparatus, procedures, and test–retest reliability for these tests are reported elsewhere (20). Participants also completed tests of: touch sensitivity at the lateral malleolus and first metatarsophalangeal joint using aesthesiometers (20) and controlled leaning balance using the coordinated stability test (21) in which a score ≥15 error points indicates impaired dynamic balance (22).
Vestibular testing took 2–3 h to complete for each participant. The last dizziness episode was categorized for each participant into six time periods: test day [prior to testing], last week, last month, last 3 months, last 6 months, or last year. The percentage (or ratio) of subjects within their group experiencing dizziness was calculated for each time period. Participants completed the Dizziness Handicap Inventory (DHI) (23), followed by Dix-Hallpike and roll testing to detect BBPV (24), the clinical head impulse test (cHIT) was deemed positive when the abnormal presence of corrective saccades was detected by the operator during the vestibulo-ocular reflex (VOR) head impulse response, and was negative otherwise. The video head impulse test (vHIT) was used to measure the VOR gain (eye/head velocity) during head impulses (high-frequency i.e., 2–3 Hz), and dynamic visual acuity testing was used to measure visual acuity during head impulses in all three semicircular canal planes (also known as head thrusts, i.e., htDVA). To help with data interpretation htDVA scores were classified as Normal [≤ 0.158 LogMAR, i.e., ≤2 SDs from normal mean, see (25)], Borderline (>0.158 and ≤0.316, 2–4 SDs), and Abnormal (> 0.316). In addition, rotary chair testing was performed to measure the low- to mid-frequency (0.1–2 Hz) VOR and visual VOR (VVOR) gains and phases. Rotary chair testing was also used to measure the transient VOR (in response to an acceleration step), optokinetic nystgamus (OKN) gains and time constants. All test methods and processing are identical to those described in Chau et al. (11). The only additional test included in this study was vHIT with head impulses in the horizontal canal plane, which was performed in the last 87 participants.
Angular head velocity and left eye rotations were measured using the EyeSeeCam video-oculography goggle system (Denmark) using the same methods as previously described in detail (26, 27). In brief, the EyeSeeCam system measures head velocity and eye position at a sample rate of 220 Hz. The digital video camera, infra-red mirror, and inertial measurement unit are rigidly mounted onto a lightweight swim goggle frame securely placed on the subject's head. Subjects were asked to fixate visual targets at known angles to calibrate horizontal and vertical eye position. After differentiating calibrated eye position, head and eye velocity data were digitally filtered with a 50-tap zero-phase low pass FIR filter with a bandwidth of 50 Hz.
The passive head impulse test was used to measure leftward and rightward head rotation VOR responses (28). A head impulse consists of a horizontal, unidirectional (leftward or rightward in randomized order) head rotation with ~200 ms duration, ~10° peak amplitude, ~150°/s peak velocity, and ~3,000°/s2 peak acceleration. The onset of each head impulse was determined by fitting the magnitude of horizontal head velocity to a polynomial curve vs. time. The impulse onset was defined as the time where the magnitude of the fitted curve was >2% of the curve's peak magnitude. Head impulses with peak magnitude lower than 150°/s or >300°/s were removed from the analysis. Eye (and corresponding head) traces with blinks or other artifacts were also not included. The VOR gain at each sample point during the 30 ms period immediately prior to peak head impulse velocity (corresponding to 6–7 gain values at 220 Hz sample rate) was calculated as the magnitude of eye velocity divided by head velocity. We reported the VOR gain as the median of those gains (27).
A geriatrician, vestibular physiotherapist, vestibular scientist, and psychologist together evaluated each participant's medical history and performance on a range of psychological questionnaires as well as physiological tests including the vestibular tests outlined above (14). Each participant was allocated to a group depending on the likely cause of dizziness: vestibular hypofunction, which would make them suitable for vestibular rehabilitation exercises (vestibular “Lesion” group); BPPV, which would make them suitable for Epley maneuver treatment (“BPPV” group); and those with non-vestibular cause (“Non-vestibular” group).
Statistical analysis was performed using SPSS version 23 (IBM, USA) and Excel 2013 (Microsoft, USA) software. A mixed-design analysis of variance (ANOVA) with two-, three-, and four-factor interactions was used to analyze the data (29). For sinusoidal VOR gain and phase analysis the independent ANOVA variables were: test frequency (frequency: 0.1, 0.2, 0.4, 0.5, 0.8, 1, 1.6, and 2 Hz), test type (test: “VVOR” or “VOR”), and participant vestibular rehabilitation group (group: “Lesion,” “Non-vestibular,” or “BPPV”). For transient VOR gain and time constant analysis, the independent variables were: vestibular stimulus type (stimulus: “excitatory,” “inhibitory”) and how it was applied with respect to the lesion side (same side: “yes” or “no”) and “group,” whereas for OKN gain and time constant analysis the variables were: “same side” and “group.” For htDVA score analysis the variables were: canal (canal: “horizontal,” “anterior,” and “posterior”), “same side” and “group,” whereas for total physical, total emotional, total functional, and grand total DHI scores the only variable was “group.” Participant age was a covariate in all ANOVAs. Variables with ≥95% confidence were reported as 5% significant, and those with 90–95% confidence as close to 5% significance trends. Effect size η2 for ANOVA, was reported as Small 0.005–0.05, Medium 0.05–0.125, or Large >0.125; and effect size cohen-d for z-test (to compare proportions), was reported as Small 0.15–0.45, Medium 0.45–0.75, or Large > 0.75 (30). The correlation co-efficient was also calculated between test measures and reported as the Pearson product-moment correlation r with a value between −1 to +1, with |r| closer to 1 indicating higher correlation.
Of the 193 participants, 126 (68 female, 58 male) were allocated to the Non-vestibular group, 39 (32 female, seven male) to the BPPV group, and 28 (17 female, 11 male) to the Lesion group. There was no difference in mean (±SD) ages between the Non-vestibular (67.6 ± 8.8 years), BPPV (69.8 ± 8.2 years), and Lesion (66.8 ± 9.3 years) groups (ANOVA: “group” variable, P = 0.946, η2 = 0.001).
For the Non-vestibular group, 25 participants experienced a dizzy episode on the day of testing (prior to testing), 41 in the last week, 33 in the last month, 13 in the last 3 months, nine in the last 6 months, and one in the last year. For the BPPV group, 12 on the day, 14 in the last week, six in the last month, three in the last 3 months, and four in the last 6 months. For the Lesion group, six on the day, eight in the last week, six in the last month, three in the past 3 months, two in the last 6 months, and two in the past year. The maximum difference in percentage between two groups across all time periods was on the day of testing between the Non-vestibular (25/126 = 19.8%) and BBPV (12/39 = 30.8%) groups. However, this 11% difference was not significant (z-test: P = 0.157, cohen-d = 0.111), suggesting that there was no difference between the distribution of dizziness episodes over time between groups.
Dix-Hallpike testing in the 39 participants with BPPV revealed: 9 had upbeat left torsional nystagmus during left posterior canal testing only; 16 had upbeat right torsional nystagmus during right posterior canal testing only; 10 had upbeat left torsional nystagmus during left posterior canal testing and upbeat right torsional nystagmus during right posterior canal testing; three had horizontal nystagmus during right horizontal canal testing; and one had persistent horizontal nystagmus during left horizontal canal testing suggesting cupuloliathisis. Nystagmus did not persist in 38/39 participants with BPPV suggesting canalithiasis. Head movement was a clear trigger for dizziness (spinning sensation) for 30/39 participants with BPPV.
Of the 126 participants classified in the Non-vestibular group, 49 did not exhibit any abnormal results in any of the assessments. Of the remaining 77 participants, nearly half of them exhibited multiple dizziness-related deficits/factors as reflected by the therapies recommended for them [see (14)]. Regarding psychiatric etiologies, 12 participants showed clinically significant symptoms of anxiety (Generalized Anxiety Disorder 7 item (GAD-7) scale score >7) and 14 showed clinically significant symptoms of depression (Patient Health Questionnaire 9 item (PHQ-9) score >9). Regarding cardiovascular problems, 21 participants exhibited orthostatic hypotension on the tilt table test, and 8 exhibited delayed orthostatic hypotension. Three participants had low blood pressure and six had an abnormal electrocardiogram. Twenty participants had poor balance whereby they were unable to stand for 30 s on a foam mat with eyes closed (postural sway on foam eyes closed) and/or had poor leaning and coordinated balance (coordinated stability score ≥15 points). Seven participants had poor touch sense on the feet (lateral malleolus/1st metatarsophalangeal joint filament ≥6) and /or knee position sense (error in foot matching task >5 degrees). Two participants had suspected vestibular migraines based on history.
Of the 28 participants classified in the Lesion group, one had a history of idiopathic labyrinth failure diagnosed from an MRI, two had suspected history of Mal de Debarquement, two had suspected Meniere's disease, five had history of hypofunction from suspected viral origin, three had nil findings from specialist investigations (ENT, Neurologist, negative MRI), four had no specific diagnosis established from specialist vestibular investigations (ENT, Neurologist, negative MRI), one was prescribed antidepressants by a neurologist, seven had no history of investigations beyond consulting a GP, and three had a history of migraines without any further investigations. Half of the participants (n = 14) reported tinnitus and /or aural fullness.
cHIT was performed in 165/193 participants. Muscle stiffness or pain when moving their head preventing the other 28 from being tested. Figure 1 shows the histogram of cHIT results binned as Positive or Negative vs. age (with 5-years bands). The proportion of participants with positive cHIT decreased with age. Linear regression analysis revealed that the proportion decreased by 0.04 every 5 years after age 50 from 0.42 (R2 = 0.44; constant = 0.416, t = 3.94, P < 0.01, slope co-efficient = −0.044, t = −2.34, P < 0.05). The cHIT was positive in 17/106 participants in the Non-vestibular group, 11/32 participants in the BPPV group, and 10/27 participants in the Lesion group. There were significant differences in these proportions between the Non-vestibular and Lesion groups (z-test: P < 0.02, cohen-d = 0.210), and Non-vestibular and BPPV groups (z-test: P < 0.05, cohen-d = 0.192), but not between the Lesion and BPPV groups (z-test: P = 0.834, cohen-d = 0.026). cHIT sensitivity (true positives) was 0.37 (10/27) and specificity (true negatives) was 0.84 (89/106).
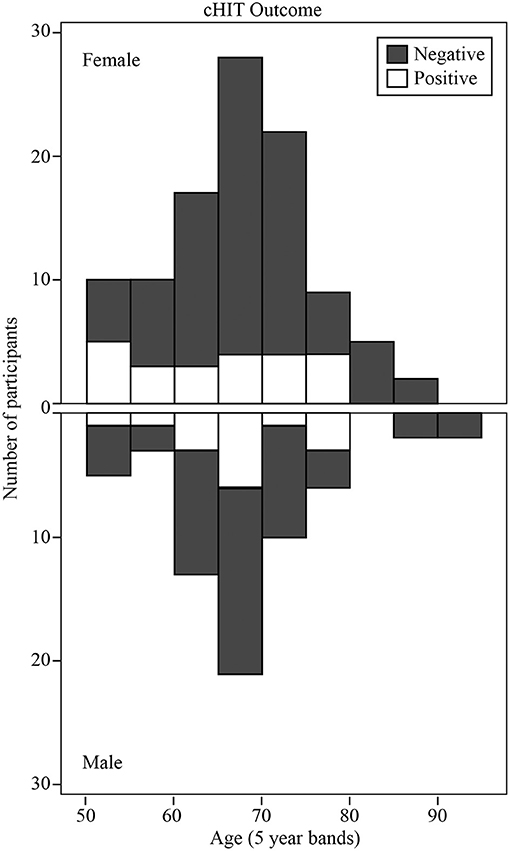
Figure 1. Histogram of clinical Head Impulse Test (cHIT) results binned as Positive or Negative vs. age (with 5-years bands).
The vHIT was performed in the last 87 participants (13 Lesion, 14 BPPV, and 60 Non-vestibular). There was a significance difference in vHIT gain between ipsilesional and contralesional head rotations [ANOVA: same side, F (1, 289) = 5.74, P < 0.02, η2 = 0.02]. The mean gains toward the ipsilesional and contralesional sides were, respectively 0.92 ± 0.26 and 1.03 ± 0.12. Figure 2 shows the minimum (between leftward and rightward) vHIT VOR gain calculated for each participant vs. their age, clustered by group with group and overall line-fits. There was no significant difference between group line-fits [ANOVA: group, F(2, 86) =0.34, P = 0.72, η2 = 0.08; group * age covariate, F(2, 86) = 0.62, P = 0.54, η2 = 0.015]. Similarly, age did not significantly affect the vHIT gain [ANOVA: age covariate, F(1, 86) = 2.22, P = 0.14, η2 = 0.027]. Out of the six gains ≤ 0.75, 5 (83%) were ipsilesional (for 3 Lesion and 2 BPPV group participants), whereas eight out of the nine gains between 0.75 and 0.90 were contralesional, suggesting that a gain threshold of 0.75 was optimal for peripheral organ lesion detection for these participants. Using the minimum vHIT gain (per subject) and 0.75 as the threshold vHIT, the sensitivity and specificity were, respectively, 0.23 (3/13) and 0.98 (59/60).

Figure 2. Minimum (between leftward and rightward head rotations) video Head Impulse Test (vHIT) vestibulo-ocular reflex (VOR) gain calculated for each participant vs. their age, clustered by group with group and overall line-fits.
Mean htDVA scores for Non-vestibular, BPPV, and Lesion groups as well as the proportion of participants classified as Normal, Borderline, and Abnormal are shown in Table 1. The factors that affected the htDVA score were age [ANOVA: age covariate, F(1, 942) = 155.72, P < 0.001, η2 = 0.144], canal tested [ANOVA: canal, F(2, 942) = 6.45, P < 0.002, η2 = 0.014], participant group [ANOVA: group, F(2, 942) = 6.23, P < 0.002, η2 = 0.013], and whether the head rotation was toward the lesion side (for the Non-vestibular group left and right head rotations were pooled and considered contralesional rotations) [ANOVA: same side, F(1, 942) = 8.81, P < 0.005, η2 = 0.009]. Linear regression analysis revealed that htDVA score increased by 0.007 per year after age 50 from 0.083 (R2 = 0.138; constant = −0.267, t = −6.75, P < 0.001, slope co-efficient = 0.007, t = 12.28, P < 0.001). Figure 3A shows the histogram of htDVA scores binned as Normal, Borderline, and Abnormal vs. age (with 5-years bands). The proportion of participants with an Abnormal score in participants aged 65 and above was more than double compared to those aged below 65. Figure 3B shows the maximum htDVA score (across all canal planes) calculated for each participant vs. their age, clustered by group with group and overall line-fits. Age significantly affected the maximum htDVA score [ANOVA: age covariate, F(1, 189) = 9.43, P < 0.005, η2 = 0.049]. Using the maximum htDVA score (per subject) and 0.316 as the threshold htDVA, sensitivity and specificity were, respectively 0.54 (15/28) and 0.52 (64/124). There was also a significant difference between BPPV and Non-vestibular group line-fits [ANOVA: group, F(2, 161) = 3.56, P = 0.06, η2 = 0.022; group * age covariate, F(2, 161) = 3.92, P < 0.05, η2 = 0.024]. Between the BPPV and Non-vestibular groups, anterior canal htDVA scores were significantly different, and posterior canal scores were close to 5% significantly different [Anterior canal: ANOVA group, F(1, 242) = 5.78, P < 0.02, η2 = 0.024; Posterior canal: ANOVA group, F(1, 228) = 3.2, P = 0.070, η2 = 0.015].
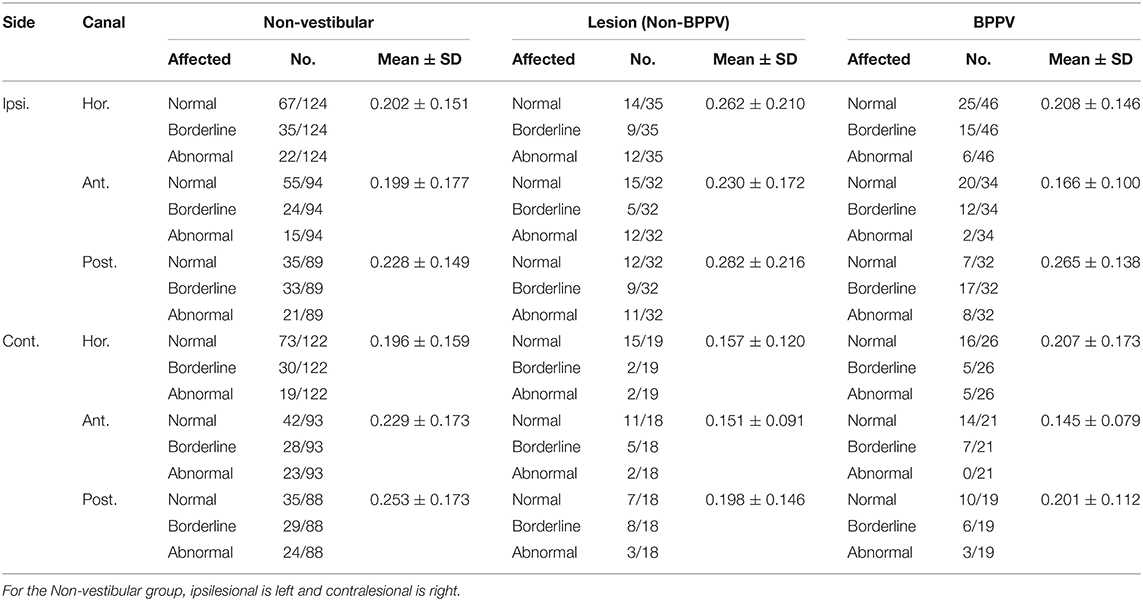
Table 1. Summary of mean htDVA scores for Non-vestibular, Lesion (Non-BPPV), and BPPV groups as well as the proportion of participants classified as Normal, Borderline, and Abnormal (≤0.158, >0.158, and ≤0.316, >0.316 logMAR, respectively).
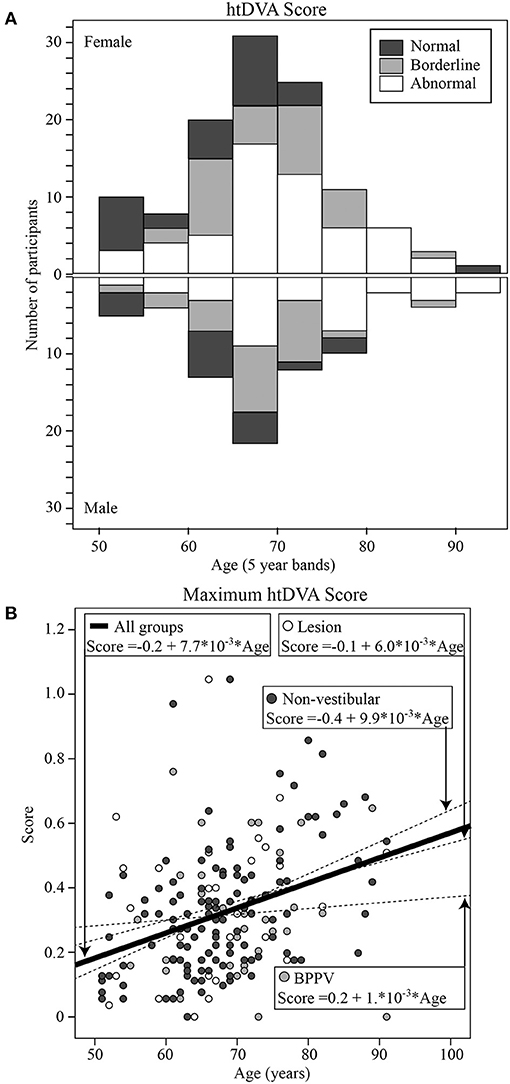
Figure 3. (A) Histogram of htDVA scores binned as normal, borderline, and abnormal vs. age (with 5-years bands). (B) Maximum htDVA score [across all canal planes [left anterior, left posterior, left horizontal, right anterior, right posterior, right horizontal]] calculated for each participant vs. their age, clustered by group with group and overall line-fits.
Figure 4 shows the total DHI score for each participant vs. their age, clustered by group with group and overall line-fits. There was no significant difference between group line-fits [ANOVA: group, F(2, 75) = 1.78, P = 0.18, η2 = 0.048; group * age covariate, F(2, 75) =1.21, P = 0.30, η2 = 0.033]. Similarly, age did not significantly affect the total DHI score [ANOVA: age covariate, F(1, 75) = 0.48, P = 0.49, η2 = 0.007]. The mean total scores for the Lesion, BPPV, and Non-vestibular groups were respectively, 30.1 ± 18.4, 28.9 ± 17.4, and 23.8 ± 16.9. There was also a significant difference in the physical sub-score between groups [ANOVA: group, F(2, 190) = 4.65, P < 0.05, η2 = 0.047], but not the emotional [ANOVA: group, F(2, 190) = 1.59, P = 0.21, η2 = 0.017] and functional [ANOVA: group, F(2, 190)= 1.29, P = 0.278, η2 = 0.014] sub-scores derived from the inventory. The mean physical scores for the Lesion, BPPV, and Non-vestibular groups were, respectively, 8.5 ± 8.4, 6.6 ± 6.6, and 5.9 ± 6.4. Using the physical score and 5.9 as the threshold, DHI sensitivity and specificity were, respectively, 0.80 (8/10) and 0.21 (10/47).
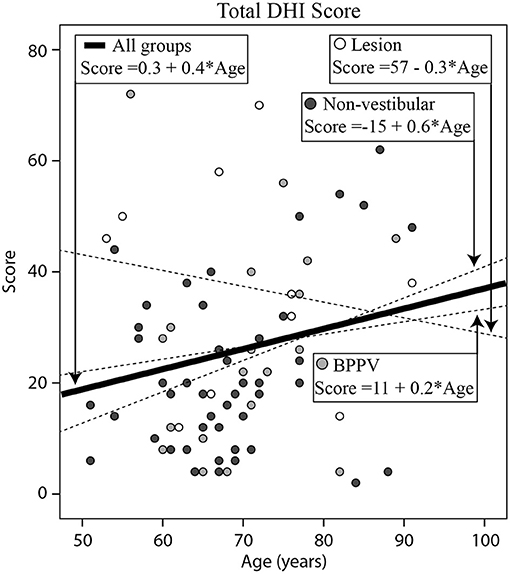
Figure 4. Histogram of total (Emotional + Functional + Physical) Dizziness Handicap Inventory (DHI) score for each participant vs. their age, clustered by group with group and overall line-fits.
Figure 5A shows boxplots of the VOR (left column) and VVOR (right column) gains (top row) and phases (bottom row) across test frequencies for each group (Lesion group in white, BPPV in light gray, and Non-vestibular in dark gray). Each box shows the median and goes from the first to the third quartile with whiskers denoting the minimum and maximum values.
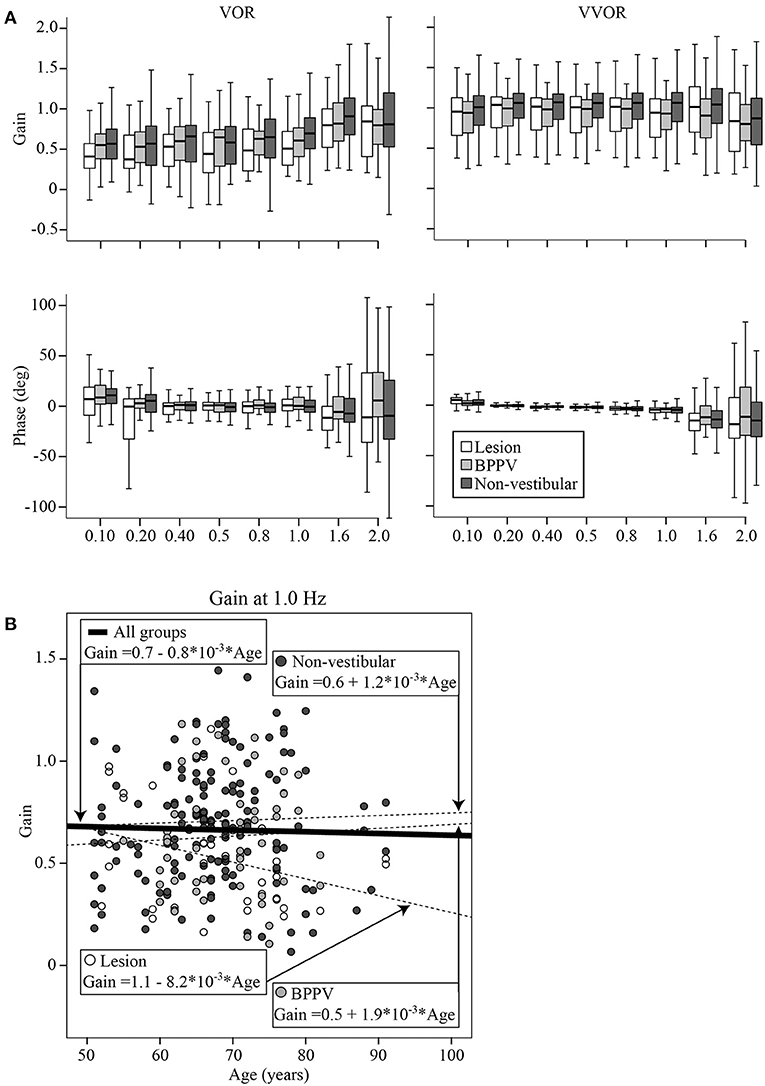
Figure 5. (A) Boxplots of the VOR (left column) and VVOR (right column) gains (top row) and phases (bottom row) across test frequencies for each group (Lesion group in white, BPPV in light gray, and Non-vestibular in dark gray). Each box begins at the first quartile, ends at the third quartile, denotes the median with a horizontal stripe and has whiskers denoting the maximum and minimum values. (B) VOR gain at 1 Hz for each participant vs. their age, clustered by group with group and overall line-fits.
The factors that significantly affected the gain were the test protocol [VOR or VVOR; ANOVA: test, F(1, 4, 288) = 540.40, P < 0.0001, η2 = 0.114], participant group [ANOVA: F(2, 4, 288) = 25.42, P < 0.0001, η2 = 0.012], test frequency [ANOVA: F(7, 4, 288) = 12.71, P < 0.0001, η2 = 0.021], and age [ANOVA: age covariate, F(1, 4, 288) = 7.57, P < 0.01, η2 = 0.002]. There was a significant interaction between test protocol and frequency [ANOVA: F(7, 4, 288) = 15.73, P < 0.0001, η2 = 0.026], suggesting that frequency most affected gains during VOR testing. There was also a significant interaction between test protocol and participant group (ANOVA: P < 0.05, η2 = 0.002), suggesting that gain differences between groups were most evident during VOR testing. The mean VVOR gain across all conditions was close to unity at 0.97 ± 0.36, whereas the mean VOR gain was about ~33% lower at 0.63 ± 0.39. The mean VOR gains across conditions for the Lesion, BPPV, and Non-vestibular groups were, respectively, 0.55 ± 0.40, 0.60 ± 0.33, and 0.67 ± 0.40. The gain spread between groups was largest at 1 Hz where the mean VOR gain for the Lesion, BPPV, and Non-vestibular groups were, respectively, 0.53 ± 0.30, 0.63 ± 0.28, and 0.71 ± 0.30. Linear regression analysis revealed that the relationships between VVOR or VOR gain with age were poor linear fits with respective R2 values of 0.003 and 0.001. Figure 5B shows the VOR gain at 1 Hz for each participant vs. their age, clustered by group with group and overall line-fits. There was no significant difference between group line-fits [ANOVA: group, F(2, 253) = 0.94, P = 0.39, η2 = 0.008; group * age covariate, F(2, 253) = 1.66, P = 0.19, η2 = 0.013]. Similarly, age did not significantly affect the VOR gain at 1 Hz [ANOVA: age covariate, F(1, 253) =0.38, P = 0.54, η2 = 0.002]. Using the VOR gain at 1 Hz and 0.75 as the threshold, sinusoidal testing sensitivity and specificity were, respectively, 0.59 (32/54) and 0.46 (73/157).
Phase followed a similar pattern to gain. The factors that affected phase were test protocol [VOR or VVOR; ANOVA: test, F(1, 4,348) = 11.59, P < 0.001, η2 = 0.003], participant group [ANOVA: F(2, 4,348) = 5.44, P < 0.005, η2 = 0.003], test frequency [ANOVA: F(7, 4,348) = 9.49, P < 0.0001, η2 = 0.015], and age [ANOVA: age covariate, F(1, 4,348) = 12.57, P < 0.0001, η2 = 0.003]. There was a significant interaction between test protocol and participant group [ANOVA: F(2, 4,348) = 3.84, P < 0.05, η2 = 0.002], suggesting that phase differences between groups were most evident during VOR testing. The VVOR phase decreased (lags) with frequency by 6.8° per Hz starting at 1.3° at 0.1 Hz (R2 = 0.076; constant = 2.014, t = 4.13, P < 0.001, slope co-efficient = −6.832, t = −13.73, P < 0.001). Whereas, VOR phase with frequency was a poor linear fit (R2 = 0.001). The mean VOR phase across conditions for the Lesion, BPPV, and Non-vestibular groups were, respectively, −4.63 ± 31.70°, 2.09 ± 24.08°, and −1.07 ± 28.56°. The phase spread between groups was largest at 1.6 Hz where the mean VOR phase for the Lesion, BPPV, and Non-vestibular groups were, respectively, −12.42 ± 34.47°, 2.41 ± 26.75°, and 0.1 ± 34.76°. Linear regression analysis revealed that the relationship between VVOR or VOR phase with age were poor linear fits with respective R2 values of 0.005 and 0.003.
The factors which affected the acceleration step time constant were age [ANOVA: age covariant, F(1, 601) = 20.46, P < 0.0001, η2 = 0.034] and group [ANOVA: group, F(2, 601) = 3.03, P < 0.05, η2 = 0.010]. The mean time constant across conditions for the Lesion, BPPV, and Non-vestibular groups were, respectively, 7.9 ± 4.1, 9.4 ± 3.8, and 9.6 ± 5.4 s. Linear regression revealed that the time constant decreased with age by 0.1 s per year starting at 11.1 s at age 50 (R2 = 0.032; constant = 16.03, t = 10.51, P < 0.001, slope co-efficient =-0.099, t = =-4.46, P < 0.001). Figure 6 shows the minimum time constant (between leftward and rightward, inhibitory and excitatory) for each participant vs. their age, clustered by group with group and overall line-fits. Age significantly affected the time constant [ANOVA: age covariate, F(1, 162) = 5.94, P < 0.02, η2 = 0.036]. However, there was no significant difference between group line-fits [ANOVA: group, F(2, 162) = 0.10, P = 0.90, η2 = 0.001; group * age covariate, F(2, 162) = 0.27, P = 0.77, η2 = 0.003]. Using the minimum time constant (per subject) and 9.6 as the threshold time constant, sensitivity and specificity were, respectively, 0.88 (21/24) and 0.20 (21/104). The only factor that affected the acceleration step gain was whether the stimulus was excitatory or inhibitory [ANOVA: stimulus, F(1, 597) = 6.24, P < 0.02, η2 = 0.011]. The mean acceleration step gain toward the excitatory and inhibitory sides were, respectively, 0.86 ± 0.24 and 0.79 ± 0.23. The excitatory response of one participant revealed an exponential decay longer than the normal duration as previously reported (11).
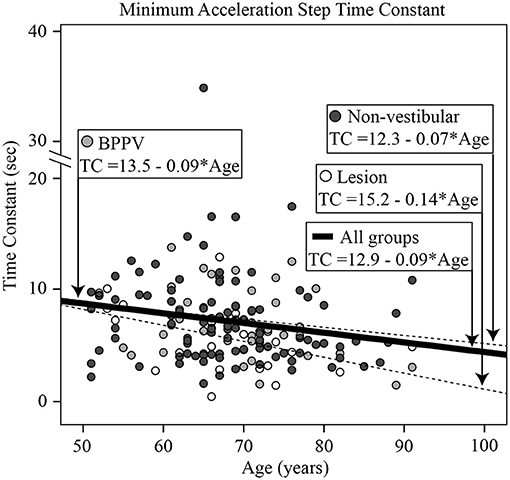
Figure 6. Histogram of the minimum acceleration step time constant [across all directions and stimuli [left excitatory, left inhibitory, right excitatory, right inhibitory]] for each participant vs. their age, clustered by group with group and overall line-fits.
There was a close to 5% significance difference in OKN time constant between ipsilesional and contralesional whole-body rotations (ANOVA: same side, F(1, 242) = 2.96, P = 0.087, η2 = 0.012]. The mean time constants toward the ipsilesional and contralesional sides were, respectively, 2.7 ± 2.0 and 3.8 ± 3.4 s. The only factor to affect the OKN gain was age [ANOVA: age covariant F(1, 240) = 4.32, P < 0.05, η2 = 0.018]. Linear regression revealed that the gain decreased with age by 0.004 per year starting at 0.683 at age 50 (R2 = 0.017; constant = 0.883, t = 7.05, P < 0.001, slope co-efficient = −0.004, t = −2.04, P < 0.05). The mean OKN gain across all conditions and groups was 0.63 ± 0.25.
Pairwise correlations between all the tests described above were performed: four of these were statistically significant. The maximum htDVA score significantly correlated with the minimum vHIT gain (Pearson correlation r = −0.343, P < 0.005). This correlation increased when only the Lesion group data were included in the analysis (Pearson correlation r = −0.847, P < 0.001). Similarly, there was a significant correlation between the VOR gain measured at 1 Hz and the minimum vHIT gain (Pearson correlation r = 0.461, P < 0.001), which also increased when only the Lesion group data were included in the analysis (Pearson correlation r = 0.838, P < 0.001). The acceleration step time constant significantly correlated with minimum vHIT (Pearson correlation r = 0.310, P < 0.02) and the VOR gain at 1 Hz (Pearson correlation r = 0.231, P < 0.01).
Thirty four percent of participants had a detectable peripheral vestibular disorder (65/193) and 0.5% had a central vestibular disorder (1/193), which was the likely cause of their dizziness. It is likely that this percentage is a lower limit and actually larger than measured due to failure in detecting transient vestibular losses, e.g., BPPV that resolved before the day of testing. These findings are consistent with our previous report in 76 subjects and suggest about one third of people aged over 50 years with symptoms of dizziness have a vestibular cause (11). Of those with a vestibular cause, 57% (37/65) had BPPV. The prevalence of BPPV in this community sample is more than twice the previously reported ~25% in dizziness clinic patients (12, 13). Interestingly, Maarsingh et al. (9) reported BPPV in only 14% of 417 primary care patients with persistent dizziness. This large difference in BPPV rate (14 vs. 57%) might be due to the different combination of tests performed (Otoscopy, Dix-Hallpike and Roll testing, and Audiometry), setting (primary care vs. community-dwelling), dizziness complaint (persistent dizziness vs. dizziness in the past year), and difference in ages (mean age 78 vs. 68 in the present study).
For the Non-vestibular group, htDVA scores were similar between left and right sides (both counted as contralesional), and there was a significant difference between ipsilesional and contralesional sides. However, the sensitivity and specificity at detecting those in the Lesion group was moderate at ~0.5. The BPPV group had significantly worse anterior canal htDVA scores, and close to 5% significantly worse posterior canal scores compared to the Non-vestibular group, suggesting that BPPV could be affecting the VOR gain. We did not measure vertical canal VOR gains, but one explanation could be that because BPPV results in an inappropriate eye movement during head rotations in the plane of the vertical canals, the vertical canal gain is driven down. There is some evidence, albeit inconclusive, suggesting that the posterior canal VOR gain is reduced in patients with posterior canal BPPV (31). A reduction in VOR gain would result in the perseverance of eye movements with smaller magnitude, which presumably would reduce the sensation of vertigo, but at the cost of visual stability, i.e., a decrease in visual acuity during head movements. Maximum htDVA score increased with age. In fact, the proportion of participants with an Abnormal score in participants aged 65 and above was more than double compared to those aged below 65. Maximum htDVA score correlated with the minimum VOR gain measured, suggesting a relationship between high-frequency VOR gain and high-frequency visual acuity.
Total DHI was not useful in discriminating between participants with vestibular and non-vestibular causes. The best DHI indicator was the total physical score, which was significantly different between the Lesion and BPPV/Non-vestibular (combined) groups. Using the physical score the DHI was highly sensitive at detecting those in the Lesion group, but had poor specificity. Participants with BBPV perceived their physical handicap to be somewhere between Lesion and Non-vestibular participants, however, the difference in score between the Lesion and Non-vestibular groups was only 2.6 points. There was no relationship between DHI score and age.
As in the prior smaller study (11), sinusoidal VOR gain was the best indicator of the cause of dizziness. However, unlike the prior study the sinusoidal frequency for optimal detection was 1 Hz. At 1 Hz the VOR gain in the Non-vestibular group was 13 and 34% larger than the BPPV and Lesion groups, respectively. However, the sensitivity and specificity at detecting those in the Lesion group was moderate at ~0.5, which was similar to that of htDVA testing. Another difference with the earlier study is that in this study the VOR phase at 1.6 Hz was also useful for detection. At 1.6 Hz, the Non-vestibular group phase led the BPPV and Lesion groups by 12° and 10°, respectively. Presumably at 1 and 1.6 Hz the VOR predominantly contributes to vision stabilization because the other vision stabilizing systems, i.e., OKN and smooth pursuit, break down at higher frequencies and velocities [e.g., (32)]. The VOR gain at 1 Hz was not affected by age and correlated with the minimum vHIT VOR gain, suggesting that the mid-frequency (and high-frequency) VOR gain is relatively stable compared to the low-frequency VOR that is affected by other vision stabilizing systems.
There was a significant difference in the transient time constant between groups. The Lesion group had a time constant ~1.5 s shorter than the BPPV and Non-vestibular groups. The time constant decreased with age and correlated particularly with the minimum vHIT, suggesting that both tests were measuring high-frequency vestibular function. The sensitivity of the time constant measure was high, but it had poor specificity, which was similar to that of physical DHI testing. This is a reasonable conclusion given that both tests use transient/rapid head rotations as the vestibular stimulus. The transient gain was significantly different for rotation toward the excitatory and inhibitory sides. Overall however, this unilateral VOR test failed to detect differences between the ipsilesional and contralesional sides. Transient VOR testing identified one participant with likely central vestibular dysfunction. There was a close to 5% significance difference in OKN time constant between ipsilesional and contralesional whole-body rotations, but it failed to detect a difference between BPPV and Lesion groups.
Clinical head impulse testing detected a difference between the Non-vestibular and BPPV/Lesion (combined) groups, but failed to detect a difference between BPPV and Lesion groups. Clinical head impulse testing did not correlate with any of the other tests in this study. The sensitivity of cHIT was low, but it had high specificity. Video head impulse testing detected a significant difference between ipsilesional vs. contralesional gains, but also failed to detect a difference between BPPV and Lesion groups. Similar to cHIT, vHIT had low sensitivity, but high specificity. Video head impulse minimum gain did not change with age, but correlated particularly well with the VOR gain measured during sinusoidal rotations at 1 Hz, suggesting that peripheral vestibular function between mid-frequencies (1 Hz) and high-frequencies [head impulses spectral content ~2.5 Hz, (33)] is generally consistent.
Non-vestibular dizzy patients were best determined by negative cHIT and vHIT gain > 0.75. A low maximum htDVA score (across all six canal plane rotations) was also useful for detecting this group. BPPV patients were best determined by a high maximum htDVA score. Dizzy patients with vestibular cause were best determined by low VOR gain at 1 Hz, large phase lead at 1.6 Hz, or high physical sub-domain DHI score.
For most clinical practices where a rotary chair or vHIT system is unavailable, we suggest the following minimal guidelines to help determine cause of dizziness:
(1) Non-vestibular, if patient has negative cHIT and negative Dix-Hallpike/Roll test nystagmus;
(2) BPPV, if patient has maximum htDVA score > 0.316 (threshold used for analysis above) and positive Dix-Hallpike/Roll test nystagmus;
(3) Vestibular (Lesion), if patient has physical domain DHI score > 5.9 (threshold used for analysis above) and negative Dix-Hallpike/Roll test nystagmus.
To our knowledge, the present study is the largest that has used a panel of experts to examine a patient's history as well as their responses to physiological, cardiovascular, and vestibular tests, to classify their cause of dizziness and then retrospectively examine the performance of each individual vestibular test in correctly classifying the patient. The larger sample size of the present study (n = 193), compared to the earlier study (n = 76), allowed us to report here sensitivity and specificity measures for each vestibular test as well as determine the effect of age on each test result.
When the cause of dizziness in participants is assessed by an expert panel evaluating results from a battery of vestibular, cardiovascular, and psychological tests, the results from each vestibular test do not necessarily align with the assigned participant group. Despite the size of this study, the effect size of many of the variables tested were small suggesting generally poor correlations between the test result and group assigned. This study reinforces the idea that one vestibular test alone, e.g., vHIT only, is insufficient to determine the cause of dizziness. Age affected cHIT, htDVA, and transient VOR time constant measures, but did not affect vHIT, DHI, and sinusoidal VOR gain at 1 Hz measures.
The results from this study suggest total physical DHI score and the transient VOR (acceleration step) time constant are best at detecting those in the Lesion group. However, those two tests have low specificity, so they should be used in conjunction with cHIT or vHIT. Sinusoidal VOR gain at 1 Hz and htDVA had similarly moderate sensitivity and specificity. VHIT and htDVA were best at detecting differences between ipsilesional and contralesional sides.
The raw data supporting the conclusions of this article will be made available by the authors, without undue reservation.
The studies involving human participants were reviewed and approved by Human Research Ethics Committee at the University of New South Wales. The patients/participants provided their written informed consent to participate in this study.
WF collected data, processed data, helped with data interpretation, and revised draft manuscript. JM recruited patients, collected data, helped with data interpretation, and revised draft manuscript. AC collected data, processed data, and helped with data interpretation. PH wrote software, collected data, processed data, and helped with data interpretation. SL funded study, helped conceive study, helped with data interpretation, and revised draft manuscript. AM funded study, helped conceive study, main data interpretation, and wrote draft manuscript. All authors contributed to the article and approved the submitted version.
This study was funded by the National Health and Medical Research Council of Australia (NHMRC) Project Grant APP1026726. AM was supported by The Garnett Passe and Rodney Williams Memorial Foundation Senior/Principal Research Fellowship in Otorhinolaryngology. PH was supported by a University of New South Wales (UNSW) International Research Scholarship and a Neuroscience Research Australia (NeuRA) supplementary scholarship. SL was supported by an NHMRC Research Fellowship.
The authors declare that the research was conducted in the absence of any commercial or financial relationships that could be construed as a potential conflict of interest.
We would like to thank Mr. Georg Poller and Mr. Muntaseer Mahfuz for their assistance with data collection and processing, Ms. Holly Hunter and Ms. Mayna Ratanapongleka for participant recruitment and Dix-Hallpike testing, and Ms. Daniella Meinrath for reviewing the BPPV data.
1. Agrawal Y, Carey JP, Della Santina CC, Schubert MC, Minor LB. Disorders of balance and vestibular function in US adults: data from the National Health and Nutrition Examination Survey, 2001-2004. Arch Intern Med. (2009) 169:938–44. doi: 10.1001/archinternmed.2009.66
2. Jacobson GP, McCaslin DL, Grantham SL, Piker EG. Significant vestibular system impairment is common in a cohort of elderly patients referred for assessment of falls risk. J Am Acad Audiol. (2008) 19:799–807. doi: 10.3766/jaaa.19.10.7
3. Guyton AC, Hall JE. Vestibular sensations maintenance of equilibrium. In: Guyton AC, editor. Guyton and Hall Textbook of Medical Physiology. Philadelphia, PA: Philadelphia, Pa: Saunders: Elsevier (2011). p. 1050–4.
4. Menant JC, St George RJ, Fitzpatrick RC, Lord SR. Perception of the postural vertical and falls in older people. Gerontology. (2012) 58:497–503. doi: 10.1159/000339295
5. Ishiyama G. Imbalance and vertigo: the aging human vestibular periphery. Semin Neurol. (2009) 29:491–9. doi: 10.1055/s-0029-1241039
6. Sloane PD, Baloh RW, Honrubia V. The vestibular system in the elderly: clinical implications. Am J Otolaryng. (1989) 10:422–9. doi: 10.1016/0196-0709(89)90038-0
7. Young AS, Rosengren SM, Welgampola MS. Disorders of the Inner-Ear Balance Organs and Their Pathways. Handb Clin Neurol. (2018) 159:385–401. doi: 10.1016/B978-0-444-63916-5.00025-2
8. Neuhauser HK, von Brevern M, Radtke A, Lezius F, Feldmann M, Ziese T, et al. Epidemiology of vestibular vertigo: a neurotologic survey of the general population. Neurology. (2005) 65:898–904. doi: 10.1212/01.wnl.0000175987.59991.3d
9. Maarsingh OR, Dros J, Schellevis FG, van Weert HC, van der Windt DA, ter Riet G. Causes of persistent dizziness in elderly patients in primary care. Ann Fam Med. (2010) 8:196–205. doi: 10.1370/afm.1116
10. Hillier SL, McDonnell M. Vestibular rehabilitation for unilateral peripheral vestibular dysfunction. Cochrane Database Syst Rev. Feb. (2011) 16:CD005397. doi: 10.1002/14651858.CD005397.pub3
11. Chau AT, Menant JC, Hübner PP, Lord SR, Migliaccio AA. Prevalence of vestibular disorder in older people who experience dizziness. Front Neurol. (2015) 6:268. doi: 10.3389/fneur.2015.00268
12. Nedzelski JM, Barber HO, McIlmoyl L. Diagnoses in a dizziness unit. J Otolaryng. (1986) 15:101–104.
13. Hughes CA, Proctor L. Benign paroxysmal positional vertigo. Laryngoscope. (1997) 107:607–13. doi: 10.1097/00005537-199705000-00010
14. Menant JC, Migliaccio AA, Sturnieks DL, Hicks C, Lo J, Ratanapongleka M, et al. Reducing the burden of dizziness in middle-aged and older people: A multifactorial, tailored, single-blind randomized controlled trial. PLoS Med. (2018) 15:e1002620. doi: 10.1371/journal.pmed.1002620
15. Kenny RA, Ingram A, Bayliss J, Sutton R. Head-up tilt: a useful test for investigating unexplained syncope. Lancet. (1986) 1:1352–355. doi: 10.1016/S0140-6736(86)91665-X
16. Brignole M, Alboni P, Benditt DG, Bergfeldt L, Blanc J-J, Bloch Thomsen PE, et al. Guidelines on management (diagnosis and treatment) of syncope–update 2004. Europace. (2004) 6:467–537. doi: 10.1016/j.eupc.2004.08.008
17. Gibbons CH, Freeman R. Clinical implications of delayed orthostatic hypotension: A 10-year follow-up study. Neurology. (2015) 85:1362–7. doi: 10.1212/WNL.0000000000002030
18. Spitzer RL, Kroenke K, Williams JB, Lowe B. A brief measure for assessing generalized anxiety disorder: the GAD-7. Arch Intern Med. (2006) 166:1092–7. doi: 10.1001/archinte.166.10.1092
19. Spitzer RL, Kroenke K, Williams JB. Validation and utility of a self-report version of PRIME-MD: the PHQ primary care study. primary care evaluation of mental disorders. patient health questionnaire. JAMA. (1999) 282:1737–44. doi: 10.1001/jama.282.18.1737
20. Lord SR, Menz HB, Tiedemann A. A physiological profile approach to falls risk assessment and prevention. Phys Ther. (2003) 83:237–52. doi: 10.1093/ptj/83.3.237
21. Lord SR, Ward JA, Williams P. Exercise effect on dynamic stability in older women: a randomized controlled trial. Arch Phys Med Rehabil. (1996) 77:232–6. doi: 10.1016/S0003-9993(96)90103-3
22. Delbaere K, Close JCT, Heim J, Sachdev PS, Brodaty H, Slavin MJ, et al. A multifactorial approach for understanding fall risk in older people - a decision tree model. J Am Geriatr Soc. (2010) 58:1679–85. doi: 10.1111/j.1532-5415.2010.03017.x
23. Jacobson GP, Newman CW. The development of the dizziness handicap inventory. Arch Otol Head Neck Surg. (1990) 116:424–7. doi: 10.1001/archotol.1990.01870040046011
24. Bhattacharyya N, Gubbels SP, Schwartz SR, Edlow JA, El-Kashlan H, Fife T, et al. Clinical practice guideline: benign paroxysmal positional vertigo (Update). Otolaryngol Head Neck Surg. (2017) 156:S1–S47. doi: 10.1177/0194599816689667
25. Schubert MC, Migliaccio AA, Della Santina CC. Dynamic visual acuity during passive head thrusts in canal planes. JARO. (2006) 7:329–38. doi: 10.1007/s10162-006-0047-6
26. Bartl K, Lehnen N, Kohlbecher S, Schneider E. Head impulse testing using video-oculography. Ann N Y Acad Sci. (2009) 1164:331–333. doi: 10.1111/j.1749-6632.2009.03850.x
27. Mahfuz MM, Schubert MC, Todd CJ, Figtree WVC, Khan SI, Migliaccio AA. The Effect of visual contrast on human vestibulo-ocular reflex adaptation. J Assoc Res Otolaryngol. (2018) 19:113–22. doi: 10.1007/s10162-017-0644-6
28. Halmagyi G, Curthoys IS. A clinical sign of canal paresis. Arch Neurol. (1988) 45:737–9. doi: 10.1001/archneur.1988.00520310043015
29. Diggle PJ, Liang KY, Zeger SL. Analysis of Longitudinal Data. New York, NY: Oxford University Press (1994).
30. Cohen J. Statistical Power Analysis for the Behavioral Sciences (2nd ed.). Hillsdale, NJ: Erlbaum (1988).
31. Fallahnezhad T, Ghahraman MA, Farahani S, Hoseinabadi R, Jalaie S. Vestibulo-ocular reflex abnormalities in posterior semicircular canal benign paroxysmal positional vertigo: a pilot study. Iran J Otorhinolaryngol. (2017) 94:269–74.
32. Krauzlis RJ, Lisberger SG. Temporal properties of visual motion signals for the initiation of smooth pursuit eye movements in monkeys. J Neurophysiol. (1994) 72:150–62. doi: 10.1152/jn.1994.72.1.150
Keywords: vestibulo-ocular reflex, peripheral vestibular disorders, expert panel assessment, community dwelling adults, benign paroxismal positional vertigo
Citation: Figtree WVC, Menant JC, Chau AT, Hübner PP, Lord SR and Migliaccio AA (2021) Prevalence of Vestibular Disorders in Independent People Over 50 That Experience Dizziness. Front. Neurol. 12:658053. doi: 10.3389/fneur.2021.658053
Received: 25 January 2021; Accepted: 13 April 2021;
Published: 20 May 2021.
Edited by:
Ji Soo Kim, Seoul National University, South KoreaReviewed by:
Andreas Zwergal, Ludwig Maximilian University of Munich, GermanyCopyright © 2021 Figtree, Menant, Chau, Hübner, Lord and Migliaccio. This is an open-access article distributed under the terms of the Creative Commons Attribution License (CC BY). The use, distribution or reproduction in other forums is permitted, provided the original author(s) and the copyright owner(s) are credited and that the original publication in this journal is cited, in accordance with accepted academic practice. No use, distribution or reproduction is permitted which does not comply with these terms.
*Correspondence: Americo A. Migliaccio, YS5taWdsaWFjY2lvQG5ldXJhLmVkdS5hdQ==
†Present address: Americo A. Migliaccio, Balance and Vision Laboratory, Neuroscience Research Australia, Sydney, NSW, Australia
Disclaimer: All claims expressed in this article are solely those of the authors and do not necessarily represent those of their affiliated organizations, or those of the publisher, the editors and the reviewers. Any product that may be evaluated in this article or claim that may be made by its manufacturer is not guaranteed or endorsed by the publisher.
Research integrity at Frontiers
Learn more about the work of our research integrity team to safeguard the quality of each article we publish.