
94% of researchers rate our articles as excellent or good
Learn more about the work of our research integrity team to safeguard the quality of each article we publish.
Find out more
STUDY PROTOCOL article
Front. Neurol. , 15 December 2020
Sec. Applied Neuroimaging
Volume 11 - 2020 | https://doi.org/10.3389/fneur.2020.595463
 Kyle D. Murray1
 Meera V. Singh2
 Yuchuan Zhuang3
 Md Nasir Uddin4
 Xing Qiu5
 Miriam T. Weber4
 Madalina E. Tivarus6,7
 Henry Z. Wang6
 Bogachan Sahin4
 Jianhui Zhong1,3,5
 Sanjay B. Maggirwar8
 Giovanni Schifitto4,6*
Rationale: We provide an in-depth description of a comprehensive clinical, immunological, and neuroimaging study that includes a full image processing pipeline. This approach, although implemented in HIV infected individuals, can be used in the general population to assess cerebrovascular health.
Aims: In this longitudinal study, we seek to determine the effects of neuroinflammation due to HIV-1 infection on the pathomechanisms of cerebral small vessel disease (CSVD). The study focuses on the interaction of activated platelets, pro-inflammatory monocytes and endothelial cells and their impact on the neurovascular unit. The effects on the neurovascular unit are evaluated by a novel combination of imaging biomarkers.
Sample Size: We will enroll 110 HIV-infected individuals on stable combination anti-retroviral therapy for at least three months and an equal number of age-matched controls. We anticipate a drop-out rate of 20%.
Methods and Design: Subjects are followed for three years and evaluated by flow cytometric analysis of whole blood (to measure platelet activation, platelet monocyte complexes, and markers of monocyte activation), neuropsychological testing, and brain MRI at the baseline, 18- and 36-month time points. MRI imaging follows the recommended clinical small vessel imaging standards and adds several advanced sequences to obtain quantitative assessments of brain tissues including white matter microstructure, tissue susceptibility, and blood perfusion.
Discussion: The study provides further understanding of the underlying mechanisms of CSVD in chronic inflammatory disorders such as HIV infection. The longitudinal study design and comprehensive approach allows the investigation of quantitative changes in imaging metrics and their impact on cognitive performance.
Cerebral small vessel disease (CSVD) is a common neurodegenerative disease associated with aging and other neurological diseases that is diagnosed by brain imaging. CSVD affects small penetrating arteries, arterioles, capillaries, and venules (1) and is clinically diagnosed by presence of brain atrophy, white matter hyperintensities (WMHs), enlarged perivascular spaces, cerebral microbleeds, and lacunar infarcts. These are detected by T1-weighted (T1w), fluid attenuated inversion recovery (FLAIR), T2-weighted (T2w), T2*-weighted (T2*), and diffusion MRI (dMRI) (2). Additional neuroimaging techniques to study CSVD in more detail have been proposed and include (3) cutting-edge research sequences that can be used to assess altered microcirculation and blood brain barrier (BBB) dysfunction indirectly by measuring cerebrovascular reactivity (CVR), cerebral blood flow (CBF), white matter microstructure, and tissue susceptibility (4). As further detailed below, in this study we used the following advanced research sequences to obtain quantitative tissue metrics throughout the brain: multi-shell dMRI, resting-state functional MRI (rs-fMRI), multiple-delay pseudo-continuous arterial spin labeling (pcASL), and quantitative susceptibility mapping (QSM).
Older adults living with human immunodeficiency virus (HIV) infection are at increased risk of developing cerebrovascular disease in terms of both large and small vessel disease (5–7). Relatively limited attention has been devoted to HIV-associated CSVD so far, despite its known long-term effects on cognitive function in the general population. In HIV-infection, CSVD could be the result of multiple mechanisms (8–10). In addition to the known atherosclerosis mechanisms affecting the older population, older HIV+ individuals are also exposed to HIV proteins, host immune activation products, and combination antiretroviral therapy (cART), which can affect the neurovascular unit (endothelial cells, pericytes, astrocytes, neurons, and microglia). Interestingly, CSVD has been associated with markers secreted by myeloid cells (11, 12).
Aberrant platelet activation during HIV infection causes an increase in platelet-monocyte complexes (PMCs) that drives monocyte maturation from CD14+/CD16- to the proinflammatory CD14(low)/CD16+ phenotype (13, 14). Reduction in the numbers of CD14+/CD16- monocytes are associated with proatherosclerosis changes (15, 16), BBB permeability (17, 18), and aging (19, 20). Based on these observations, we hypothesize that pro-inflammatory monocytes lead to an altered integrity of the BBB and neurovascular unit. Therefore, in this study we investigate mechanisms by which activated platelets interacting with monocytes and endothelial cells contribute to CSVD, in particular via processes that alter vascular permeability and reactivity which lead to altered microstructural integrity. We employ standard MRI sequences used in clinical practice to qualitatively ascertain the presence of CSVD and four advanced MRI sequences to quantitatively asses white matter structural integrity, vascular reactivity, CBF, and iron distribution. We also incorporate novel markers of immune activation and cognitive testing.
A total of 110 HIV-infected (HIV+) men and women and 110 HIV-uninfected (HIV-) age and sex matched controls will be recruited using recruitment materials approved by the Institutional Research Subjects Review Board (RSRB). All participants provide written informed consent according to the RSRB approved protocol prior to any evaluation. Blood samples are acquired from adults after written informed consent carried out in accordance with the Declaration of Helsinki. Study participants are followed for 3 years as changes in CSVD are expected to occur within 3 years of follow-up.
The inclusion and exclusion criteria are shown in Table 1. Special effort will be made to enroll controls that are demographically similar to the HIV+ subjects. Both men and women are invited to participate in the study as there are no scientific bases for sex restrictions. However, given the sex distribution of HIV-infection in our clinics, more men than women are expected to be enrolled. In this study we use the Reynolds cardiovascular risk score (21) as a vascular covariate in analyses to account for the effect of traditional risk factors associated with vascular disease. We have also elected to enroll patients on stable cART to minimize the effect of uncontrolled viremia.
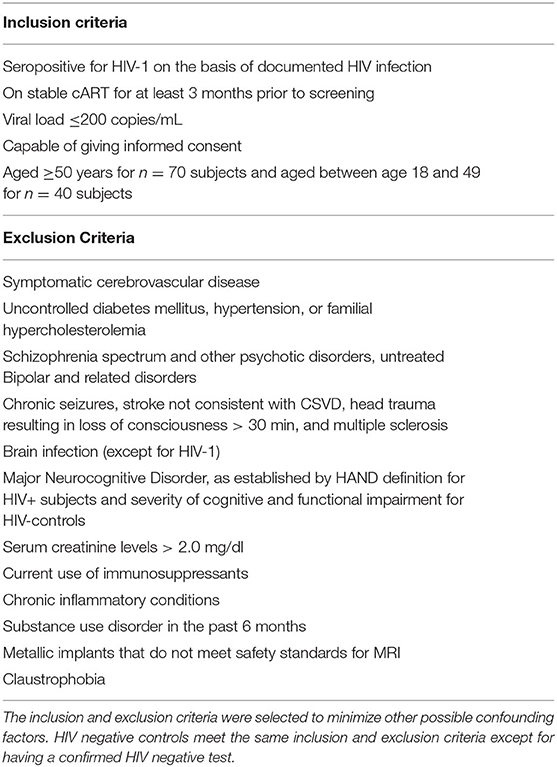
Table 1. Inclusion and exclusion criteria.
Subjects undergo three comprehensive evaluations [baseline (BSL), 18-month, and 36-month time points] that includes clinical evaluation, MRI, and comprehensive blood tests. Routine phone follow-ups are conducted every 6-months after the baseline visit. All collected data is stored in a database in the University of Rochester Medical Center's (URMC) Bio-Lab Informatics System (BLIS), a comprehensive, web-based data management system developed to store, integrate, analyze, and securely share biomedical research data. Details about each type of data collection and processing is described below. See Figure 1 for the study's data acquisition timeline.
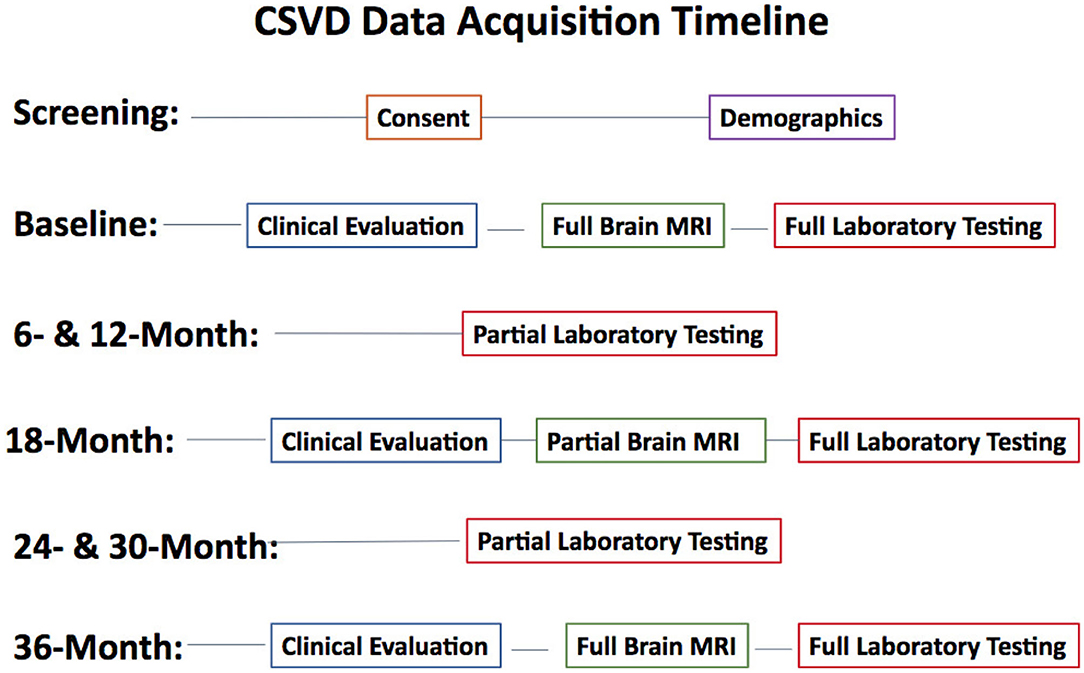
Figure 1. Study data acquisition timeline. Clinical Evaluation includes a physical exam, neuropsychological tests, CES-D, and functional assessments. Full Brain MRI includes all described imaging sequences. Partial Brain MRI excludes QSM, T2w, and MRA sequences. Full laboratory testing includes chemistry, hematology, urine, CD4 count, HIV RNA, urine toxicology, real-time flowcytometry, plasma, and PBMC storage. Partial laboratory testing only includes tests performed for routine clinical care.
Approximately 40 ml of whole blood will be collected in Acid Citrate Dextrose (ACD) vacutainers (4 vacutainers) and processed within 2 h of collection. The blood is incubated at room temperature with slow shaking until processing. Plasma is isolated from 20 ml of blood by centrifugation at 1,000 X g for 10 min at room temperature. Plasma is aliquoted and cryopreserved at 80°C for future use. Plasma is used to measure soluble markers of monocyte activation (CD613,HMGB1, and neopterin) as well as endothelial dysfunction (ICAM-1, sVCAM-1, osteoprotegerin, and Lp-PLA2) using commercially available ELISAs. One milliliter of whole blood is processed by flow cytometry to measure the levels of circulating platelet-monocyte complexes (PMCs) and expression of various monocyte activation markers such as c-c chemokine receptor 2 (CCR2), CD40, CD62p (also known as p-selectin), p-selectin glycoprotein ligand (PSGL-1), and tumor necrosis factor receptor 2 (TNFR2). Remaining whole blood is cryopreserved by mixing with RPMI containing 10% Dimethyl sulfoxide (DMSO) and 20% fetal bovine serum (FBS) in 1:1 volume using Mr. Frosty. Cryopreserved whole blood is stored in vapor phase of liquid Nitrogen freezer for future use.
Flow cytometric analysis of platelet-monocyte complexes and platelet activation is shown in Figure 2 and performed as previously described (13, 22). Briefly, 100 μl whole blood is fixed with equal volume of 4% paraformaldehyde (PFA) for 15 min at room temperature followed by red blood cell (RBC) lysis using ACK lysis buffer. The cells are then washed and stained with titrated amounts of antibodies against anti-CD14 PE (BD Biosciences # 555398; 10 μl), anti-CD16 PE Cy7 (BD Biosciences 557744; 3 μl), anti-CD61AF647 (Biolegend # 336408; 3 μl), anti-PSGL-1 FITC (R&D Systems # FAB9961G; 1.5 μl), anti-CD40 FITC BD Biosciences. # 555598; 10 μl), anti-CCR2 FITC (R&D Systems # FAB151G; 1.5 μl), anti-CD62P FITC (BD Biosciences # 555523; 5 μl), and anti-TNFR2 FITC (Miltenyi Biotech #130-107-743; 1 μl) for 30 min at room temperature in the dark. The cells are washed and acquired using the Accuri C6 flow cytometer. 75,000 gated leukocytes are acquired based on forward and side scatter per tube. Data is analyzed using Flow Jo software version 10.4.2. Unstained cells and cells stained with anti-CD14 and anti-CD16 are used to gate on three subsets of monocytes: classical monocytes (CD14+ CD16-), intermediate monocytes (CD14+CD16+), and non-classical monocytes (CD14- CD16+). Among these cells, those that expressed CD61, a platelet marker, are termed as PMCs. Expression of CCR2, CD40, CD62p, and TNFR2 is measured on PMCs and non-complexed monocytes. Further, 10,000 platelet events are acquired based on size beads (0.9–3 μm) and expression of CD61. Platelet activation is measured by expression of CD62p.
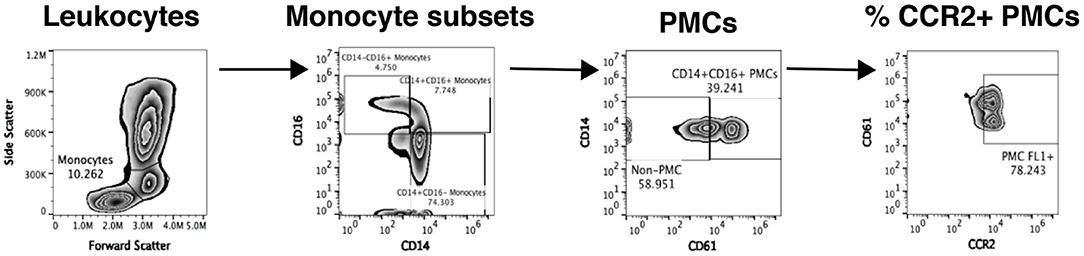
Figure 2. Analysis of platelet-monocyte complexes by flow cytometry. Our flow cytometry gating strategy to analyze PMCs from one representative study sample is shown. Monocytes are initially gated based on forward and side scatter and then split into three subsets based on the expression of CD14 and CD16. Each monocyte subset is then analyzed for expression of CD61, a platelet marker and CD61+ cells are defined as PMCs. Complexed and non-complexed cells are then analyzed for the expression of different monocyte activation markers, namely CCR2 (depicted in the figure), CD40, CD62p, PSGL-1, TNFR2, and TF.
Assessments of neurocognitive and functional performance are performed in order to derive an HIV-associated neurocognitive disorder (HAND) classification (23). Prior to analyses, Z-scores for each cognitive domain as well as a total Z-score is calculated for each subject. All neuropsychological testing is administered by the study coordinators, trained and supervised by an experienced neuropsychologist. The neuropsychological test battery includes tests of the following cognitive domains: Attention/Working Memory (CalCAP CRT 4; CRT 14), Speed of Information Processing (Stroop Color Naming, Digit Symbol Modalities Test), Executive Function (Trail Making Test B, Stroop Interference Task), Language (letter and category fluency), Learning (Rey Auditory Verbal Learning Test Trials 1–5, Rey Complex Figure Test Immediate Recall), Memory (RAVLT Trial 7, RCFT Delayed Recall), and Motor Skill (Grooved Pegboard). Premorbid intellectual functioning and English language fluency are assessed with the Wide Range Achievement Test (WRAT) 4-Reading subtest at the baseline only.
Functional and mood assessments include the instrumental activities of daily living scale (IADLs) and some activities of daily living (ADLs), self-reported cognitive function via the patient's assessment of own functional inventory (PAOFI), and a measure of depression via the center for epidemiologic studies depression scale (CESD).
All imaging is performed on a research dedicated 3T Siemens MAGNETOM PrismaFit (Erlangen, Germany) whole-body scanner (software version VE11c) equipped with a 64-channel phased array head coil capable of parallel imaging using sensitivity encoding (SENSE), generalized auto calibrating partial parallel acquisition (GRAPPA), and simultaneous multi-slice (SMS) acceleration for diffusion and functional imaging. The maximum gradient strength is 80 mT/m with a slew rate of 200 mT/m/s. Table 2 summarizes the image acquisition parameters used in this protocol.
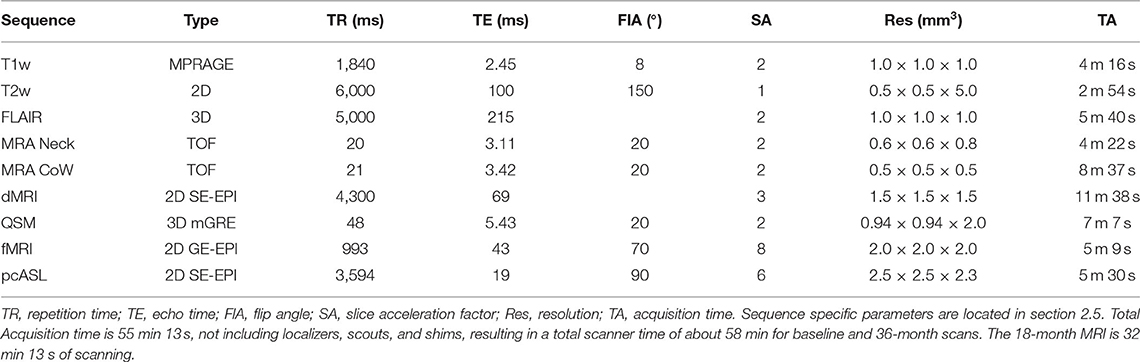
Table 2. Image acquisition parameters.
High-resolution T1w anatomical images are acquired using the magnetization prepared 3D rapid gradient echo (MPRAGE) sequence with the following parameters: inversion time (TI), 926 ms; flip angle (FlA), 8 degrees; echo time (TE), 2.45 ms; receiver bandwidth (RBW), 190 Hz per pixel; echo spacing (ESP), 7.5 ms; repetition time (TR), 1840.0 ms; and 1 mm isotropic resolution. Slices are collected in straight-sagittal orientation. GRAPPA is used with acceleration factor of 2 and 24 reference lines for an acquisition time (TA) of 4 min 26 s.
T2w images are collected in 2D axial orientation with the following parameters: TE, 100 ms; ESP, 11.1 ms; FlA, 150 degrees; RBW, 222 Hz per pixel; TR, 6,000 ms; 0.5 × 0.5 mm in plane resolution and 5.0 mm slice thickness for a TA of 2 min 54 s.
3D FLAIR images are acquired for both clinical readings and quantitative structural processing to improve lesion detection and tissue segmentation on individuals with periventricular atrophy. Imaging parameters include TE, 215 ms; ESP, 3.42 ms; echo train duration, 687 ms; TI, 1,800 ms; RBW, 7,571 Hz per pixel; turbo factor, 278; and TR, 5,000 ms. A slice acceleration factor of 2 is used at 1 mm isotropic voxel size for a total TA of 5 min 40 s.
MRA is acquired using two 3D time of flight (TOF) sequences after a vessel neck scout, centered on the neck and Circle of Willis. Slices are collected in transverse orientation for both scans with flow compensation. GRAPPA is used with acceleration factor of 2 and 24 reference lines. Imaging parameters for the neck/CoW acquisition include TE, 3.11/3.42 ms; FlA, 20/20 degrees; RBW, 252/250 Hz per pixel; TR, 20.0/21.0 ms; phase oversampling, 50/30 %, slice oversampling, 16.7/20.0 %; image resolution, 0.6 × 0.6 × 0.8/0.5 × 0.5 × 0.5 mm3; and TA 4 min 22 s/8 min 37 s.
In addition to the previously mentioned clinical sequences, the diffusion and QSM images described below are also used both for radiological viewing to determine CSVD burden and calculate quantitative metrics via novel image post-processing.
Diffusion imaging is performed using a 2D transverse single-shot single-echo spin echo (SE) echo-planar imaging (EPI) sequence with TE, 69.0 ms; ESP, 0.66 ms; RBW, 1816 Hz per pixel; matrix, 172 × 172; EPI factor, 172; TR, 4300 ms; and 1.5 mm isotropic resolution. Diffusion gradients are applied along 64 directions with two non-zero b-values (1,000 and 2,000 s/mm2) and 7 interleaved reference scans. Parallel imaging is enabled using slice acceleration of 3 and phase acceleration of 2 with 40 reference lines for a total scan time of 11 min 38 s. All directions are collected with anterior-posterior (AP) phase encoding. Reference reverse phase encoding b = 0 images are also collected for distortion correction.
QSM is acquired with a 3D multi-gradient echo (mGRE) pulse sequence with the following parameters: 8-echo mono-polar readout train; FlA, 20 degrees; TE of first echo, 5.43 ms; ESP, 1.50 ms; RBW, 930 Hz per pixel; and TR, 48.0 ms. Matrix size is 256 × 256 × 64 with slices in straight-axial orientation and voxel resolution of 0.94 × 0.94 × 2 mm3. GRAPPA is used with acceleration factor of 2 and 24 reference lines, giving a scan time of 7 min 7 s.
Blood oxygen level dependent (BOLD) rs-fMRI is performed using a 2D transverse single-shot GE-EPI sequence with TE, 43.0 ms; ESP, 0.56 ms; FlA, 70 degrees; RBW, 2,442 Hz per pixel; EPI factor, 128; TR, 993 ms; and 2 mm isotropic voxels. Parallel imaging is enabled using a multiband acceleration factor of 8 with 12 reference lines for 300 volumes for a total scan time of 5 min 9 s. Images are collected with AP phase encoding. Gradient field maps are also acquired to account for distortion correction. In addition to the rs-fMRI acquisition, we also record three physiological signals for quantitative signal regression, namely heart rate, respiration rate, and end-tidal carbon dioxide (ET-CO2).
Perfusion images are acquired with a multiple post-label delay pseudo-continuous arterial spin labeling (pcASL) sequence using a 2D transverse single-shot single-echo (SE) echo-planar imaging (EPI) sequence with the following parameters: TE, 19.0 ms; ESP, 0.57 ms; FlA, 90 degrees; RBW, 2,326 Hz per pixel; EPI factor, 86; TR, 3594 ms; voxel size 2.5 × 2.5 × 2.3 mm3; slice acceleration, 6; and labeling duration, 1.5 s. Multiple tag-control pair measurements are acquired at five delay times for a total of 86 perfusion measurements. One noise pair measurement and one equilibrium pair measurement are also acquired for perfusion calibration processing. The total scan time for these 90 measurements is 5 min 30 s.
All images are checked by a lab member for quality control within two days of image acquisition in the event that a subject needs to be rescanned due to poor data quality. Quality control consists of confirming proper data transfer from the scanner to the data server, converting the standard digital imaging and communications in medicine (DICOM) files to the neuroimaging informatics technology initiative (NifTI) data format via the dcm2niix tool (24), and visual inspection of all imaging sequences for any scanner and subject related artifacts. Sequences with significant artifacts or excessive subject motion (at least 2 mm shift during a single sequence) are either rescanned at a later date within 30 days of the scan or removed from analyses. In rare cases, sequences may be rescanned during the overall acquisition, time permitting.
Clinical images that are used for diagnostic purposes are also transferred to the Philips IntelliSpace Portal (v10.1) medical software for the team's radiologist to review to determine CSVD severity in each subject and calculate vessel diameters. Radiological findings are immediately documented in the study database in BLIS. Any incidental findings are reported to the principal investigator for review. Documented radiological findings include a Fazekas score (25) rating based on the severity of WMHs, presence of cerebral microbleeds, presence of lacunar infarcts, and enlarged perivascular spaces. We also report measurements of vessel diameters of extracranial cerebral vessels and intracranial vessels forming the Circle of Willis and the basilar artery.
Results of post-processing imaging metrics are also uploaded to the BLIS database, along with all information used for any analyses related to this study. Image postprocessing and obtainable metrics are described in section 2.6. Technical details related to MRI acquisition for each pulse sequence used in our study are described below. Total scanning time is 58 min per subject for each visit.
In this section we describe our comprehensive image analysis pipeline, including preprocessing, data cleaning, and post-processing methods for each imaging modality up to more detailed analyses. Any study specific analyses will be described in future manuscripts dedicated to research aims for this project. We freely provide our image processing pipeline on github to be used for similar studies. All software packages referenced throughout this section can be obtained with proper research credentials and/or collaboration with other laboratories.
All image processing is completed within the URMC servers either on laboratory desktops or in the Center for Integrated Research Computing (CIRC), except for WMH lesion segmentation. All software used for processing are installed according to proper research agreements. Figure 3 shows our CSVD image processing pipeline. Any deviations from this comprehensive image processing pipeline will be fully detailed in subsequent papers directly pertaining to specific analyses posed.
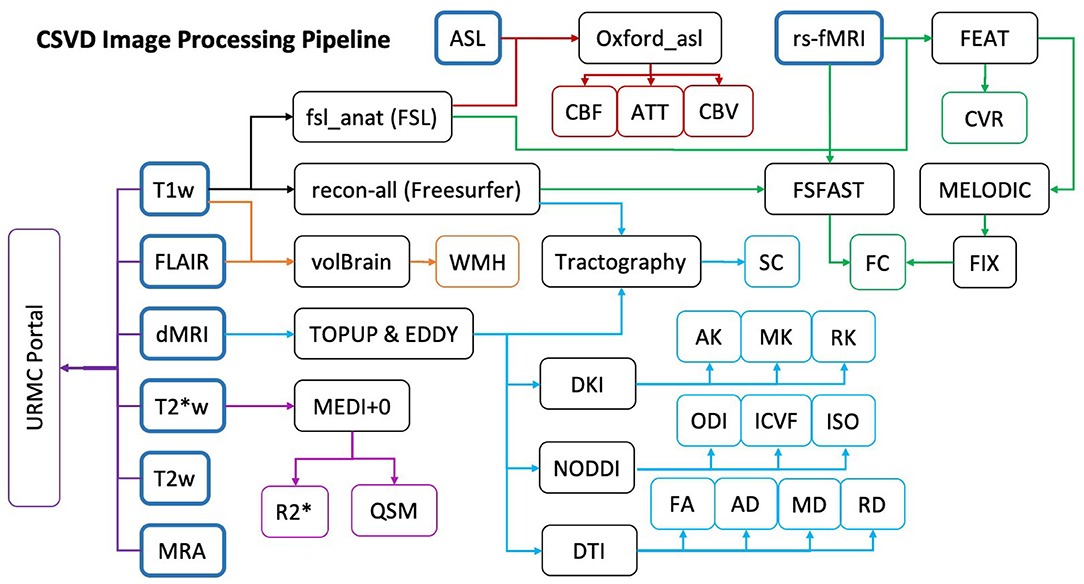
Figure 3. Study MRI data processing pipeline. Colored arrows indicate the steps taken for sequence specific processing: ASL (red), fMRI (green), T1w (Black), FLAIR (Orange), dMRI (Light Blue), T2*w (Purple). Final quantitative metrics calculated from each processing pipeline are indicated in the colored endpoints. The Dark Purple URMC Portal shows the sequences sent to our radiologist for clinical evaluation.
From the structural images collected, we process only the T1w and FLAIR data. In addition to the processing steps described below, we anonymize the T1w NifTI image by removing the face via Freesurfer's mri_deface tool (26). This anonymization ensures that we do not violate any data sharing protocols in certain stages of our processing pipeline. The T2w and MRA images are used exclusively by our team's radiologist for diagnostic purposes. As previously mentioned, all diagnostic findings are maintained in our BLIS database. It is worth noting that there are a few quantitative values calculated from the MRA images. The right and left internal carotid and basilar arterial diameters are measured inside Philips IntelliSpace Portal by our radiologist and uploaded to our database.
Structural segmentation is performed on the T1w images using the anatomical processing script (fsl_anat), available as part of FMRIB's Software Library (FSL) (27–29). Unless otherwise specified, all processing is performed using version 6.0.0. The processing pipeline includes image reorientation and cropping, radio-frequency bias-field correction, linear, and nonlinear registration to Montreal Neurological Institute (MNI)-152 2 mm standard space via FLIRT (30, 31) and FNIRT (32) respectively, brain extraction via BET (33), tissue segmentation with FAST (FMRIB's Automated Segmentation Tool) (34), and subcortical structure segmentation using the FIRST algorithm (35).
Cortical reconstruction and volumetric segmentation is performed with the Freesurfer image analysis suite, which is documented and freely available for download online (http://surfer.nmr.mgh.harvard.edu/). The technical details of these procedures are described in prior publications. Briefly, this processing includes motion correction and averaging (36) of multiple volumetric T1w images (when more than one is available), removal of non-brain tissue using a hybrid watershed/surface deformation procedure (37), automated Talairach transformation, segmentation of the subcortical white matter and deep gray matter volumetric structures (including hippocampus, amygdala, caudate, putamen, ventricles) (38, 39) intensity normalization (40), tessellation of the gray matter white matter boundary, automated topology correction (41, 42), and surface deformation following intensity gradients to optimally place the GM/WM and GM/CSF borders at the location where the greatest shift in intensity defines the transition to the other tissue class (43, 44). Once the cortical models are complete, a number of deformable procedures can be performed for further data processing and analysis including surface inflation (45), registration to a spherical atlas which is based on individual cortical folding patterns to match cortical geometry across subjects (46), parcellation of the cerebral cortex into units with respect to gyral and sulcal structure (39, 47), and creation of a variety of surface based data including maps of curvature and sulcal depth. This method uses both intensity and continuity information from the entire three dimensional MR volume in segmentation and deformation procedures to produce representations of cortical thickness, calculated as the closest distance from the GM/WM boundary to the gray/CSF boundary at each vertex on the tessellated surface (44). The maps are created using spatial intensity gradients across tissue classes and are therefore not simply reliant on absolute signal intensity. The maps produced are not restricted to the voxel resolution of the original data thus are capable of detecting submillimeter differences between groups. Procedures for the measurement of cortical thickness have been validated against histological analysis (48) and manual measurements (49, 50). Freesurfer morphometric procedures have been demonstrated to show good test-retest reliability across scanner manufacturers and across field strengths (51, 52).
We use both the anonymized T1w and the FLAIR images to quantitatively determine total WMH lesion burden. To do so we use volBrain, an automated online MRI brain volumetry system (53). More specifically, we make use of the lesionBrain pipeline to segment and classify any WMH lesions in our subjects (54). The lesionBrain pipeline consists of the following stages: preprocessing, structure segmentation, candidate mapping, lesion segmentation, and lesion classification. Upon completion of the pipeline, a detailed report is generated and includes the overall lesion load, the number of lesions in each lesion class (periventricular, juxtacortical, deep white, and infratenorial). We use this quantitative measure of WMH burden to supplement, rather than corroborate, our clinical findings for future analyses.
Briefly, preprocessing of the images includes intensity normalization and registration to MNI space, denoizing by an adaptive nonlocal means filter (55), correction for inhomogeneity (56, 57), and tissue segmentation [gray matter (GM), white matter (WM), and cerebrospinal fluid (CSF)] (58). Structure segmentation further segments the following brain structures: intracranial cavity (ICC), brainstem, cerebellum, and lateral ventricles (59–61). Candidate mapping is performed only in areas where lesions are likely to be found. The mean (μ) and standard deviation (σ) of the GM FLAIR intensities are used to estimate a threshold (thr = μ + ασ, where α = 0.5) above which all voxels within the ICC mask are considered as lesion candidates. Due to some inconsistencies in training the algorithm compared to the lesionBrain training dataset, any voxels that lie within a previously built lesion atlas are also considered as lesion candidates (62, 63). Lesion segmentation is performed using an extension of the RI-NLM method (64). Segmentation is performed in two stages to account for challenges associated with both a voxel-based and patch-based approach. The RI-NLM method is first applied to the T1w and FLAIR images to obtain a lesion probability mask. This is followed by a secondary regularization step using a patch-wise denoizing filter (65). The weights of the filter are estimated on the FLAIR and used to average the lesion probabilities. Systematic error correction is automatically used to produce the final lesion segmentations (66, 67). Finally, a classification algorithm is used to classify lesion type.
With a high angular resolution diffusion imaging (HARDI) acquisition, we are able to derive many quantitative metrics using various post-processing techniques. This section covers the following stages of our diffusion image processing pipeline: preprocessing, diffusion tensor imaging (DTI), diffusion kurtosis imaging (DKI), neurite orientation dispersion and density imaging (NODDI), GM and WM based spatial statistics (GSBSS and TBSS), tractography, and structural connectivity (SC) extraction.
The preprocessing pipeline for all subsequent post-processing included brain extraction using FSL's BET (33), susceptibility induced distortion correction using TOPUP (28, 68), and eddy-current induced distortion and subject motion corrections using EDDY (69). Data is collected with reversed phase-encode blips, resulting in pairs of images with distortions going in opposite directions. From these pairs the susceptibility-induced off-resonance field is estimated using a method similar to that described in (68) as implemented in FSL and the two images are combined into a single corrected one. More technical information about FSL's EDDY can be found in (68–70). This preprocessing pipeline is applied to all subsequent post-processing methods, described below. Images are manually inspected using the motion correction reports and data visualization software upon completion of data preprocessing to catch any errors during preprocessing. Errors during preprocessing are corrected on an individual basis, as needed.
Whole-brain voxel-wise metrics are calculated from various post-processing techniques to provide more information about the diffusivity properties of brain tissues. We obtain ten different metrics from our HARDI data that is modeled by three theoretical diffusion signals. Diffusion tensor imaging (DTI) is a model fitting technique that fits the diffusion tensor model (71). Metrics are fit to each voxel using a linear regression with sum of least-squares error and fractional anisotropy (FA), axial diffusivity (AD), mean diffusivity (MD), and radial diffusivity (RD) maps using FSL's DTIFIT. Diffusion kurtosis imaging (DKI) extends the second order diffusion tenor model to a fourth order kurtosis model to fit additional metrics (72). Axial kurtosis (AK), mean kurtosis (MK), and radial kurtosis (RK) metrics are calculated using the DKI estimator in the Diffusion Imaging in Python (DIPY) module in Python 3.6 (73). The DKI estimator in DIPY automatically fits the four tensor metrics as well. As part of quality control checks of the processed data, we correlate the tensor metrics fit by DTI and DKI to ensure within-subject consistency prior to analyses. Finally, neurite orientation dispersion and density imaging (NODDI) estimation is processed using the NODDI Toolbox v1.0.1 run on the MATLAB platform (R2018a). NODDI estimation fits each parameter of the NODDI model using maximum likelihood estimation using a Rician noise model with the Gauss-Newton nonlinear optimization technique (74). The voxel-wise metrics produced from the NODDI model are the neurite density or intracellular volume fraction (ICVF), orientation dispersion index (ODI), and extracellular or isotropic volume fraction (ISO). These NODDI parameters are reliable in the GM in addition to WM. In summary, we fit ten quantitative diffusion metrics from three different signal models using our HARDI data.
Since we build so many whole-brain voxel-wise metrics, it is important that we prepare each map for group-based analyses. On a voxel-wise scale, the most common group analysis is whole-brain spatial statistics. While we do not present specific spatial statistical analyses, we do present two options for spatial statistics and describe the steps taken to prepare for each. The main option we use for group analysis is tract-based spatial statistics (TBSS) in FSL (28, 33, 75–77). In order to perform TBSS along WM tracts, three main steps are required. The first step is nonlinear alignment of each subject's FA map to the FMRIB58_FA 1 mm standard space target via FNIRT. Second, a skeleton projection is created by thresholding the FA intensities of all subjects. Finally, voxel-wise statistics is performed on the skeleton using FSL's randomize with research specific hypothesis testing (78). Due to the high quality HARDI and rs-fMRI acquisitions that we use, we have the option of also performing NODDI-improved GM-based spatial statistics (N-GSBSS) using the N-GSBSS pipeline (79). The N-GSBSS pipeline is self-contained and does not directly follow from any preprocessing described above.
The final stage of diffusion processing is tractography in order to calculate SC matrices for each subject. After diffusion preprocessing, the eddy corrected diffusion weighted images are postprocessed using MRtrix3 (www.mrtrix.org), Advanced Normalization Tools (ANTs) (80), and the Sherbrooke Connectivity Imaging Lab toolbox in python (Scilpy) as part of the population-based SC (PSC) pipeline (81). The b0 reference image is extracted, skull stripped, bias-field corrected, cropped, intensity normalized, and resampled to 1 mm isotropic resolution. The high-resolution T1w anatomical image is then registered to the high-resolution diffusion image using ANTs registration tools before being passed through Freesurfer's recon-all pipeline. Once the standard atlas parcellations are rigidly registered to this diffusion anatomical space, the fiber orientation distribution function (fODF) is calculated within each voxel to prepare for tractography (82). Tractography is performed using a particle filtering tractography (PFT) algorithm (83). Finally, invalid streamlines are removed and SC matrices are calculated for both the Desikan-Killiany (47) and Destrieux (84) atlases using the PSC toolbox.
QSM reconstruction is performed utilizing the morphology enabled dipole inversion with zero-tissue referencing (MEDI+0) toolbox (85–88), on the MATLAB R2018a environment (The Mathworks, Inc., Natick, MA). Phase unwrapping is performed and background field removal is completed using the projection onto dipole field (PDF) method. R2* maps are produced via a monoexponential curve fitting and used to create CSF masks to use as anatomical prior information before performing MEDI. Finally, the dipole inversion is performed using L1 regularization with Lagrange multipliers λ set to 1,000 and λCSF set to 100, spherical mean value (SMV) radius set to 5, and the model error reduction through iterative tuning (MERIT) option (89). R2* maps are calculated during the QSM reconstruction process and separately saved. Zero-tissue referencing is done with respect to CSF and incorporated into the reconstruction toolbox to allow for more accurate intersubject comparisons.
Both QSM and R2* maps are coregistered to the high resolution structural and MNI152-2 mm standard spaces via the magnitude image of the first echo of the data. Linear registration between the T1w and QSM map is performed using FLIRT, while FNIRT nonlinear registration is used to register the QSM map to standard space. Whole-brain voxel-based comparisons are performed in standard space using FSL's randomize tool (78) with family-wise error rate correction after gaussian smoothing of 5 mm to account for coregistration errors and other susceptibility induced artifacts.
Similar to the diffusion processing pipeline, our functional images can be used for more than one purpose. Our functional processing pipeline includes the following steps: volumetric preprocessing, denoizing, and resting state network (RSN) extraction, whole-brain voxel-wise CVR calculation, volumetric functional connectivity (FC) calculation, and surface-based preprocessing, denoizing, RSN extraction, and FC calculation. While others have proposed to incorporate both volumetric and surface-based functional processing data for more integrated information, we keep our volumetric and surface-based processing independent of each other. Steps may be adopted in the future to incorporate both types of functional processing, depending on more specific analyses.
FMRI data processing is carried out using FSL's FMRI Expert Analysis Tool (FEAT) Version 6.00. Registration to high resolution structural is carried out using boundary-based registration (BBR) (90). Registration from high resolution structural to standard space is then further refined using FNIRT nonlinear registration (32, 77). The following pre-statistics processing is applied: motion correction using MCFLIRT (91); slice-timing correction using Fourier-space time-series phase-shifting; non-brain removal using BET (33); spatial smoothing using a Gaussian kernel of FWHM 5 mm; grand-mean intensity normalization of the entire 4D dataset by a single multiplicative factor; high-pass temporal filtering (Gaussian-weighted least-squares straight line fitting, with sigma = 50.0 s).
Independent component analysis (ICA) based exploratory data analysis is carried out using probabilistic ICA (92) as implemented in FSL's Multivariate Exploratory Linear Decomposition into Independent Components (MELODIC) Version 3.15 in order to investigate the possible presence of unexpected artifacts or activation. The following data preprocessing is applied to the input data: masking of non-brain voxels; voxel-wise demeaning of the data; and normalization of the voxel-wise variance. Preprocessed data are whitened and projected into a 64-dimensional subspace using probabilistic principal component analysis (PCA) where the number of dimensions is estimated using the Laplace approximation to the Bayesian evidence of the model order (92, 93). The whitened observations are decomposed into sets of vectors which describe signal variation across the temporal domain (time-courses) and across the spatial domain (maps) by optimizing for non-Gaussian spatial source distributions using a fixed-point iteration technique (94). Estimated component maps are divided by the standard deviation of the residual noise and thresholded by fitting a mixture model to the histogram of intensity values (92).
After all functional preprocessing and exploratory ICA analysis has been completed, we use FMRIB's ICA-based Xnoiseifier (FIX) to automatically classify “good” and “bad” components in order to remove the “bad” components from the time series data (95, 96). FIX runs on FSL, MATLAB, and R (97), with a series of dependent packages in each. Due to the similar nature of our functional data to the Human Connectome Project's (HCP), we utilize the pretrained weights from the “minimally-preprocessed” 3T HCP-like datasets (TR = 0.7 s, 2 mm isotropic resolution, 15 min session, minimal high pass temporal filtering) (95, 98). Unfortunately, our scanning parameters are not identical to HCP's, so we do expect some classification errors due to the nature of the FIX algorithm. As such, all images and components are manually checked for consistency before removing “bad” components.
We calculate the CVR index for each voxel in standard and native spaces following the method described in (99). Note that CVR is calculated before MELODIC and FIX processing by in house scripts. CVR is an indirect measure of how blood vessels respond to changes in carbon dioxide. However, due to the resting state nature of our study, we use a data-driven approach to calculate reactivity. Others have previously demonstrated that reactivity signals are part of the average BOLD signal of all GM voxels (99). In order to calculate CVR, we first perform a band pass filter to obtain the 0.02–0.04 Hz frequency range. We then take the average BOLD time course of all GM voxels of an individual and use it as a regressor against the voxel-wise time-course of every voxel in the brain. The regression coefficient associated with this linear model is then normalized by a reference tissue to obtain the relative CVR of every voxel.
Finally, we use the denoized functional data to build FC matrices between regions of the brain. There is no consensus on the best way to calculate FC (100). We use the atlas-based FC Pearson correlation (101) implementation in the Nilearn: Machine learning for Neuro-Imaging in Python module (102). We incorporate the standard nuisance regressors: translational and rotational motion, WM, CSF, and the global signals. We build FC matrices with and without various combinations of nuisance regressors for both the Desikan-Killiany (47) and Destrieux (84) atlases, similar to the SC matrices. By saving matrices with different combinations of regressors, we provide options for many kinds of future analyses without having to recalculate FC matrices.
Surface-based fMRI preprocessing is carried out using the Freesurfer functional analysis streamline (FSFAST) pipeline using Freesurfer version 6.0.1. The following pre-statistics processing is applied: motion correction using MCFLIRT (91); slice-timing correction using Fourier-space time-series phase-shifting (103); non-brain removal and masking; registration to the anatomical; sampling to the surface; and surface smoothing using a Gaussian kernel of FWHM 5 mm. Surface sampling is performed onto the left and right hemispheres in the native anatomical (diffusion) space. Once the functional preprocessing steps are completed, nuisance regressors are calculated using principal component analysis (PCA). Surface-based registration methods in Freesurfer are used to register individual native surfaces to the fsaverage mesh space prior to any group-wise analyses (45). We use surface-based adaptions of all of the volumetric post-processing methods to obtain surface-based RSNs and FC matrices. Additionally, surface-processed rs-fMRI is used to derive seed-based connectivity maps to compare differences between groups with better spatialization on the cortical surface. While it is possible to combine both the volumetric and surface-based fMRI data after preprocessing, as has been done in the HCP minimal preprocessing pipelines (104), we do not utilize the HCP pipeline due to the 2D nature of our T2w images.
ASL images are processed using the Oxford ASL tool (105–107). Preprocessing includes motion correction using MCFLIRT, slice timing correction, distortion correction, spatial regularization, and registration to high resolution anatomical space using the boundary-based registration (BBR) algorithm (90) and to MNI152-2 mm standard space using FNIRT nonlinear registration. CBF quantification is run in three steps: Bayesian inference for CBF according to the Buxton kinetic curve model (108), Bayesian inference of further parameters as applicable to multi-delay data, including cerebral blood volume (CBV) and arterial transit time (ATT), and Bayesian inference with spatial priors to fine tune the model parameters initialized by the high-resolution anatomical image.
For pre-specified regions of interest (ROIs), we also calculate average ROI values for all 16 previously described quantitative metrics: DTI (FA, AD, MD, and RD), DKI (AK, MK, and RK), NODDI (ISO, ICVF, and ODI), QSM (QSM and R2*), fMRI (CVR), and ASL (CBF, ATT, and CBV). We use the following atlases for ROI extraction, available in FSL in standard MNI152-2 mm space: Harvard-Oxford cortical (HO-cor) and subcortical (HO-sub) (47, 109–111) and the Johns Hopkins University WM tracts (JHU-tracts) (112–114). To obtain the most accurate averages for each metric, we take each ROI defined in each atlas and apply nonlinear and linear inverse warps with FNIRT and FLIRT to warp each ROI to native metric spaces. After warping, ROIs are binarized before taking the average metric within each ROI. Each value is uploaded to BLIS for future analyses. The only metric that is not averaged in native space is the CVR due to some theoretical limitations described in the literature (see Discussion).
The sample size calculation reflects differences in imaging metrics previously reported by our group and others in HIV infected individuals compared to HIV uninfected individuals. Here we present a power analysis starting with DTI metrics derived from one of our studies on patterns of white matter injury in HIV infection (115).
Fifty HIV participants and 13 HIV-uninfected controls were used in that study. From the results of this study, we selected two brain areas that provide reliable and reproducible DTI measurements, namely the body and splenium of the corpus callosum (BCC and SCC), although we identified other white matter structures that show even more significant differences between HIV- controls and HIV+ subjects. Therefore, the power calculation should err on the conservative side. The mean MD value among controls for the BCC and SCC is 0.964, the pooled standard deviation computed from all subjects is 0.049, and the observed effect size is 0.0371, which represents a 3.8% difference based on the sample mean of the controls. The power is calculated based on the information from this preliminary study using a two-sided t-test for comparing two groups, which is reported in Table 3.
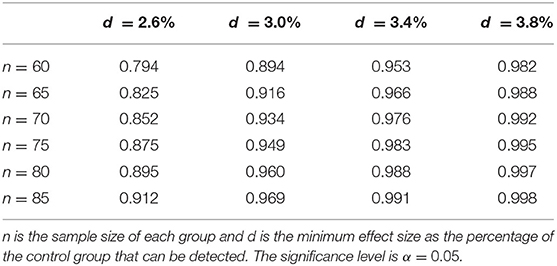
Table 3. Statistical Power for two-sample Student T-test based on mean MD of the BCC and GCC.
Based on this table, if we assume to have at least 60 HIV- control subjects and at least 60 HIV+ subjects, we can detect a very conservative effect size of 3.0% with about 90% power between the two groups. A similar power calculation can be derived using data from a recent publication from (116) assessing brain white matter hyperintensity in HIV infection. The median (IQR) periventricular WMH load for the HIV+ group (n = 103) and control group (n = 70) is 0.8(1.5) and 0.4(1.0), respectively. If we recruit 80 subjects in each group, we have 80% of statistical power at significance level α = 0.05. However, in both our previous study and (116) the mean age was around 50 years of age. To further investigate age-CSVD interaction, we will also include subjects younger than 50 years old. We assume that the frequency of CSVD will decrease with the addition of younger subjects but it will still be more frequent in HIV+ compared to HIV- subjects. Therefore, assuming conservatively that the true difference may be only 2.6% (if younger subjects are included) as opposed to around 3.8% (if only older subjects were included), if we have n = 85 subjects per group, we can achieve more than 90% statistical power. Furthermore, considering a drop-out rate of about 20%, we plan to recruit n = 110 subjects per group for a total of 220 subjects.
Ances et al. (21) measured resting CBF in the lenticular nuclei of HIV+ (n = 33, mean = 47.1) and HIV- individuals (n = 26, mean = 56.2). The pooled standard deviation was 8.1. Based on these results, the statistical power is more than 90% even if we only have n = 30 in each group.
Limited information is available in the literature on HIV-associated changes in brain tissue susceptibility. Miszkiel et al. (117) measured R2* in several ROIs of HIV infected (n = 28) and uninfected (n = 15) subjects. In the globus pallidus, the mean group differences and pooled standard deviations are 0.0029 and 0.0027, respectively; in the caudate, the group difference is smaller (0.0019) and the pooled standard deviation is larger (0.0037). By using the conservative results from the caudate, we can still achieve 91% statistical power with n = 85 subjects in each group.
Decreased cognitive performance is well documented in HIV infection and demonstrable even with small sample size (118, 119). In our previous studies, we observed a mean Z-score of −1.14 in HIV+ subjects compared to a mean Z-score of 1.46 and a pooled standard deviation of 4.02. Thus, with n = 85 in each group, the statistical power is 99%. However, our goal goes beyond a comparison between HIV+ and HIV- subjects. Rather, we will use a high-dimensional multivariate regression analysis with a data-driven model selection procedure and multiple testing adjustment. We are confident that most, if not all, of the multivariate associations investigated will be significant, because for n = 85 in each group, we have adequate power for these covariates in the marginal power analyses.
Demographic and clinical data are assessed by descriptive analysis using means and standard error (SE), medians and inter-quartile ranges for continuous variables, and proportions for categorical variables. We use graphical methods such as histograms, Q-Q plots, and box-plots to visualize the data and identify potential data problems such as outliers, missing data, and skewness. If problems are detected, appropriate data preparation steps such as outlier removal, data imputation, and log-transformations are considered.
Comparisons between two independent groups (e.g., HIV+ versus HIV- subjects at baseline) are conducted by either two-group Welch's t-test or Wilcoxon ranksum test (for continuous variables), or Fisher's exact test (for categorical variables). One-way analysis of variance (ANOVA) F-test followed by Tukey's post-hoc test and Kruskal-Wallis test with Dunn post-hoc test are used to compare continuous variables across 3 or more (K ≥ 3) groups. Paired t-test and Wilcoxon signed-rank test are used to compare the levels of continuous variables between two visits. Repeated measures ANOVA F-test and Friedman test are used to test marginal group differences across multiple time points. Pearson and Spearman correlation analyses are used to assess marginal associations between two continuous variables. The R package cocor is used to compare the correlation coefficients computed from the two cohorts (120). A p-value < 0.05 is considered statistically significant for a single hypothesis testing problem. For inferential problems that involved multiple hypotheses, the Benjamini-Hochberg multiple testing procedure (121) is used to control the false discovery rate (FDR) at the < 0.05 level. All statistical analyses are performed in R (R Foundation for Statistical Computing, Vienna, Austria).
Multivariate regression models are used to quantify the associations between selected covariates and continuous response variables at BSL, 18-month, and 36-month visits, controlling for potential confounding effects such as age. The response variable and covariates in these regression models depend on specific research aims. For example, at BSL, we can designate cognitive function (measured by the neuropsychological tests) as the response variable and associate it with a host of covariates including brain injury (measured by various brain imaging markers), HIV status (cohort), cART treatment, cardiovascular risk score, and age. As an extension, linear mixed effects regression (LMER) models are be applied to data collected at all three visits from both cohorts. We use per-subject random intercepts to account for serial correlations between multiple time points. If needed, certain interaction terms may be included. For example, we may include the interaction between visit and age to account for potential pattern differences of cART treatment effects between young and old subjects. In these LMER analyses, parameters are estimated by the restricted maximum likelihood (REML) criterion, and the statistical significance is assessed by the adjusted ANOVA F-test provided by R package lmerTest (122). For both cross-sectional multivariate regression and longitudinal LMER analyses, the fitted linear coefficients, their 95% confidence intervals, and the corresponding p-values are reported.
Since multiple types of data are used in this study and many of them are high-dimensional, it helps to use both domain knowledge and data-driven methods to select compact models and prevent model overfitting. For example, instead of including all ROIs in inferential statistical analyses, we prioritize those ROIs with known relationship with the outcome variables as documented by previous literature or our preliminary studies. Data driven methods, such as factor analysis, cluster analysis, as well as statistical model selection methods for regression can be used to further reduce the number of hypotheses to be tested or covariates in regression models. Step-wise methods based on Akaike Information Criterion (AIC) and/or Bayes Information Criterion (BIC) can be used for models with low to moderate numbers of covariates (p ≤ 20). For even larger models, we apply penalized regression techniques such as LASSO (123), elastic net (124), and SCAD (125), instead.
CSVD in HIV infected individuals is likely a multifactorial disease where there is a convergence of traditional vascular risk factors (hypertension, hyperlipidemia, diabetes, and age) and HIV mediated chronic inflammation. The prevalence of CSVD in HIV infected individuals over the age of 50 has been reported with a wide range from 48 to 80% (7, 116). A recent study which enrolled 456 HIV+ and 154 HIV- subjects found that 51.5% of HIV+ vs. 36.4% of HIV- subjects had signs of CSVD (126). HIV infection in this study is considered as an independent risk factor for CSVD. CSVD and HIV infection may also have a synergistic effect on brain function and increase the risk of cognitive impairment in this vulnerable population. CSVD is associated with an increased likelihood of HAND (10), though there is some evidence that the contribution of CSVD to cognitive impairment is independent of that of HIV infection itself (127). In the cART era, individuals living with HIV infection have significantly increased life expectancy; however, quality of life may be reduced with significant rates of HAND. CSVD may be a modifiable risk factor of disease morbidity; identifying reliable surrogate biomarkers would be essential for targeting interventions.
Two recent reports have linked soluble markers released by monocytes and endothelial cells with CSVD in the general population, including neopterin, sICAM-1, sVCAM-1, osteoprotegerin, and Lp-PLA2 mass (11, 12). It is interesting that neopterin, typically produced by activated monocytes/macrophages, is also a marker of HIV-associated CNS injury (128). Furthermore, monocyte activation is associated with decreased cognitive function in HIV+ individuals (129) and there is preliminary evidence that reductions in monocyte activation following treatment with a C-C chemokine receptor type 5 (CCR5) antagonist are associated with improvements in cognitive function, particularly in the domains of attention and working memory (130).
Lp-PLA2 is also secreted by myeloid cells such as macrophages and is involved in cleavage of the oxidized phosphatidyl-choline component of LDL particles and thus has been strongly associated with atherosclerosis (131). Two additional markers derived from monocytes have been implicated in atherosclerosis and are elevated in HIV infection: sCD163 and HMGB1 (132–136). CD163, a monocyte-specific scavenger receptor, is shed during activation as soluble CD163 (sCD163) in HIV-infected individuals prior to and after cART treatment (137). HIV+ patients exhibit elevated levels of sCD163 and neopterin in an age-dependent manner (138–140), which is even more concerning for atherosclerosis in older HIV+ individuals.
HMGB1 is a nuclear factor and a secreted protein (141). HMGB1 is secreted by activated MΦ (142) and also rapidly leaked when membrane integrity is lost in permeabilized or necrotic cells (143). Extracellular HMGB1 and its receptors, RAGE, TLR2, and TLR4, have been implicated in mechanisms of many inflammatory diseases, including sepsis, atherosclerosis, and rheumatoid arthritis (144) by induction of senescence-associated secretory phenotype via NF-kB activation (145). Plasma levels of HMGB1 are elevated during the course of HIV infection and possibly associated with high viral load (135).
Platelets also play a major role in very early stages of response to an injury by trauma or infection. Platelets are very sensitive to inflammatory stimuli and are increasingly recognized as important immune mediators. Increased platelet activation is widely observed in patients with HIV infection (13, 146–148). Their high numbers in circulation compared with that of circulating leukocytes and ability to release pro/anti-inflammatory mediators stored in secretory granules suggest that platelets are critical players in the early phase of the host immune response (149–152). Platelets regulate functions beyond homeostasis and have been identified as a functional player in both innate and adaptive immune systems (153, 154). In the immune system, one of these functions is to promote trafficking of immune cells into injured tissues by upregulation of P-selectin (CD62P) and CX3CR1, leading to enhanced rolling of leukocytes along the vascular endothelium. Thus, activated platelets mediate the interaction between the endothelium and circulating immune cells and can participate in the pathology of the disease during acute and chronic inflammatory conditions (155–158).
Beyond the standard clinical MRI sequences used to diagnose CSVD in our study participants, we use a novel combination of advanced MRI sequences to explore the underlying pathomechanisms of HIV-associated CSVD. Several studies have documented HIV-associated central nervous system (CNS) injury and specifically white matter microstructure changes (115, 159, 160), but these findings have not been evaluated in the context of CSVD. Given the aging HIV population, the prevalence of CSVD is going to increase, contributing to altered brain connectivity and cognitive impairment (161, 162).
In order to interrogate these WM microstructural changes, we use a HARDI sequence that allows the reconstruction of quantitative microstructural metrics throughout the brain. Studies have shown that in aging populations, FA decreases while AD, MD, and RD increase (163). Similarly, NODDI metrics have also shown to incur significant changes in older adults compared to controls; ODI increases while ICVF and ISO tend to decrease with aging (164). Given our rs-fMRI sequence, we are able to obtain individual and group profiles of resting state networks (RSNs) and CVR. Based on previous studies, we expect RSNs to deviate in a cohort with chronic inflammatory processes compared to controls (165).
The Human Connectome Project (HCP) is considered the current gold standard for connectivity data and analyses (98). We have taken advantage and adopted many of the recommendations of the HCP, building a robust processing pipeline that will be sensitive to SC and FC patterns thus reflective of cognitive changes. For example, we are able use our diffusion sequence to perform high quality streamline tracking to estimate the WM fiber curves of our participants, allowing us to build more reliable SC profiles than standard clinical diffusion sequences. Group effects due to chronic inflammatory processes have shown changes in SC that correlate with cognitive measures (166). Additionally, we collect rs-fMRI with a low TR and high spatial resolution, which gives us the flexibility to perform both volumetric and surface-based image processing and analyses. As such, we can build FC profiles for each participant, which have also been shown to deviate from controls in the presence of chronic inflammation and CSVD (161).
CVR via rs-fMRI is reflective of the ability of cerebral blood vessels to respond to vasoactive stimuli, which has been shown to correlate with cognitive decline in older adults and groups impacted by vascular diseases (167). The approach we use to measure CVR does not provide absolute quantification at the voxel level. However, a recent study has demonstrated that it may be possible to adjust relative CVR values by tissue referencing across a population (168).
With the presence of WMHs, subcortical iron deposition concentration has been shown to increase, likely due to oxidative stress on the brain (169). QSM is sensitive to changes in iron deposition and is likely useful to assess longitudinal changes in tissue susceptibility concentration (88). Additionally, R2* mapping is sensitive to tissue differences in tissue susceptibility distribution. Incorporating measures from both QSM and R2* mapping has the potential to assess iron related changes in the brain, especially in the deep gray matter with high vasculature (170).
Finally, perfusion metrics have been shown to be direct measures of vascular health. Decreased regional CBF is seen in the early stages of HIV infection (171) and has been associated with vascular risk factors such as increased triglyceride levels in HIV+ men (172). Changes in arterial thickness and extra-cranial vessel diameters have been shown in the context of HIV (173). By incorporating measures of larger intra- and extra-cranial vessel diameters (by MRA), we are able to assess the extent to which HIV impacts blood flow in the context of CSVD. This study allows us to relate the blood markers of vascular disease to the presence of cognitive impairment, identify regional areas of hypoperfusion, and determine how they relate to specific patterns of cognitive dysfunction.
This study protocol description serves to outline a comprehensive longitudinal study at the University of Rochester to study the effects of aging and HIV on CSVD and provide detailed data acquisition parameters for others to implement similar neuroimaging studies at or higher than the current standard for neuroimaging studies about CSVD without contrast agents. We also provide a comprehensive data processing pipeline, available on github, and detail every step taken for future analyses. Specific aims associated with this study will be addressed in a series of baseline and longitudinal follow-up analyses upon successful collection and processing of all data necessary for each aim.
The studies involving human participants were reviewed and approved by University of Rochester Research Subjects Review Board. The patients/participants provided their written informed consent to participate in this study.
KM drafting/revising of the manuscript for content, image processing pipeline creation, and acquisition and interpretation of data. MU, YZ, MT, MS, XQ, HW, MW, and JZ revising manuscript for content and acquisition and interpretation of data. SM and GS revising of the manuscript for content, including medical writing, study concept, design, and acquisition and interpretation of data. All authors have read and approved the manuscript before submission.
This study was funded by the National Institute of Health grant R01-AG054328 to GS and SM: role of myeloid cells in cerebrovascular permeability and reactivity in older HIV infected individuals.
The authors declare that the research was conducted in the absence of any commercial or financial relationships that could be construed as a potential conflict of interest.
We would like to acknowledge the contributions of additional team members to the efforts of this study, including study coordination, statistical support, image processing assistance, and key team members. Study coordinators include Jill Guary, Teresa Oh, Gillian Crysler, and Valerie Kline. Biostatistical support includes Lu Wang and Alicia Terrell. Schifitto imaging lab members assisting with data quality assurance and image processing include Abrar Faiyaz, Alan Finkelstein, and Arun Venkataraman.
1. Pantoni L. Cerebral small vessel disease: from pathogenesis and clinical characteristics to therapeutic challenges. Lancet Neurol. (2010) 9:689–701. doi: 10.1016/S1474-4422(10)70104-6
2. Wardlaw JM, Smith EE, Biessels GJ, Cordonnier C, Fazekas F, Frayne R, et al. Neuroimaging standards for research into small vessel disease and its contribution to ageing and neurodegeneration. Lancet Neurol. (2013) 12:822–38. doi: 10.1016/S1474-4422(13)70124-8
3. Blair GW, Hernandez MV, Thrippleton MJ, Doubal FN, Wardlaw JM. Advanced neuroimaging of cerebral small vessel disease. Curr Treat Opt Cardiovasc Med. (2017) 19:56. doi: 10.1007/s11936-017-0555-1
4. Rosenberg GA, Wallin A, Wardlaw JM, Markus HS, Montaner J, Wolfson L, et al. Consensus statement for diagnosis of subcortical small vessel disease. J Cereb Blood Flow Metab. (2016) 36:6–25. doi: 10.1038/jcbfm.2015.172
5. Vinikoor MJ, Napravnik S, Floris-Moore M, Wilson S, Huang DY, Eron JJ. Incidence and clinical features of cerebrovascular disease among HIV-infected adults in the Southeastern United States. AIDS Res Hum. Retrovirus. (2013) 29:1068–74. doi: 10.1089/aid.2012.0334
6. McMurtray A, Nakamoto B, Shikuma C, Valcour V. Cortical atrophy and white matter hyperintensities in HIV: the Hawaii aging with HIV cohort study. J Stroke Cerebrovasc Dis. (2008) 17:212–7. doi: 10.1016/j.jstrokecerebrovasdis.2008.02.005
7. Ortiz G, Koch S, Romano J, Forteza A, Rabinstein A. Mechanisms of ischemic stroke in HIV-infected patients. Neurology. (2007) 68:1257–61. doi: 10.1212/01.wnl.0000259515.45579.1e
8. Morgello S, Murray J, Van Der Elst S, Byrd D. HCV, but not HIV, is a risk factor for cerebral small vessel disease. Neurol Neuroimmunol NeuroInflamm. (2014) 1:e27. doi: 10.1212/NXI.0000000000000027
9. Haddow LJ, Dudau C, Chandrashekar H, Cartledge JD, Hyare H, Miller RF, et al. Cross-sectional study of unexplained white matter lesions in HIV positive individuals undergoing brain magnetic resonance imaging. AIDS Patient Care STDs. (2014) 28:341–9. doi: 10.1089/apc.2013.0230
10. Soontornniyomkij V, Umlauf A, Chung SA, Cochran ML, Soontornniyomkij B, Gouaux B, et al. HIV protease inhibitor exposure predicts cerebral small vessel disease. Aids. (2014) 28:1297–306. doi: 10.1097/QAD.0000000000000262
11. Rouhl RPW, Damoiseaux JGMC, Lodder J, Theunissen ROMFIH, Knottnerus ILH, Staals J, et al. Vascular inflammation in cerebral small vessel disease. Neurobiol Aging. (2012) 33:1800–6. doi: 10.1016/j.neurobiolaging.2011.04.008
12. Shoamanesh A, Preis SR, Beiser AS, Vasan RS, Benjamin EJ, Kase CS, et al. Inflammatory biomarkers, cerebral microbleeds, and small vessel disease: Framingham heart study. Neurology. (2015) 84:825–32. doi: 10.1212/WNL.0000000000001279
13. Singh MV, Davidson DC, Jackson JW, Singh VB, Silva J, Ramirez SH, et al. Characterization of platelet-monocyte complexes in HIV-1 Infected Individuals: possible role in HIV-associated neuroinflammation. J Immunol. (2014) 192:4674–84. doi: 10.4049/jimmunol.1302318
14. Metcalf Pate KA, Lyons CE, Dorsey JL, Shirk EN, Queen SE, Adams RJ, et al. Platelet activation and platelet-monocyte aggregate formation contribute to decreased platelet count during acute simian immunodeficiency virus infection in pig-tailed macaques. J Infect Dis. (2013) 208:874–83. doi: 10.1093/infdis/jit278
15. Barbour JD, Jalbert EC, Chow DC, Gangcuangco LMA, Norris PJ, Keating SM, et al. Reduced CD14 expression on classical monocytes and vascular endothelial adhesion markers independently associate with carotid artery intima media thickness in chronically HIV-1 infected adults on virologically suppressive anti-retroviral therapy. Atherosclerosis. (2014) 232:52–8. doi: 10.1016/j.atherosclerosis.2013.10.021
16. Westhorpe CLV, Maisa A, Spelman T, Hoy JF, Dewar EM, Karapanagiotidis S, et al. Associations between surface markers on blood monocytes and carotid atherosclerosis in HIV-positive individuals. Immunol Cell Biol. (2014) 92:133–8. doi: 10.1038/icb.2013.84
17. Williams DW, Anastos K, Morgello S, Berman JW. JAM-A and ALCAM are therapeutic targets to inhibit diapedesis across the BBB of CD14 + CD16 + monocytes in HIV-infected individuals. J Leukocyte Biol. (2015) 97:401–12. doi: 10.1189/jlb.5A0714-347R
18. Williams DW, Byrd D, Rubin LH, Anastos K, Morgello S, Berman JW. CCR2 on CD14+CD16+ monocytes is a biomarker of HIV-associated neurocognitive disorders. Neurol Neuroimmunol NeuroInflamm. (2014) 1:1–9. doi: 10.1212/NXI.0000000000000036
19. Merino A, Buendia P, Martin-Malo A, Aljama P, Ramirez R, Carracedo J. Senescent CD14 + CD16 + monocytes exhibit proinflammatory and proatherosclerotic activity. J Immunol. (2011) 186:1809–15. doi: 10.4049/jimmunol.1001866
20. Nyugen J, Agrawal S, Gollapudi S, Gupta S. Impaired functions of peripheral blood monocyte subpopulations in aged humans. J Clin Immunol. (2010) 30:806–813. doi: 10.1007/s10875-010-9448-8
21. Ances BM, Sisti D, Vaida F, Liang CL, Leontiev O, Perthen JE, et al. Resting cerebral blood flow. Neurology. (2009) 73:702–8. doi: 10.1212/WNL.0b013e3181b59a97
22. Singh MV, Davidson DC, Kiebala M, Maggirwar SB. Detection of circulating platelet-monocyte complexes in persons infected with human immunodeficiency virus type-1. J Virol Methods. (2012) 181:170–6. doi: 10.1016/j.jviromet.2012.02.005
23. Antinori A, Heaton RK, Marder K. Updated research nosology for HIV- associated neurocognitive disorders. Neurology. (2007) 69:1789–99. doi: 10.1212/01.WNL.0000287431.88658.8b
24. Li X, Morgan PS, Ashburner J, Smith J, Rorden C. The first step for neuroimaging data analysis: DICOM to NIfTI conversion. J Neurosci Methods. (2016) 264:47–56. doi: 10.1016/j.jneumeth.2016.03.001
25. Fazekas F, Chawluk JB, Alavi A, Hurtig HI, Zimmerman RA. MR signal abnormalities at 1. 5 T in Alzheimer ' s dementia and normal aging deficiency. Am J Roentgenol. (1987) 149:351–6. doi: 10.2214/ajr.149.2.351
26. Bischoff-Grethe A, Ozyurt IB, Busa E, Quinn BT, Fennema-Notestine C, Clark CP, et al. A technique for the deidentification of structural brain MR images. Hum Brain Mapp. (2007) 28:892–903. doi: 10.1002/hbm.20312
27. Woolrich MW, Jbabdi S, Patenaude B, Chappell M, Makni S, Behrens T, et al. Bayesian analysis of neuroimaging data in FSL. NeuroImage. (2009) 45(1 Suppl.), S173–86. doi: 10.1016/j.neuroimage.2008.10.055
28. Smith SM, Jenkinson M, Woolrich MW, Beckmann CF, Behrens TEJ, Johansen-Berg H, et al. Advances in functional and structural MR image analysis and implementation as FSL. NeuroImage. (2004) 23(Suppl. 1):208–19. doi: 10.1016/j.neuroimage.2004.07.051
29. Jenkinson M, Beckmann CF, Behrens TEJ, Woolrich MW, Smith SM. Review FSL. NeuroImage. (2012) 62:782–90. doi: 10.1016/j.neuroimage.2011.09.015
30. Jenkinson M, Bannister P, Brady M, Smith SM. Improved optimization for the robust and accurate linear registration and motion correction of brain images. NeuroImage. (2002) 17:825–41. doi: 10.1006/nimg.2002.1132
31. Jenkinson M, Smith S. A global optimisation method for robust affine registration of brain images. Med Image Anal. (2001) 5:143–56. doi: 10.1016/S1361-8415(01)00036-6
32. Andersson JLR, Jenkinson M, Smith S. Non-linear Registration, Aka Spatial Normalization (FMRIB Technical Report TR07JA2). FMRIB (2010).
33. Smith SM. Fast robust automated brain extraction. Hum Brain Mapp. (2002) 17:143–55. doi: 10.1002/hbm.10062
34. Zhang Y, Brady M, Smith S. Segmentation of brain MR images through a hidden Markov random field model and the expectation-maximization algorithm. IEEE Trans Med Imaging. (2001) 20:45–57. doi: 10.1109/42.906424
35. Patenaude B, Smith SM, Kennedy DN, Jenkinson M. A Bayesian model of shape and appearance for subcortical brain segmentation. NeuroImage. (2011) 56:907–22. doi: 10.1016/j.neuroimage.2011.02.046
36. Reuter M, Rosas HD, Fischl B. Highly accurate inverse consistent registration: a robust approach. NeuroImage. (2010) 53:1181–96. doi: 10.1016/j.neuroimage.2010.07.020
37. Segonne F, Dale AM, Busa E, Glessner M, Salat D, Hahn HK, et al. A hybrid approach to the skull stripping problem in MRI. NeuroImage. (2004) 22:1060–75. doi: 10.1016/j.neuroimage.2004.03.032
38. Fischl B, Salat D Busa E, Albert M, Dieterich M, Haselgrove C, et al. Whole brain segmentation: automated labeling of neuroanatomical structures in the human brain. Neuron. (2002) 33:341–355. doi: 10.1016/S0896-6273(02)00569-X
39. Fischl B, van der Kouwe A, Destrieux C, Halgren E, Ségonne F, Salat DH, et al. Automatically parcellating the human cerebral cortex. Cereb Cortex. (2004) 14:11–22. doi: 10.1093/cercor/bhg087
40. Sled JG, Zijdenbos AP, Evans AC. A nonparametric method for automatic correction of intensity nonuniformity in MRI data. IEEE Trans Med Imaging. (1998) 17:87–97. doi: 10.1109/42.668698
41. Fischl B, Liu A, Dale A. Automated manifold surgery: constructing geometrically accurate and topologically correct models of the human cerebral cortex. IEEE Med Imaging. (2001) 20:70–80. doi: 10.1109/42.906426
42. Segonne F, Pacheco J, Fischl B. Geometrically accurate topology-correction of cortical surfaces using nonseparating loops. IEEE Trans Med Imaging. (2007) 26:518–29. doi: 10.1109/TMI.2006.887364
43. Dale A, Fischl B, Sereno MI. Cortical surface-based analysis: I. segmentation and surface reconstruction. NeuroImage. (1999) 9:179–94. doi: 10.1006/nimg.1998.0395
44. Fischl B, Dale AM. Measuring the thickness of the human cerebral cortex from magnetic resonance images. Proc Natl Acad Sci USA. (2000) 97:11050–5. doi: 10.1073/pnas.200033797
45. Fischl B, Sereno MI, Dale A. Cortical surface-based analysis: II: inflation, flattening, and a surface-based coordinate system. NeuroImage. (1999) 9:195–207. doi: 10.1006/nimg.1998.0396
46. Fischl B, Sereno MI, Tootell RBH, Dale AM. High-resolution intersubject averaging and a coordinate system for the cortical surface. Hum Brain Mapp. (1999) 8:272–84. doi: 10.1002/(SICI)1097-0193(1999)8:4<272::AID-HBM10>3.0.CO;2-4
47. Desikan RS, Ségonne F, Fischl B, Quinn BT, Dickerson BC, Blacker D, et al. An automated labeling system for subdividing the human cerebral cortex on MRI scans into gyral based regions of interest. NeuroImage. (2006) 31:968–80. doi: 10.1016/j.neuroimage.2006.01.021
48. Rosas HD, Liu AK, Hersch S, Glessner M, Ferrante RJ, Salat DH, et al. Regional and progressive thinning of the cortical ribbon in Huntington's disease. Neurology. (2002) 58:695–701. doi: 10.1212/WNL.58.5.695
49. Kuperberg GR, Broome M, McGuire PK, David AS, Eddy M, Ozawa F, et al. Regionally localized thinning of the cerebral cortex in Schizophrenia. Arch Gen Psychiatry. (2003) 60:878–88. doi: 10.1001/archpsyc.60.9.878
50. Salat D, Buckner RL, Snyder AZ, Greve DN, Desikan RS, Busa E, et al. Thinning of the cerebral cortex in aging. Cereb Cortex. (2004) 14:721–30. doi: 10.1093/cercor/bhh032
51. Han X, Jovicich J, Salat D, van der Kouwe A, Quinn B, Czanner S, et al. Reliability of MRI-derived measurements of human cerebral cortical thickness: the effects of field strength, scanner upgrade and manufacturer. NeuroImage. (2006) 32:180–94. doi: 10.1016/j.neuroimage.2006.02.051
52. Reuter M, Schmansky NJ, Rosas HD, Fischl B. Within-subject template estimation for unbiased longitudinal image analysis. NeuroImage. (2012) 61:1402–18. doi: 10.1016/j.neuroimage.2012.02.084
53. Manjón JV, Coupé P. Volbrain: An online MRI brain volumetry system. Front Neuroinform. (2016) 10:1–14. doi: 10.3389/fninf.2016.00030
54. Coupé P, Tourdias T, Linck P, Romero JE, Manjón JV. LesionBrain: An Online Tool for White Matter Lesion Segmentation. Lecture Notes in Computer Science (including subseries Lecture Notes in Artificial Intelligence and Lecture Notes in Bioinformatics). (2018) 11075 LNCS:95-103. doi: 10.1007/978-3-030-00500-9_11
55. Manjón JV, Coupé P, Martí-Bonmatí L, Collins DL, Robles M. Adaptive non-local means denoising of MR images with spatially varying noise levels. J Magn Reson Imag. (2010) 31:192–203. doi: 10.1002/jmri.22003
56. Tustison NJ, Cook PA, Gee JC. N4Itk. IEEE Trans Med Imaging. (2011) 29:1310–20. doi: 10.1109/TMI.2010.2046908
57. Weiskopf N, Lutti A, Helms G, Novak M, Ashburner J, Hutton C. Unified segmentation based correction of R1 brain maps for RF transmit field inhomogeneities (UNICORT). NeuroImage. (2011) 54:2116–24. doi: 10.1016/j.neuroimage.2010.10.023
58. Manjón JV, Tohka J, Robles M. Improved estimates of partial volume coefficients from noisy brain MRI using spatial context. NeuroImage. (2010) 53:480–90. doi: 10.1016/j.neuroimage.2010.06.046
59. Manjón JV, Eskildsen SF, Coupé P, Romero JE, Collins DL, Robles M. Nonlocal intracranial cavity extraction. Int J Biomed Imaging. (2014) 2014:820205. doi: 10.1155/2014/820205
60. Romero JE, Manjón JV, Tohka J, Coupé P, Robles M. NABS: Non-local automatic brain hemisphere segmentation. Magn Reson Imaging. (2015) 33:474–84. doi: 10.1016/j.mri.2015.02.005
61. Coupé P, Manjón JV, Fonov V, Pruessner J, Robles M, Collins DL. Patch-based segmentation using expert priors: application to hippocampus and ventricle segmentation. NeuroImage. (2011) 54:940–54. doi: 10.1016/j.neuroimage.2010.09.018
62. Commowick O, Cervenansky F, Ameli R. MSSEG challenge proceedings: multiple sclerosis lesions segmentation challenge using a data management and processing infrastructure. In: Miccai. (2016) Available online at: http://www.hal.inserm.fr/inserm-01397806
63. Mechrez R, Goldberger J, Greenspan H. Patch-based segmentation with spatial consistency: application to MS lesions in brain MRI. Int J Biomed Imaging. (2016) 2016:7952541. doi: 10.1155/2016/7952541
64. Guizard N, Coupé P, Fonov VS, Manjón JV, Arnold DL, Collins DL. Rotation-invariant multi-contrast non-local means for MS lesion segmentation. NeuroImage. (2015) 8:376–89. doi: 10.1016/j.nicl.2015.05.001
65. Coupe P, Yger P, Prima S, Hellier P, Kervrann C, Barillot C. An optimized blockwise nonlocal means denoising filter for 3-D magnetic resonance images. IEEE Trans Med Imaging. (2008) 27:425–41. doi: 10.1109/TMI.2007.906087
66. Wang H, Das S, Yushkevich P. A Learning-based wrapper method to correct systematic errors in automatic image segmentation. NeuroImage. (2011) 55:968–85. doi: 10.1016/j.neuroimage.2011.01.006
67. Romero JE, Coupé P, Manjón JV. HIPS: A new hippocampus subfield segmentation method. NeuroImage. (2017) 163:286–95. doi: 10.1016/j.neuroimage.2017.09.049
68. Andersson JLR, Skare S, Ashburner J. How to correct susceptibility distortions in spin-echo echo-planar images: application to diffusion tensor imaging. NeuroImage. (2003) 20:870–88. doi: 10.1016/S1053-8119(03)00336-7
69. Andersson JLR, Sotiropoulos SN. An integrated approach to correction for off-resonance effects and subject movement in diffusion MR imaging. NeuroImage. (2016) 125:1063–78. doi: 10.1016/j.neuroimage.2015.10.019
70. Andersson JLR, Sotiropoulos SN. Non-parametric representation and prediction of single- and multi-shell diffusion-weighted MRI data using Gaussian processes. NeuroImage. (2015) 122:166–76. doi: 10.1016/j.neuroimage.2015.07.067
71. Assaf Y, Pasternak O. Diffusion tensor imaging (DTI)-based white matter mapping in brain research: a review. J Mol Neurosci. (2008) 34:51–61. doi: 10.1007/s12031-007-0029-0
72. Steven AJ, Zhuo J, Melhem ER. Diffusion kurtosis imaging: an emerging technique for evaluating the microstructural environment of the brain. Am J Roentgenol. (2014) 202:26–33. doi: 10.2214/AJR.13.11365
73. Garyfallidis E, Brett M, Amirbekian B, Rokem A, van der Walt S, Descoteaux M, et al. Dipy, a library for the analysis of diffusion MRI data. Front Neuroinformatics. (2014) 8:8. doi: 10.3389/fninf.2014.00008
74. Zhang H, Schneider T, Wheeler-Kingshott CA, Alexander DC. NODDI: Practical in vivo neurite orientation dispersion and density imaging of the human brain. NeuroImage. (2012) 61:1000–16. doi: 10.1016/j.neuroimage.2012.03.072
75. Smith SM, Jenkinson M, Johansen-Berg H, Rueckert D, Nichols TE, Mackay CE, et al. Tract-based spatial statistics: voxelwise analysis of multi-subject diffusion data. NeuroImage. (2006) 31:1487–505. doi: 10.1016/j.neuroimage.2006.02.024
76. Rueckert D. Nonrigid registration using free-form deformations: application to breast MR images. IEEE Trans Med Imaging. (1999) 18:712–21. doi: 10.1109/42.796284
77. Andersson JLR, Jenkinson M, Smith SM. Non-Linear Optimisation. FMRIB technical report TR07JA1. (2007) Available online at: http://fsl.fmrib.ox.ac.uk/analysis/techrep/tr07ja1/tr07ja1.pdf
78. Winkler AM, Ridgway GR, Webster MA, Smith SM, Nichols TE. Permutation inference for the general linear model. NeuroImage. (2014) 92:381–97. doi: 10.1016/j.neuroimage.2014.01.060
79. Parvathaneni P, Lyu I, Huo Y, Rogers BP, Schilling KG, Nath V, et al. Improved gray matter surface based spatial statistics in neuroimaging studies. Magn Reson Imaging. (2019) 61:285–95. doi: 10.1016/j.mri.2019.05.016
80. Avants BB, Tustison NJ, Song G, Gee JC. ANTS: Advanced open-source normalization tools for neuroanatomy. Penn Image Computing and Science Laboratory. (2009) 1–35.
81. Zhang Z, Descoteaux M, Zhang J, Girard G, Chamberland M, Dunson D, et al. Mapping population-based structural connectomes. NeuroImage. (2019) 172:130–45. doi: 10.1016/j.neuroimage.2017.12.064
82. Tournier JD, Calamante F, Gadian DG, Connelly A. Direct estimation of the fiber orientation density function from diffusion-weighted MRI data using spherical deconvolution. NeuroImage. (2004) 23:1176–85. doi: 10.1016/j.neuroimage.2004.07.037
83. Girard G, Whittingstall K, Deriche R, Descoteaux M. Towards quantitative connectivity analysis: reducing tractography biases. NeuroImage. (2014) 98:266–78. doi: 10.1016/j.neuroimage.2014.04.074
84. Destrieux C, Fischl B, Dale A, Halgren E. Automatic parcellation of human cortical gyri and sulci using standard anatomical nomenclature. NeuroImage. (2010) 53:1–15. doi: 10.1016/j.neuroimage.2010.06.010
85. De Rochefort L, Liu T, Kressler B, Liu J, Spincemaille P, Lebon V, et al. Quantitative susceptibility map reconstruction from MR phase data using Bayesian regularization: validation and application to brain imaging. Magn Reson Med. (2010) 63:194–206. doi: 10.1002/mrm.22187
86. Liu J, Liu T, De Rochefort L, Ledoux J, Khalidov I, Chen W, et al. Morphology enabled dipole inversion for quantitative susceptibility mapping using structural consistency between the magnitude image and the susceptibility map. NeuroImage. (2012) 59:2560–8. doi: 10.1016/j.neuroimage.2011.08.082
87. Yao Y, Wang Y, Spincemaille P, Zhang Y, Liu Z. MEDI+0: Morphology enabled dipole inversion with automatic uniform cerebrospinal fluid zero reference for quantitative susceptibility mapping. Magn Reson Med. (2017) 79:2795–803. doi: 10.1002/mrm.26946
88. Wang Y, Liu T. Quantitative susceptibility mapping (QSM): Decoding MRI data for a tissue magnetic biomarker. Magn Reson Med. (2015) 73:82–101. doi: 10.1002/mrm.25358
89. Liu T, Wisnieff C, Lou M, Chen W, Spincemaille P, Wang Y. Nonlinear formulation of the magnetic field to source relationship for robust quantitative susceptibility mapping. Magn Reson Med. (2013) 69:467–76. doi: 10.1002/mrm.24272
90. Greve DN, Fischl B. Accurate and robust brain image alignment using boundary-based registration. NeuroImage. (2009) 48:63–72. doi: 10.1016/j.neuroimage.2009.06.060
91. Jenkinson M, Bannister P, Brady M, Smith S. Jenkinson - head motion and FC.pdf. (2002) 841:825–41.
92. Beckmann CF, Smith SM. Probabilistic independent component analysis for functional magnetic resonance imaging. IEEE Trans Med Imaging. (2004) 23:137–52. doi: 10.1109/TMI.2003.822821
93. Minka TP. Automatic choice of dimensionality for PCA. In: Advances in Neural Information Processing Systems. M.I.T. Media Laboratory Perceptual Computing Section Technical Report No. 514. Cambridge, MA (2000) p. 1–16.
94. Hyvärinen A. Fast and robust fixed-point algorithms for independent component analysis. IEEE Trans Neural Netw. (1999) 10:626–34. doi: 10.1109/72.761722
95. Salimi-Khorshidi G, Douaud G, Beckmann CF, Glasser MF, Griffanti L, Smith SM. Automatic denoising of functional MRI data: combining independent component analysis and hierarchical fusion of classifiers. NeuroImage. (2014) 90:449–68. doi: 10.1016/j.neuroimage.2013.11.046
96. Griffanti L, Salimi-Khorshidi G, Beckmann CF, Auerbach EJ, Douaud G, Sexton CE, et al. ICA-based artefact removal and accelerated fMRI acquisition for improved resting state network imaging. Neuroimage. (2015) 95:232–47. doi: 10.1016/j.neuroimage.2014.03.034
97. R-Project. (2018). Available online at: http://www.r-project.org/
98. Glasser MF, Smith SM, Marcus DS, Andersson JLR, Auerbach EJ, Behrens TEJ, et al. The human connectome Project's neuroimaging approach. Nat Neurosci. (2016) 19:1175–1187. doi: 10.1038/nn.4361
99. Liu P, Li Y, Pinho M, Park DC, Welch BG, Lu H. Cerebrovascular reactivity mapping without gas challenges Corresponding author HHS Public Access. Neuroimage. (2017) 146:320–326. doi: 10.1016/j.neuroimage.2016.11.054
100. Bastos AM, Schoffelen JM. A tutorial review of functional connectivity analysis methods and their interpretational pitfalls. Front Syst Neurosci. (2016) 9:175. doi: 10.3389/fnsys.2015.00175
102. Abraham A, Pedregosa F, Eickenberg M, Gervais P, Mueller A, Kossaifi J, et al. Machine learning for neuroimaging with SCIKIT-learn. Front Neuroinformatics. (2014) 8:14. doi: 10.3389/fninf.2014.00014
103. Sladky R, Friston KJ, Tröstl J, Cunnington R, Moser E, Windischberger C. Slice-timing effects and their correction in functional MRI. NeuroImage. (2011) 58:588–94. doi: 10.1016/j.neuroimage.2011.06.078
104. Glasser MF, Sotiropoulos SN, Wilson JA, Coalson TS, Fischl B, Andersson JLR, et al. The minimal preprocessing pipelines for the human connectome project. NeuroImage. (2013) 80:105–24. doi: 10.1016/j.neuroimage.2013.04.127
105. Chappell MA, Groves AR, Whitcher B, Woolrich MW. Variational Bayesian inference for a nonlinear forward model. IEEE Trans Signal Process. (2009) 57:223–36. doi: 10.1109/TSP.2008.2005752
106. Chappell MA, Groves AR, MacIntosh BJ, Donahue MJ, Jezzard P, Woolrich MW. Partial volume correction of multiple inversion time arterial spin labeling MRI data. Magn Reson Med. (2011) 65:1173–83. doi: 10.1002/mrm.22641
107. Alsop D. Recommended implementation of ASL perfusion MRI for clinical applications. Magn Reson Med. (2015) 73:102–16. doi: 10.1002/mrm.25607
108. Buxton RB, Frank LR, Wong EC, Siewert B, Warach S, Edelman RR. A general kinetic model for quantitative perfusion imaging with arterial spin labeling. Magn Reson Med. (1998) 40:383–96. doi: 10.1002/mrm.1910400308
109. Makris N, Goldstein JM, Kennedy D, Hodge SM, Caviness VS, Faraone SV, et al. Decreased volume of left and total anterior insular lobule in schizophrenia. Schizophr Res. (2006) 83:155–71. doi: 10.1016/j.schres.2005.11.020
110. Frazier JA, Chiu S, Breeze JL, Makris N, Lange N, Kennedy DN, et al. Structural brain magnetic resonance imaging of limbic and thalamic volumes in pediatric bipolar disorder. Am J Psychiatry. (2005) 162:1256–65. doi: 10.1176/appi.ajp.162.7.1256
111. Goldstein JM, Seidman LJ, Makris N, Ahern T, O'Brien LM, Caviness VS, et al. Hypothalamic abnormalities in schizophrenia: sex effects and genetic vulnerability. Biol Psychiatry. (2007) 61:935–45. doi: 10.1016/j.biopsych.2006.06.027
112. Mori S, Oishi K, Faria AV, van Zijl PCM. MRI Atlas of Human White Matter. 2nd Edn. Cambridge, MA: Academic Press (2010).
113. Wakana S, Caprihan A, Panzenboeck MM, Fallon JH, Perry M, Gollub RL, et al. Reproducibility of quantitative tractography methods applied to cerebral white matter. NeuroImage. (2007) 36:630–44. doi: 10.1016/j.neuroimage.2007.02.049
114. Hua K, Zhang J, Wakana S, Jianhui H, Li X, Reich DS, et al. Tract probability maps in stereotaxis spaces: analyses of white matter anatomy and tract-Sspecific quantification. NeuroImage. (2008) 39:336–47. doi: 10.1016/j.neuroimage.2007.07.053
115. Zhu T, Zhong J, Hu R, Tivarus M, Ekholm S, Harezlak J, et al. Patterns of white matter injury in HIV infection after partial immune reconstitution: a DTI tract-based spatial statistics study. J Neurovirol. (2013) 19:10–23. doi: 10.1007/s13365-012-0135-9
116. Su T, Wit FWNM, Caan MWA, Schouten J, Prins M, Geurtsen GJ, et al. White matter hyperintensities in relation to cognition in HIV-infected men with sustained suppressed viral load on combination antiretroviral therapy. Aids. (2016) 30:2329–39. doi: 10.1097/QAD.0000000000001133
117. Miszkiel KA, Paley MN, Wilkinson ID, Hall-Craggs MA, Ordidge R, Kendall BE, et al. The measurement of R2, R2* and R2' in HIV-infected patients using the prime sequence as a measure of brain iron deposition. Magn Reson Imaging. (1997) 15:1113–9. doi: 10.1016/S0730-725X(97)00089-1
118. Zhuang Y, Qiu X, Wang L, Ma Q, Mapstone M, Luque A, et al. Combination antiretroviral therapy improves cognitive performance and functional connectivity in treatment-naïve HIV-infected individuals. J Neurovirol. (2017) 23:704–12. doi: 10.1007/s13365-017-0553-9
119. Abidin AZ, DSouza AM, Nagarajan MB, Wang L, Qiu X, Schifitto G, et al. Alteration of brain network topology in HIV-associated neurocognitive disorder: a novel functional connectivity perspective. NeuroImage Clin. (2018) 17:768–77. doi: 10.1016/j.nicl.2017.11.025
120. Diedenhofen B, Musch J. Cocor: A comprehensive solution for the statistical comparison of correlations. PLoS ONE. (2015) 10:e121945. doi: 10.1371/journal.pone.0121945
121. Benjamini Y, Hochberg Y. Controlling the false discovery rate: a practical and powerful approach to multiple testing. J R Stat Soc. (1995) 57:289–300. doi: 10.1111/j.2517-6161.1995.tb02031.x
122. Kuznetsova A, Brockhoff PB, Christensen RHB. lmerTest package: tests in linear mixed effects models. J R Stat Soc. (2017) 82:13. doi: 10.18637/jss.v082.i13
123. Tibshirani R. Regression shrinkage and selection via the lasso. J R Stat Soc Ser B. (2016) 58:267–88. doi: 10.1111/j.2517-6161.1996.tb02080.x
124. Zou H, Hastie T. Regularization and variable selection via the elastic net. J R Stat Soc Ser B Stat Methodol. (2005) 67:301–20. doi: 10.1111/j.1467-9868.2005.00503.x
125. Angeles L, Fan Jianqing LR. Variable selection via nonconcave penalized. J Am Stat Assoc. (2001) 96:1348–60. doi: 10.1198/016214501753382273
126. Moulignier A, Savatovsky J, Assoumou L, Lescure FX, Lamirel C, Godin O, et al. Silent cerebral small-vessel disease is twice as prevalent in middle-aged individuals with well-controlled, combination antiretroviral therapy-treated human immunodeficiency virus (HIV) than in HIV-uninfected individuals. Clin Infect Dis. (2018) 66:1762–9. doi: 10.1093/cid/cix1075
127. Sanford R, Strain J, Dadar M, Maranzano J, Bonnet A, Mayo NE, et al. HIV infection and cerebral small vessel disease are independently associated with brain atrophy and cognitive impairment. AIDS. (2019) 33:1197–205. doi: 10.1097/QAD.0000000000002193
128. Price RW, Peterson J, Fuchs D, Angel TE, Zetterberg H, Hagberg L, et al. Approach to cerebrospinal fluid (CSF) biomarker discovery and evaluation in HIV infection. J Neuroimmune Pharmacol. (2013) 8:1147–58. doi: 10.1007/s11481-013-9491-3
129. Imp BM, Rubin LH, Tien PC, Plankey MW, Golub ET, French AL, et al. Monocyte activation is associated with worse cognitive performance in hiv-infected women with virologic suppression. J Infect Dis. (2017) 215:114–21. doi: 10.1093/infdis/jiw506
130. D'Antoni ML, Paul RH, Mitchell BI, Kohorn L, Fischer L, Lefebvre E, et al. Improved cognitive performance and reduced monocyte activation in virally suppressed chronic HIV after dual CCR2 and CCR5 antagonism. J Acquir Immune Defic Syndromes. (2018) 79:108–16. doi: 10.1097/QAI.0000000000001752
131. Jensen MK, Bertoia ML, Cahill LE, Agarwal I, Rimm EB, Mukamal KJ. Novel metabolic biomarkers of cardiovascular disease. Nat Rev Endocrinol. (2014) 10:659–72. doi: 10.1038/nrendo.2014.155
132. McKibben RA, Margolick JB, Grinspoon S, Li X, Palella FJ, Kingsley LA, et al. Elevated levels of monocyte activation markers are associated with subclinical atherosclerosis in men with and those without HIV infection. J Infect Dis. (2015) 211:1219–28. doi: 10.1093/infdis/jiu594
133. Su Z, Lu H, Jiang H, Zhu H, Li Z, Zhang P, et al. IFN-γ-producing Th17 cells bias by HMGB1-T-bet/RUNX3 axis might contribute to progression of coronary artery atherosclerosis. Atherosclerosis. (2015) 243:421–8. doi: 10.1016/j.atherosclerosis.2015.09.037
134. Souza] AWSd, Westra J, Limburg PC, Bijl M, Kallenberg CGM. HMGB1 in vascular diseases: Its role in vascular inflammation and atherosclerosis. Autoimmun Rev. (2012) 11:909–17. doi: 10.1016/j.autrev.2012.03.007
135. Trøseid M, Nowak P, Nyström J, Lindkvist A, Abdurahman S, Sönnerborg A. Elevated plasma levels of lipopolysaccharide and high mobility group box-1 protein are associated with high viral load in HIV-1 infection: reduction by 2-year antiretroviral therapy. Aids. (2010) 24:1733–7. doi: 10.1097/QAD.0b013e32833b254d
136. Burdo TH, Lo J, Abbara S, Wei J, DeLelys ME, Preffer F, et al. Soluble CD163, a novel marker of activated macrophages, is elevated and associated with noncalcified coronary plaque in HIV-infected patients. J Infect Dis. (2011) 204:1227–36. doi: 10.1093/infdis/jir520
137. Burdo TH, Lentz MR, Autissier P, Krishnan A, Halpern E, Letendre S, et al. Soluble CD163 made by monocyte/macrophages is a novel marker of HIV activity in early and chronic infection prior to and after antiretroviral therapy. J Infect Dis. (2011) 204:154–63. doi: 10.1093/infdis/jir214
138. Hearps AC, Maisa A, Cheng WJ, Angelovich TA, Lichtfuss GF, Palmer CS, et al. HIV infection induces age-related changes to monocytes and innate immune activation in young men that persist despite combination antiretroviral therapy. Aids. (2012) 26:843–53. doi: 10.1097/QAD.0b013e328351f756
139. Martin GE, Gouillou M, Hearps AC, Angelovich TA, Cheng AC, Lynch F, et al. Age-associated changes in monocyte and innate immune activation markers occur more rapidly in HIV infected women. PLoS ONE. (2013) 8:e55279. doi: 10.1371/journal.pone.0055279
140. Angelovich TA, Hearps AC, Maisa A, Martin GE, Lichtfuss GF, Cheng WJ, et al. Viremic and virologically suppressed HIV infection increases age-related changes to monocyte activation equivalent to 12 and 4 years of aging, respectively. J Acquir Immune Defic Syndromes. (2015) 69:11–17. doi: 10.1097/QAI.0000000000000559
141. Scaffidi P, Misteli T, Bianchi ME. Release of chromatin protein HMGB1 by necrotic cells triggers inflammation. Nature. (2002) 418:191–5. doi: 10.1038/nature00858
142. Wang H, Bloom O, Zhang M, Vishnubhakat JM, Ombrellino M, Che J, et al. HMG-1 as a late mediator of endotoxin lethality in mice. Science. (1999) 285:248–51. doi: 10.1126/science.285.5425.248
143. Müller S, Scaffidi P, Degryse B, Bonaldi T, Ronfani L, Agresti A, et al. The double life of HMGB1 chromatin protein: architectural factor and extracellular signal. EMBO J. (2001) 20:4337–40. doi: 10.1093/emboj/20.16.4337
144. Sims GP, Rowe DC, Rietdijk ST, Herbst R, Coyle AJ. HMGB1 and RAGE in inflammation and cancer. Annu Rev Immunol. (2010) 28:367–88. doi: 10.1146/annurev.immunol.021908.132603
145. Salminen A, Kauppinen A, Kaarniranta K. Emerging role of NF-κB signaling in the induction of senescence-associated secretory phenotype (SASP). Cell Signall. (2012) 24:835–45. doi: 10.1016/j.cellsig.2011.12.006
146. Kiebala M, Singh MV, Piepenbrink MS, Qiu X, Kobie JJ, Maggirwar SB. Platelet activation in human immunodeficiency virus type-1 patients is not altered with cocaine abuse. PLoS ONE. (2015) 10:e130061. doi: 10.1371/journal.pone.0130061
147. Green SA, Smith M, Hasley RB, Stephany D, Harned A, Nagashima K, et al. Activated platelet-T-cell conjugates in peripheral blood of patients with HIV infection: coupling coagulation/inflammation and T cells. Aids. (2015) 29:1297–308. doi: 10.1097/QAD.0000000000000701
148. Nkambule BB, Davison GM, Ipp H. The evaluation of platelet indices and markers of inflammation, coagulation and disease progression in treatment-naïve, asymptomatic HIV-infected individuals. Int J Lab Hematol. (2015) 37:450–8. doi: 10.1111/ijlh.12307
149. Gresele P, Falcinelli E, Sebastiano M, Baldelli F. Endothelial and platelet function alterations in HIV-infected patients. Thromb Res. (2012) 129:301–8. doi: 10.1016/j.thromres.2011.11.022
150. Coppinger JA, O'Connor R, Wynne K, Flanagan M, Sullivan M, Maguire PB, et al. Moderation of the platelet releasate response by aspirin. Blood. (2007) 109:4786–92. doi: 10.1182/blood-2006-07-038539
151. Semple JW, Italiano JE, Freedman J. Platelets and the immune continuum. Nat Rev Immunol. (2011) 11:264–74. doi: 10.1038/nri2956
152. Kapur R, Zufferey A, Boilard E, Semple JW. Nouvelle cuisine: platelets served with inflammation. J Immunol. (2015) 194:5579–87. doi: 10.4049/jimmunol.1500259
153. Lazarus AH, Semple JW, Cines DB. Innate and adaptive immunity in immune thrombocytopenia. Semin Hematol. (2013) 50(Suppl.1):1–4. doi: 10.1053/j.seminhematol.2013.03.012
154. Henn V, Slupsky JR, Gräfe M, Anagnostopoulos I, Förster R, Müller-Berghaus G, et al. CD40 ligand on activated platelets triggers an inflammatory reaction of endothelial cells. Nature. (1998) 391:591–4. doi: 10.1038/35393
155. Postea O, Vasina EM, Cauwenberghs S, Projahn D, Liehn EA, Lievens D, et al. Contribution of platelet CX3CR1 to platelet-monocyte complex formation and vascular recruitment during hyperlipidemia. Arterioscler Thromb Vasc Biol. (2012) 32:1186–93. doi: 10.1161/ATVBAHA.111.243485
156. Nkambule BB, Davison G, Ipp H. Platelet leukocyte aggregates and markers of platelet aggregation, immune activation and disease progression in HIV infected treatment naive asymptomatic individuals. J Thromb Thromb. (2015) 40:458–67. doi: 10.1007/s11239-015-1212-8
157. Yu C, Zhang S, Wang Y, Zhang S, Luo L, Thorlacius H. Platelet-derived CCL5 regulates CXC chemokine formation and neutrophil recruitment in acute experimental colitis. J Cell Physiol. (2016) 231:370–6. doi: 10.1002/jcp.25081
158. Rodrigues SF, Granger DN. Blood cells and endothelial barrier function. Tissue Barriers. (2015) 3:1–2. doi: 10.4161/21688370.2014.978720
159. Filippi CG, Ulug AM, Ryan E, Ferrando SJ, Gorp WV. Filippi_2001_DTI_pts_HIV_NAWM_MRimgages_brain.pdf. (2001) (February):277-283.
160. Wu Y, Storey P, Cohen BA, Epstein LG, Edelman RR, Ragin AB. Diffusion alterations in corpus callosum of patients with HIV. Am J Neuroradiol. (2006) 27:656-660.
161. Lawrence AJ, Zeestraten EA, Benjamin P, Lambert CP, Morris RG, Barrick TR, et al. Longitudinal decline in structural networks predicts dementia in cerebral small vessel disease. Neurology. (2018) 90:e1898–910. doi: 10.1212/WNL.0000000000005551
162. Jiménez-Balado J, Riba-Llena I, Abril O, Garde E, Penalba A, Ostos E, et al. Cognitive impact of cerebral small vessel disease changes in patients with hypertension. Hypertension. (2019) 73:342–9. doi: 10.1161/HYPERTENSIONAHA.118.12090
163. Pelletier A, Periot O, Dilharreguy B, Hiba B, Bordessoules M, Chanraud S, et al. Age-related modifications of diffusion tensor imaging parameters and white matter hyperintensities as inter-dependent processes. Front Aging Neurosci. (2016) 7:255. doi: 10.3389/fnagi.2015.00255
164. Merluzzi AP, Dean DCr, Adluru N, Suryawanshi GS, Okonkwo OC, Oh JM, et al. Age-dependent differences in brain tissue microstructure assessed with neurite orientation dispersion and density imaging. Neurobiol Aging. (2016) 43:79–88. doi: 10.1016/j.neurobiolaging.2016.03.026
165. Marsland AL, Kuan DCH, Sheu LK, Krajina K, Kraynak TE, Manuck SB, et al. Systemic inflammation and resting state connectivity of the default mode network. Brain Behav Immun. (2017) 62:162–70. doi: 10.1016/j.bbi.2017.01.013
166. Schrepf A, Kaplan CM, Ichesco E, Larkin T, Harte SE, Harris RE, et al. A multi-modal MRI study of the central response to inflammation in rheumatoid arthritis. Nat Commun. (2018) 9:1–11. doi: 10.1038/s41467-018-04648-0
167. Catchlove SJ, Parrish TB, Chen Y, Macpherson H, Hughes ME, Pipingas A. Regional cerebrovascular reactivity and cognitive performance in healthy aging. J Exp Neurosci. (2018) 12:1–11. doi: 10.1177/1179069518785151
168. Hou X, Liu P, Li Y, Jiang D, De Vis JB, Lin Z, et al. The association between BOLD-based cerebrovascular reactivity (CVR) and end-tidal CO2 in healthy subjects. NeuroImage. (2020) 207:116365. doi: 10.1016/j.neuroimage.2019.116365
169. Yan S, Sun J, Chen Y, Selim M, Lou M. Brain iron deposition in white matter hyperintensities: a 3-T MRI study. Age. (2013) 35:1927–36. doi: 10.1007/s11357-012-9487-6
170. Taege Y, Hagemeier J, Bergsland N, Dwyer MG, Weinstock-Guttman B, Zivadinov R, et al. Assessment of mesoscopic properties of deep gray matter iron through a model-based simultaneous analysis of magnetic susceptibility and R2* - A pilot study in patients with multiple sclerosis and normal controls. NeuroImage. (2019) 186:308–20. doi: 10.1016/j.neuroimage.2018.11.011
171. Chang L, Ernst T, Leonido-Yee M, Speck O. Perfusion MRI detects rCBF abnormalities in early stages of HIV-cognitive motor complex. Neurology. (2000) 54:389–96. doi: 10.1212/WNL.54.2.389
172. Su T, Mutsaerts HJMM, Caan MWA, Wit FWNM, Schouten J, Geurtsen GJ, et al. Cerebral blood flow and cognitive function in HIV-infected men with sustained suppressed viremia on combination antiretroviral therapy. Aids. (2017) 31:847–56. doi: 10.1097/QAD.0000000000001414
173. LaBounty T, Hardy W, Fan Z, Yumul R, Li D, Dharmakumar R, Conte AH. Carotid artery thickness is associated with chronic use of highly active antiretroviral therapy in patients infected with human immunodeficiency virus: A 3.0 Tesla magnetic resonance imaging study. HIV Med. (2016) 17:516–23. doi: 10.1111/hiv.12351
Keywords: HIV, cerebral small vessel disease, neuroinflammation, MRI, vascular health, image processing pipeline
Citation: Murray KD, Singh MV, Zhuang Y, Uddin MN, Qiu X, Weber MT, Tivarus ME, Wang HZ, Sahin B, Zhong J, Maggirwar SB and Schifitto G (2020) Pathomechanisms of HIV-Associated Cerebral Small Vessel Disease: A Comprehensive Clinical and Neuroimaging Protocol and Analysis Pipeline. Front. Neurol. 11:595463. doi: 10.3389/fneur.2020.595463
Received: 16 August 2020; Accepted: 19 November 2020;
Published: 15 December 2020.
Edited by:
Wei Zhang, Peking University First Hospital, ChinaReviewed by:
Eliseo A. Eugenin, University of Texas Medical Branch at Galveston, United StatesCopyright © 2020 Murray, Singh, Zhuang, Uddin, Qiu, Weber, Tivarus, Wang, Sahin, Zhong, Maggirwar and Schifitto. This is an open-access article distributed under the terms of the Creative Commons Attribution License (CC BY). The use, distribution or reproduction in other forums is permitted, provided the original author(s) and the copyright owner(s) are credited and that the original publication in this journal is cited, in accordance with accepted academic practice. No use, distribution or reproduction is permitted which does not comply with these terms.
*Correspondence: Giovanni Schifitto, Z2lvdmFubmlfc2NoaWZpdHRvQHVybWMucm9jaGVzdGVyLmVkdQ==
Disclaimer: All claims expressed in this article are solely those of the authors and do not necessarily represent those of their affiliated organizations, or those of the publisher, the editors and the reviewers. Any product that may be evaluated in this article or claim that may be made by its manufacturer is not guaranteed or endorsed by the publisher.
Research integrity at Frontiers
Learn more about the work of our research integrity team to safeguard the quality of each article we publish.