
95% of researchers rate our articles as excellent or good
Learn more about the work of our research integrity team to safeguard the quality of each article we publish.
Find out more
ORIGINAL RESEARCH article
Front. Neurol. , 18 September 2019
Sec. Dementia and Neurodegenerative Diseases
Volume 10 - 2019 | https://doi.org/10.3389/fneur.2019.01004
 Peter A. Ljubenkov1*
 Zachary Miller1Paige Mumford1Jane Zhang2Isabel Elaine Allen3Laura Mitic1,4
 Adam Staffaroni1
 Hilary Heuer1Julio C. Rojas1Yann Cobigo1
 Anna Karydas1Rodney Pearlman4
 Bruce Miller1
 Joel H. Kramer1Michael S. McGrath2,5Howard J. Rosen1Adam L. Boxer1
Objective: To investigate associations between peripheral innate immune activation and frontotemporal lobar degeneration (FTLD) in progranulin gene (GRN) haploinsufficiency.
Methods: In this cross-sectional study, ELISA was used to measure six markers of innate immunity (sCD163, CCL18, LBP, sCD14, IL-18, and CRP) in plasma from 30 GRN mutation carriers (17 asymptomatic, 13 symptomatic) and 29 controls. Voxel based morphometry was used to model associations between marker levels and brain atrophy in mutation carriers relative to controls. Linear regression was used to model relationships between plasma marker levels with mean frontal white matter integrity [fractional anisotropy (FA)] and the FTLD modified Clinical Dementia Rating Scale sum of boxes score (FTLD-CDR SB).
Results: Plasma sCD163 was higher in symptomatic GRN carriers [mean 321 ng/ml (SD 125)] compared to controls [mean 248 ng/ml (SD 58); p < 0.05]. Plasma CCL18 was higher in symptomatic GRN carriers [mean 56.9 pg/ml (SD 19)] compared to controls [mean 40.5 pg/ml (SD 14); p < 0.05]. Elevation of plasma LBP was associated with white matter atrophy in the right frontal pole and left inferior frontal gyrus (p FWE corrected <0.05) in all mutation carriers relative to controls. Plasma LBP levels inversely correlated with bilateral frontal white matter FA (R2 = 0.59, p = 0.009) in mutation carriers. Elevation in plasma was positively correlated with CDR-FTLD SB (b = 2.27 CDR units/μg LBP/ml plasma, R2 = 0.76, p = 0.003) in symptomatic carriers.
Conclusion: FTLD-GRN is associated with elevations in peripheral biomarkers of macrophage-mediated innate immunity, including sCD163 and CCL18. Clinical disease severity and white matter integrity are correlated with blood LBP, suggesting a role for peripheral immune activation in FTLD-GRN.
Haploinsufficiency of the progranulin gene (GRN) is a major cause of familial frontotemporal lobar degeneration (FTLD), giving rise to a variety of fatal and untreatable frontotemporal dementia (FTD-GRN) syndromes (1). Progranulin has a broad role in vertebrates, including regulation of lysosomal function, angiogenesis, blood monocytes, and brain microglia (2, 3). In patients with FTD-GRN, there is an increased rate of autoimmunity (4), suggesting that peripheral immune dysregulation is a feature of this disease. In Grn−/− mice, peripheral myeloid cells and microglia release excessive pro-inflammatory cytokines in response to bacterial lipopolysaccharide (LPS), and both sets of mononuclear cells exhibit heightened neurotoxicity (3). Moreover, Grn−/− mice display poor reconstitution of the blood brain barrier after injury (5). If humans recapitulate animal models of familial FTLD, patients with GRN deficiency are likely to have hyperactive monocytes, with less restricted access to the central nervous system (CNS) and greater capacity for neuronal injury. Plasma biomarkers of innate immune activation may therefore provide evidence for a potentially treatable monocyte-driven mechanism of pathogenesis in GRN deficiency and serve as measures of drug response in future clinical therapeutic trials targeting myeloid cells. Additionally, given the documented relationship between peripheral inflammation and white matter integrity outside of FTD cohorts (6), abnormal peripheral monocyte activation may serve to explain the unique burden of white matter disease that distinguishes FTD-GRN from other familial FTD syndromes (7).
Six specific candidate plasma biomarkers of innate immune activation were selected for investigation in patients with GRN mutations (Figure 1). Lipopolysaccharide binding protein (LBP) and soluble Cluster of Differentiation 14 (sCD14) (8) were selected as candidate biomarkers due to their roles as important cofactors in toll-like receptor 4 (TLR4) activation via bacterial endotoxin (a trigger of excessive myeloid activation in Grn−/− mice) (3). In contrast to LPS and sCD14, plasma interleukin 18 (IL18), a marker of the inflammasome pathway (10), was selected as a marker of monocyte activation via a TLR4 independent pathway. Soluble cluster of differentiation 163 (sCD163), a protein cleaved from recently activated monocytes, was selected as an established general marker of ongoing monocyte activation and turnover (9). Additionally, chemokine (C-C motif) ligand 18 (CCL18), a marker of non-classical (potentially anti-inflammatory) monocytes (12), was selected as indicator of chronic phenotypic transition away from classical monocyte forms (a shift common to many chronic inflammatory states). Finally, C-reactive protein (CRP), an acute phase reactant, was also assessed as a non-specific biomarker of immune activation. Our approach provides early evidence that peripheral innate immune activation is a feature of GRN haploinsufficiency and a potential mediator of FTD-GRN pathogenesis.
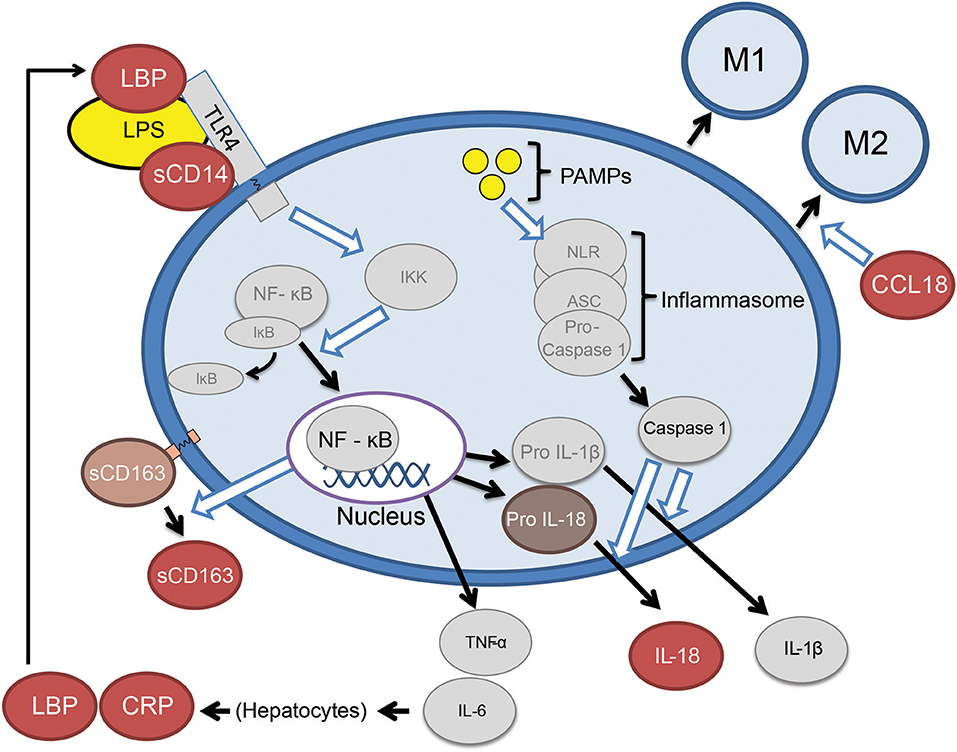
Figure 1. Abbreviated summary of monocyte activation pathways. Proteins depicted as red ovals were selected as candidate markers of monocyte activation. Bacterial lipopolysaccharide (LPS) requires the presence of LBP (lipopolysaccharide binding protein) and sCD14 (soluble cluster of differentiation 14), to TLR4 (toll-like receptor 4) and the NF-κB (nuclear factor kappa-light-chain-enhancer of activated B cells) (8). Activating monocytes cleave surface CD163 (Cluster of Differentiation 163) in to a soluble form (sCD163) (9). Monocytes may also be activated by pathogen-associated molecular patterns (PAMPS) which lead to release IL-18 via the inflammasome pathway (10). Classical monocytes (CD14+, CD16−) eventually transition to intermediate (CD14+CD16+) and eventually non-classical monocytes (CD14low, CD16+) (11), the latter of which are a source of CCL18 (chemokine C-C motif ligand 18) (12).
Patient demographics are summarized in Table 1. 30 individuals with known GRN mutations (17 asymptomatic and 13 symptomatic) and 29 age-matched controls were recruited through the University of California San Francisco Memory and Aging Center between 2009 and 2016. Our controls were not family members of mutation carriers. Patients were classified as “symptomatic” if they met criteria for mild cognitive impairment (13) or experienced loss of functional independence from a neurodegenerative syndrome. Within the symptomatic GRN mutation carrier cohort, seven individuals met consensus criteria for bvFTD (14), one met criteria for mild cognitive impairment (13) (with a progressive dysexecutive/behavioral syndrome), three met consensus criteria for a PPA (15), one had an amnestic syndrome resembling Alzheimer's disease (with a negative amyloid PET scan), one presented with idiopathic parkinsonism, and one individual suffered from a multifactorial dementia syndrome with behavioral, memory, language, and visuospatial impairments. Among the three participants who met criteria for PPA, one met criteria for the non-fluent variant of PPA (nfvPPA), and two presented with mixed PPA syndromes which could not be further subcategorized. This array of heterogeneous clinical syndromes was consistent with the known clinical heterogeneity of symptomatic GRN haploinsufficiency (1). Participants included in this study did not have any documented history of immunosuppression, autoimmune disease, hypothyroidism, acute infection, chronic infection, or positive biomarkers consistent with Alzheimer's pathology (including cerebrospinal fluid Amyloid Beta 42 or Amyloid beta PET with an FDA approved ligand) on retrospective review of their medical history. Only one GRN mutation carrier was excluded from our analyses, due to a positive amyloid PET scan. One control participant was also excluded from our analyses, due to the presence of autoimmune disease requiring immunosuppression. This study was approved by the UCSF Institutional Review Board (IRB), and all participants gave informed consent.
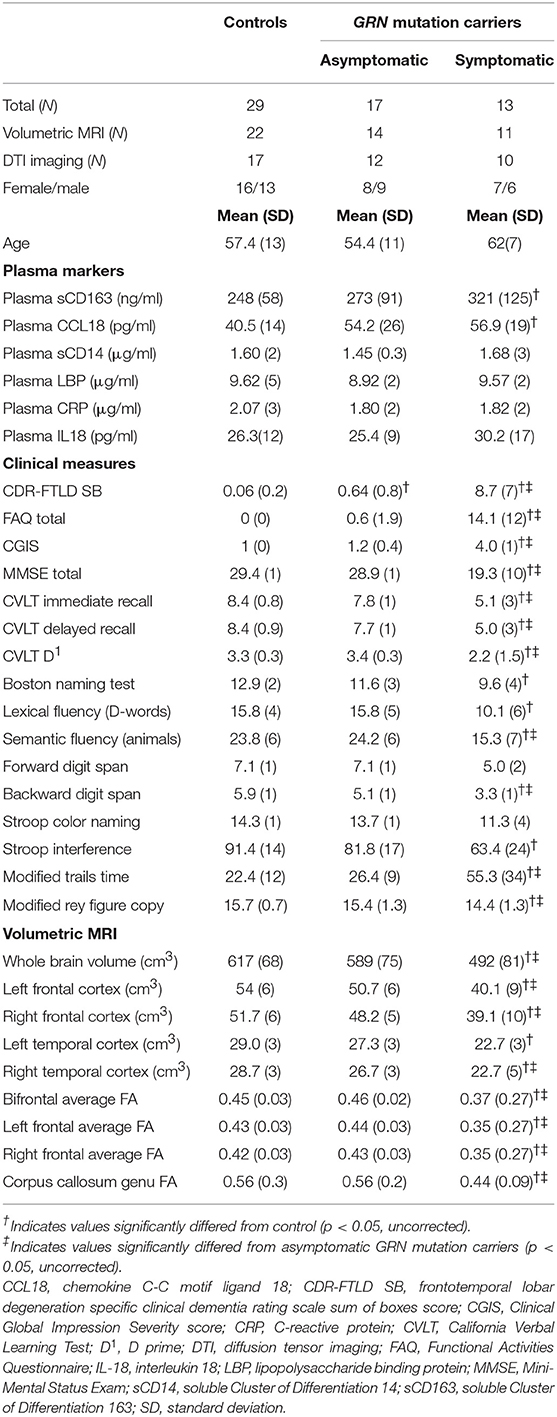
Table 1. Patient demographics, plasma biomarkers, and radiographic measures.
Six selected plasma biomarkers of innate immune activity were measured (sCD163, CCL18, sCD14, LBP, CRP, IL18) (Figure 1). No other fluid biomarkers were analyzed for this study. Our biomarkers of interest were not uniformly available in commercial multiplex panels, so each biomarker was measured individually by ELISA at a contract research organization (CRO) (Assaygate, Inc., Ijamsville, MD). Biomarkers were measured from frozen plasma, which was collected within 90 days of clinical and radiographic data. Samples were deidentified and randomly arranged across cohorts before being sent to the CRO.
The majority of T1 MR and diffusion tensor brain images were obtained at UCSF via the same 3 Tesla Siemens Tim Trio system with a 12-channel head coil. A single control participant's T1 images were obtained at UCSF via a 3 Tesla Siemens Prisma System under an equivalent harmonized protocol. Image acquisition was performed under previously published parameters (16, 17) as discussed in Supplemental Methods. After a quality control review, 22 controls, 14 asymptomatic carriers, and 11 symptomatic carriers had valid T1 weighted MR imaging within 90 days of their plasma collection, and of these cases 17 controls, 12 asymptomatic carriers, and 10 symptomatic carriers had valid diffusion tensor imaging.
T1-weighted images underwent segmented in SPM12 (Wellcome Trust Center for Neuroimaging, London, UK, www.fil.ion.ucl.ac.uk/spm) were used to create a study specific template using DARTEL (18), smoothed using a 6 mm Gaussian FWHM kernel. Each study participant's segmentation was inspected to ensure the robustness processing. Volumes in specific brain regions of interest (ROI) were calculated by transforming a standard parcellation atlas (19) into ICBM space and summing all gray matter within each parcellated region.
Diffusion images initially underwent denoising (20) and were realigned using the FSL MCFLIRT algorithm (21). The Dipy non-linear least-squares algorithm (22) was used to calculate diffusion tensors (DT), and a study specific template was created through iterative linear and non-linear registration of diffusion tensor images. Once in groupwise space, DT images were diagonalized into eigenvectors from which fractional anisotropy (FA) maps were calculated. Frontal and temporal regions of interest with extracted using the ICVM-DTI-81 white matter labels and tract atlas (23).
Voxel-based statistics were performed in SPM12 and used to investigate relationships between brain volume and plasmas marker of interest. Contrasts modeled an interaction between GRN mutation carrier status and each inflammatory biomarker level in determining burden of atrophy across all cases. Clusters and voxels with a SPM familywise error (FWE) corrected p-value <0.05 were considered significant. To further explore the relationship between brain volume and plasma markers, each cluster with significant constituent peak voxels in VBM analysis was used to define a tailored (ROI). Composite frontotemporal regions of interest were also created by summing volumes within individual right frontal, left frontal, right temporal, and left temporal gray mater regions of interest from a standard parcellation atlas (19) transformed into ICBM space. Linear regression analysis was used in GRN mutation carriers to compare plasma markers with volume in the tailored ROIs, the whole brain (excluding CSF spaces), and in composite frontal and temporal ROIs. Linear regression analysis was also used in GRN mutation carriers to compare plasma biomarkers with gray matter asymmetry (the absolute value of total right gray matter volume subtracted from total left gray matter volume) and white matter asymmetry (the absolute value of total right white matter volume subtracted from total left white matter volume). Additionally, linear regression analysis was used to model an interaction between biomarkers and clinical status (symptomatic vs. asymptomatic) in determining volume in our tailored ROIs. Age, sex, and total intracranial volume (TIV) were used as covariates in all voxel-based statistics and linear regression analyses.
Using a hypothesis-based approach (based on the distribution of white matter findings in our VBM analysis) a composite bifrontal lobar region of interest (ROI) was generated, averaging fractional anisotropy (FA) values across the bilateral superior longitudinal fasciculus, the bilateral cingulum cingulate, and the genu of the corpus callosum. Linear regression models assessed the correlation between bifrontal FA and individual plasma markers. Additional analyses focused on LBP (the sole marker with a linear relation to bifrontal FA) and FA in constituent regions of interest: the right and left frontal ROIs (superior longitudinal fasciculus and cingulum bundle), the right and left superior longitudinal fasciculus, the right and left cingulum bundle, and the genu of the corpus callosum. Age and sex were used as covariates in all VBM and linear regression analyses. A familywise error correction (Šidák correction) was applied to analysis across multiple constituent ROIs.
Clinical disease severity was primarily assessed using the FTD-specific clinical dementia rating scale sum of boxes score (FTLD-CDR SB) (24). Clinical severity was also assessed vis the Functional Activities Questionnaire (FAQ) (25), the Clinical Global Impression Severity score (CGIS) (26), the Mini-Mental State Examination (MMSE) (27) the 9 item California Verbal Learning Test (CVLT) (28), Boston Naming Test (BNT) (29), phonemic fluency (D-words/minute) (30), semantic fluency (animals/minute) (31), digit span (forward and backward) (32), the Stroop color naming and inhibition tasks (33), the Modified Trails Test (30), and the Modified Rey Figure Copy (30). A familywise error correction (Šidák correction) was then applied (across multiple cognitive measures) as a follow up sensitivity analysis.
Statistical analysis was performed using Stata®, version 14.2. The normality of plasma marker distributions was assessed via the skewness kurtosis test (34). Non-normally distributed values (LBP, CRP, and IL18) were compared using non-parametric methods, including the Kruskal-Wallis test followed by post-hoc Wilcoxon pairwise rank sum testing. All other markers (sCD163, CCL18, and sCD14) were compared between our 3 groups with Analysis of Variance (ANOVA), followed by a post-hoc pairwise Tukey test to correct for multiple pairwise comparisons. We did not additionally adjust for multiple comparisons between differing biomarkers, as individual group-wise findings should be allowed to support each other rather than detract from each given the biological interrelation of biomarkers expressed in Figure 1. Additionally, our project was intended to identify potential biomarkers of interest and their interrelationships for future studies, so we elected to minimize the chance of type II error. Linear regression models were fit to examine the relationship between FTLD-CDR SB or other clinical assessments and individual plasma biomarkers. Analyses were restricted to symptomatic carriers for measures that were at floor in asymptomatic carriers (CDR-FTLD SB, CGIS). Age and sex were included as covariates in all models. As a follow up sensitively analysis, a familywise error correction (Šidák correction) was applied for regression analyses repeated across six different biomarkers.
This research study utilized clinical data and specimens previously collected at the University of California Memory and Aging Center. Patients were therefore not directly involved in determining the design, research questions, outcome measures, recruitment, conduct or assessment of burden in this study.
Patient demographics are summarized in Table 1. Normal controls, asymptomatic GRN mutation carriers, and symptomatic GRN carriers did not differ significantly in age. Asymptomatic mutation carriers had slightly higher CDR-FTLD-SB than controls (p = 0.0011 Tukey corrected), but these two cohorts did not differ in any other collected clinical or radiographic measures. Symptomatic FTD-GRN patients differed from controls and asymptomatic carriers across the majority of clinical and radiographic measures assessed (Table 1). Symptomatic GRN mutation carriers displayed high sCD163 (p = 0.031 Tukey corrected) and CCL18 (p = 0.038 Tukey corrected) concentrations relative to controls (Figure 2, Table 1). Plasma concentrations of CD14, LBP, CRP, or IL-18 did not differ between groups.
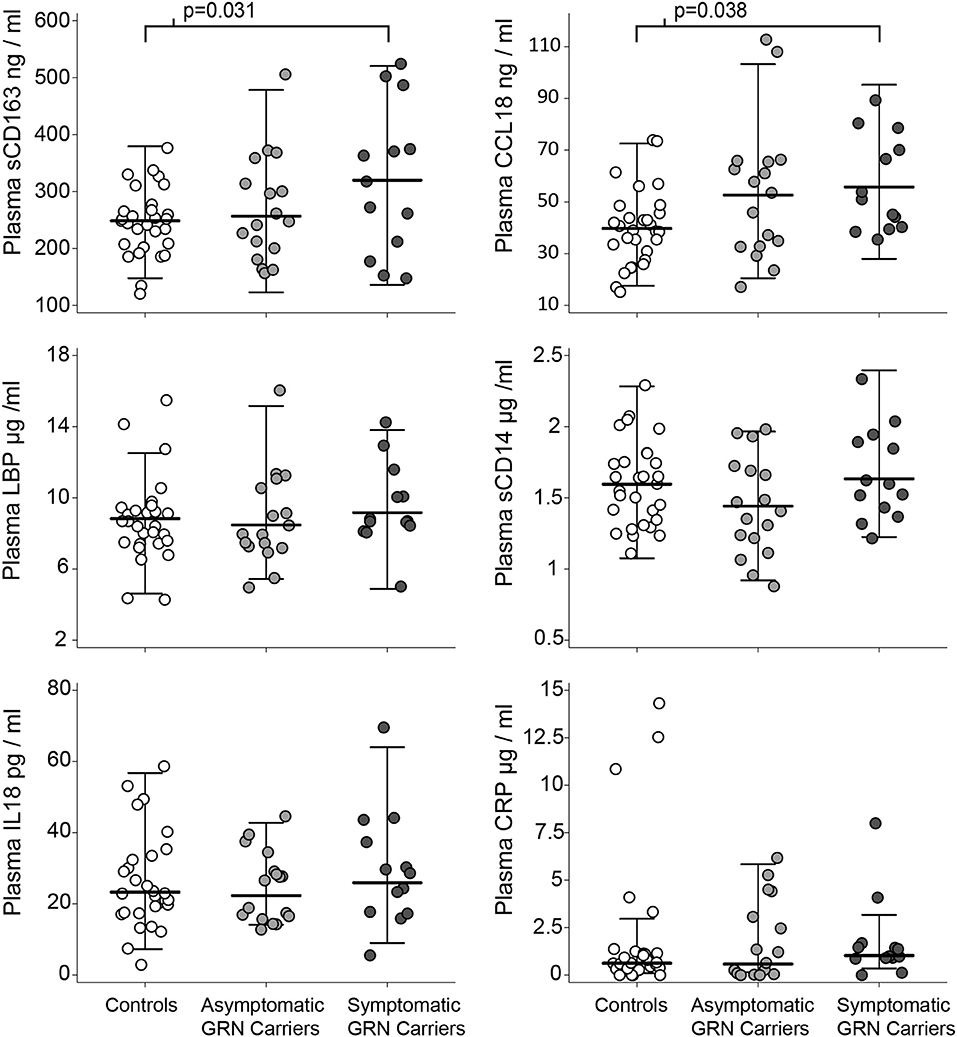
Figure 2. Plasma markers of innate immunity by clinical group. Circles represent individual people in the study. Whiskers represent the highest and lowest adjacent values (±1.5 × interquartile range) with a median line in between. The p-values associated with brackets for the sCD163 and CCL18 plots are post-hoc pairwise Tukey tests (after ANOVA p < 0.05) between controls and symptomatic carriers.
Among patients with symptomatic disease, there was a positive linear relationship between plasma LBP concentrations and CDR-FTLD SB (b = 2.27 CDR units/μg LBP/ml plasma, 95% CI [1.02, 3.51], p = 0.003 uncorrected, R2 = 0.76) (Figure 3) and the FAQ (b = 3.74 FAQ units/ μg LBP/ml Plasma, 95% CI [1.36, 6.11], p = 0.007 uncorrected, R2 = 0.68). There was a trend toward correlation between CRP levels and FTLD-CDR SB, but that finding did not survive multiple comparisons (R2 = 0.67, p = 0.01 uncorrected). There was no relationship between CDR-FTLD and other plasma markers including sCD163, sCD14, CCL18, and IL-18 in symptomatic GRN mutation carriers. Plasma biomarker levels did not correlate with other clinical assessments.
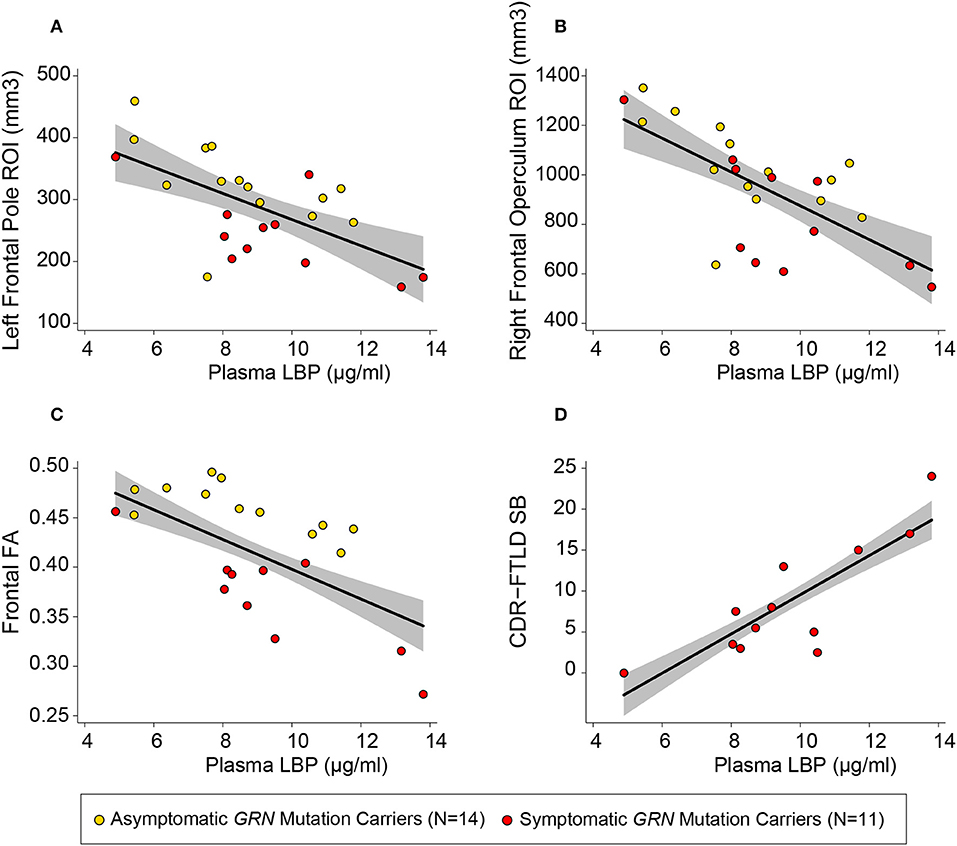
Figure 3. Plasma LBP correlates with white matter integrity and clinical severity. Circles represent uncorrected plotted values for individual GRN mutation carriers within our study, with yellow circles representing asymptomatic individuals and red circles representing symptomatic individuals. The left frontal (A) and right frontal (B) regions of interest (ROIs) depicted were defined by the left frontal pole white matter and right inferior frontal operculum white mater clusters described in Table 2. A linear regression line [controlling for age and sex, as well as total intracranial volume (TIV) for models with volumetric measures] with a gray 95% confidence interval has been superimposed on each plot [(A) R2 = 0.85, p = 0.024 uncorrected; (B) R2 = 0.86, p < 0.0005 uncorrected; (C) R2 = 0.59, p = 0.009; (D) R2 = 0.75, p = 0.003 uncorrected].
VBM revealed multiple frontal-predominant clusters (in white matter more than gray matter) where elevated markers of inflammation were associated with more severe atrophy in GRN mutation carriers (Table 2). Elevated LBP was associated with decreased white matter in the left frontal pole (p < 0.001, FWE corrected), right inferior operculum (p = 0.006, FWE corrected), and right anterior internal capsule (p < 0.001, FWE corrected) (Figure 4). Elevated LBP was also associated with decreased gray matter in the left anterior frontal pole (p = 0.002, FWE corrected). There was a nearly significant association between elevated plasma sCD14 and decreased white matter integrity in the left middle temporal gyrus (p = 0.05, FWE corrected), and elevated plasma IL-18 was associated with decreased gray matter in the middle occipital gyrus (p = 0.033, FWE corrected).
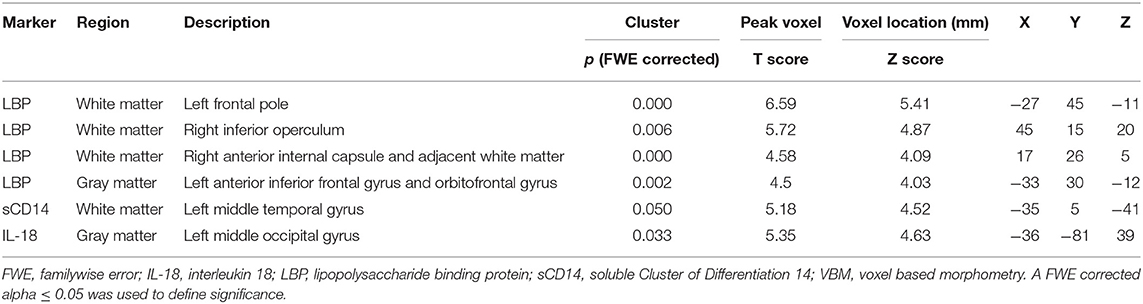
Table 2. Brain atrophy is associated with elevated plasma markers in GRN carriers.
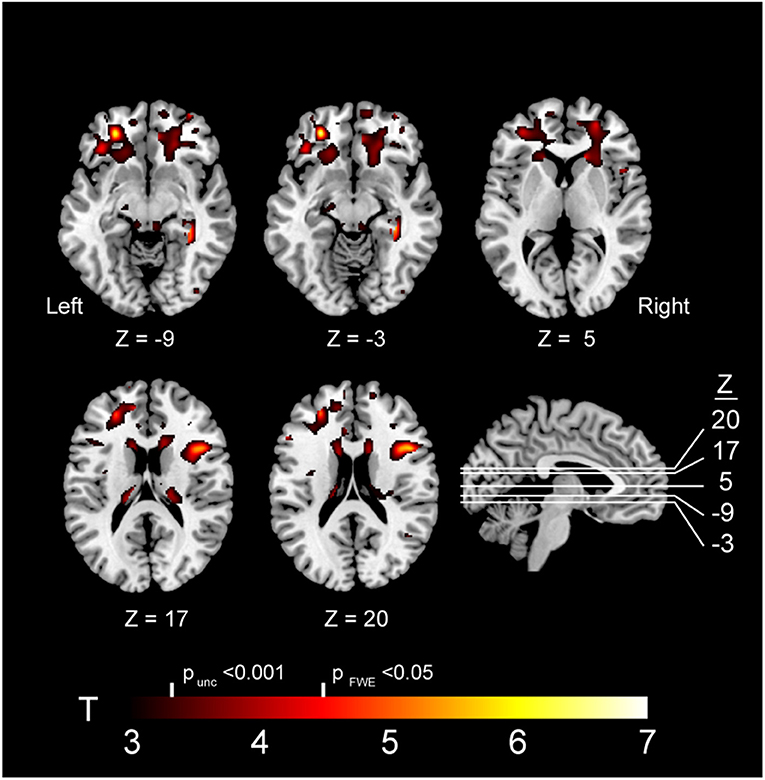
Figure 4. Brain atrophy associated with elevated plasma LBP in GRN carriers. Abbreviations: FWE, familywise error; LBP, lipopolysaccharide; unc, uncorrected. Note: The depicted clusters were obtained via voxel-based morphometry (VBM) analysis modeling an interaction between GRN mutation carriers status and plasma LBP in determining atrophy in our study cohort (including controls and mutation carriers).
In order to better assess the relationship between plasma LBP and white matter integrity, two additional volumetric ROIs (left frontal pole white matter and right inferior operculum white matter) were generated from significant clusters in VBM analyses. Within GRN carriers, there was a linear relationship between elevated plasma LBP and more severe white matter atrophy in a left frontal pole ROI white matter ROI (b = −8.59 mm3/mg LBP/ ml plasma, 95% CI [−10.6, −1.26], R2 = 0.84, p = 0.024 uncorrected) and right inferior frontal operculum white matter ROI (b = −38.9 mm3/mg LBP/ ml plasma, 95% CI [−63.6, −14.2] R2 = 0.86, p < 0.001 uncorrected,), LBP, sCD14, and IL-18 did not correlate with whole brain volume or frontotemporal composites. All six plasma biomarkers of interested did not correlate with gray matter asymmetry or white matter asymmetry. There was no interaction between plasma LBP and clinical status (symptomatic vs. asymptomatic) in determining volume in our tailored volumetric ROIs in mutation carriers.
We used DTI measurements of fractional anisotropy (FA) to further investigate the relationship between plasma LBP and white matter integrity. Elevated LBP was related to decreased fractional anisotropy (FA) in the bilateral frontal lobes (b = −0.016 FA/μg/ml LBP, R2 = 0.59, p = 0.009 uncorrected) in GRN mutation carriers (Figure 3C, Table 3). LBP elevation was also associated with decreased FA within multiple constituent regions of interest, including a left frontal lobe composite region of interest (p = 0.004 uncorrected), a right frontal composite region of interest (p = 0.026 uncorrected), the genu of the corpus callosum (p = 0.027 uncorrected), the left cingulum cingulate (p = 0.003 uncorrected), the right cingulum cingulate (p = 0.02 uncorrected), and the left superior longitudinal fasciculus (p = 0.015 uncorrected). The association between LBP and FA remained significant in the left cingulum cingulate and left frontal lobe composite ROI after correction for multiple comparisons.
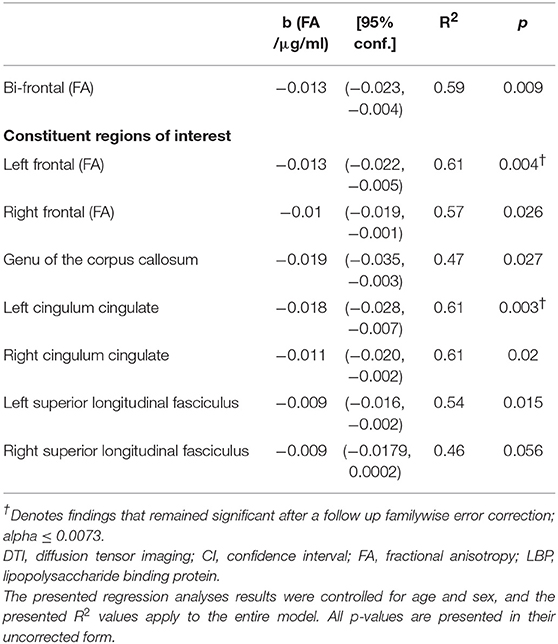
Table 3. Bifrontal DTI measures correlate with plasma LBP in GRN mutation carriers.
We identified a direct correlation between disease severity and a plasma mediator of the peripheral innate immune response (LBP) in GRN mutation carriers (symptomatic and asymptomatic). Additionally, we identified an elevation in plasma biomarkers of ongoing monocyte turnover (sCD163) and chronic monocyte activation (CCL18) in symptomatic GRN mutation carriers (though not asymptomatic mutation carriers) relative to controls.
Our results potentially represent early evidence for a neuro-inflammatory model of FTD-GRN progression, in which the peripheral innate immune systems directly contributes to brain pathology. In particular, our findings indicate a possible relationship between the peripheral immune system and white matter disease in GRN mutation carriers. Alternatively, it is possible that our results represent parallel autonomous processes in the peripheral immune system and CNS or peripheral inflammation in response to CNS neuropathology.
White matter T2 hyperintensities are well described in FTD-GRN, and neuroinflammation has previously been proposed as a mechanism for these lesions (7). In Grn−/− mice, microglia exert a pathogenic effect on neurons (8) due in part to excessive compliment-mediated synaptic destruction (35). A similar process of synaptic destruction, either through direct infiltration of monocytes or secondary activation of glial cells (36), may explain the relationship between peripheral inflammation and white matter in our study. Activation of the peripheral immune system, particularly of monocytes, is known to induce secondary activation of microglia (36) outside of FTD models. Additionally, FTD-GRN may involve blood-brain barrier dysfunction (5), which could increase the interaction between peripheral and central innate immune cells. White matter change in FTD-GRN may also reflect the anatomical distribution of perivascular macrophages (on the front line of interaction with the peripheral immune system) aligning deep penetrating small vessels.
Plasma LBP is an acute phase reactant released by the liver (8) and is unlikely to faithfully track monocyte activation downstream. The correlation between plasma LBP and white matter changes may, however, reflect a specific upstream mechanism of monocyte activation in GRN mutation carriers. Plasma LBP is an essential factor for activation of monocytes by bacterial endotoxins via the toll-like receptor 4 (TLR4) (8). The correlation between LBP and disease may therefore reflect the role of external antigens, such as endotoxins from gut microbes, in promoting FTD-GRN. Grn knockout (Grn−/−) mice exhibit poor clearance of bacterial pathogens and hyper-activation to bacterial LPS via TLR4 (3). Patients with GRN haploinsufficiency may similarly experience dysfunctional inflammation, with poor clearance of bacterial pathogens despite excessively robust monocyte activation. Under this model, GRN mutation carriers and healthy controls would experience very different sustained monocyte responses in reaction to the same inflammatory challenge. This may explain why LBP correlated with disease in mutation carriers, even though LBP levels were similar to controls.
Plasma sCD163 and CCL18, unlike LBP, are directly released from monocytes and represent differing aspects of monocyte function. After monocytes are activated (by LPS or other triggers), they cleave membrane-bound CD163 and release the soluble form (sCD163) (9). In models of encephalitis, sCD163 has been used as a proxy for monocyte migration to the site of brain inflammation (37). After stimulation, classical monocytes either leave circulation or transition to intermediate and eventually to non-classical forms (11). A sustained peripheral shift in monocyte phenotypes, away from classical monocyte forms, is a hallmark of a variety of chronic infections and autoimmune diseases (38). CCL18 is released chiefly by myeloid cells and has long been described as a marker of non-classical monocytes (12). Taken together, elevation of sCD163 and CCL18 in symptomatic FTD-GRN hint at a chronic inflammatory state, in which classical peripheral monocytes are chronically migrating to sites of inflammation and transitioning to non-classical forms in parallel. In the context of our findings pertaining to LBP, this chronic activation state may be driven in part by bacterial endotoxin.
This study had several limitations. Voxel-based morphometry is a technique that is chiefly used to analyze gray matter volumes, and the majority of our volumetric findings are in white matter regions of interest. Fortunately, fractional anisotropy provided an alternate modality that confirmed associations between LBP and white matter integrity. Additionally, heterogeneous asymmetry may have limited our ability to find associations between brain volume and biomarkers using a voxel-based approach. For this reason, it is possible that larger follow up studies would identify more extensive bifrontal volume regions associated with plasma marker of innate immune activation. Our findings were limited to a relatively small cohort of mutation carriers, given the rarity of GRN haploinsufficiency and the accessibility of biospecimens. Interpretation of our findings would greatly benefit from replication in a separate larger cohort. Our imaging analysis merged all mutation carriers (pre and post symptomatic) into one cohort to make inferences about the entire clinical spectrum of GRN haploinsufficiency. A larger clinical study will allow for greater distinction between immune phenomena in asymptomatic mutation carriers and FTD-GRN. Because our data were from single time points in each participant, it is difficult to discern what proportion of variance in each plasma marker is due to sustained inflammation vs. short-term fluctuations in inflammatory markers related to transient stressors. Longitudinal data would therefore improve our ability to make inferences about the relationship between inflammatory markers and disease severity in GRN mutation carriers. Additionally, our study used a small set of relatively specific plasma markers to make specific inferences about differing aspects of myeloid cell behavior and activity. Follow-up studies would ideally include methods that more directly assess innate immune cells in GRN mutation carriers. Future studies should seek to assess less specific biomarkers of inflammation, given previous evidence of high peripheral tumor necrosis factor alpha (TNF-α) (4) and Interleukin 6 (IL-6) (39) in patients with GRN haploinsufficiency.
This study highlights the potential value of blood biomarkers of innate immunity as tools to understand disease pathogenesis in GRN mutation carriers. Analysis of longitudinal datasets such as Longitudinal Evaluation of Familial Frontotemporal Dementia Subjects (LEFFTDS) and the Genetic FTD Initiative (GENFI) will ultimately help to determine the temporal relationship between inflammatory biomarker elevation, clinical severity, and neuroimaging changes in GRN mutation carriers. The current findings also suggest that clinical trials of agents that reduce monocyte/macrophage or microglial activation might help to elucidate the relationship between inflammation and disease in GRN mutation carriers and could potentially be used to prevent or treat FTD-GRN.
The datasets generated for this study are available on request to the corresponding author.
This study was approved by the UCSF Institutional Review Board (IRB) and all participants gave written informed consent in accordance with the Declaration of Helsinki.
PL, LM, HR, and AB: design and conceptualization of the study, analysis and interpretation of the data, and drafting and revising the manuscript for intellectual content. ZM, IA, AS, HH, JR, and YC: analysis and interpretation of the data and drafting and revising the manuscript for intellectual content. PM, BM, and JK: analysis and interpretation of the data. JZ and MM: design and conceptualization of the study and analysis and interpretation of the data. AK and RP: design and conceptualization of the study. Statistical analysis was conducted by PL, PM, and IA.
This work was supported the United States National Institute on Aging by the (Grant Nos. AG019724-09, AG032306, AG045333-01, AG045390, U54NS092089) and the Bluefield Project to Cure Frontotemporal Dementia.
LM received compensation for serving on the advisory board of Tiake Therapeutics. MM owns stock in Neuraltus Pharmaceuticals. AB receives research support from NIH U54NS092089, R01AG031278, R01AG038791, R01AG032306, R01AG022983, The Tau Research Consortium, The Bluefield Project to Cure Frontotemporal Dementia, Corticobasal Degeneration Solutions, and the Alzheimer's Association. He has served as a consultant for Abbvie, Celgene, Ionis, Janssen, Merck and Novartis, and received research support from Avid, Biogen, BMS, C2N, Cortice, Forum, Genentech, Janssen, Pfizer, Eli Lilly, Roche, and TauRx, He holds Stock Options in Alector and Delos.
The remaining authors declare that the research was conducted in the absence of any commercial or financial relationships that could be construed as a potential conflict of interest.
The Supplementary Material for this article can be found online at: https://www.frontiersin.org/articles/10.3389/fneur.2019.01004/full#supplementary-material
1. Beck J, Rohrer JD, Campbell T, Isaacs A, Morrison KE, Goodall EF, et al. A distinct clinical, neuropsychological and radiological phenotype is associated with progranulin gene mutations in a large UK series. Brain. (2008) 131:706–20. doi: 10.1093/brain/awm320
2. Kao AW, McKay A, Singh PP, Brunet A, Huang EJ. Progranulin, lysosomal regulation and neurodegenerative disease. Nat Rev Neurosci. (2017) 325–33. doi: 10.1038/nrn.2017.36
3. Yin F, Banerjee R, Thomas B, Zhou P, Qian L, Jia T, et al. Exaggerated inflammation, impaired host defense, and neuropathology in progranulin-deficient mice. J Exp Med. (2010) 207:117–28. doi: 10.1084/jem.20091568
4. Miller ZA, Rankin KP, Graff-Radford NR, Takada LT, Sturm VE, Cleveland CM, et al. TDP-43 frontotemporal lobar degeneration and autoimmune disease. J Neurol Neurosurg Psychiatry. (2013) 84:956–62. doi: 10.1136/jnnp-2012-304644
5. Jackman K, Kahles T, Lane D, Garcia-Bonilla L, Abe T, Capone C, et al. Progranulin deficiency promotes post-ischemic blood-brain barrier disruption. J Neurosci. (2013) 33:19579–89. doi: 10.1523/JNEUROSCI.4318-13.2013
6. Bettcher BM, Watson CL, Walsh CM, Lobach IV, Neuhaus J, Miller JW, et al. Interleukin-6, age, and corpus callosum integrity. PLoS ONE. (2014) 9:e106521. doi: 10.1371/journal.pone.0106521
7. Sudre CH, Bocchetta M, Cash D, Thomas DL, Woollacott I, Dick KM, et al. White matter hyperintensities are seen only in GRN mutation carriers in the GENFI cohort. NeuroImage Clin. (2017) 15:171–80. doi: 10.1016/j.nicl.2017.04.015
8. Lee CC, Avalos AM, Ploegh HL. Accessory molecules for Toll-like receptors and their function. Nat Rev Immunol. (2012) 12:168–79. doi: 10.1038/nri3151
9. Møller HJ. Soluble CD163. Scand J Clin Lab Invest. (2012) 72:1–13. doi: 10.3109/00365513.2011.626868
10. Freeman LC, Ting JP. The pathogenic role of the inflammasome in neurodegenerative diseases. J Neurochem. (2016) 136:29–38. doi: 10.1111/jnc.13217
11. Patel AA, Zhang Y, Fullerton JN, Boelen L, Rongvaux A, Maini AA, et al. The fate and lifespan of human monocyte subsets in steady state and systemic inflammation. J Exp Med. (2017) 214:1913–23. doi: 10.1084/jem.20170355
12. Kodelja V, Müller C, Politz O, Hakij N, Orfanos CE, Goerdt S. Alternative macrophage activation-associated CC-chemokine-1, a novel structural homologue of macrophage inflammatory protein-1 alpha with a Th2-associated expression pattern. J Immunol. (1998) 160:1411–8.
13. Albert MS, DeKosky ST, Dickson D, Dubois B, Feldman HH, Fox NC, et al. The diagnosis of mild cognitive impairment due to Alzheimer's disease: recommendations from the National Institute on Aging-Alzheimer's Association workgroups on diagnostic guidelines for Alzheimer's disease. Alzheimer's Dement. (2011) 7:270–9. doi: 10.1016/j.jalz.2011.03.008
14. Rascovsky K, Hodges JR, Knopman D, Mendez MF, Kramer JH, Neuhaus J, et al. Sensitivity of revised diagnostic criteria for the behavioural variant of frontotemporal dementia. Brain. (2011) 134:2456–77. doi: 10.1093/brain/awr179
15. Gorno-Tempini ML, Hillis AE, Weintraub S, Kertesz A, Mendez M, Cappa SF, et al. Classification of primary progressive aphasia and its variants. Neurology. (2011) 76:1006–14. doi: 10.1212/WNL.0b013e31821103e6
16. Pankov A, Binney RJ, Staffaroni AM, Kornak J, Attygalle S, Schuff N, et al. Data-driven regions of interest for longitudinal change in frontotemporal lobar degeneration. NeuroImage Clin. (2016) 12:332–40. doi: 10.1016/j.nicl.2015.08.002
17. Elahi FM, Marx G, Cobigo Y, Staffaroni AM, Kornak J, Tosun D, et al. Longitudinal white matter change in frontotemporal dementia subtypes and sporadic late onset Alzheimer's disease. NeuroImage Clin. (2017) 16:595–603. doi: 10.1016/j.nicl.2017.09.007
18. Ashburner J. A fast diffeomorphic image registration algorithm. Neuroimage. (2007) 38:95–113. doi: 10.1016/j.neuroimage.2007.07.007
19. Desikan RS, Ségonne F, Fischl B, Quinn BT, Dickerson BC, Blacker D, et al. An automated labeling system for subdividing the human cerebral cortex on MRI scans into gyral based regions of interest. Neuroimage. (2006) 31:968–80. doi: 10.1016/j.neuroimage.2006.01.021
20. Veraart J, Fieremans E, Novikov DS. Diffusion MRI noise mapping using random matrix theory. Magn Reson Med. (2016) 76:1582–93. doi: 10.1002/mrm.26059
21. Jenkinson M, Beckmann CF, Behrens TE, Woolrich MW, Smith SM. FSL. Neuroimage. (2012) 62:782–90. doi: 10.1016/j.neuroimage.2011.09.015
22. Garyfallidis E, Brett M, Amirbekian B, Rokem A, van der Walt S, Descoteaux M, et al. Dipy, a library for the analysis of diffusion MRI data. Front Neuroinform. (2014) 8:8. doi: 10.3389/fninf.2014.00008
24. Knopman DS, Kramer JH, Boeve BF, Caselli RJ, Graff-Radford NR, Mendez MF, et al. Development of methodology for conducting clinical trials in frontotemporal lobar degeneration. Brain. (2008) 131:2957–68. doi: 10.1093/brain/awn234
25. Pfeffer RI, Kurosaki TT, Harrah CH, Chance JM, Filos S. Measurement of functional activities in older adults in the community. J Gerontol. (1982) 37:323–9. doi: 10.1093/geronj/37.3.323
26. Busner J, Targum SD. The clinical global impressions scale: applying a research tool in clinical practice. Psychiatry. (2007) 4:28–37.
27. Folstein MF, Folstein SE, McHugh PR. “Mini-mental state”. A practical method for grading the cognitive state of patients for the clinician. J Psychiatr Res. (1975) 12:189–98. doi: 10.1016/0022-3956(75)90026-6
28. Delis DC, Kramer JH, Kaplan E, Ober BA. California Verbal Learning Test. 2nd ed. Adult version. Manual. San Antonio, TX: Psychological Corporation (2000).
30. Kramer JH, Jurik J, Sha SJ, Rankin KP, Rosen HJ, Johnson JK, et al. Distinctive neuropsychological patterns in frontotemporal dementia, semantic dementia, and Alzheimer disease. Cogn Behav Neurol. (2003) 16:211–8. doi: 10.1097/00146965-200312000-00002
31. Delis DC, Kaplan E, Kramer JH. Delis-Kaplan Executive Function System (DKEFS): Examiner's Manual. San Antonio, TX: The Psychological Corporation (2001).
32. Wechsler D. Wechsler Adult Intelligence Scale. San Antonio, TX: Psychological Corporation (1997).
33. Stroop JR. Studies of interference in serial verbal reactions. J Exp Psychol. (1935) 18:643–62. doi: 10.1037/h0054651
34. D'Agostino RB, Belanger A. A suggestion for using powerful and informative tests of normality. Am Stat. (1990) 44:316. doi: 10.2307/2684359
35. Lui H, Zhang J, Makinson SR, Cahill MK, Kelley KW, Huang HY, et al. Progranulin deficiency promotes circuit-specific synaptic pruning by microglia via complement activation. Cell. (2016) 165:921–35. doi: 10.1016/j.cell.2016.04.001
36. Xie X, Luo X, Liu N, Li X, Lou F, Zheng Y, et al. Monocytes, microglia, and CD200-CD200R1 signaling are essential in the transmission of inflammation from the periphery to the central nervous system. J Neurochem. (2017) 141:222–35. doi: 10.1111/jnc.13972
37. Burdo TH, Weiffenbach A, Woods SP, Letendre S, Ellis RJ, Williams KC. Elevated sCD163 in plasma but not cerebrospinal fluid is a marker of neurocognitive impairment in HIV infection. AIDS. (2013) 27:1387–95. doi: 10.1097/QAD.0b013e32836010bd
38. Wong KL, Yeap WH, Tai JJ, Ong SM, Dang TM, Wong SC. The three human monocyte subsets: implications for health and disease. Immunol Res. (2012) 53:41–57. doi: 10.1007/s12026-012-8297-3
Keywords: progranulin (GRN), frontotemperal lobar degeneration, monocyte, innate immune system, peripheral immune activation
Citation: Ljubenkov PA, Miller Z, Mumford P, Zhang J, Allen IE, Mitic L, Staffaroni A, Heuer H, Rojas JC, Cobigo Y, Karydas A, Pearlman R, Miller B, Kramer JH, McGrath MS, Rosen HJ and Boxer AL (2019) Peripheral Innate Immune Activation Correlates With Disease Severity in GRN Haploinsufficiency. Front. Neurol. 10:1004. doi: 10.3389/fneur.2019.01004
Received: 30 April 2019; Accepted: 03 September 2019;
Published: 18 September 2019.
Edited by:
Christopher Butler, University of Oxford, United KingdomReviewed by:
Michael Emmerson Ward, National Institute of Neurological Disorders and Stroke (NINDS), United StatesCopyright © 2019 Ljubenkov, Miller, Mumford, Zhang, Allen, Mitic, Staffaroni, Heuer, Rojas, Cobigo, Karydas, Pearlman, Miller, Kramer, McGrath, Rosen and Boxer. This is an open-access article distributed under the terms of the Creative Commons Attribution License (CC BY). The use, distribution or reproduction in other forums is permitted, provided the original author(s) and the copyright owner(s) are credited and that the original publication in this journal is cited, in accordance with accepted academic practice. No use, distribution or reproduction is permitted which does not comply with these terms.
*Correspondence: Peter A. Ljubenkov, cGV0ZXIubGp1YmVua292QHVjc2YuZWR1
Disclaimer: All claims expressed in this article are solely those of the authors and do not necessarily represent those of their affiliated organizations, or those of the publisher, the editors and the reviewers. Any product that may be evaluated in this article or claim that may be made by its manufacturer is not guaranteed or endorsed by the publisher.
Research integrity at Frontiers
Learn more about the work of our research integrity team to safeguard the quality of each article we publish.