
95% of researchers rate our articles as excellent or good
Learn more about the work of our research integrity team to safeguard the quality of each article we publish.
Find out more
ORIGINAL RESEARCH article
Front. Neurol. , 22 December 2017
Sec. Stroke
Volume 8 - 2017 | https://doi.org/10.3389/fneur.2017.00699
This article is part of the Research Topic Electromyography (EMG) Techniques for the Assessment and Rehabilitation of Motor Impairment Following Stroke View all 20 articles
Walking after stroke is often described as requiring excessive muscle co-contraction, yet, evidence that co-contraction is a ubiquitous motor control strategy for this population remains inconclusive. Co-contraction, the simultaneous activation of agonist and antagonist muscles, can be assessed with electromyography (EMG) but is often described qualitatively. Here, our goal is to determine if co-contraction is associated with gait impairments following stroke. Fifteen individuals with chronic stroke and nine healthy controls walked on an instrumented treadmill at self-selected speed. Surface EMGs were collected from the medial gastrocnemius (MG), soleus (SOL), and tibialis anterior (TA) of each leg. EMG envelope amplitudes were assessed in three ways: (1) no normalization, (2) normalization to the maximum value across the gait cycle, or (3) normalization to maximal M-wave. Three co-contraction indices were calculated across each agonist/antagonist muscle pair (MG/TA and SOL/TA) to assess the effect of using various metrics to quantify co-contraction. Two factor ANOVAs were used to compare effects of group and normalization for each metric. Co-contraction during the terminal stance (TSt) phase of gait is not different between healthy controls and the paretic leg of individuals post-stroke, regardless of the metric used to quantify co-contraction. Interestingly, co-contraction was similar between M-max and non-normalized EMG; however, normalization does not impact the ability to resolve group differences. While a modest correlation is revealed between the amount of TSt co-contraction and walking speed, the relationship is not sufficiently strong to motivate further exploration of a causal link between co-contraction and walking function after stroke. Co-contraction does not appear to be a common strategy employed by individuals after stroke. We recommend exploration of alternative EMG analysis approaches in an effort to learn more about the causal mechanisms of gait impairment following stroke.
After a stroke, most individuals experience lifelong walking impairments, including forward propulsion deficits, which contribute to metabolically inefficient gait (1–4). Abnormal muscle activation patterns, especially excessive co-contraction, are commonly argued to be a major contributing factor to these walking impairments (5–7). Co-contraction refers to simultaneous activity in agonist and antagonist muscles across the same joint (6, 8). This phenomenon is sometimes called agonist/antagonist co-activation or simply co-activation. However, co-activation can also refer to simultaneous activity in synergist muscles. Here, we will use the term co-contraction and address the relationship between agonist and antagonist muscle co-activity.
Co-contraction is a normal motor control strategy observed in healthy individuals during functional motor tasks. Its presence varies in response to environmental and task demands on different time scales. For example, when encountering uncertainty, such as challenges to posture and balance, increased co-contraction can be observed as an early response to the novel environment (9). Evidence suggests that co-contraction facilitates rapid torque development (10), compensates for non-linearities in muscle properties and torque scaling (11), and counteracts agonist torques and off-axis torques (12, 13). Thus, co-contraction affords a robust mechanism to rapidly counteract perturbations. Co-contraction is also often present when motor tasks are novel or require limb stabilization for performance accuracy. Over a longer time scale (e.g., minutes, hours or days), co-contraction decreases progressively. Indeed, an asymptote in co-contraction often serves as a hallmark of motor learning and adaptation (14, 15). Important to its role as a normal motor control strategy, co-contraction is actively modulated during movements such as walking, occurring more prominently at predictable points in the gait cycle to stabilize joints and enable efficient walking (8).
In contrast to this normal pattern of co-contraction, chronic presence of excessive or invariant co-contraction should reflect pathology (16). Disturbed voluntary muscle activation following stroke is thought to involve excessive co-contraction, which may stem from diffuse descending motor drive or exaggerated stretch reflexes generated in the antagonist muscle by movement (i.e., antagonist restraint) (17, 18). Clinical perspectives have emphasized the presence of excessive and invariant co-contraction in neuropathologic conditions, fueling an expectation that it is ubiquitously present (16, 19–21). However, the literature to date remains inconclusive regarding either its presence or causal role in motor dysfunction (10, 19–21). Furthermore, it is thought that co-contraction contributes to slow, inefficient walking after stroke (5, 6, 22, 23). Importantly, if excessive co-contraction is present during walking after stroke, it should be quantifiable and associated with robust measures of gait impairment, particularly, generation of plantarflexor power.
While objective, quantifiable methods exist for analyzing co-contraction in healthy individuals, the literature provides no “best” method to account for co-contraction as a feature of pathologic muscle activation patterns (24). We surveyed the existent literature and selected two popular metrics. The first, developed by Falconer and Winter, is a metric based on normal gait patterns from ten healthy adults (8). This method computes a ratio of antagonist to agonist electromyography (EMG) activity within each phase of the gait cycle. Another common method quantifies the “wasted contraction” (WC) shared between an agonist and antagonist muscle by denoting the smaller of the two traces as the WC and the remaining EMG activity as the “effective contraction,” which generates movement. This approach was developed by researchers studying upper limb motor adaptation and computational motor control (25). To our knowledge, the WC measure has not been applied to evaluate co-contraction during walking. Both metrics evaluate muscle activation patterns in a manner that does not account for the biomechanical role of each muscle within the task. That is, the larger magnitude EMG signal is assumed to arise from the agonist and the smaller signal from the antagonist. However, this assumption does not always hold, especially after stroke. Impaired EMG amplitude and phasing following stroke may, therefore, require a metric that is sensitive to these changes in muscle roles throughout the gait cycle. EMG normalization also varies considerably when quantifying co-contraction, which may further influence data interpretation and outcomes.
The goal of the present study is to assess the relationship between ankle co-contraction and gait impairment following stroke. Given the challenges involved with detecting co-contraction in a pathologic population, we will investigate the effect of various methods for quantifying co-contraction. Here, we introduce a modified version of the Falconer and Winter metric in which the agonist and antagonist muscle roles are prescribed within each phase of the gait cycle. We will investigate the effects of co-contraction metric and EMG normalization in order to comprehensively assess the presence and magnitude of pathologic co-contraction. Our results will allow us to determine whether, and how, the metric impacts the ability to detect pathologic co-contraction patterns after stroke, while accounting for inconsistencies in the literature that may underlie detection of this phenomenon.
This is a subgroup analysis from a larger study. We included 15 individuals post-stroke and 9 healthy controls. Demographic data are presented in Table 1. Overall, participants were included if they were: greater than 18 years of age, able to walk independently for a distance of at least 15 m with or without an assistive device, and medically stable. Participants post-stroke were included following clinical presentation of a single, unilateral stroke—confirmed by neuroimaging—at least 6 months prior to enrollment. Individuals with brainstem or cerebellar involvement, bilateral involvement, major neurologic or neurodegenerative conditions other than stroke, orthopedic or cardiovascular conditions that precluded walking on a treadmill, or pregnancy were excluded.
Testing occurred at the Brain Rehabilitation Research Center in the Malcom Randall VA Medical Center in Gainesville, FL, USA.
Participants walked on an instrumented split-belt treadmill (Bertec, Columbus, OH, USA, sampling frequency 2,000 Hz) at their self-selected speed. No handrail support was provided and participants wore a modified mountain climbing harness for fall arrest (Robertson Harness, Henderson, NV, USA); no substantial body weight support was provided. Four participants regularly used a custom-molded ankle foot orthosis (n = 3) or ankle brace (n = 1) on the paretic leg. Two of these participants wore an Aircast® AirSport™ (DJO Global, Vista, CA, USA) for mediolateral support during testing, while all other participants were tested without ankle support. Reflective markers were placed over anatomical landmarks using a modified Helen Hayes marker set (26). Coordinates of the anterior superior iliac spines were located using a digitizing pointer (C-Motion, Inc., Germantown, MD, USA). Locations of the medial and lateral malleoli were digitized for AirCast® wearers due to interference with skin contact. Marker data were recorded by 12 infrared cameras (Vicon MX, Vicon Motion Systems Ltd., Oxford, UK) at 200 Hz.
Surface EMG was recorded using active preamplifiers (MA-420, Motion Lab Systems, Baton Rouge, LA, USA; input impedance >100,000,000 Ω, CMRR >100 dB at 65 Hz, noise <1.2 μV RMS, signal bandwidth 10–2,000 Hz) attached to gel surface electrodes (Cleartrace 2, Conmed, Utica, NY, USA). Skin was abraded and cleaned with alcohol, then electrodes were placed on the muscle belly of the medial gastrocnemius (MG), soleus (SOL), and tibialis anterior (TA) of each leg according to the SENIAM guidelines (27). To assure maximal resolution, amplifier gains were adjusted minimally by visual inspection during isolated ankle movements prior to data collection. EMG data were recorded in Signal (Version 6.0, Cambridge Electronic Design, Cambridge, England) at 2,000 Hz.
Maximal M-waves (M-max) were elicited through stimulation with a Digitimer stimulator (DS-7A or DS-7AH for high-current stimulation, Hertfordshire, UK) using either a hand-held bipolar stimulator probe (CareFusion, Middleton, WI, USA) or a custom monopolar ball electrode. M-max was elicited in the paretic or test leg MG/SOL or TA by supramaximal stimulation of the tibial nerve or common peroneal nerve, respectively (28). M-max amplitudes were averaged across 4–7 consecutive stimulations. One control subject was excluded from M-max analysis because data were overwritten.
Participants were instructed to walk with their arms relaxed at their sides. Data were collected in 1-min walking blocks, with seated or standing rest breaks taken as needed.
EMG data were band-pass filtered to remove noise (fourth order Butterworth, cutoff frequency 10–450 Hz), rectified, low-pass filtered (fourth order Butterworth), time-normalized to a 1,001-point gait cycle, and signal averaged (60 cycles), to establish a linear envelope. The ideal low-pass filter frequency was determined by each individual’s mean stride time (cutoff frequency 5/stride time Hz; control 4.6 ± 0.3 Hz, stroke 3.9 ± 0.5 Hz), as recommended by Shiavi et al. (29). The linear envelopes were then amplitude-normalized in each of three ways: (1) no normalization (non), (2) to the maximum value across the gait cycle (max), or (3) to M-max. Data were processed using custom MATLAB scripts (The MathWorks r2015a, Natick, MA, USA).
The gait cycle was divided into seven bins using gait events extracted from ground reaction force and heel marker data. The events defined bins following the standard established by the Rancho Los Amigos Medical Center Pathokinesiology Lab: loading response (LR), mid-stance (MSt), terminal stance (TSt), pre-swing (PSw), initial swing (ISw), mid-swing (MSw), and terminal swing (TSw) (30). The three swing bins each represent one-third of the swing phase.
We used three metrics to quantify co-contraction. The first metric, which we will denote as CItraditional, was first described by Falconer and Winter (8). This metric represents a ratio of agonist/antagonist overlap to total muscle activation. The total antagonist activity within each bin, Iant, is calculated as the area under the curve created by the smaller EMG envelope as indicated by the shaded region in the top row of plots in Figure 1. The total activity, Itot, is the sum of the agonist and antagonist EMG areas within a given pair of muscles (i.e., MG/TA or SOL/TA). The co-contraction index can then be quantified as:
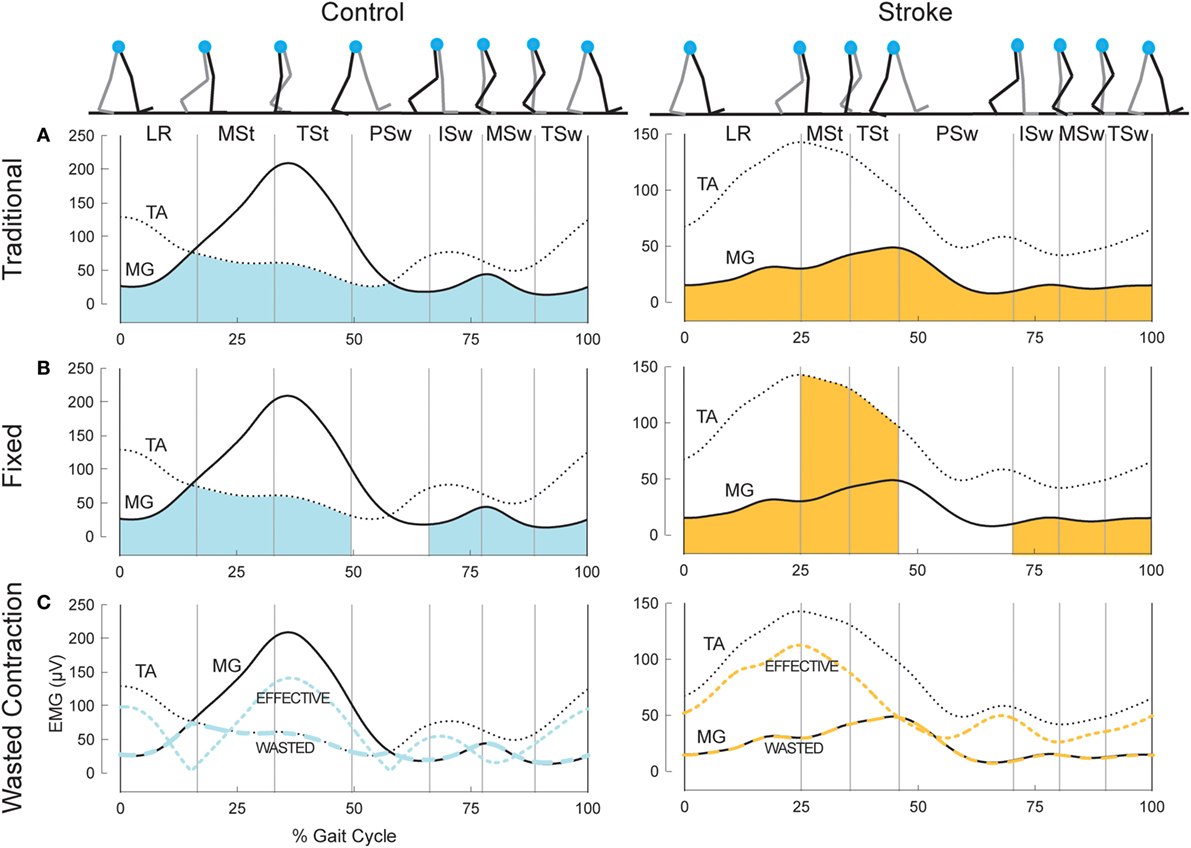
Figure 1. Example co-contraction metrics. (A) Eight gait events dividing the gait cycle into seven phases: loading response (LR), mid-stance (MSt), terminal stance (TSt), pre-swing (PSw), initial swing (ISw), mid-swing (MSw), and terminal swing (TSw). Illustrated immediately below, is example EMG in the medial gastrocnemius (MG, solid) and tibialis anterior (TA, dotted) for a healthy control (left) and an individual post-stroke (right). The shaded area reflects the area under the lower trace at any point, used as the antagonist in the traditional co-contraction index calculations. (B) Illustration using the same example EMG as above, however the shaded area reflects the area under the muscle that should be the antagonist within each phase. PSw is not shaded because the antagonist muscle typically switches between MG and TA in this phase. (C) The resulting wasted contraction for the same subjects, the lower of the two traces (wide dashes), and the effective contraction, which is calculated as the higher trace minus the lower trace (narrow dashes). The wasted contraction index is the mean of the wasted contraction, expressed as a percentage of the maximum effective contraction.
A CI value of 100% represents total co-contraction, while a value of 0% represents pure agonist activation. This measure has been widely cited and applied in the literature (31–35). We calculated two co-contraction indices for each phase of the gait cycle, one with the MG/TA pairing, and one with the SOL/TA pairing.
The second metric, CIfixed, is analogous to the traditional Falconer and Winter metric, except the agonist/antagonist muscle relationship was fixed to the biomechanical function of these muscles within each of the seven bins of the gait cycle, as demonstrated by typical EMG patterns of healthy individuals (Figure 1, middle plots). During LR, ISw, MSw, and TSw, the TA should be the agonist muscle, while the MG should be the antagonist:
During MSt and TSt, the MG should be the agonist and the TA the antagonist muscle:
In health, the ankle muscles switch agonist/antagonist roles in PSw; thus, we were unable to calculate a co-contraction index during PSw using this method. CIfixed for the SOL/TA pairing was calculated in the same manner as Eqs 2 and 3 above; however, the SOL was used as the antagonist muscle during LR and the swing phases.
The final metric, illustrated in the bottom plots of Figure 1, was developed by Thoroughman and Shadmehr to represent the amount of “wasted contraction” that occurs due to co-contraction (25). Similar to CItraditional, the smaller of the two EMG envelopes is designated to represent the contraction that is wasted by simultaneous activity in opposing muscles. This amount can be subtracted from the EMG envelope of the larger signal to determine “effective contraction,” or the amount of agonist activation that effectively performed the movement. The wasted and effective contraction traces can be divided by the maximum effective contraction, resulting in units expressed as the percentage of maximum effective contraction. This step was necessary to compare the effects of EMG normalization since the units of wasted and effective contractions are the same as the units of the EMG traces from which they are based (e.g., microvolts). The mean wasted and effective contractions were calculated for each gait phase.
Clinical and Functional Assessments
We used two functional assessments of motor impairment: the lower extremity Fugl-Meyer Assessment of Motor Performance (LE FMA) and walking speeds (36). Self-selected and fastest comfortable walking speeds (SSWS and FCWS, respectively) were captured using 3–5 passes on a 16-foot GaitRite pressure-sensitive walkway (Platinum Plus System, Version 3.9, Havertown, PA, USA). SSWS involved walking at a casual, comfortable pace. Fastest comfortable speed was assessed as the fastest speed the participant could safely attain when walking, “as if you are crossing the street and the walk signal changed to a red hand.” All clinical and functional assessments were performed by a licensed physical therapist (VLL).
Ankle Power
We used ankle power to quantify a key biomechanical aspect of walking function. Power was calculated using inverse dynamics by the following formula:
where P is the rate of work done by the ankle muscles (i.e., power), M is the joint moment, and ω is the angular velocity (37, 38). An example ankle power curve is shown in Figure 2. The second peak of the ankle power curve, or A2, is prominent in late stance for both normal and pathologic gait (37, 39). A2 is often diminished with aging and in individuals post-stroke (39, 40). Although A2 scales with walking speed, the deficit in these individuals is present even when compared to speed-matched controls (41, 42). Because the plantarflexors are the primary mediators of A2 and A2 and accounts for both joint motion and muscular output through torque generation (43), this outcome is highly sensitive and relevant to functional changes after stroke.
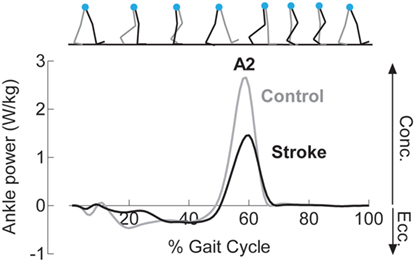
Figure 2. Reduced concentric ankle plantarflexor power is noted following stroke. Example ankle power curves, derived from inverse dynamics, for a healthy control (gray) and an individual following stroke (black) demonstrate diminished peak concentric plantarflexor power (A2) late in the stance phase of gait.
Data were tested for normality using a Shapiro–Wilk W test. In the cases where the assumption of normality was not met (all cases except SOL/TA CItraditional), data were transformed using a base 10 logarithmic transformation. In the final case, raw data were analyzed. Separate two-factor ANOVAs assessed the effects of group (control or stroke) and normalization (maximum value, M-max, or no normalization) on each of the three co-contraction indices and muscle pairs (MG/TA, SOL/TA). Tukey’s Honestly Significant Difference was performed post hoc when significant effects were detected. To account for multiple comparisons, significance was established using a Bonferroni corrected value of p < 0.0083. Spearman’s correlations assessed the relationship between co-contraction and walking function. The Bonferroni corrected significance level for correlation analyses was p < 0.0125. Statistical testing was performed in JMP Pro 11 (SAS Institute, Inc., Cary, NC, USA).
Visual assessment of EMG patterns during walking revealed consistent patterns in healthy controls, accompanied by vast heterogeneity in the stroke group. Differences between healthy and stroke subjects are most relevant in TSt, where peak plantarflexor EMG tends to occur. TSt is also the gait phase when plantarflexor EMG contributes to A2—the most robust measure of gait function employed in this study. Moving forward, all results will be presented during TSt unless specified otherwise. Group co-contraction responses during TSt can be visualized by metric in Figure 3 for the paretic leg and Figure 4 for the non-paretic leg. Because the core findings are largely similar between legs and we are primarily interested in paretic leg function, we performed statistics only on the paretic leg.
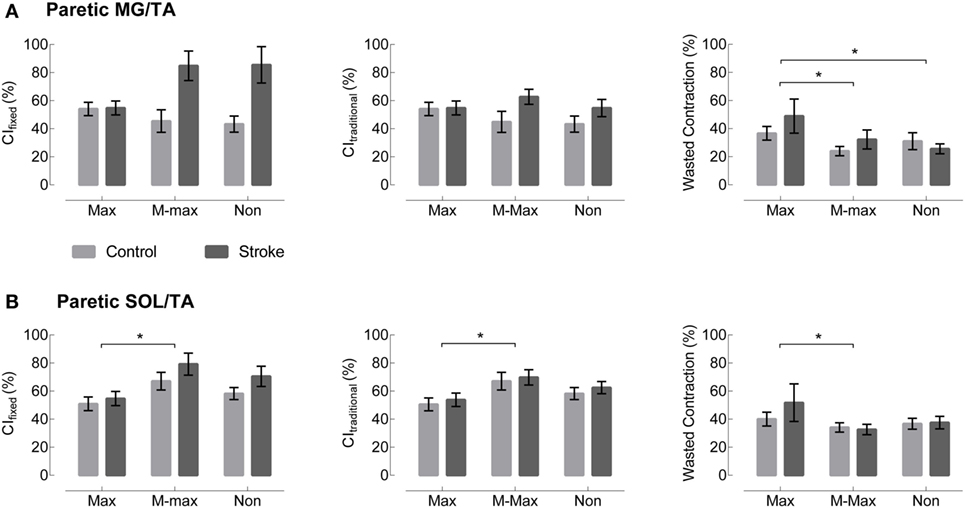
Figure 3. Paretic leg co-contraction following stroke is not different from healthy controls. (A) Co-contraction of the medial gastrocnemius and tibialis anterior (MG/TA) in terminal stance is shown by three EMG normalization methods: maximum value (Max), maximal M-wave (M-max), and non-normalized (Non). Plots moving left to right represent three different co-contraction indices: a co-contraction ratio with fixed muscle roles derived from referencing healthy EMG (CIfixed, left), a traditional index for co-contraction during normal walking (CItraditional, center), and an index of the “wasted contraction” produced by antagonist activation countering agonist activation (right). There are no group differences between stroke (gray) and control (black) in any of the three comparisons. (B) Co-contraction of the soleus and tibialis anterior (SOL/TA) in terminal stance. Again, there were no significant differences between control and stroke. *Indicates significance with a Bonferroni-corrected p < 0.0083.
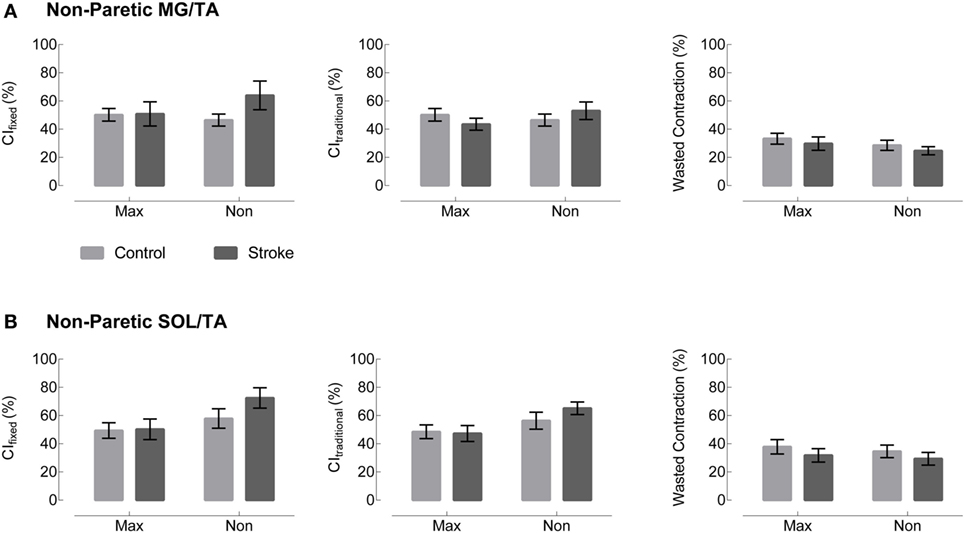
Figure 4. Non-paretic leg co-contraction appears unchanged across group, metric, and normalization method. Plots moving left to right represent three different co-contraction indices: a co-contraction ratio with fixed muscle roles derived from referencing healthy EMG (CIfixed, left), a traditional index for co-contraction during normal walking (CItraditional, center), and an index of the “wasted contraction” produced by antagonist activation countering agonist activation (right). Co-contraction in terminal stance appears unchanged between control (gray) and stroke (black) in both (A) the medial gastrocnemius and tibialis anterior (MG/TA) and (B) the soleus and tibialis anterior (SOL/TA).
The metric adjusted for the muscles’ biomechanical roles, CIfixed, showed no significant main effect of Group or Group × Normalization interaction. In the SOL/TA muscle pairing, there was a significant main effect of normalization method (p = 0.0032, Figure 3). Post hoc testing revealed that M-max normalization produced greater CIfixed than maximum value normalization (p = 0.0024). The MG/TA pairing revealed no significant main effects.
CItraditional resulted in values similar to CIfixed during TSt, and the statistical findings are largely the same. Both muscle pairings revealed no significant main effects of Group or Group × Normalization interactions. The SOL/TA pairing revealed a significant main effect of Normalization (p = 0.0051). Post hoc testing revealed that M-max normalization was again greater than maximum value normalization (p = 0.0035). The MG/TA pairing revealed no significant main effects.
The WC, when expressed as a percentage of the effective contraction, has the potential to create outliers when the two EMG traces are similar in magnitude. In the case of maximum value normalization, one subject’s EMG produced an extreme value for both the MG/TA and SOL/TA muscle pairings, corresponding to z-scores of 6.3 and 7.0, respectively. Since no data transformation could normalize the dataset with outliers of that magnitude, we adjusted each of the outliers to a z-score of 3. This step allowed for adequate statistical comparison within the remaining dataset. Both the MG/TA and SOL/TA muscle pairings revealed only a significant main effect of Normalization (p = 0.0008 and p = 0.0005, respectively). Post hoc testing for the MG/TA pairing revealed that maximum value normalization produced greater WC values than both M-max (p = 0.0044) and WC derived from non-normalized EMG (p = 0.0018). In the SOL/TA muscle pairing, WC was greater with maximum value normalization than M-max normalization (p = 0.0004). Because the adjusted outlier would have created an even higher mean value for maximum value-normalized WC, these significant findings are consistent with the original direction of the adjusted outlier. When calculating WC, we observed an interesting phenomenon. Two subjects with visually different EMG patterns revealed comparable WC values in TSt (Figure 5). Aside from the maximum value normalization condition, the WC values tended to have low variability, despite obvious visual differences present in the original EMG. This circumstance creates a problem for interpreting the WC results, which we will revisit in the Section in the discussion.
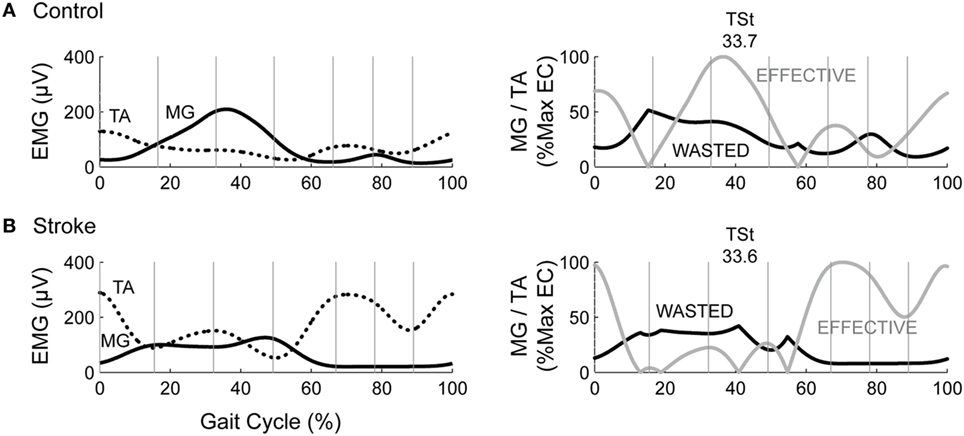
Figure 5. Two subjects show vastly different EMG with same wasted contraction (WC) value in terminal stance. The left column depicts example EMG for the medial gastrocnemius (MG) and tibialis anterior (TA) muscles in (A) a healthy control and (B). an individual post-stroke. The right column depicts the resultant wasted and effective contraction, with WC in TSt denoted above each plot.
Non-normalized CIfixed values are moderately correlated with functional metrics across groups. We observed similar results across all co-contraction indices. Because non-normalized data are most straightforward to interpret, we chose this metric to perform correlations with functional measures. Therefore, CIfixed serves as representative of the patterns present across metrics. Four comparisons were made between CIfixed and LE FMA, SSWS, FCWS, and A2 (Figure 6). CIfixed was not significantly correlated with either LE FMA (Spearman’s ρ = −0.6079, p = 0.0162) or A2, our most sensitive assessment of walking function (ρ = −0.4557, p = 0.0252). CIfixed was significantly correlated with both SSWS (ρ = −0.6438, p = 0.0007) and FCWS (ρ = −0.6026, p = 0.0018).
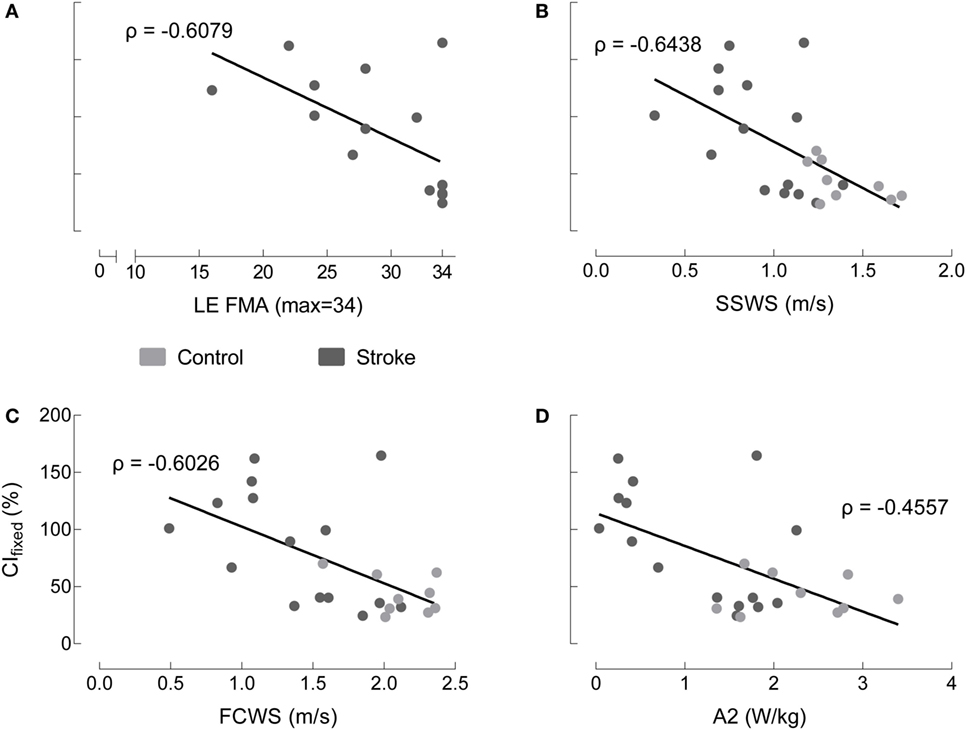
Figure 6. Co-contraction index in terminal stance correlates to some, but not all, indices of motor function. Medial gastrocnemius/tibialis anterior CI_fixed in terminal stance with non-normalized EMG varies as a function of: (A) lower extremity Fugl-Meyer (LE FMA), (B) self-selected walking speed (SSWS), (C) fastest comfortable walking speed (FCWS), and (D) peak concentric ankle plantarflexor power (A2) for healthy controls (gray), individuals post-stroke (black). The only correlations reaching statistical significance occur with SSWS and FCWS.
Despite our systematic analysis of co-contraction during gait, we are unable to conclude that co-contraction is ubiquitously present post-stroke. As illustrated in Figure 7, this sample of individuals post-stroke revealed vast heterogeneity in EMG patterns, and no distinct pattern of co-contraction emerged. Furthermore, regardless of the metric used to assess co-contraction, our results fail to indicate clear differences between stroke and healthy controls. Although results reported here are limited to the TSt phase of gait, this finding is consistent across all gait phases. Nearly four decades of literature discuss pathological co-contraction after stroke, arguing for its presence as either study motivation or data interpretation, yet failing to show convincing evidence through results. Taken together with results of the current analysis, this lack of evidence leads us to reconsider the assumption that pathological co-contraction is a primary factor contributing to impaired gait post-stroke. The following discussion enumerates the details leading to this conclusion.
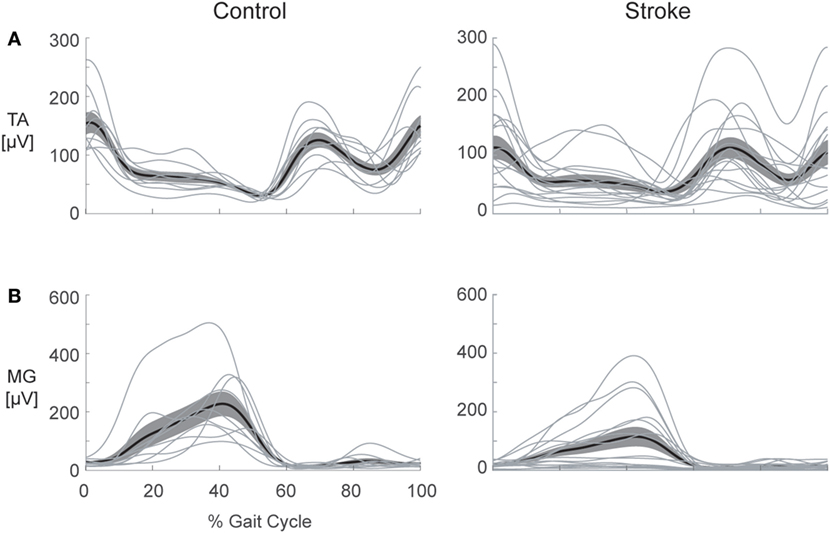
Figure 7. Heterogeneity in electromyography (EMG) activation is present following stroke. Healthy control (left) and stroke (right) EMG envelopes are illustrated for the: (A) tibialis anterior (TA) and (B) medial gastrocnemius (MG). The heavy line depicts the ensemble average for each group and the cloud illustrates the SEM with individual subject responses overlaid (thin lines). Considerable variation in activation patterns of each muscle is apparent within the stroke group, illustrating the difficulty inherent in selecting a single metric to capture all of the possible deviations from the pattern of healthy controls.
Early studies assessing EMG during gait post-stroke carefully described the authors’ observations while presenting mostly qualitative evaluations and proposing future avenues of research. Knutsson and Richards are often credited for the suggestion that co-contraction could be a strategy employed in post-stroke gait, but they carefully acknowledged that the heterogeneity present within their sample limited their ability to draw distinct conclusions (22). Another group classified whole-leg muscle activation patterns, classifying less than half of their sample in the chronic phase of recovery as expressing excessive co-contraction (5). There is heterogeneity in virtually all motor outcomes measured following stroke, and that heterogeneity impacts the ability to assess treatment efficacy (44). Equally important, no strong evidence has emerged in favor of co-contraction as either the predominant strategy or one of a few common strategies employed by these individuals. Moreover, the evidence provides no indication that mitigating co-contraction is a productive treatment target. Working under the assumption that co-contraction indices provide useful information, therefore, limits our ability to appropriately quantify motor impairment within this population.
Heterogeneity of responses among individuals post-stroke leads many groups to seek a single metric, or a simple collection of metrics, which can parse these individual differences. Here, we employed a two-factor approach by combining EMG metrics with measures of motor or gait impairment. Although our data reveal some significant correlations, these are not sufficiently strong to support an argument for a causal link between co-contraction and impaired biomechanical function. Lower extremity coordination during gait requires much more than the ankle muscles; however, the vital importance of the ankle plantarflexors affords an ideal test-bed for assessing the relevance of lower extremity co-contraction post-stroke. Yet, no clear patterns emerged. It is worth noting that four of the individuals within this sample regularly wore some form of ankle brace. The extent to which bracing impacted the EMG patterns differentially from the stroke itself is not known. We compared these participants against those who did not wear a brace and found no apparent differences. We acknowledge this is a limitation within our sample that may be worth exploring in the future. It is also important to note that EMG assesses the final common pathway (45), and these peripheral signals cannot be used to draw specific conclusions about central nervous system function. Although we expect surface EMG signals to provide information about motor coordination, co-contraction may not be sufficiently robust to explain central nervous system dysfunction.
Changing the co-contraction metric offered variable results. Contrary to our initial expectations, fixing the biomechanical roles of the muscles was only marginally more informative than the existing CI, which was not designed to account for abnormal muscle activation patterns. Importantly, the group-level results were the same; neither metric revealed differences between healthy individuals and individuals post-stroke. On the group level, even the WC metric performed similarly to the two co-contraction indices. However, thorough evaluation of the relationship of the individual numeric values to the EMG profiles provides insight that the WC metric does not perform well during gait. From production of extreme outliers to equivalent numeric values in obviously different EMG patterns (Figure 5), we can conclusively state that the WC metric is not useful for assessment of co-contraction in multi-segmental lower extremity tasks.
Normalization also provided varying results, creating a need for careful consideration of normalization procedures before, during, and after EMG assessment. Perhaps the most interesting result from the normalization analysis is the congruency of the M-max and non-normalized EMG co-contraction indices. Choosing not to normalize EMG can be advantageous because it avoids data transformation beyond recognition. Our findings support arguments presented by Lamontagne regarding EMG metrics in stroke (6). While EMG normalization is not strictly necessary in this context because calculating a ratio from normalized data effectively normalizes the data twice, most studies in the literature employ some type of normalization prior to calculating a co-contraction index (46–48). In our sample, maximum value normalization suggested a different picture of relative muscle activation than either M-max normalization or no normalization.
Co-contraction does not appear to be a universal characteristic of impaired gait post-stroke. We do not mean to suggest that excessive co-contraction does not occur in some individuals; however, the pattern does not occur sufficiently often enough to be considered a prominent compensatory strategy following stroke. Ours is not the first study to find a lack of strong evidence for the presence of excessive co-contraction following stroke. In both the upper and lower extremities, the current evidence suggests that reaching and walking deficits, respectively, are more likely to result from agonist activation impairment than co-contraction (49, 50). It is possible that co-contraction represents too narrow of a concept to represent and characterize neuromotor pathology post-stroke. Accordingly, it may be time to reconsider how we frame the problem. Aberrant EMG is descriptively characterized by timing and amplitude deficits, and the ability to organize responses to the biomechanical constraints of the task and environment (51). In this broader context, approaches other than a co-contraction metric may better capture the relevant deficits. Some recent efforts that have yet to be robustly evaluated in stroke include: Ricamato and Hidler’s EMG metric that incorporates both timing and amplitude components (52); muscle synergy analysis (53, 54); and EMG-driven biomechanical modeling that effectively accounts for subject-specific neuromuscular constraints on dynamic outcomes (55). Our intent is not to prescribe any one of these methods to adequately quantify neurophysiologic impairments with EMG. Rather, we would argue that these and other alternatives be explored in an effort to learn more about the causal mechanisms of gait impairment following stroke.
Beyond an exercise in signal processing and EMG data analysis, our results provide an opportunity for discussion regarding the neural implications of co-contraction following stroke. Heterogeneity among individuals also presents a challenge for understanding behavior after stroke, especially in terms of muscle activation patterns. Our data illustrate that, even when assessed with a variety of metrics, co-contraction does not emerge as the strong indicator of neuromotor pathology the literature has conditioned us to expect. Instead, we must look to other EMG quantification methods that can provide greater insights regarding causal mechanisms of gait impairment.
All procedures were approved by the University of Florida Health Science Center Institutional Review Board (IRB-01) and all participants gave written informed consent prior to enrollment. Testing was conducted in accordance with the Declaration of Helsinki.
CB, HH, and CP conceived and designed experiments. CB and HH contributed analysis tools, prepared figures, and analyzed data. CB and VL performed experiments. CB, HH, VL, and CP interpreted results, revised manuscript, approved final version of manuscript, and agreed to be accountable for all aspects of the work. CB drafted manuscript.
The authors declare that the research was conducted in the absence of any commercial or financial relationships that could be construed as a potential conflict of interest.
We thank the members of the Neural Control of Movement lab for their support, especially Dr. Eric Walker, Spencer Gilleon, and Theresa McGuirk for data collection and processing.
This research was supported by the Department of Veterans Affairs, Rehabilitation Research & Development Service [Project #O1435-P (CP) and Research Career Scientist Award #N9274-S (CP)]. CB received support from a University of Florida Graduate School Fellowship. The funders had no role in study design, data collection and analysis, decision to publish, or preparation of the manuscript.
1. Pollock A, Baer G, Campbell P, Choo PL, Forster A, Morris J, et al. Physical rehabilitation approaches for the recovery of function and mobility following stroke. Cochrane Database Syst Rev (2014) 4:CD001920. doi:10.1002/14651858.CD001920.pub3
2. Dickstein R. Rehabilitation of gait speed after stroke: a critical review of intervention approaches. Neurorehabil Neural Repair (2008) 22(6):649–60. doi:10.1177/15459683080220060201
3. Burpee JL, Lewek MD. Biomechanical gait characteristics of naturally occurring unsuccessful foot clearance during swing in individuals with chronic stroke. Clin Biomech (Bristol, Avon) (2015) 30(10):1102–7. doi:10.1016/j.clinbiomech.2015.08.018
4. Chen G, Patten C, Kothari DH, Zajac FE. Gait differences between individuals with post-stroke hemiparesis and non-disabled controls at matched speeds. Gait Posture (2005) 22(1):51–6. doi:10.1016/j.gaitpost.2004.06.009
5. Shiavi R, Bugle HJ, Limbird T. Electromyographic gait assessment, Part 2: preliminary assessment of hemiparetic synergy patterns. J Rehabil Res Dev (1987) 24(2):24–30.
6. Lamontagne A, Richards CL, Malouin F. Coactivation during gait as an adaptive behavior after stroke. J Electromyogr Kinesiol (2000) 10:407–15. doi:10.1016/S1050-6411(00)00028-6
7. Den Otter AR, Geurts ACH, Mulder T, Duysens J. Abnormalities in the temporal patterning of lower extremity muscle activity in hemiparetic gait. Gait Posture (2007) 25:342–52. doi:10.1016/j.gaitpost.2006.04.007
8. Falconer K, Winter DA. Quantitative assessment of co-contraction at the ankle joint in walking. Electromyogr Clin Neurophysiol (1985) 25(2–3):135–49.
9. Flanders M, Cordo PJ. Quantification of peripherally induced reciprocal activation during voluntary muscle contraction. Electroencephalogr Clin Neurophysiol (1987) 67(5):389–94. doi:10.1016/0013-4694(87)90001-0
10. Corcos DM, Gottlieb GL, Penn RD, Myklebust B, Agarwal GC. Movement deficits caused by hyperexcitable stretch reflexes in spastic humans. Brain (1986) 109(Pt 5):1043–58. doi:10.1093/brain/109.5.1043
11. Gordon J, Ghez C. EMG patterns in antagonist muscles during isometric contraction in man: relations to response dynamics. Exp Brain Res (1984) 55(1):167–71. doi:10.1007/BF00240511
12. van Zuylen EJ, Gielen CC, Denier van der Gon JJ. Coordination and inhomogeneous activation of human arm muscles during isometric torques. J Neurophysiol (1988) 60(5):1523–48.
13. Corcos DM, Agarwal GC, Flaherty BP, Gottlieb GL. Organizing principles for single-joint movements. IV. Implications for isometric contractions. J Neurophysiol (1990) 64(3):1033–42.
14. Busse ME, Wiles CM, van Deursen WM. Muscle co-activation in neurologial conditions. Phys Ther Rev (2005) 10(4):247–53. doi:10.1179/108331905X78915
15. Darainy M, Ostry DJ. Muscle cocontraction following dynamics learning. Exp Brain Res (2008) 190(2):153–63. doi:10.1007/s00221-008-1457-y
16. Twitchell TE. The restoration of motor function following hemiplegia in man. Brain (1951) 74(4):443–80. doi:10.1093/brain/74.4.443
17. Knutsson E, Martensson A, Gransberg L. Influences of muscle stretch reflexes on voluntary, velocity-controlled movements in spastic paraparesis. Brain (1997) 120(Pt 9):1621–33. doi:10.1093/brain/120.9.1621
18. Nathan PW. Factors affecting spasticity. Int Rehabil Med (1980) 2(1):27–30. doi:10.3109/09638288009163951
19. Sahrmann SA, Norton BJ. The relationship of voluntary movement to spasticity in the upper motor neuron syndrome. Ann Neurol (1977) 2(6):460–5. doi:10.1002/ana.410020604
20. Mizrahi EM, Angel RW. Impairment of voluntary movement by spasticity. Ann Neurol (1979) 5(6):594–5. doi:10.1002/ana.410050620
21. Dietz V, Berger W. Normal and impaired regulation of muscle stiffness in gait: a new hypothesis about muscle hypertonia. Exp Neurol (1983) 79(3):680–7. doi:10.1016/0014-4886(83)90032-8
22. Knutsson E, Richards C. Different types of disturbed motor control in gait of hemiparetic patients. Brain (1979) 102(2):405–30. doi:10.1093/brain/102.2.405
23. Detrembleur C, Dierick F, Stoquart G, Chantraine F, Lejeune T. Energy cost, mechanical work, and efficiency of hemiparetic walking. Gait Posture (2003) 18(2):47–55. doi:10.1016/S0966-6362(02)00193-5
24. Rosa MC, Marques A, Demain S, Metcalf CD, Rodrigues J. Methodologies to assess muscle co-contraction during gait in people with neurological impairment – a systematic literature review. J Electromyogr Kinesiol (2014) 24(2):179–91. doi:10.1016/j.jelekin.2013.11.003
25. Thoroughman KA, Shadmehr R. Electromyographic correlates of learning an internal model of reaching movements. J Neurosci (1999) 19(19):8573–88.
26. Kadaba MP, Ramakrishnan HK, Wootten ME. Measurement of lower extremity kinematics during level walking. J Orthop Res (1990) 8(3):383–92. doi:10.1002/jor.1100080310
27. Hermens HJ, Freriks B, Disselhorst-Klug C, Rau G. Development of recommendations for SEMG sensors and sensor placement procedures. J Electromyogr Kinesiol (2000) 10(5):361–74. doi:10.1016/S1050-6411(00)00027-4
28. Geertsen SS, Lundbye-Jensen J, Nielsen JB. Increased central facilitation of antagonist reciprocal inhibition at the onset of dorsiflexion following explosive strength training. J Appl Physiol (1985) (2008) 105(3):915–22. doi:10.1152/japplphysiol.01155.2007
29. Shiavi R, Frigo C, Pedotti A. Electromyographic signals during gait: criteria for envelope filtering and number of strides. Med Biol Eng Comput (1998) 36(2):171–8. doi:10.1007/BF02510739
30. Rancho Los Amigos Medical Center, Pathokinesiology Service, Rancho Los Amigos Medical Center Physical Therapy Dept. Observational Gait Analysis. Downey, CA: Los Amigos Research and Education Institute, Rancho Los Amigos National Rehabilitation Center (2001).
31. Amarantini D, Martin L. A method to combine numerical optimization and EMG data for the estimation of joint moments under dynamic conditions. J Biomech (2004) 37(9):1393–404. doi:10.1016/j.jbiomech.2003.12.020
32. Centomo H, Amarantini D, Martin L, Prince F. Muscle adaptation patterns of children with a trans-tibial amputation during walking. Clin Biomech (Bristol, Avon) (2007) 22(4):457–63. doi:10.1016/j.clinbiomech.2006.11.005
33. Rao G, Amarantini D, Berton E. Influence of additional load on the moments of the agonist and antagonist muscle groups at the knee joint during closed chain exercise. J Electromyogr Kinesiol (2009) 19(3):459–66. doi:10.1016/j.jelekin.2007.12.001
34. Sarcher A, Raison M, Ballaz L, Lemay M, Leboeuf F, Trudel K, et al. Impact of muscle activation on ranges of motion during active elbow movement in children with spastic hemiplegic cerebral palsy. Clin Biomech (Bristol, Avon) (2015) 30(1):86–94. doi:10.1016/j.clinbiomech.2014.10.009
35. Ranavolo A, Mari S, Conte C, Serrao M, Silvetti A, Iavicoli S, et al. A new muscle co-activation index for biomechanical load evaluation in work activities. Ergonomics (2015) 58(6):966–79. doi:10.1080/00140139.2014.991764
36. Fugl-Meyer AR, Jääskö L, Leyman I, Olsson S, Steglind S. The post-stroke hemiplegic patient. 1. A method for evaluation of physical performance. Scand J Rehabil Med (1975) 7(1):13–31.
37. Robertson DG, Winter DA. Mechanical energy generation, absorption and transfer amongst segments during walking. J Biomech (1980) 13(10):845–54. doi:10.1016/0021-9290(80)90172-4
38. Winter DA. Moments of force and mechanical power in jogging. J Biomech (1983) 16(1):91–7. doi:10.1016/0021-9290(83)90050-7
39. Olney SJ, Griffin MP, Monga TN, McBride ID. Work and power in gait of stroke patients. Arch Phys Med Rehabil (1991) 72(5):309–14.
40. Prince F, Corriveau H, Hebert R, Winter DA. Gait in the elderly. Gait Posture (1997) 5(2):128–35. doi:10.1016/S0966-6362(97)01118-1
41. Cofre LE, Lythgo N, Morgan D, Galea MP. Aging modifies joint power and work when gait speeds are matched. Gait Posture (2011) 33(3):484–9. doi:10.1016/j.gaitpost.2010.12.030
42. Jonkers I, Delp S, Patten C. Capacity to increase walking speed is limited by impaired hip and ankle power generation in lower functioning persons post-stroke. Gait Posture (2009) 29:129–37. doi:10.1016/j.gaitpost.2008.07.010
43. Meinders M, Gitter A, Czerniecki JM. The role of ankle plantar flexor muscle work during walking. Scand J Rehabil Med (1998) 30(1):39–46. doi:10.1080/003655098444309
44. Duncan PW, Sullivan KJ, Behrman AL, Azen SP, Wu SS, Nadeau SE, et al. Body-weight-supported treadmill rehabilitation after stroke. N Engl J Med (2011) 364(21):2026–36. doi:10.1056/NEJMoa1010790
45. Enoka RM, Duchateau J. Inappropriate interpretation of surface EMG signals and muscle fiber characteristics impedes understanding of the control of neuromuscular function. J Appl Physiol (1985) (2015) 119(12):1516–8. doi:10.1152/japplphysiol.00280.2015
46. Eken MM, Dallmeijer AJ, Doorenbosch CA, Dekkers H, Becher JG, Houdijk H. Coactivation during dynamometry testing in adolescents with spastic cerebral palsy. Phys Ther (2016) 96(9):1438–47. doi:10.2522/ptj.20140448
47. Chow JW, Yablon SA, Stokic DS. Coactivation of ankle muscles during stance phase of gait in patients with lower limb hypertonia after acquired brain injury. Clin Neurophysiol (2012) 123(8):1599–605. doi:10.1016/j.clinph.2012.01.006
48. Knarr BA, Zeni JA Jr, Higginson JS. Comparison of electromyography and joint moment as indicators of co-contraction. J Electromyogr Kinesiol (2012) 22(4):607–11. doi:10.1016/j.jelekin.2012.02.001
49. Wagner JM, Dromerick AW, Sahrmann SA, Lang CE. Upper extremity muscle activation during recovery of reaching in subjects with post-stroke hemiparesis. Clin Neurophysiol (2007) 118(1):164–76. doi:10.1016/j.clinph.2006.09.022
50. Clark DJ, Condliffe EG, Patten C. Activation impairment alters muscle torque-velocity in the knee extensors of persons with post-stroke hemiparesis. Clin Neurophysiol (2006) 117(10):2328–37. doi:10.1016/j.clinph.2006.07.131
51. Lamontagne A, Stephenson JL, Fung J. Physiological evaluation of gait disturbances post stroke. Clin Neurophysiol (2007) 118(4):717–29. doi:10.1016/j.clinph.2006.12.013
52. Ricamato AL, Hidler JM. Quantification of the dynamic properties of EMG patterns during gait. J Electromyogr Kinesiol (2005) 15(4):384–92. doi:10.1016/j.jelekin.2004.10.003
53. Clark DJ, Ting LH, Zajac FE, Neptune RR, Kautz SA. Merging of healthy motor modules predicts reduced locomotor performance and muscle coordination complexity post-stroke. J Neurophysiol (2010) 103:844–57. doi:10.1152/jn.00825.2009
54. Banks CL, Pai MM, McGuirk TE, Fregly BJ, Patten C. Methodological choices in muscle synergy analysis impact differentiation of physiological characteristics following stroke. Front Comput Neurosci (2017) 11:78. doi:10.3389/fncom.2017.00078
Keywords: stroke, co-contraction, electromyography, walking, methodology, motor disorders
Citation: Banks CL, Huang HJ, Little VL and Patten C (2017) Electromyography Exposes Heterogeneity in Muscle Co-Contraction following Stroke. Front. Neurol. 8:699. doi: 10.3389/fneur.2017.00699
Received: 01 July 2017; Accepted: 05 December 2017;
Published: 22 December 2017
Edited by:
Sheng Li, University of Texas Health Science Center at Houston, United StatesReviewed by:
Xiaogang Hu, University of North Carolina at Chapel Hill, United StatesCopyright: © 2017 Banks, Huang, Little and Patten. This is an open-access article distributed under the terms of the Creative Commons Attribution License (CC BY). The use, distribution or reproduction in other forums is permitted, provided the original author(s) or licensor are credited and that the original publication in this journal is cited, in accordance with accepted academic practice. No use, distribution or reproduction is permitted which does not comply with these terms.
*Correspondence: Carolynn Patten, cGF0dGVuQHBoaHAudWZsLmVkdQ==
Disclaimer: All claims expressed in this article are solely those of the authors and do not necessarily represent those of their affiliated organizations, or those of the publisher, the editors and the reviewers. Any product that may be evaluated in this article or claim that may be made by its manufacturer is not guaranteed or endorsed by the publisher.
Research integrity at Frontiers

Learn more about the work of our research integrity team to safeguard the quality of each article we publish.