- Gavin Herbert Eye Institute, University of California Irvine, Irvine, CA, USA
Background: Structural details of vertebrate extraocular muscles (EOMs) have shown an anatomically and functionally distinct laminar organization into an outer orbital (OL) and an inner global layer (GL). Since hyperthyroidism alters tissue oxidative metabolism through mitochondrial enzymes, it is expected that structural/mitochondrial changes may be seen in hyperthyroid EOMs. We investigated the alterations in the laminar organization and mitochondrial changes in hyperthyroid mouse EOMs. Methods: Hyperthyroidism was induced in C57BL/6 mice and fresh rectus muscles were obtained to identify functional mitochondria using MitoTracker® Green and confocal microscopy; frozen sections from rectus muscles were stained with anti-rabbit Troponin T (selectively present in the OL) to demonstrate changes in the OL and GL of the EOMs. Ultrastructural features of EOMs were studied using transmission electron microscopy (TEM). Results: Of all four rectus EOMs studied, the maximum change was seen in the inferior rectus muscle (IR) followed by medial rectus (MR). Myofiber cross-sectional area measurements and Troponin T staining in the control IR EOMs demonstrated a smaller OL (113.2 ± 3.66 μm2) and higher density staining with Troponin T (90%) and a larger GL (411 ± 13.84 μm2) with low intensity staining (10%), while hyperthyroidism resulted in an increased OL (205.9 ± 5.3 μm2) and decreased GL (271.7 ± 7.5 μm2) p = 0.001. Confocal microscopy demonstrated an intense staining especially in the outer rims in the hyperthyroid IR which was confirmed by TEM showing structural alterations in the mitochondria and a subsarcolemmal migration. Conclusions: The outer, thinner, OL of the mouse EOM contains smaller diameter myofibers and fewer mitochondria while the inner, larger GL contains larger diameter myofibers and larger density of mitochondria. Hyperthyroidism results in a significant alteration in the laminar organization and mitochondrial alterations of mouse EOMs.
Introduction
The extraocular muscles (EOMs) are unique from other skeletal muscles regarding their embryologic development, innervations, vascularization, metabolic profile, mitochondrial content, and gene expression (Budak et al., 2004). However, the most striking histological feature is the distinct laminar organization consisting of two layers, a thin outer orbital layer (OL), next to the orbital wall and a thicker inner global layer (GL), closer to the globe, separated by a well defined gap. It has been demonstrated that both layers differ in thickness, fiber size, metabolic activity, and vascular density (Budak et al., 2004). These distinct muscle layers have been described in rats, monkeys, humans, rabbits, and dogs (Porter et al., 1995; Wasicky et al., 2000; Oh et al., 2001a,b; Lucas and Hoh, 2003; Budak et al., 2004; Wicke et al., 2007; Wiesen et al., 2007). In humans, this anatomical compartmentalization is believed to work together to provide a unique “pulley” mechanism necessary for the rotational movement of the globe (Demer et al., 2000; Kono et al., 2002; Miller, 2007).
Hyperthyroidism accelerates the basal metabolic rate and oxidative metabolism by mitochondrial enzyme induction, enhancing generation of reactive oxygen species and changing various tissue antioxidant systems that together are thought to result in the development of hyperthyroidism-induced tissue damage (Hulbert, 2000; Bednarek et al., 2004; Mogulkoc et al., 2006). Since mitochondria, the major site of oxidative phosphorylation in the cell, are considered a likely sub cellular target for the action of thyroid hormones, it is hypothesized that hyperthyroidism might result in a reduction of mitochondrial energy generation. As the EOM are metabolically very active tissues, characteristic changes in the mitochondria are expected following hyperthyroidism. We thus, hypothesize that a disruption of oxidative metabolism from hyperthyroidism may result in alterations in both the laminar organization of the two layers and the mitochondrial function and content of the EOM in our model.
In this experimental study using a mouse model, we describe the EOM structural organization in the normal mouse and compared them with the EOM changes following induction of hyperthyroidism. In addition, since mitochondrial damage is related to the pathogenesis of hyperthyroidism, we used a series of patented mitochondrion-selective stains that are concentrated by active mitochondria to label functional mitochondria, to determine the effects of hyperthyroidism on the EOM rectus muscles. As this study aimed at studying the pathogenesis of hyperthyroidism induced EOM changes, these may not correlate directly with those seen in autoimmune induced Graves’ disease or thyroid eye disease.
Materials and Methods
Animals
Twenty, 2-month old, female C57BL/6 wild type mice weighing 20–25 g were used in these experiments. Mice were housed in groups with free access to food and water in a room with a 12 h:12 h light/dark cycle maintained at 22°C. All procedures were approved by the University of California, Irvine, CA, IACUC and conducted in accordance with ARVO Statement for the Use of Animals in Ophthalmic and Vision Research.
Hyperthyroidism was induced in ten mice by intraperitoneal injection of sterile 3,5,3′-triiodothyronine (T3) (3,3′,5-triiodo-l-thyronine sodium salt, Sigma, St Louis, MO, USA) at a concentration of 0.2 mg/ml in 5 mM NaOH at pH 9.2. Each mouse received injections of T3 at a dose of 2 μg/g body weight/day for 4 weeks. Ten mice were used as control and received intraperitoneal injections of 5 mM NaOH at pH 9.2, at an equivalent volume (0.01 ml/day) as the hyperthyroid group. Hyperthyroidism was confirmed using T3 and TSH assays in the control (T3:182 ± 45 ng/dl; TSH: 0.2 μlU/ml) and hyperthyroid (T3: 398 ± 50 ng/dl; TSH: < 0.01 μlU/ml) group.
After 4 weeks, the animals were euthanized by CO2 inhalation followed immediately by orbital dissection and exenteration to obtain intact the EOM and ocular globe under sterile conditions. Superior, lateral, medial and inferior rectus muscles were identified and isolated.
Confocal Microscopy
Five control and five hyperthyroid mice were used to obtain fresh isolated rectus muscles. Samples were stained with 200 nM Mitotracker Green® (Invitrogen, Carlsbad, CA, USA) in media M199 (Invitrogen, Carlsbad, CA, USA) for 30 min at 37°C and then washed with PBS. Samples were then scanned using a Zeiss 510 Meta laser scanning confocal microscope and 40× objective. The fluorescent signal was obtained using the 488-nm argon laser and the emission spectra using a 500–550 nm band pass filter. For 3D reconstruction, the stained tissues were scanned using a 1-μm step size and data recorded as 8-bit, 512 × 512 images.
Immunohistochemistry
Five controls and five hyperthyroid inferior rectus muscles were quickly embedded in OCT, snap frozen in liquid nitrogen and stored at −80°C. Eight micrometer sections were obtained using a CM1850 Cryostat (Leica, Wetzlar, Germany), mounted on Superfrost®/Plus slides (Fisher Scientific, Pittsburgh, PA, USA) and stored at −80°C until used.
Rabbit antibodies to Troponin T, a 36-kDa tropomyosin binding subunit of the troponin complex located on the thin filament of striated muscles (Farah and Reinach, 1995; Squire and Morris, 1998), was obtained from Abcam (Cambridge, MA, USA). Sections were first fixed in acetone for 3 min and then incubated with 1% BSA for 30 min to block non-specific antibody binding. Tissue was then incubated with anti-Troponin T antibodies at 1:50 dilution in PBS for 1 h at 37°C. Sections were subsequently washed in PBS and reacted with goat anti-rabbit IgG conjugated to Alexa Fluor 488 (Invitrogen, Carlsbad, CA, USA) at a dilution of 1:100 for 1 h at 37°C. These tissue sections were also counterstained with DAPI to identify nuclei. For negative controls, tissue sections were left unstained, stained with irrelevant primary antibodies or secondary antibodies alone.
All samples were evaluated using a Nikon Eclipse E600 fluorescence microscope (Nikon Instruments Inc, Melville, NY, USA) equipped with a CoolSnap low light level digital camera (Photometrics, Tucson, AZ, USA). Images were digitized using Metamorph Image acquisition system (Molecular Devices, Downingtown, PA, USA).
Electron Microscopy
A 2 mm × 1 mm block obtained from the global (inner, GL) layer and the orbital (outer, OL) of inferior rectus muscle was freshly cut and fixed in 2% glutaraldehyde, postfixed with 1.3% osmium tetroxide and embedded in an epoxy-based resin. Semi thin sections stained with Methylene blue-Azure II were used for screening and selection. Ultrathin sections were stained with uranyl acetate and lead citrate. The tissue was then examined with a transmission electron microscope (EM 109; Carl Zeiss, Thornwood, NY, USA).
Confocal Measurement of Myofiber Diameter
Mitotracker Green® staining and confocal imaging was used to measure the thickness (diameter) of the myofibers in all the normal and hyperthyroid EOMs. For each 3-D stack, X-Z slices through the data set were generated every 20 μm along the Y-plane for a total of 20 images. Using the LSM image software, the diameter of ten myofibers was then measured in each X-Z slice and an averaged calculated and recorded for each myofiber. The average of the ten myofibers for each muscle was then calculated and recorded as representative of each mouse. The average and standard error of mean (SEM) of five muscles from five different mice was taken as representative of the myofiber diameter of the EOM.
Measurement of Inferior Rectus Muscle Myofiber Cross-Sectional Area
In order to evaluate the changes in the myofiber thickness of the inferior rectus muscle, we measured the cross-sectional area of myofibers immunostained with Troponin T. Ten cross-sectional tissue sections from each inferior rectus muscle of five normal and five hyperthyroid mice were digitally imaged. For each image, 10 randomly selected myofibers from both the OL and GL were outlined using Metamorph 7.0 (Molecular Devices, Sunnyvale, CA, USA) and the area calculated. The average for each region in each tissue section was then determined and the average for all sections for each group calculated and recorded.
Statistical Analysis
Data was statistically analyzed by a non-parametric t-test using Graphpad prism™ 3.0 version statistics program (Graphpad Software Inc., San Diego, CA, USA). Data is presented as mean ± SEM. P values < 0.05 were considered statistically significant.
Results
Extraocular Muscles Changes
Evaluating the intensity of MitoTracker® Green staining to illustrate the size and/or number of mitochondria along the myofibers, we observed a marked increase in the intensity of stain in the inferior rectus muscle when hyperthyroidism was induced (Figure 1).This change was almost undetectable in the other rectus and limb muscles, suggesting that in mouse, the inferior rectus is the most affected muscle in hyperthyroidism.
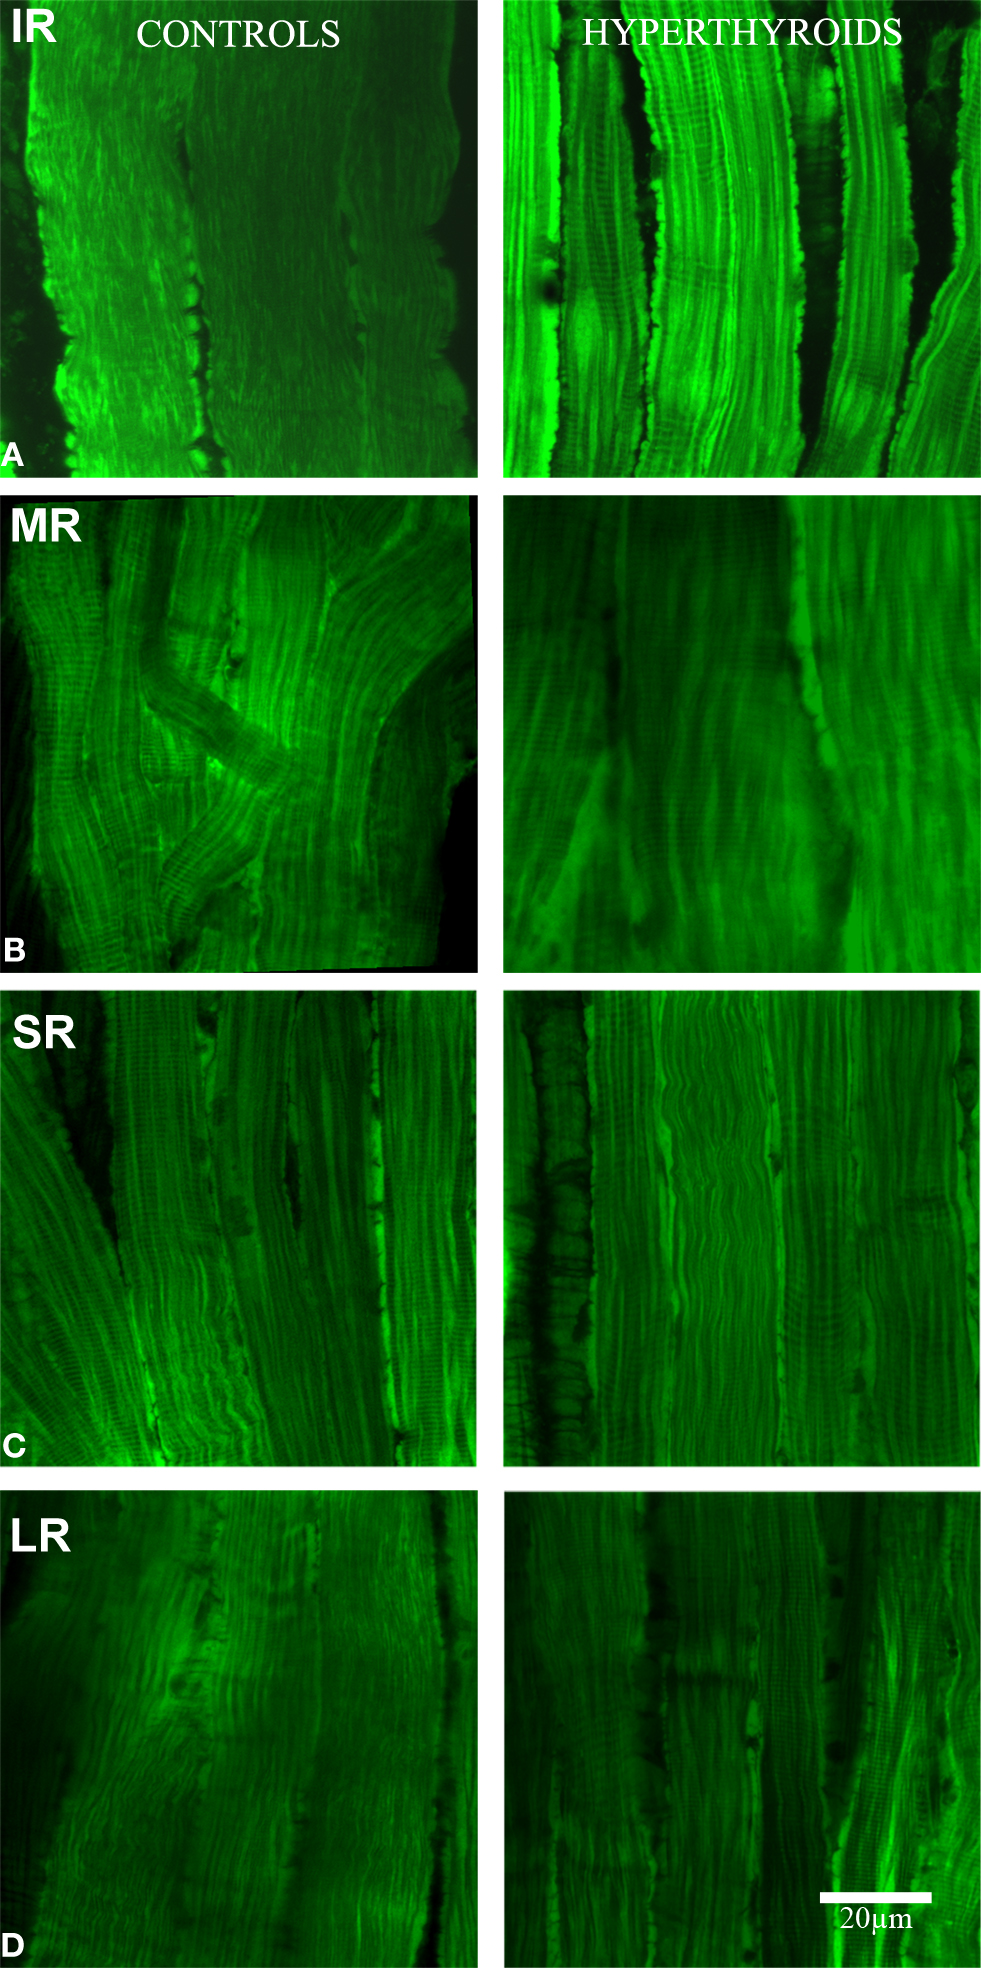
Figure 1. Longitudinal section. Confocal microscopy images showing the differences in MitoTracker® Green staining, concentrated by active mitochondria in normal (left column) and hyperthyroid (right column) rectus muscles (A: IR, inferior rectus; B: MR, medial rectus; C: SR, superior rectus, and D: LR, lateral rectus). Increased mitochondria activity in the inferior rectus of the hyperthyroid group was demonstrated by the increased staining. The pattern of distribution of MitoTracker® Green staining changed to a more concentrated and intense staining in the periphery of each myofiber and along the fiber compared to controls. Bar scale = 20 μm.
The most substantial change observed in the inferior rectus muscle was a significant decrease in size of 11.57 ± 5.31 μm from an average of 28.26 ± 7.2 μm in control muscles to 16.69 ± 1.89 μm in hyperthyroid muscles (p = 0.008) (Figures 2 and 3). In contrast, the medial rectus muscle showed a significant increase in size (averaging 10.17 ± 1.32 μm) from 22.34 ± 5.35 μm in control muscles to 32.51 ± 4.03 μm in hyperthyroid muscles (p = 0.009) while the thickness of myofibers in the superior rectus and lateral rectus increased slightly (4.18 ± 1.21 and 3.74 ± 0.79 μm respectively), from 21 ± 3.21 and 25.36 ± 4.92 μm respectively in control muscles compared to 25.18 ± 2 and 29.1 ± 5.71 μm respectively in hyperthyroid mice (p = 0.06) (Figure 3).
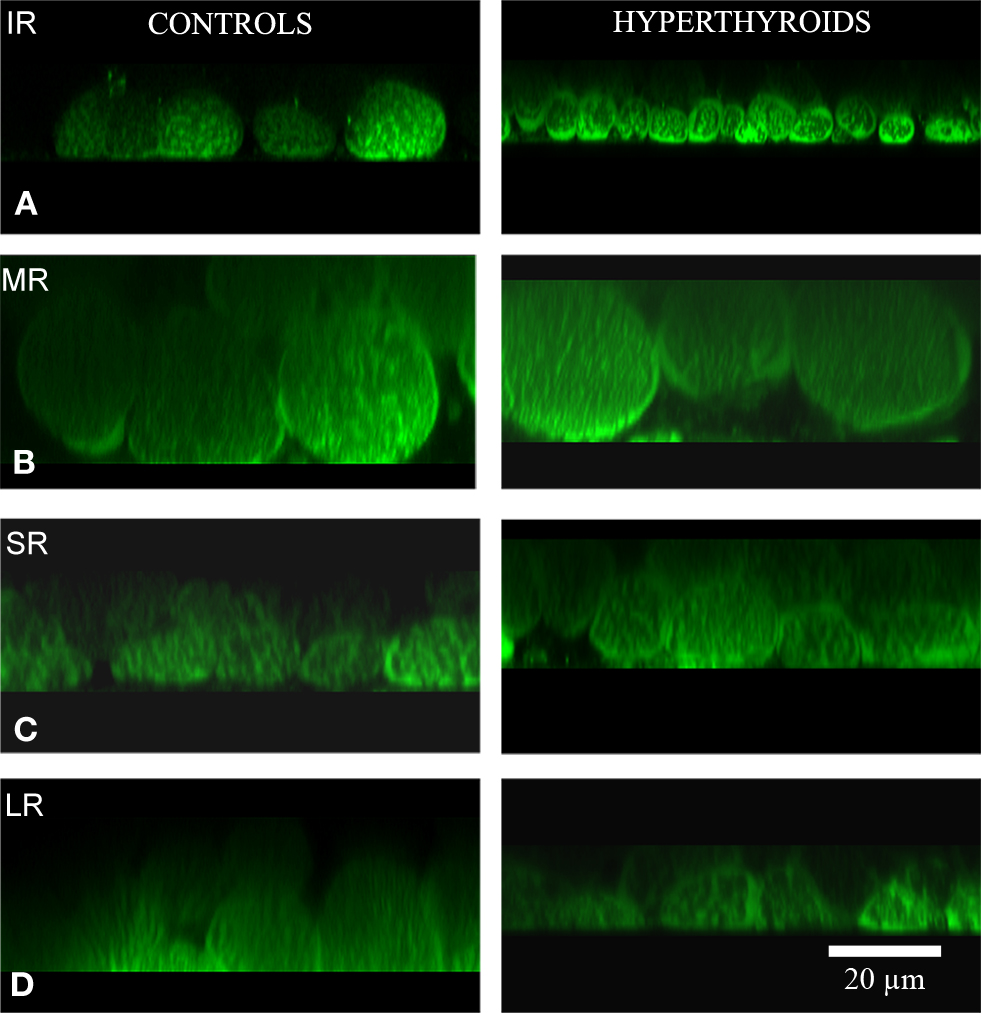
Figure 2. Cross-section. Confocal microscopy images showing the differences in MitoTracker® Green staining, concentrated by active mitochondria in normal (left column) and hyperthyroid (right column) rectus muscles (A: IR, inferior rectus; B: MR, medial rectus; C: SR, superior rectus; and D: LR, lateral rectus). Increased mitochondria activity in the inferior rectus of the hyperthyroid group was demonstrated by the increased staining. The pattern of distribution of MitoTracker® Green staining changed to a more concentrated and intense staining in the periphery of each myofiber and along the fiber compared to controls. Bar scale = 20 μm.
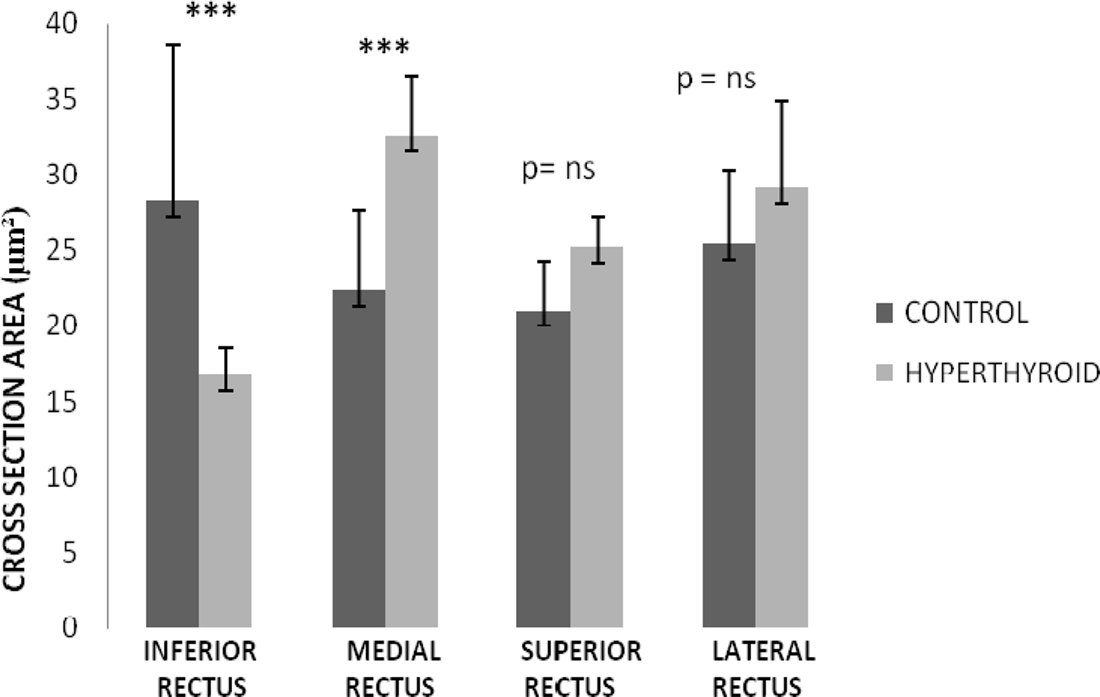
Figure 3. Rectus muscles diameter thickness in control and hyperthyroid group. Inferior rectus was the only rectus muscle that showed a significant decrease in the myofiber diameter. Medial rectus muscle changed to a thicker myofiber diameter. Superior and lateral rectus showed a mild increase in the diameter of the myofiber size; however, it was not significant. Number of rectus muscles from different animal in each group is 5 (***p < 0.001, ns, no significant).
OL and GL Changes in Inferior Rectus Muscle
Due to the differences noted in the inferior rectus, we further characterized these changes using immunohistochemistry. In control C57BL/6 mice, we found a significant difference in the distribution of Troponin T positive myofibers in the two regions. In the OL, we observed a significantly higher density of myofibers showing intense staining for Troponin T (56 ± 5.9% of the myofibers are Troponin T positive in this layer) while in GL, only 8 ± 2% of the myofibers were positive for Troponin T (Figure 4). By comparison, Troponin T staining showed a significant loss of positively staining myofibers in the OL in the hyperthyroid group.
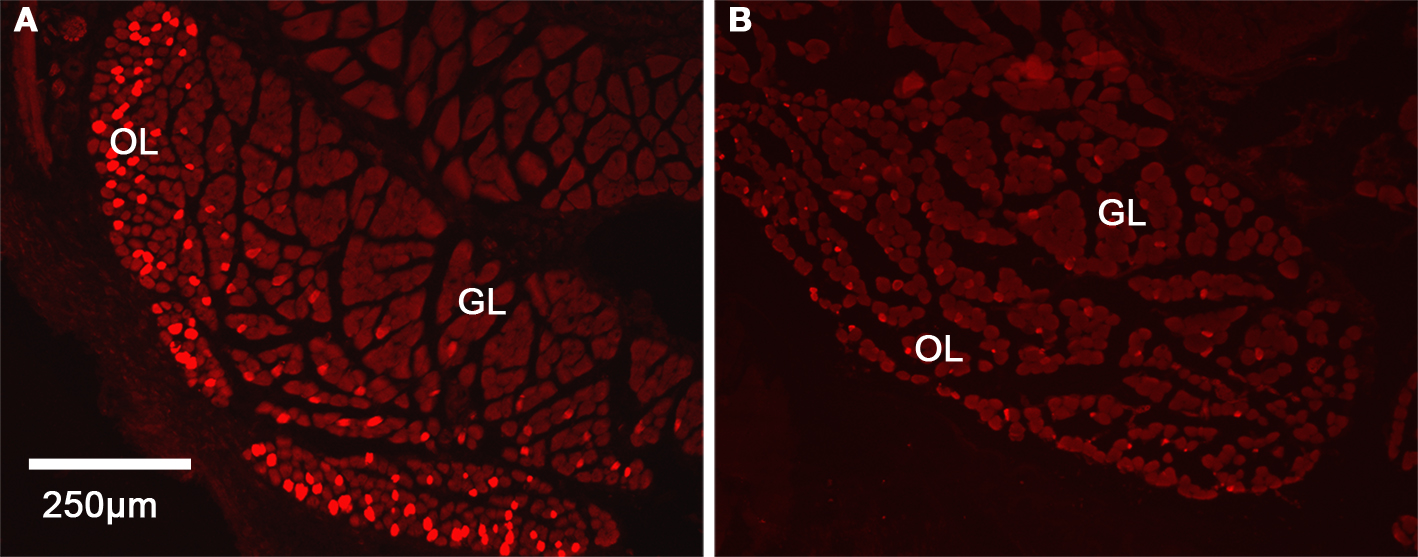
Figure 4. Distribution of Troponin T in the inferior rectus muscle in control and hyperthyroid mice. Cross-section of inferior rectus muscle showing the higher expression of Troponin T in the OL in controls (A) while in hyperthyroid inferior rectus, we observed a loss of differentiation between the two layers (B). Red indicates Troponin T inmunostaining, OL, orbital layer; GL, global layer.
In controls, the cross-sectional area of myofibers in the OL of the inferior rectus muscle averaged 113.2 ± 3.66 μm2. In contrast, the cross-sectional area of myofibers in the GL were significantly larger (p = 0.001) averaging 411 ± 13.84 μm2 (Figure 5). In hyperthyroid mice, we observed the fiber cross-sectional area to increase in the OL to 205.9 ± 5.3 μm2 and decreased in the GL to 271.7 ± 7.5 μm2 (Figure 5). While both groups still remained significantly different (p = 0.001) we observed a generalized reduction in size of this structure (Figure 5).
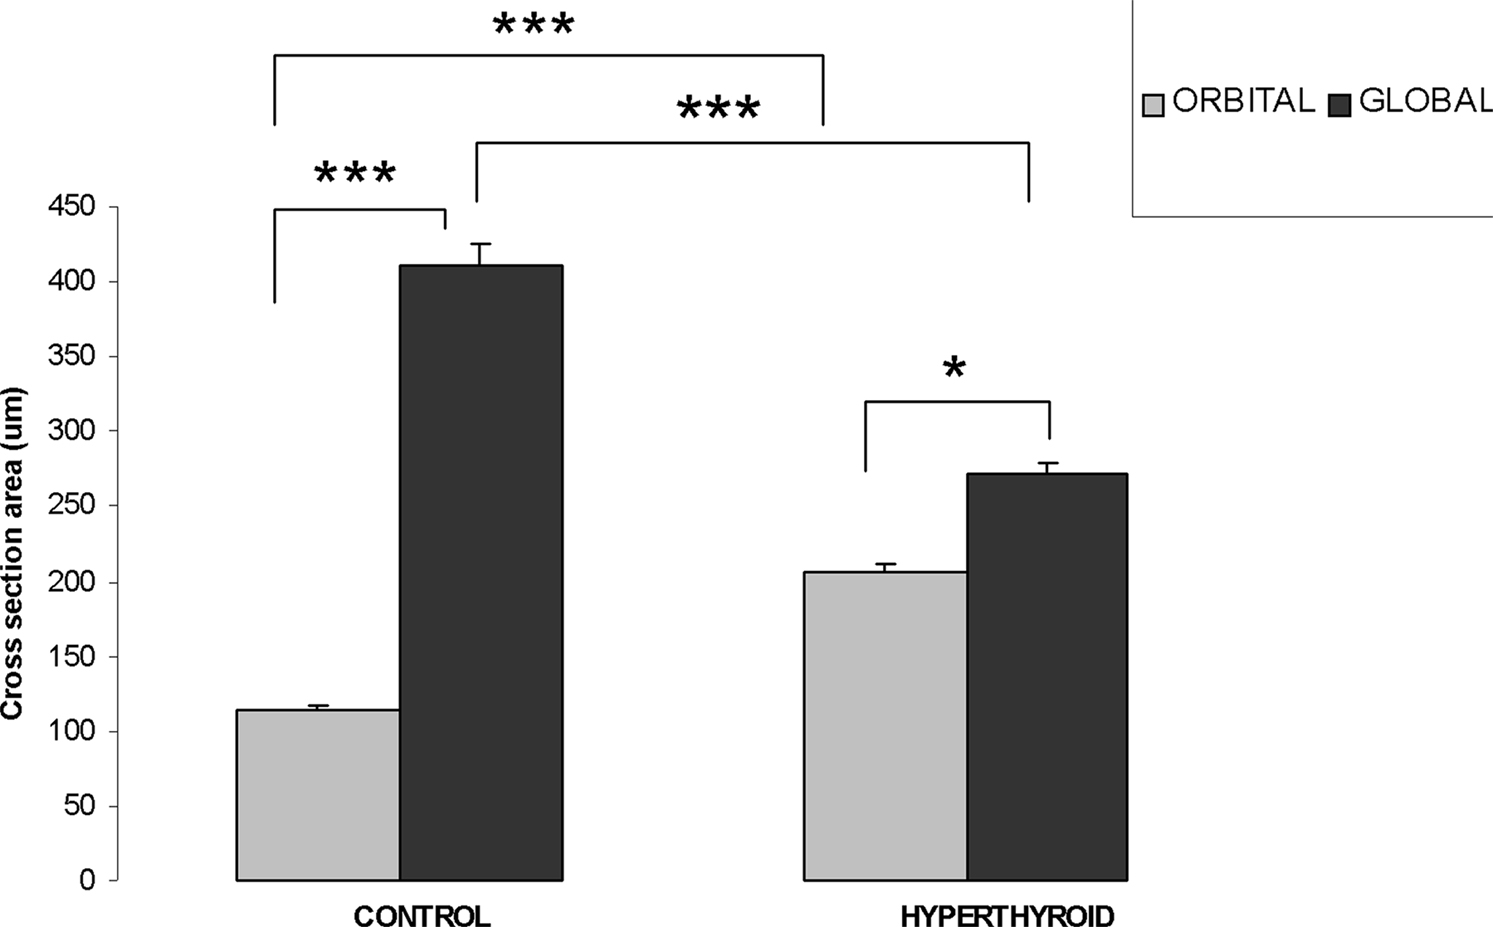
Figure 5. Orbital layer and global layer myofiber thickness changes (measured by cross-section area) in control and hyperthyroid mouse. In the inferior rectus of control mice, OL has thinner myofiber size compared to GL myofibers. In hyperthyroid mice, OL increased in size while GL decreased in size, but the difference remained significant (***p < 0.001, *p < 0.05).
Electron Microscopy
In the normal inferior rectus muscle of mice the GL and OL myofiber sarcomere pattern was intact. From the selected EM samples we studied, there were no significant ultrastructural differences seen in the OL or GL layers of the inferior rectus muscles. The mitochondria were of normal size, shape, evenly distributed and stacked. In contrast, the hyperthyroid EOM showed abnormal, elongated mitochondria with vacuoles and disrupted cristae. Another distinct feature seen was a sub-sarcolemmal migration of the mitochondria. Apparently normal mitochondria were observed in other zones along the same myofiber (Figure 6).
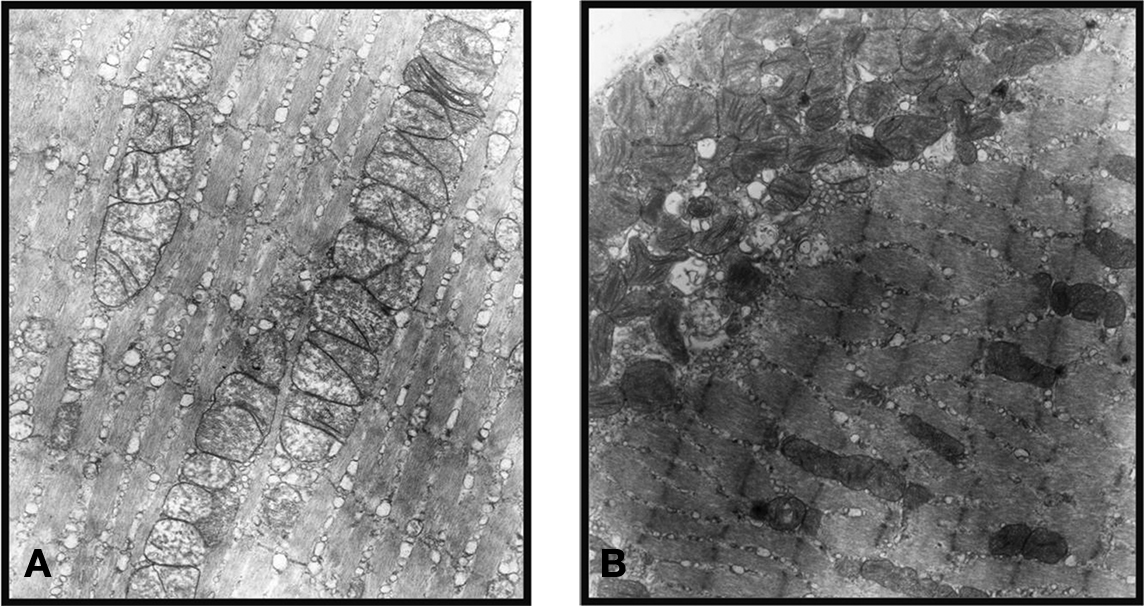
Figure 6. Normal EOM shows an intact sarcomere pattern and mitochondria of normal size, shape, evenly distributed, and stacked (A), while the hyperthyroid EOM shows abnormal, elongated mitochondria with disrupted cristae and sub-sarcolemmal migration (B). (These representative ultrastructural pictures were obtained from the inner global layer (GL) of the inferior rectus muscle. Magnification: ×19500).
Discussion
The present study showed that hyperthyroidism resulted in structural changes in the laminar organization of the rectus muscles, especially the inferior rectus muscle. The OL of C57BL/6 mice contain smaller diameter muscle fibers that stain more predominantly for Troponin T compared to GL muscle fibers. In the hyperthyroid state, these findings were reversed.
In normal mice, we could distinguish two laminar layers that correspond to the orbital and global layers described in other species as rabbit, rat, monkeys, and humans. Our results resembled previous studies (Durston, 1974; Spencer and Porter, 1988; Porter et al., 1995; Oh et al., 2001b) confirming the consistency across species. The OL contains small diameter myofibers compared to the GL which contains larger-diameter myofibers which presumably play distinct functions. It is known that approximately 80% of myofibers in the OL are fast, singly innervated myofibers similar to mammalian skeletal muscle myofibers, whereas 20% are multiply innervated myofibers. Orbital singly innervated myofibers are specialized for intense oxidative metabolism and fatigue resistance and may provide most of the force required of the OL to maintain tension in the “pulley system.” Approximately 90% of myofibers in the GL are fast, singly innervated myofibers, whereas 10% are slow, multiply innervated myofibers (Oh et al., 2001b).
Other remarkable differences between the OL and GL include their vascular content, metabolic activity, response to botulinum toxin and a layer-specific differential expression and protein level of myosin heavy chain 3 (MYH3), α-cardiac myosin heavy chain 6 (MYH6), Troponin T, Actinin α3 among other proteins (Budak et al., 2004). Some authors have demonstrated high expression of Troponin T in the OL, 31 times that found in rat GL (Budak et al., 2004).
Based on these findings, we used anti-rabbit Troponin T to help us to discriminate the two layers in mouse, confirming in our study that these two layers differ in the Troponin T distribution; we observed a high density Troponin T positive myofibers in the OL compared to the GL, establishing that Troponin T distribution are similar in mice and rats as we expected. After confirming this difference in normal mice, we moved to describe the changes to the laminar layer in the hyperthyroid mouse.
In hyperthyroid mouse, we showed a decrease in the diameter of the inferior rectus muscles, increase diameter of the myofiber in the medial rectus, but no significant changes in the diameter of the lateral rectus and superior rectus muscle. The inferior rectus was the only muscle that showed an overall decrease in size. Specifically orbital myofibers increased in size but the bulk of the muscle which is comprised of the global layer showed a marked decrease in myofiber size. Possible mechanisms involved may be proteolysis induced by the hyperthyroidism, previously demonstrated in a rat model (Angeras and Hasselgren, 1985) secondary to elevated levels of thyroid hormone and circulating catecholamines. There is evidence suggesting that T3 induces myofiber apoptosis at least in primary cultured muscle cells (Nakashima et al., 1998). These studies demonstrate the catabolic nature of elevated thyroid hormone. However, we did not perform any myofiber apoptosis assays on our muscle samples. An increase in thyroid hormone levels directly alters the energy metabolism of muscles, but in a muscle-specific manner (Harrison and McLoon, 2002). In addition, these authors (Harrison and McLoon, 2002) have shown that the orbicularis oculi muscle in the palpebral portion of the eyelids from hyperthyroid rabbits have significantly fewer myofibers compared with control eyelids, predominantly in the preseptal region. Also in agreement with our data, recently, (Harrison et al., 2010) showed that EOMs from rabbits with high levels of thyroid hormone were reduced in size, have altered populations of satellite regenerative cells as well as altered expression of myosin heavy chain isoforms in populations of myofibers in the EOMs. However, the alterations of muscle size were uniform among the four rectus muscles. Our results showed a predominant change in the inferior and medial rectus muscles size with no significant changes in the lateral and superior rectus. These differences in selective vs. uniform EOM involvement in different studies may be partially explained by the different animal models used in studies (rabbit vs. mice) and further animal studies might help in elucidating the pathogenesis of these differences. Furthermore, the changes in the affected muscles go along with a more intense stain of MitoTracker® Green, suggesting an increase mitochondrial activity. Taken together, we propose that hyperthyroidism may have varying effects in the different EOMs due to differences in the expressed thyroid hormone receptors. Further studies are needed to address why different EOMs show different susceptibility.
It is intriguing the loss of Troponin T phenotypic distribution when hyperthyroidism was induced. The complex nature of the compartmentalized layers of the EOMs has been suggested to provide different functions for each layer. In this context, the differential expression of Troponin T between the OL and GL may be linked to different functions. More experiments are needed to elucidate this association and whether Troponin T plays a role as a target of T3. If so, are Troponin T fibers a protective or survivor phenotype when hyperthyroidism is induced?
In this study, we used a pure hyperthyroid mouse model (C57BL/6) similar to the hyperthyroid rat model that used intraperitoneal injections of T3 in adult Sprague-Dawley rats (Postler et al., 2009). In their study, Postler et al. used gene expression profiles from pooled extraocular muscles but we separated the individual muscles to study the differences in structural, laminar, and mitochondrial abnormalities in the extraocular muscles. It is to be noted that, we did not use the autoimmune experimental models that simulate and reproduce some of the features of Graves’ disease and thyroid associated ophthalmopathy seen clinically in humans. These have been previously described using the thyrotropin (TSH) receptor preparations (Costagliola et al., 2000; Barrett et al., 2004; Misharin et al., 2009). As little is known about the direct effects of elevated levels of thyroid hormone on the extraocular muscles, we wanted to document some basic structural and functional alterations in the extraocular muscles as a result of hyperthyroidism. Thus, our results may not simulate or mimic changes those seen in Graves’ disease or thyroid associated ophthalmopathy that is commonly attributed to antibodies directed against TSH receptor, which is expressed in both thyroid and orbital tissue, resulting in extraocular muscle abnormalities and dysfunction.
It is evident from our study that hyperthyroidism in our experimental mouse model causes changes in the EOMs. The significant changes seen in the inferior rectus muscle are in the troponin expression of the orbital and global layers of the EOM associated with mitochondrial alterations. This and future experimental studies may help in identifying the pathogenesis of preferential involvement of some muscles, laminar differences, and ultrastructural abnormalities in the EOMs in hyperthyroidism.
Conflict of Interest Statement
The authors declare that the research was conducted in the absence of any commercial or financial relationships that could be construed as a potential conflict of interest.
Acknowledgments
The authors thank Dr. Tejvir S. Khurana, Ph.D. and his laboratory for teaching (Swaraj Bose) the technique of orbital exenterations in the mouse, Dr. Donald Brown, Ph.D., for providing helpful discussions over this work, Larry Lam and Andrew J. Wahlert for excellent assistance with confocal microscopy and data analysis. Grant Support: NIH: EY016663, Research to Prevent Blindness, Inc. and Fight For Sight. This study was presented at the 17th International Neuro-Ophthalmology Society meeting, 7–12 June 2008, Napa, California and ARVO 2005, Ft. Lauderdale, FL, USA.
References
Angeras, U., and Hasselgren, P. O. (1985). Protein turnover in different types of skeletal muscle during experimental hyperthyroidism in rats. Acta Endocrinol. 109, 90–95.
Barrett, K., Liakata, E., Rao, P. V., Watson, P. F., Weetman, A. P., Lymberi, P., Banga, J. P., and Carayanniotis, G. (2004). Induction of hyperthyroidism in mice by intradermal immunization with DNA encoding the thyrotropin receptor. Clin. Exp. Immunol. 136, 413–422.
Bednarek, J., Wysocki, H., and Sowinski, J. (2004). Oxidation products and antioxidant markers in plasma of patients with Graves’ disease and toxic multinodular goiter: effect of methimazole treatment. Free Radic. Res. 38, 659–664.
Budak, M. T., Bogdanovich, S., Wiesen, M. H., Lozynska, O., Khurana, T. S., and Rubinstein, N. A. (2004). Layer-specific differences of gene expression in extraocular muscles identified by laser-capture microscopy. Physiol. Genomics 20, 55–65.
Costagliola, S., Many, M. C., Denef, J. F., Pohlenz, J., Refetoff, S., and Vassart, G. (2000). Genetic immunization of outbred mice with thyrotropin receptor cDNA provides a model of Graves’ disease. J. Clin. Invest. 105, 803–811.
Demer, J. L., Oh, S. Y., and Poukens, V. (2000). Evidence for active control of rectus extraocular muscle pulleys. Invest. Ophthalmol. Vis. Sci. 41, 1280–1290.
Durston, J. H. (1974). Histochemistry of primate extraocular muscles and the changes of denervation. Br. J. Ophthalmol. 58, 193–216.
Farah, C. S., and Reinach, F. C. (1995). The troponin complex and regulation of muscle contraction. FASEB J. 9, 755–767.
Harrison, A. R., Lee, M. S., and McLoon, L. K. (2010). Effects of elevated thyroid hormone on adult rabbit extraocular muscles. Invest. Ophthalmol. Vis. Sci. 51, 183–191.
Harrison, A. R., and McLoon, L. K. (2002). Effect of hyperthyroidism on the orbicularis oculi muscle in rabbits. Ophthal. Plast. Reconstr. Surg. 18, 289–294.
Hulbert, A. J. (2000). Thyroid hormones and their effects: a new perspective. Biol. Rev. Camb. Philos. Soc. 75, 519–631.
Kono, R., Clark, R. A., and Demer, J. L. (2002). Active pulleys: magnetic resonance imaging of rectus muscle paths in tertiary gazes. Invest. Ophthalmol. Vis. Sci. 43, 2179–2188.
Lucas, C. A., and Hoh, J. F. (2003). Distribution of developmental myosin heavy chains in adult rabbit extraocular muscle: identification of a novel embryonic isoform absent in fetal limb. Invest. Ophthalmol. Vis. Sci. 44, 2450–2456.
Miller, J. M. (2007). Understanding and misunderstanding extraocular muscle pulleys. J. Vis. 7, 11–15.
Misharin, A. V., Nagayama, Y., Aliesky, H. A., Mitzutori, Y., Rappaport, B., and MaLachlan, S. M. (2009). Attenuation of induced hyperthyroidism in mice by pretreatment with thyrotropin receptor protein: deviation of thyroid-stimulating to nonfunctional antibodies. Endocrinology 150, 3944–3952.
Mogulkoc, R., Baltaci, A. K., Oztekin, E., Sivrikaya, A., and Aydin, L. (2006). Effects of hyperthyroidism induced by L-thyroxin administration on lipid peroxidation in various rat tissues. Acta. Biol. Hung. 57, 157–163.
Nakashima, K., Ohtsuka, A., and Hayashi, K. (1998). Comparison of the effects of thyroxine and triiodothyronine on protein turnover and apoptosis in primary chick muscle cell cultures. Biochem. Biophys. Res. Commun. 251, 442–448.
Oh, S. Y., Poukens, V., Cohen, M. S., and Demer, J. L. (2001a). Structure-function correlation of laminar vascularity in human rectus extraocular muscles. Invest. Ophthalmol. Vis. Sci. 42, 17–22.
Oh, S. Y., Poukens, V., and Demer, J. L. (2001b). Quantitative analysis of rectus extraocular muscle layers in monkey and humans. Invest. Ophthalmol. Vis. Sci. 42, 10–16.
Porter, J. D., Baker, R. S., Ragusa, R. J., and Brueckner, J. K. (1995). Extraocular muscles: basic and clinical aspects of structure and function. Surv. Ophthalmol. 39, 451–484.
Postler, T. S., Budak, M. T., Khurana, T. S., and Rubinstein, N. A. (2009). Influence of hyperthyroid conditions on gene expression in extraocular muscles of rats. Physiol. Genomics 37, 231–238.
Spencer, R. F., and Porter, J. D. (1988). Structural organization of the extraocular muscles. Rev. Oculomot. Res. 2, 33–79.
Squire, J. M., and Morris, E. P. (1998). A new look at thin filament regulation in vertebrate skeletal muscle. FASEB J. 12, 761–771.
Wasicky, R., Ziya-Ghazvini, F., Blumer, R., Lukas, J. R., and Mayr, R. (2000). Muscle fiber types of human extraocular muscles: a histochemical and immunohistochemical study. Invest. Ophthalmol. Vis. Sci. 41, 980–990.
Wicke, W., Wasicky, R., Brugger, P. C., Kaminski, S., and Lukas, J. R. (2007). Histochemical and immunohistochemical study on muscle fibers in human extraocular muscle spindles. Exp. Eye Res. 84, 670–679.
Keywords: hyperthyroid mice, orbital layer, global layer, extraocular muscles, inferior rectus, Troponin T, mitochondria
Citation: Nien CJy, Jester JV., and Bose S (2010) Effects of hyperthyroidism on the rectus muscles in mice. Front. Neur. 1:143. doi:10.3389/fneur.2010.00143
Received: 12 September 2010;
Accepted: 20 October 2010;
Published online: 11 November 2010.
Edited by:
Hana Leiba, Kaplan Medical Center, IsraelReviewed by:
Hana Leiba, Kaplan Medical Center, IsraelNitza Goldenberg-Cohen, Felsenstein Medical Research Center, Israel
Copyright: © 2010 Nien, Jester and Bose. This is an open-access article subject to an exclusive license agreement between the authors and the Frontiers Research Foundation, which permits unrestricted use, distribution, and reproduction in any medium, provided the original authors and source are credited.
*Correspondence: Swaraj Bose, Gavin Herbert Eye Institute, University of California Irvine, 118 Med Surge I, Irvine, CA 92697, USA. e-mail: sbose@uci.edu
