
94% of researchers rate our articles as excellent or good
Learn more about the work of our research integrity team to safeguard the quality of each article we publish.
Find out more
ORIGINAL RESEARCH article
Front. Neuroinform., 19 June 2023
Volume 17 - 2023 | https://doi.org/10.3389/fninf.2023.1169584
This article is part of the Research TopicAdvanced EEG Analysis Techniques for Neurological DisordersView all 8 articles
 Pawel Glaba1
 Miroslaw Latka1*
 Małgorzata J. Krause2Sławomir Kroczka3Marta Kuryło2
 Magdalena Kaczorowska-Frontczak4Wojciech Walas5Wojciech Jernajczyk6Tadeusz Sebzda7
 Bruce J. West8
Absence seizures—generalized rhythmic spike-and-wave discharges (SWDs) are the defining property of childhood (CAE) and juvenile (JAE) absence epilepsies. Such seizures are the most compelling examples of pathological neuronal hypersynchrony. All the absence detection algorithms proposed so far have been derived from the properties of individual SWDs. In this work, we investigate EEG phase synchronization in patients with CAE/JAE and healthy subjects to explore the possibility of using the wavelet phase synchronization index to detect seizures and quantify their disorganization (fragmentation). The overlap of the ictal and interictal probability density functions was high enough to preclude effective seizure detection based solely on changes in EEG synchronization. We used a machine learning classifier with the phase synchronization index (calculated for 1 s data segments with 0.5 s overlap) and the normalized amplitude as features to detect generalized SWDs. Using 19 channels (10-20 setup), we identified 99.2% of absences. However, the overlap of the segments classified as ictal with seizures was only 83%. The analysis showed that seizures were disorganized in approximately half of the 65 subjects. On average, generalized SWDs lasted about 80% of the duration of abnormal EEG activity. The disruption of the ictal rhythm can manifest itself as the disappearance of epileptic spikes (with high-amplitude delta waves persisting), transient cessation of epileptic discharges, or loss of global synchronization. The detector can analyze a real-time data stream. Its performance is good for a six-channel setup (Fp1, Fp2, F7, F8, O1, O2), which can be implemented as an unobtrusive EEG headband. False detections are rare for controls and young adults (0.03% and 0.02%, respectively). In patients, they are more frequent (0.5%), but in approximately 82% cases, classification errors are caused by short epileptiform discharges. Most importantly, the proposed detector can be applied to parts of EEG with abnormal EEG activity to quantitatively determine seizure fragmentation. This property is important because a previous study reported that the probability of disorganized discharges is eight times higher in JAE than in CAE. Future research must establish whether seizure properties (frequency, length, fragmentation, etc.) and clinical characteristics can help distinguish CAE and JAE.
Idiopathic generalized epilepsies (IGEs) are a subgroup of genetic generalized epilepsies (GGEs), composed of four syndromes: childhood absence epilepsy (CAE), juvenile absence epilepsy (JAE), juvenile myoclonic epilepsy (JME), and epilepsy with generalized tonic-clonic seizures alone (GTCA) (Hirsch et al., 2022). Absence seizures—generalized rhythmic (2.5–5.5 Hz) spike-and-wave discharges are the defining property of CAE and JAE. They can also be observed in about 33% of patients with JME.
CAE starts in otherwise normal children between 4 and 10 years of age and is more common in girls (60 to 75% of cases). It accounts for approximately 18% of epilepsy in school-aged children. Typical absence seizures begin suddenly and, in most children, lead to a deep loss of awareness and interruption of previously conducted activity. Seizures can be accompanied by staring, loss of facial expression, oral/manual automatism, blinking, or eye opening. Return to regular activity seems immediate, although children may initially be confused as they reorient themselves. The duration of seizures, which can occur multiple times a day, typically varies between 3 and 20 s, with a median of 10 s. CAE relapses in early adolescence in 60% of patients. In the rest, the disease can evolve into other IGE syndromes.
JAE is less common than CAE, accounting for 2.4–3.1% of new-onset epilepsy in children and adolescents, with a nearly equal distribution between men and women. However, it may be underdiagnosed as absences are less frequent (less than daily) and more subtle (less complete impairment of awareness). The age of onset is 12 ± 3 years (Asadi-Pooya et al., 2013). The ictal EEG is similar in CAE and JAE. However, disorganized (fragmented) discharges, defined as brief (<1 s) and transient interruptions in the ictal rhythm, are eight times more frequent in JAE (Sadleir et al., 2009). In most patients with JAE, lifelong seizure control pharmacotherapy is required.
The diagnosis of IGE requires the analysis of long video EEGs (on average about 30 min long) to detect seizures, their clinical manifestations (consciousness impairment, motor symptoms) and abnormal features in the interictal EEG. The 2010 Childhood Absence Epilepsy Study (Glauser et al., 2013) showed that after 1 year, the initial seizure-control pharmacotherapy was effective only in 37% of patients with CAE and JAE. Therefore, follow-up EEG recordings are necessary to ensure treatment efficacy and minimize potential side effects. It should be noted that parents notice only a small fraction (approximately 6%) of absences (Keilson et al., 1987), the estimate corroborated by a more recent study (Akman et al., 2009).
Low-cost portable EEG devices connected to the Internet (Krigolson et al., 2017) can be instrumental in personalizing pediatric epilepsy management. Children and adolescents may be more willing to tolerate regular EEG measurements if incorporated into daily routines, such as watching cartoons, playing mobile games, or listening to music. The potential benefits of remote long-term EEG monitoring include facilitation of diagnosis, personalized drug titration, and determining the duration of pharmacotherapy. Consequently, there is a strong demand for fast and accurate computer seizure detection that can be used on devices with as few EEG channels as possible. Global synchronization is the most conspicuous property of EEG dynamics during absence seizure. However, all the absence detection algorithms proposed so far (Adeli et al., 2003; Subasi, 2007; Sitnikova et al., 2009; Ovchinnikov et al., 2010; Xanthopoulos et al., 2010; Petersen et al., 2011; Duun-Henriksen et al., 2012; Bauquier et al., 2015; Zeng et al., 2016; Grubov et al., 2017; Kjaer et al., 2017; Tenneti and Vaidyanathan, 2018; Dan et al., 2020; Glaba et al., 2021; Japaridze et al., 2022) exploit only the properties of SWD complexes. In this work, we investigate EEG phase synchronization in patients with CAE/JAE and healthy subjects to explore the possibility of using the phase synchronization index to detect seizures and characterize their disorganization. The qualitative assessment of absence fragmentation could be used to discriminate between CAE and JAE, an important clinical problem.
The data set used in our previous study (Glaba et al., 2021) was slightly modified and expanded by routine EEG of healthy young adults (12 women and 7 men, mean age 22 years, range 20–24 years). For these adults, the EEG was recorded for 8 min, the first half in closed eyes and the second in open eyes condition. The recordings were made with Elmiko Digitrack (BRAINTRONICS B.V. ISO-1032CE amplifier, 250 Hz sampling frequency, impedance below 5k Ω). The ethics committee of the Warsaw Institute of Psychiatry and Neurology approved the reanalysis of the data. Subjects gave their informed consent.
The ethics committee of Wroclaw Medical University approved a retrospective analysis of routine anonymized video EEG recordings of patients (36 with CAE and 29 with JAE) as well as 30 EEGs of controls of the same age (Glaba et al., 2021). Epilepsy syndrome was established based on age of onset, the properties of the first video-EEG, and neuroimaging. Consequently, diagnosis should be considered as preliminary. EEGs were acquired with Elmiko Digitrack (BRAINTRONICS B.V. ISO-1032CE amplifier) or Grass Comet Plus EEG (AS40-PLUS amplifier) using a sampling frequency of 200 or 250 Hz. The international 10-20 standard was used to arrange 19 Ag/AgCl electrodes (impedance below 5k Ω). The total duration of the EEG was equal to 37 and 9 h for the patients and controls, respectively.
All EEGs were acquired with the reference electrode mounted on the subject's forehead.
We used two filters for EEG preprocessing: a second-order infinite impulse response (IIR) and a 6th-order high-pass Butterworth with a cutoff frequency of 0.5 Hz. These filters remove 50-Hz power line noise and EEG baseline drift, respectively.
We quantify the EEG synchronization using a matrix made up of pairwise frequency-dependent synchronization coefficients γ(k, l) calculated for EEG channels k and l (k, l = 1..19). γ(k, l) can be defined with the help of the complex continuous wavelet transform (CWT) (Lachaux et al., 1999):
which is the convolution of the signal s(t) with wavelets ψ(a, t0). Such wavelets are generated from the mother function ψ by translation and scaling: ψ(a,t0) = ψ(t − t0/a) (Mallat, 1999). Motivated by the results of the previous study (Glaba et al., 2021), we used the complex Morlet wavelet (Addison, 2017, 2018):
whose Fourier transform is given by
The real parameter fc is called the center frequency, since it equals the maximum point of the wavelet's Fourier power spectrum. The scale a corresponds to the following pseudo-frequency:
The instantaneous phase of a signal s can be defined as
where i is an imaginary number. The distribution P[Δϕ(k, l)] of the phase difference Δϕ(k, l) = ϕk − ϕl can be used to characterize the synchronization between two EEG channels. A uniform distribution corresponds to the absence of synchronization (two signals are statistically independent). In contrast, a well-pronounced peak in the distribution is a manifestation of phase locking, which means that one time series tracks the dynamics of the other. The stability of the phase difference Δϕ is quantified with the index γ(k, l) (Quiroga et al., 2002; Latka et al., 2005)
The angle brackets in the above equation denote the temporal average of the phase-difference fluctuations. The synchronization index can have values between 0 and 1, and in the case of human EEG, it is frequency dependent. When the distribution of phase differences is uniform, the time averages of both trigonometric functions in Equation (6) are zero which in turn makes the synchronization index equal to zero. From the trigonometric identity, it follows that γ = 1 corresponds to perfect synchronization (phase locking of two EEG channels).
The average synchronization index γ is the average value of the non-diagonal elements of the synchronization matrix:
where SN denotes subsets of 10-20 channels. We calculate γ for all 19 channels (N = 19) and for three subsets (N < 19):
• S4 (Fp1, Fp2, T5, T6)
• S6 (Fp1, Fp2, F7, F8, O1, O2)
• S12 (Fp1, Fp2, F7, F8, F3, F4, P3, P4, T5, T6, O1, O2).
The electrode arrangement in the above subsets is similar, but not always identical, to the low-cost EEG headsets currently available on the market (Pu et al., 2021). The applicability of such headsets to home monitoring of pediatric patients was the main reason for testing different SN.
The channel synchronization index is defined as follows:
We calculate phase synchronization for 1-s intervals using a half-second overlap. We use the overlap to simulate live data stream analysis. For patients, there were 7,270 ictal and 266,653 interictal data segments. 1,540 windows partially overlapped absence seizures. The partitioning of the controls' EEG yielded 58,460 segments. For students, we obtained the 9,064 and 9,121 intervals for closed and open eyes, respectively.
The value of the synchronization index γ depends on the center frequency of the Morlet wavelet fc and the pseudofrequency fa. We use a grid search to determine optimal values for absence detection. In particular, we search for fc and fa that maximize the difference between ictal and interictal synchronization.
We would like to emphasize that the synchronization properties depend on the choice of reference electrode (Dominguez et al., 2005).
In this work, we used short EEG data segments. Consequently, when calculating the CWT with the help of a fast Fourier transform, boundary effects must be considered.
Prominent SWD and global EEG synchronization are hallmarks of absence seizures (Figure 1). Therefore, we decided to detect seizures using the normalized amplitude of the EEG and the synchronization index γm as machine learning features. The former is defined as
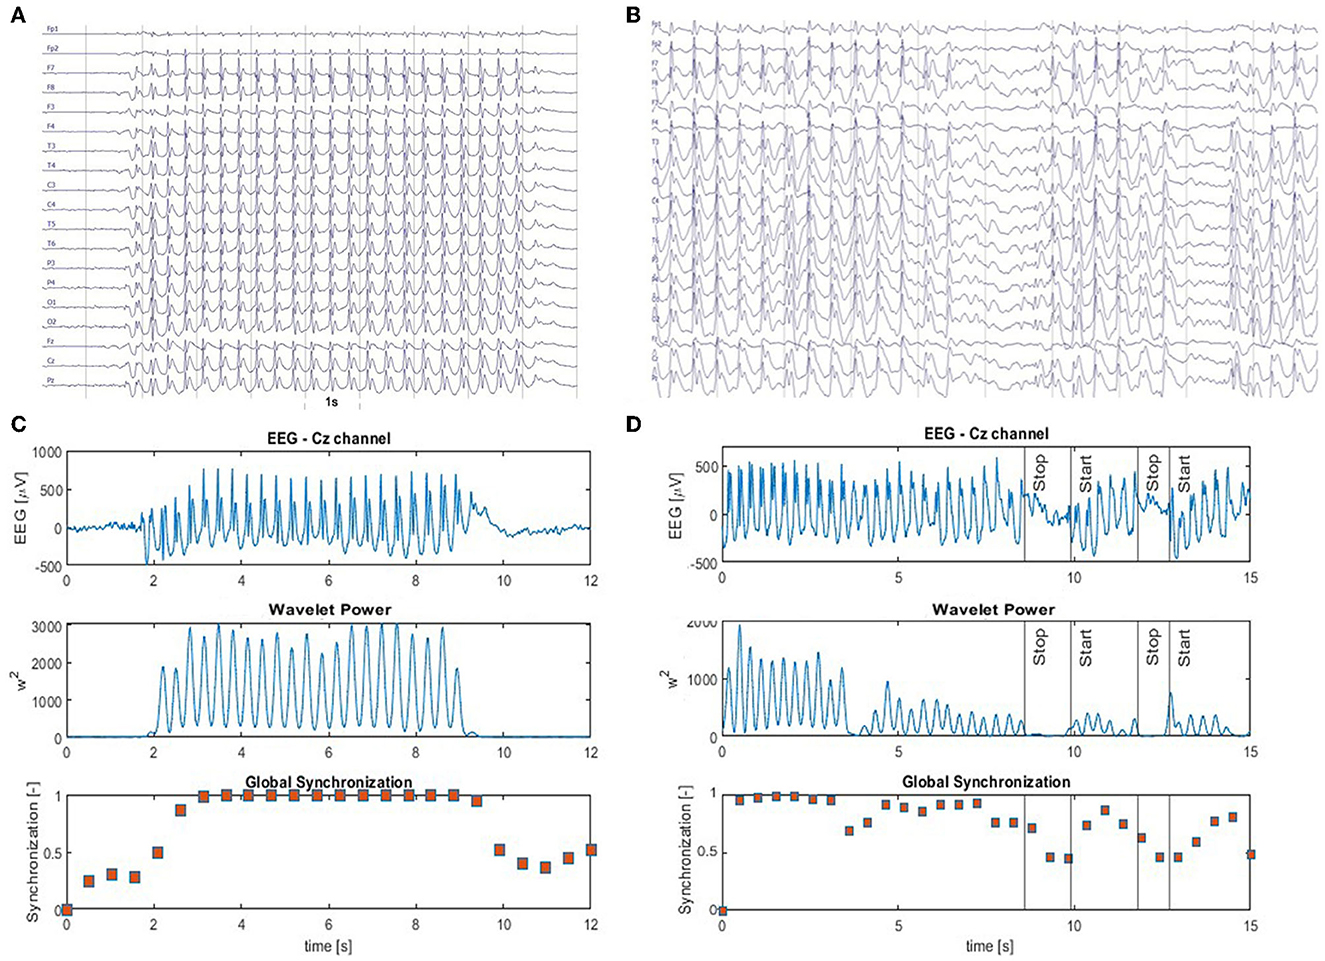
Figure 1. (A) Archetype of high-amplitude, continuous generalized spike and wave discharges with prominent epileptic spikes. The absence seizure in (B) is briefly interrupted two times. Panels (C, D) show the EEG from Cz channel (top panel) as well as the corresponding time series of the wavelet power (middle panel) and the global synchronization index (bottom panel). The wavelet power and synchronization index were calculated using fc = 1 Hz and fa = 12 Hz. These case studies demonstrate that global synchronization decreases when epileptic activity subsides.
where Am is the average absolute value of the EEG signal in segment m (we average across all channels). Aref is the mean absolute value calculated for the 30 s segment taken from the interictal beginning of the EEG recording. Normalization by Aref was necessary because the amplitude of EEG in children can decrease significantly with age and depends on the impedance of the electrodes.
We use the k-nearest neighbor (k-NN) classifier implemented in Matlab R2022a (MATLAB, 2022) Machine Learning Toolbox for absence detection. We accept the default values of the model parameters (10 neighbors, the Euclidean distance, data point scaling, and no weighting function). We employ leave-one-out cross-validation (LOOCV)—the number of folds equals the number of patients (65). For each patient, k-NN is built using the features extracted from the other 64 patients and applied to their segmented EEG (1 s windows with 0.5 s overlap). We prepare the training set as follows. We select only those ictal windows whose mean γ is greater than a threshold determined from the interictal synchronization distribution. In particular, for this threshold, 95% of interictal segments have a smaller mean γ. We disregard all data windows that partially overlap absence seizures. The sets of ictal and interictal segments are highly unbalanced (7,270 vs. 266,653). Therefore, we randomly select only a small fraction of the interictal segments for the training set. We use the 1:3 ratio of the ictal and interictal windows.
We evaluated the performance of the detector in the same way as in our previous article (Glaba et al., 2021) using the relative overlap (OVR) of segments classified as ictal with absence seizures and relative duration of false positives (PERR). During the PERR computation, we apply the logical OR function to determine the status of the common part of two consecutive EEG data segments. In other words, the common part is ictal if any segment is ictal. We also report the number of false positives (FP) and the number of different trains of misclassified segments (MT).
Supplementary Figure 1 elucidates the relationship between the number of erroneously classified EEG segments and PERR. For overlapping segments, this relationship can sometimes be counterintuitive.
Short (<2 s) epileptiform discharges, quite common in patients with CAE/JAE, usually do not produce clinical manifestations (Szaflarski et al., 2010). Therefore, we also tested the possibility of reducing the number of false positives by post-processing the k-NN classification results. In particular, we labeled any isolated ictal segment as non-ictal. In other words, the shortest possible ictal interval can have a length of 1.5 s (two consecutive segments).
We apply the absence detector described in Section 2.3 (with the post-processing turned off) to the parts of the EEG marked by neurologists as abnormal activity. Then, we calculate the percentage overlap of the segments classified as ictal with the analyzed fragment. As before, the common part of the adjacent segments is considered ictal if at least one of the segments is ictal. Seizure fragmentation is defined as
When calculating γ, we used fc = 1 Hz and fa = 12 Hz. For these values, the percentage difference between ictal and interictal synchronization was highest (168%). In the same vein, we determined these parameters for each patient. The median values were similar: fc = 0.8 Hz and fa = 13 Hz. Supplementary Figures 2, 3 elucidate the determination of the wavelet parameters.
Figure 1A shows an archetypal absence seizure with continuous high-amplitude generalized SWDs. In contrast, the seizure in Figure 1B was briefly interrupted twice. For both absences, for the chosen fc and fa, the power |T|2 peaks at the location of epileptic spikes (Figures 1C, D). It is apparent that wavelet power and global synchronization are low when epileptic activity subsides. In Figure 2, we compare the ictal synchronization matrices calculated for the EEG segments presented in Figures 1A, B.
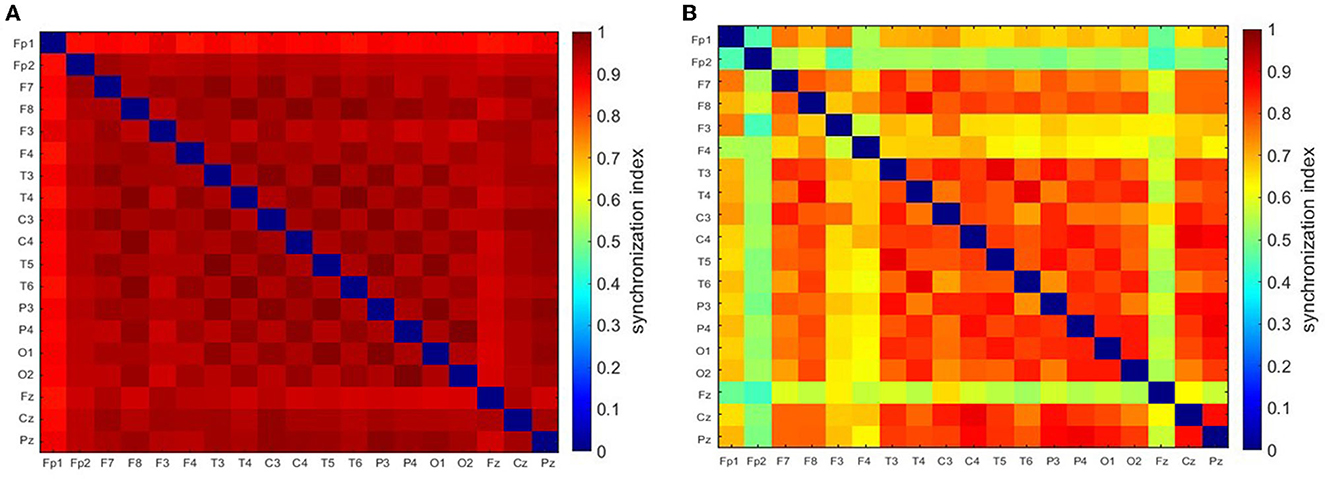
Figure 2. Synchronization matrices for the regular (A) and disorganized (B) seizure. These seizures are shown in Figure 1.
Figures 3A, B show that γ increases at the beginning and on average gradually subsides towards the end of the seizure. For the eight types of data segments (labeled from 0 to 7) presented in these figures, the average γ was equal to 0.28 ± 0.09, 0.46 ± 0.17, 0.62 ± 0.19, 0.79 ± 0.18, 0.75 ± 0.19, 0.58 ± 0.19, 0.44 ± 0.16, 0.36 ± 0.12. γ in ictal segments (1 to 7) was significantly higher than the interictal baseline 0.28 ± 0.09 (p < 0.0001 for the Mann–Whitney test).
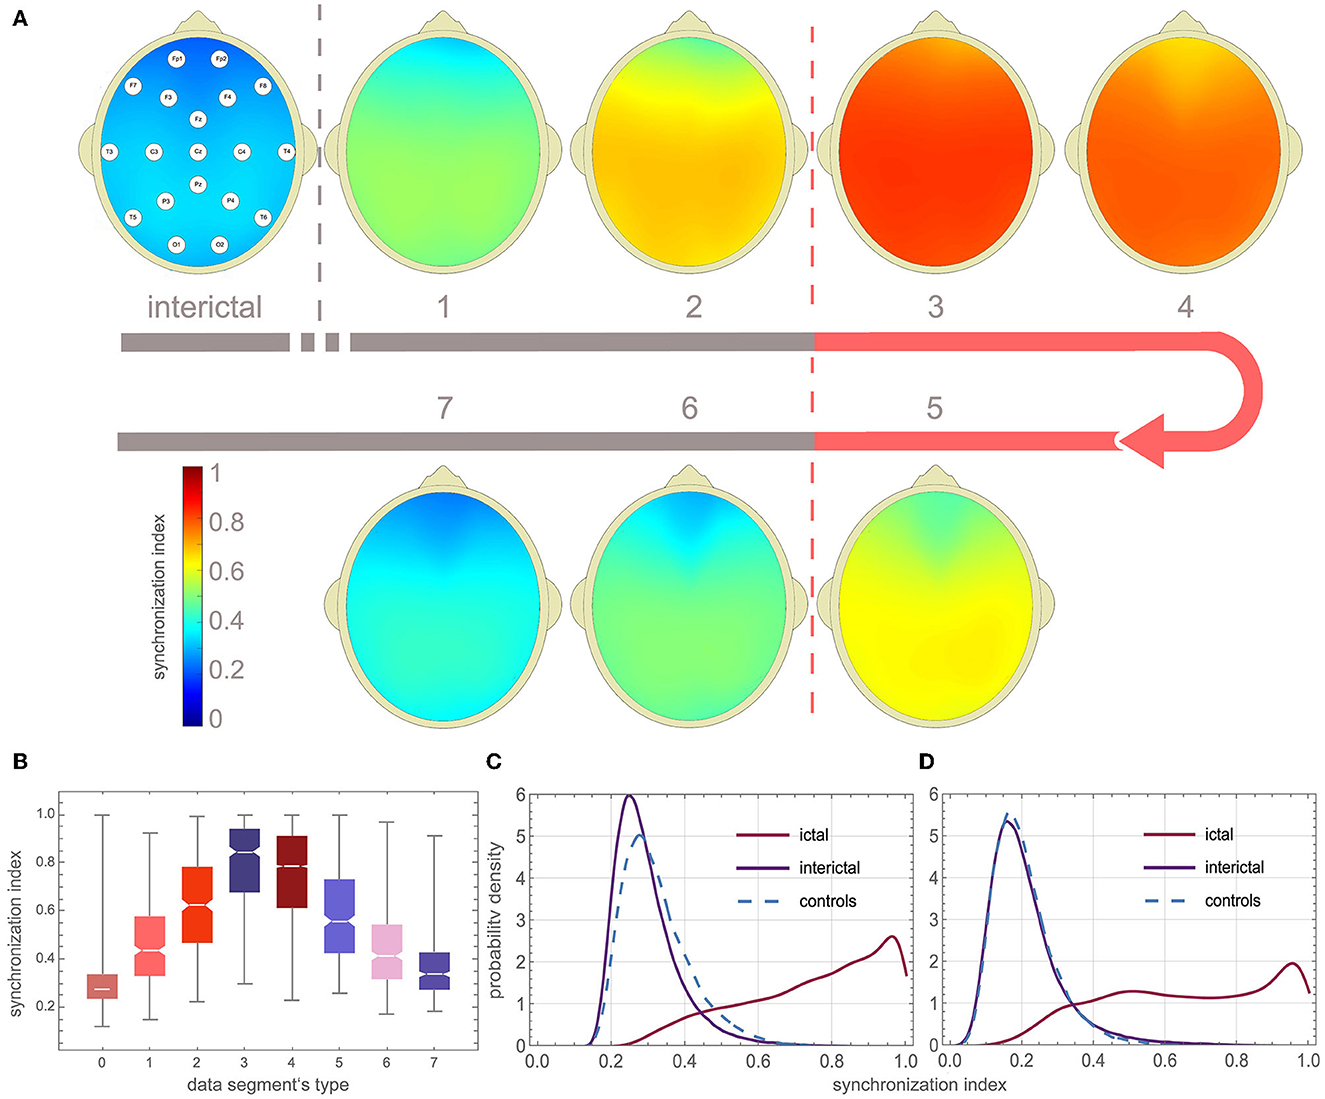
Figure 3. EEG synchronization during absence seizures. (A) Topographic map of channel synchronization (cohort average) for all interictal segments (0), the first window that partially overlaps seizures (1), the second partially overlapping (2), the first fully embedded in the seizure (3), all embedded without the first and last (4), the last embedded (5), the last but one overlapping (6) and last overlapping (7). (B) Global synchronization boxplots for data segments 0–7 (segments from all patients were used). (C, D) Probability density function (PDF) of the average synchronization index for the 19 channels (S19) and the four-channel subset S4 (Fp1, Fp2, T5, T6), respectively. One can see that global synchronization is high during seizures and that there is a strong overlap of the interictal and ictal distributions of the synchronization index.
The probability density function (PDF) of γ for the interictal and ictal segments strongly overlaps. In Figure 3C, PDF was calculated using global synchronization for the 19 channels (S19) while Figure 3D shows PDF for the four-channel subset S4 (Fp1, Fp2, T5, T6). The cut-off value for which 95% of the interictal segments had smaller synchronization was equal to 0.49, 0.65, 0.45, and 0.48 for S19, S12, S6, and S4, respectively.
We detected absences with the k-NN classifier using synchronization and normalized amplitude as features. Supplementary Table 1 shows that the accuracy of other classifiers, such as neural networks or decision trees, is comparable. In actual implementations, these classifiers would be preferable because they do not require the attachment of training samples (feature vectors with the corresponding labels). We chose k-NN because of its short training time, which speeds up cross-validation.
Figure 4 elucidates the building of a seizure detector for patient P1, who had six absences with a mean duration of 10.5 s. One of the absences of P1 is presented in Figure 1A. The training set was created using data from the other 64 patients using the 19 channels (S19) or the four-channel subset S4. The scatter plots in Figures 4A, C show the spread of the synchronization and the normalized amplitude for S19 and S4, respectively. Patient P1's EEG was partitioned into 3,598 windows. 108 were fully embedded in the seizures, while 24 partially overlapped them. Please note that for testing purposes, we consider any data segment that even partially overlaps a seizure as ictal. Of the 132 ictal windows, 14 (FN = 10.6%) and 17 (FN = 12.9%) were misclassified for S19 and S4, respectively. For both subsets, all 3,464 interictal segments were correctly labeled.
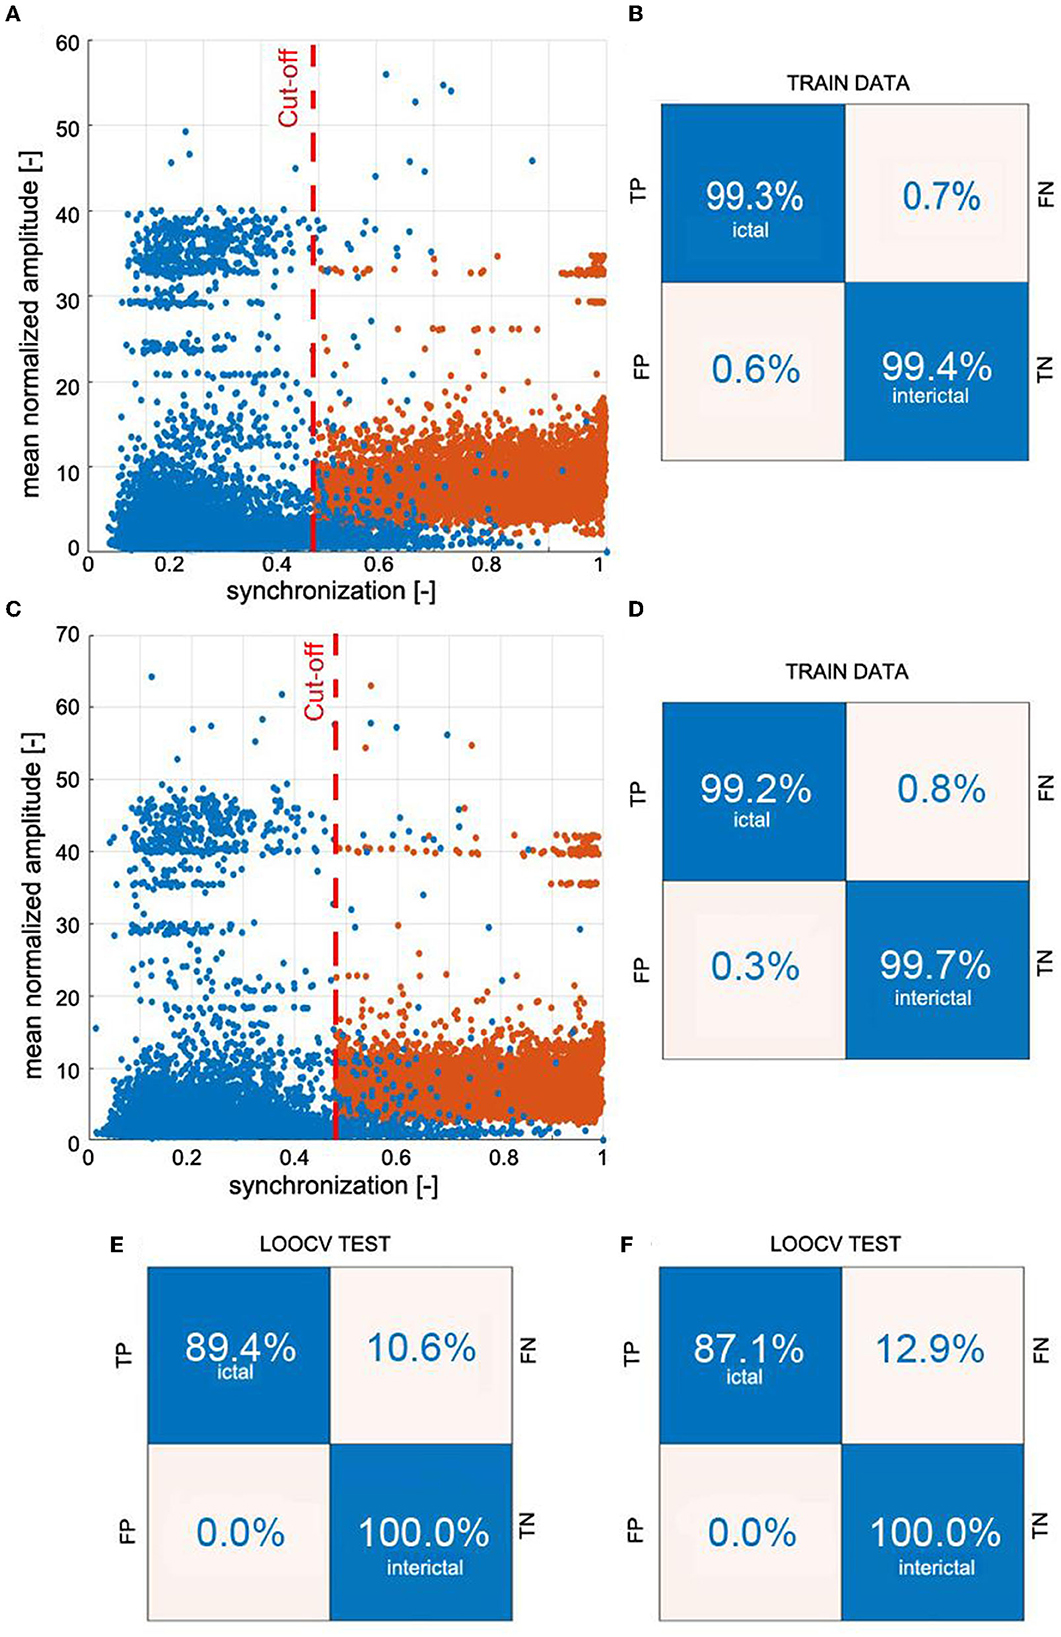
Figure 4. Example of building a k-NN seizure detector with the leave-one-out cross-validation (LOOCV) for patient P1. We used the global synchronization index and mean normalized EEG amplitude as the features. The learning set comprised randomly chosen interictal and segments fully embedded in absences with average synchronization greater than the cut-off value. We used 3:1 ratio of interictal to ictal windows. Panels (A, C) show the spread of the data generated for all 19 channels of 10-20 EEG setup (S19) and the subset S4 (channels Fp1, Fp2, T5, and T6), respectively. The confusion matrices in (B, D) show the results of 10-fold cross-validation. The classifiers were applied to the segmented EEG of patient P1 (1 s windows with 0.5 s overlap). Panels (E, F) show P1's confusion matrices for S19 and S4, respectively.
Supplementary Figure 4 shows the construction of a seizure detector for patient P18. One of his absences is presented in Figure 1B.
The overlap OVR was the largest for S19 (82.90 ± 20.83%) and the smallest for S4 (69.31 ± 25.09%) (Table 1). For S19, PERR was equal to 0.87 ± 1.23%, 0.12 ± 0.26%, 0.07 ± 0.14% for patients, controls, and young adults, respectively. The corresponding values for S4 were 0.68 ± 1.32%, 0.03 ± 0.07%, and 0.02 ± 0.06%.
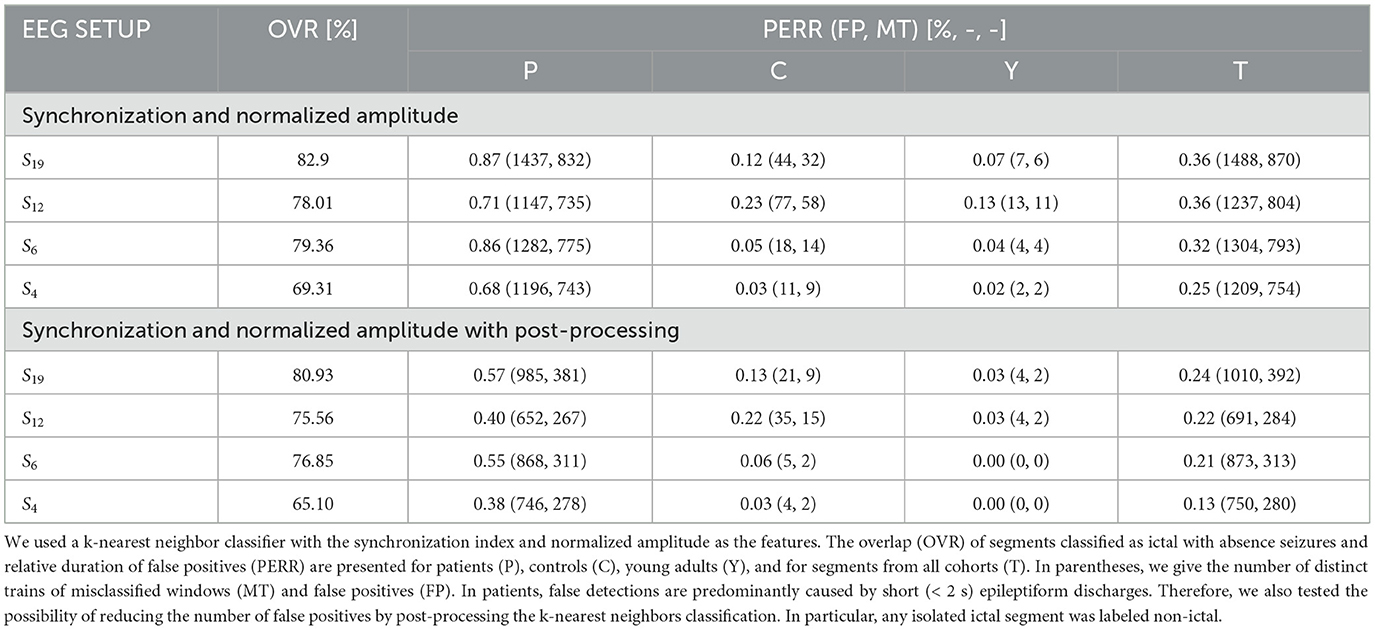
Table 1. Seizure detection characteristics for the 19 channels (S19) and three subsets with a smaller number of electrodes.
The false detection rate of the patients was five times higher than that of controls (0.5 vs. 0.1%) for S19 setup (Table 1). For smaller subsets, the detector performance was markedly better. For S6, the false detection rate was equal to 0.5, 0.03, and 0.04% for patients, controls, and young adults, respectively. Comparison of the number of distinct trains of misclassified segments with the number of false positives reveals that parts of the EEG marked incorrectly as ictal are, on average, shorter than 2 s. We found by visual inspection that about 82% of the false positives were caused by short epileptiform discharges, which are quite common in epilepsy patients and rare in controls and young adults. The EEG artifacts comprise the rest: 7% were caused by spike-like high-amplitude artifacts and 7% by artifacts of more complicated morphology. The seizure detection performance for each patient is presented in Supplementary Table 2. The post-processing cuts approximately in half the number of FP (Table 1).
For two patients, P1 and P18, we built the detector for different combinations of wavelet parameters fc and fa. OVR, PERR, and FP for these calculations are presented in Supplementary Tables 3, 4. The results show that the detector performance is weakly affected by small changes in the wavelet parameters. For example, for P1, the grid search yielded fc = 0.8 Hz and fa = 10 Hz. For these values OVR = 99.17%, PERR = 0.30%, and FP = 1. For the standard parameters fc = 1.0 Hz and fa = 12 Hz (used for all subjects), we obtained OVR = 99.15%, PERR = 0.22%, and FP = 0. For P1, for 10 runs, we obtained the following average values: OVR = 99.16 ± 0.00%, PERR = 0.22 ± 0.01, and FP = 1 ± 0. For P18, the corresponding values were equal to 98.38 ± 0.15%, 1.25 ± 0.02, and FP = 33 ± 1.
Supplementary Table 5 shows the group average characteristics of seizure detection for different combinations of wavelet parameters. There are a number of combinations (e.g., fa = 11 Hz and fc = 1 Hz or fa = 14 Hz and fc = 1.4 Hz) for which the detection performance is comparable (the trade-off between the overlap and the number of false positives) with fa = 12 Hz and fc = 1 Hz used in this study. We chose the latter parameters because they have a clear physical interpretation (the difference between interictal and ictal synchronization is highest) and the number of false positives for the controls is acceptable (Supplementary Table 6).
In Figure 5, we compare the EEG dynamics with the classifier output (detection function). SWDs do not emerge simultaneously from the background EEG in all channels. At the end of the seizure, ictal activity gradually subsides: epileptic spikes disappear, the amplitude of the EEG decreases, and global synchronization is lost. However, the initial and final transients were very short (<0.5 s), and consequently, the first and last segments were classified as ictal. Two segments during which the ictal rhythm was interrupted were correctly identified. For the absence seizure presented, SFRAG was equal to 6.4%. Two EEG intervals in Figure 5 were marked blue to draw attention to the limitations of fragmentation analysis. First, seizure disorganizations shorter than 0.5 s are, in most cases, undetected. Second, the duration of the disorganization can be underestimated because of the size of the data window used to calculate the synchronization.
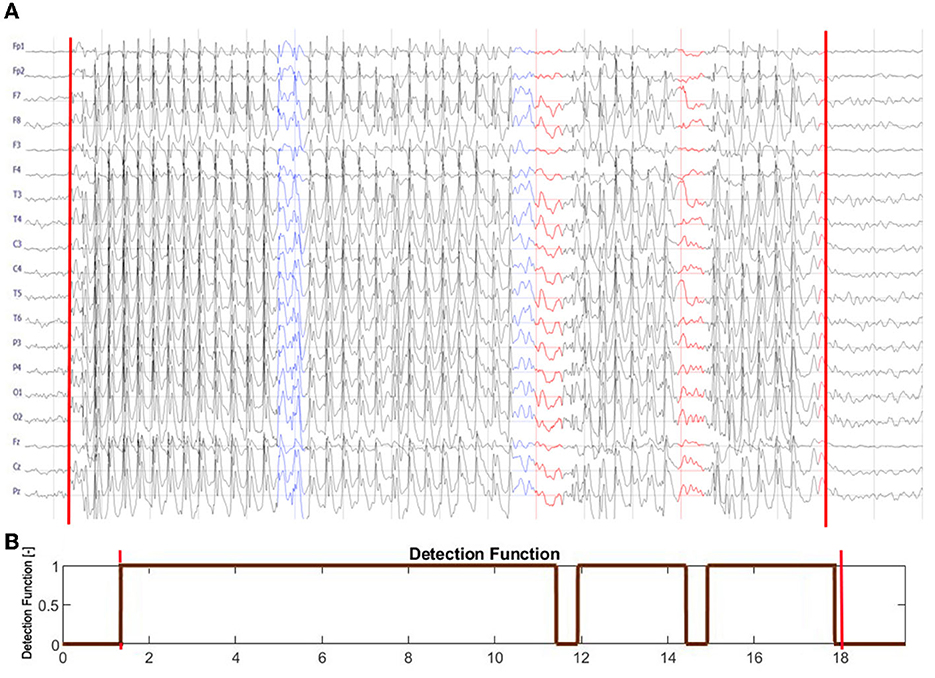
Figure 5. (A) Seizure from Figure 1B is shown with the leading and trailing interictal segments. (B) The output of the seizure detector. The detection function equals 1 for the segments classified as ictal and 0 otherwise. The red vertical lines in both subplots delineate the abnormal EEG activity marked by a neurologist. Note that SWDs do not simultaneously emerge from the background EEG in all channels. At the end of the seizure, ictal activity gradually subsides: epileptic spikes disappear, the amplitude of the EEG decreases, and global synchronization is lost. The initial and final transients are shorter than 0.5 s. The detector correctly identified the two interruptions in the ictal rhythm, marked in (A) in red. Two EEG intervals were marked blue to draw attention to the limitations of fragmentation analysis. Seizure disorganization shorter than about 0.5 s are, in most cases, undetected. Due to the finite size of the data window used to calculate phase synchronization, the fragmentation can be underestimated.
We analyzed all EEG segments classified as noictal that were fully embedded in seizures to find that in approximately 98% of these segments, seizure activity was disorganized or SWDs were simply absent. The other 2% contained artifacts.
For S19 set-up, the group-averaged SFRAG was equal to 20 ± 24%. For 46 patients (71%), the average fragmentation of seizures was less than 25% (Figure 6A). Of the 385 absences, 280 (73%) had SFRAG smaller than 25% (Figure 6B). Disorganization did not occur in 120 cases. For such seizures, SFRAG < 5%.
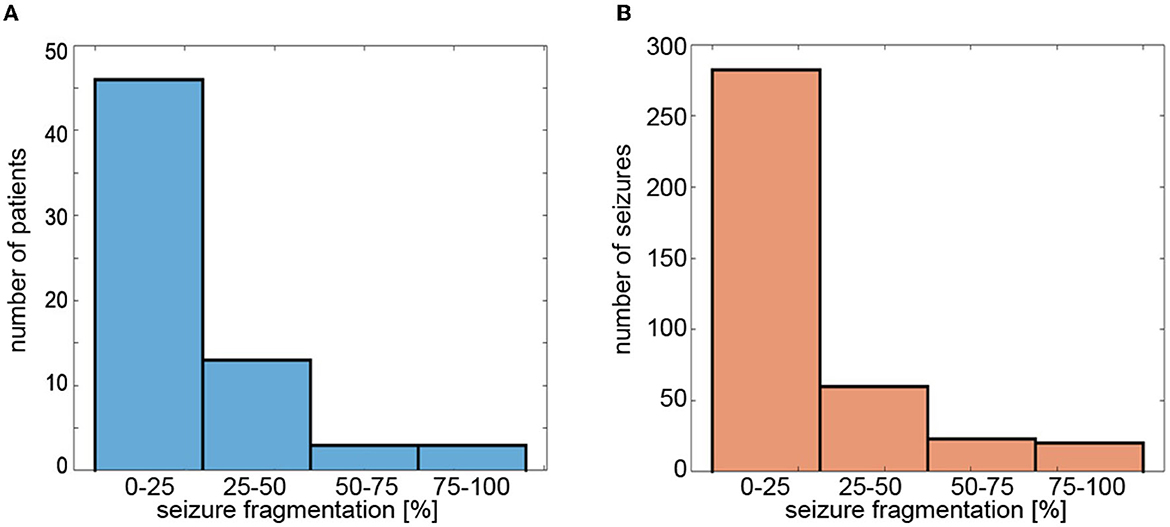
Figure 6. Histograms of (A) average fragmentation of the patient's seizures and (B) fragmentation of individual seizures. Seizure fragmentation is defined as the duration of segments classified as non-ictal embedded in the abnormal EEG activity interval divided by the length of such an interval.
SFRAG was equal to 18 ± 24%, 24 ± 26%, and 30 ± 29% for S12, S6, and S4, respectively.
An epileptic seizure is “a transient occurrence of signs and/or symptoms due to abnormal excessive or synchronous neuronal activity in the brain” (Fisher et al., 2005). Childhood and juvenile absences are the most compelling examples of pathological neuronal synchrony. Interestingly enough, all the absence detection algorithms proposed so far (Adeli et al., 2003; Subasi, 2007; Sitnikova et al., 2009; Ovchinnikov et al., 2010; Xanthopoulos et al., 2010; Petersen et al., 2011; Duun-Henriksen et al., 2012; Bauquier et al., 2015; Zeng et al., 2016; Grubov et al., 2017; Kjaer et al., 2017; Tenneti and Vaidyanathan, 2018; Dan et al., 2020; Glaba et al., 2021; Japaridze et al., 2022) have been derived from the properties of individual SWD complexes. Figures 3C, D provide an explanation, the overlap of the ictal and interictal probability density functions is so large that it precludes seizure detection based solely on changes in EEG synchronization. This conclusion agrees with previous studies on epileptic synchronization (Altenburg et al., 2003; Slooter et al., 2006).
This paper used the phase-synchronization index and the normalized amplitude as classification features. False detections are rare in controls and young adults. Although the PERR for the patients (0.55% for S6) was even lower than that of the detector we had presented earlier (Glaba et al., 2021), the false detection rate per hour (8/h) was an order of magnitude higher. However, visual inspection of the EEG showed that 82% of the false positives corresponded to epileptiform discharges.
Of 385 absences, all but three were identified (accuracy (99.2%). Misclassified seizures were highly disorganized. The group-average overlap of EEG segments classified as ictal with seizures never exceeded 83%. There are two reasons for such a low value. The first is trivial, since we calculate γ for 1-s sliding windows. For windows that only partially cover the absences, γ is inevitably lower, which can lead to errors. The second reason is more fundamental and can be traced back to the disorganization of absences. Non-ictal classification within abnormal EEG activity was always associated with such disorganization. Apart from the segments that partially overlap seizures, we did not find a convincing example of a false negative.
The detection algorithm employs short data segments, making it suitable for real-time EEG analysis as several algorithms described previously (Xanthopoulos et al., 2010; Petersen et al., 2011; Duun-Henriksen et al., 2012; Kjaer et al., 2017; Dan et al., 2020; Japaridze et al., 2022). It is computationally more expensive than those derived from the properties of SWDs. This drawback is largely irrelevant today, except for portable EEGs with severely limited computing power. It should be noted that while the spectral and amplitude properties of EEG change significantly during maturation (Schomer and da Silva, 2018), the detector works equally well in children, juveniles, and young adults. The classification accuracy is good for a six-channel setup (Fp1, Fp2, F7, F8, O1, O2), which can be implemented as an unobtrusive EEG headband—a crucial requirement from the point of view of pediatric applications.
In the previous paper (Glaba et al., 2021), we used a delta frequency envelope to identify abnormal EEG activity. However, to detect absence seizures, we had to use two arbitrarily chosen heuristic criteria. First, we checked whether there were epileptic spikes in the envelope by calculating the percentage of EEG samples for which the beta wavelet power was greater than the threshold value. Second, if the envelope was shorter than 5 s, we also calculated the variance of the beta wavelet power. Although this algorithm was very fast and worked well, the approach presented here is not only more elegant, but it also allows quantifying seizure fragmentation.
The proposed detector cannot determine the fragmentation of the seizure in the live data stream. This can only be accomplished retrospectively when the detector (with post-processing turned off) is applied to EEG segments with abnormal EEG activity. Such segments can be marked by a neurologist or by building a delta wave envelope as demonstrated in Glaba et al. (2021). To our knowledge, we present the first qualitative characterization of absence seizure fragmentation. The analysis showed that seizures were disorganized in approximately half of the 65 subjects. On average, generalized SWDs lasted about 80% of the duration of abnormal EEG activity. The disruption of the ictal rhythm can manifest itself as the disappearance of epileptic spikes (with high-amplitude delta waves persisting), transient (about 1 s) cessation of epileptic discharges, or loss of global synchronization.
Although CAE and JAE are distinct epilepsy syndromes, there is considerable age overlap between them. Consequently, the diagnosis is not always obvious. This is an important clinical problem, as JAE is a lifelong disease. Sadleir et al. reported that disorganized discharges are eight times more frequent in JAE (Sadleir et al., 2009). For most patients, we only had the electroencephalogram recorded before the onset of pharmacotherapy. Therefore, future research must establish whether seizure properties (frequency, length, fragmentation, etc.) and clinical characteristics can distinguish CAE and JAE.
It should be noted that some EEG synchronization properties are unique to absence seizures. Figure 3B shows that γ peaks at the beginning of the seizure and is approximately twice the mean interictal value, in agreement with the recent study of (Zhong et al., 2022). However, Majmundar et al. argue that for most focal-onset seizures, synchronization occurs toward the end of the seizure rather than at the time of onset (Majumdar et al., 2014). Absence seizures exhibit longer-range synchrony than generalized tonic motor seizures of secondary (symptomatic) generalized epilepsy or frontal lobe epilepsy (Dominguez et al., 2005).
Epilepsy has historically been perceived as a functional brain disorder associated with hypersynchronization. Interestingly, desynchronization can precede seizures (Aarabi et al., 2008; Jiruska et al., 2013; Zeng et al., 2016). Figure 3C shows that the peak of the interictal distribution of γ is shifted to low values relative to the controls. Therefore, the question arises of whether this shift is a manifestation of desynchronization in patients with CAE / JAE. We will present a detailed analysis of interictal EEG synchronization properties elsewhere.
The raw data supporting the conclusions of this article will be made available by the authors, without undue reservation.
The studies involving human participants were reviewed and approved by Wroclaw Medical University's and Warsaw Institute of Psychiatry and Neurology Ethics Committees. Written informed consent from the participants' legal guardian/next of kin was not required to participate in this study in accordance with the national legislation and the institutional requirements.
ML, PG, and MK: conceptualization and methodology. PG, ML, and MJK: investigation original draft preparation. BW, WW, SK, TS, and WJ: review and editing. All authors contributed to formal analysis. All authors contributed to the article and approved the submitted version.
This research was supported by the grand of Wroclaw Medical University (SUBZ.A422.22.014).
We thank Łukasz Bratos for the help with the numerical calculations.
The authors declare that the research was conducted in the absence of any commercial or financial relationships that could be construed as a potential conflict of interest.
All claims expressed in this article are solely those of the authors and do not necessarily represent those of their affiliated organizations, or those of the publisher, the editors and the reviewers. Any product that may be evaluated in this article, or claim that may be made by its manufacturer, is not guaranteed or endorsed by the publisher.
The Supplementary Material for this article can be found online at: https://www.frontiersin.org/articles/10.3389/fninf.2023.1169584/full#supplementary-material
Aarabi, A., Wallois, F., and Grebe, R. (2008). Does spatiotemporal synchronization of EEG change prior to absence seizures? Brain Res. 1188, 207–221. doi: 10.1016/j.brainres.2007.10.048
Addison, P. S. (2017). The Illustrated Wavelet Transform Handbook: Introductory Theory and Applications in Science, Engineering, Medicine and Finance. Boca Raton, FL: CRC Press.
Addison, P. S. (2018). Introduction to redundancy rules: the continuous wavelet transform comes of age. Philos. Trans. R. Soc. A Math. Phys. Eng. Sci. 376, 20170258. doi: 10.1098/rsta.2017.0258
Adeli, H., Zhou, Z., and Dadmehr, N. (2003). Analysis of EEG records in an epileptic patient using wavelet transform. J. Neurosci. Methods 123, 69–87. doi: 10.1016/S0165-0270(02)00340-0
Akman, C. I., Montenegro, M. A., Jacob, S., Eck, K., Chiriboga, C., and Gilliam, F. (2009). Seizure frequency in children with epilepsy: factors influencing accuracy and parental awareness. Seizure 18, 524–529. doi: 10.1016/j.seizure.2009.05.009
Altenburg, J., Vermeulen, R. J., Strijers, R. L., Fetter, W. P., and Stam, C. J. (2003). Seizure detection in the neonatal EEG with synchronization likelihood. Clin. Neurophysiol. 114, 50–55. doi: 10.1016/S1388-2457(02)00322-X
Asadi-Pooya, A. A., Emami, M., and Sperling, M. R. (2013). A clinical study of syndromes of idiopathic (genetic) generalized epilepsy. J. Neurol. Sci. 324, 113–117. doi: 10.1016/j.jns.2012.10.014
Bauquier, S. H., Lai, A., Jiang, J. L., Sui, Y., and Cook, M. J. (2015). Evaluation of an automated spike-and-wave complex detection algorithm in the EEG from a rat model of absence epilepsy. Neurosci. Bull. 31, 601–610. doi: 10.1007/s12264-015-1553-5
Dan, J., Vandendriessche, B., Paesschen, W. V., Weckhuysen, D., and Bertrand, A. (2020). Computationally-efficient algorithm for real-time absence seizure detection in wearable electroencephalography. Int. J. Neural Syst. 30, 2050035. doi: 10.1142/S0129065720500355
Dominguez, L. G., Wennberg, R. A., Gaetz, W., Cheyne, D., Snead, O. C., and Velazquez, J. L. P. (2005). Enhanced synchrony in epileptiform activity? Local versus distant phase synchronization in generalized seizures. J. Neurosci. 25, 8077–8084. doi: 10.1523/JNEUROSCI.1046-05.2005
Duun-Henriksen, J., Madsen, R. E., Remvig, L. S., Thomsen, C. E., Sorensen, H. B., and Kjaer, T. W. (2012). Automatic detection of childhood absence epilepsy seizures: toward a monitoring device. Pediatr. Neurol. 46, 287–292. doi: 10.1016/j.pediatrneurol.2012.02.018
Fisher, R. S., Boas, W. V. E., Blume, W., Elger, C., Genton, P., Lee, P., et al. (2005). Epileptic seizures and epilepsy: definitions proposed by the international league against epilepsy (ILAE) and the international bureau for epilepsy (IBE). Epilepsia 46, 470–472. doi: 10.1111/j.0013-9580.2005.66104.x
Glaba, P., Latka, M., Krause, M. J., Kroczka, S., Kuryło, M., Kaczorowska-Frontczak, M., et al. (2021). Absence seizure detection algorithm for portable EEG devices. Front. Neurol. 12, 685814. doi: 10.3389/fneur.2021.685814
Glauser, T. A., Cnaan, A., Shinnar, S., Hirtz, D. G., Dlugos, D., Masur, D., et al. (2013). Ethosuximide, valproic acid, and lamotrigine in childhood absence epilepsy: initial monotherapy outcomes at 12 months. Epilepsia. 54, 141–155.
Grubov, V., Sitnikova, E., Pavlov, A., Koronovskii, A., and Hramov, A. (2017). Recognizing of stereotypic patterns in epileptic EEG using empirical modes and wavelets. Phys. A Stat. Mech. Appl. 486, 206–217. doi: 10.1016/j.physa.2017.05.091
Hirsch, E., French, J., Scheffer, I. E., Bogacz, A., Alsaadi, T., Sperling, M. R., et al. (2022). Ilae definition of the idiopathic generalized epilepsy syndromes: position statement by the ILAE task force on nosology and definitions. Epilepsia 63, 1475–1499. doi: 10.1111/epi.17236
Japaridze, G., Loeckx, D., Buckinx, T., Armand Larsen, S., Proost, R., Jansen, K., et al. (2022). Automated detection of absence seizures using a wearable electroencephalographic device: a phase 3 validation study and feasibility of automated behavioral testing. Epilepsia. doi: 10.1111/epi.17200
Jiruska, P., De Curtis, M., Jefferys, J. G., Schevon, C. A., Schiff, S. J., and Schindler, K. (2013). Synchronization and desynchronization in epilepsy: controversies and hypotheses. J. Physiol. 591, 787–797. doi: 10.1113/jphysiol.2012.239590
Keilson, M. J., Hauser, W. A., Magrill, J. P., and Tepperberg, J. (1987). Ambulatory cassette EEG in absence epilepsy. Pediatr. Neurol. 3, 273–276.
Kjaer, T. W., Sorensen, H. B., Groenborg, S., Pedersen, C. R., and Duun-Henriksen, J. (2017). Detection of paroxysms in long-term, single-channel EEG-monitoring of patients with typical absence seizures. IEEE J. Transl. Eng. Health Med. 5, 1–8. doi: 10.1109/JTEHM.2017.2649491
Krigolson, O. E., Williams, C. C., Norton, A., Hassall, C. D., and Colino, F. L. (2017). Choosing muse: validation of a low-cost, portable EEG system for erp research. Front. Neurosci. 11, 109. doi: 10.3389/fnins.2017.00109
Lachaux, J.-P., Rodriguez, E., Martinerie, J., and Varela, F. J. (1999). Measuring phase synchrony in brain signals. Hum. Brain Mapp. 8, 194–208.
Latka, M., Turalska, M., Glaubic-Latka, M., Kolodziej, W., Latka, D., and West, B. J. (2005). Phase dynamics in cerebral autoregulation. Am. J. Physiol. Heart Circ. Physiol. 289, H2272–H2279. doi: 10.1152/ajpheart.01307.2004
Majumdar, K., Prasad, P. D., and Verma, S. (2014). Synchronization implies seizure or seizure implies synchronization? Brain Topogr. 27, 112–122. doi: 10.1007/s10548-013-0284-z
Ovchinnikov, A., Lüttjohann, A., Hramov, A., and Van Luijtelaar, G. (2010). An algorithm for real-time detection of spike-wave discharges in rodents. J. Neurosci. Methods 194, 172–178. doi: 10.1016/j.jneumeth.2010.09.017
Petersen, E. B., Duun-Henriksen, J., Mazzaretto, A., Kjær, T. W., Thomsen, C. E., and Sorensen, H. B. (2011). “Generic single-channel detection of absence seizures,” in 2011 Annual International Conference of the IEEE Engineering in Medicine and Biology Society (Boston, MA: IEEE), 4820–4823.
Pu, L., Lion, K. M., Todorovic, M., and Moyle, W. (2021). Portable EEG monitoring for older adults with dementia and chronic pain-a feasibility study. Geriatr. Nurs. 42, 124–128. doi: 10.1016/j.gerinurse.2020.12.008
Quiroga, R. Q., Kraskov, A., Kreuz, T., and Grassberger, P. (2002). Performance of different synchronization measures in real data: a case study on electroencephalographic signals. Phys. Rev. E 65, 041903. doi: 10.1103/PhysRevE.65.041903
Sadleir, L. G., Scheffer, I. E., Smith, S., Carstensen, B., Farrell, K., and Connolly, M. B. (2009). EEG features of absence seizures in idiopathic generalized epilepsy: impact of syndrome, age, and state. Epilepsia 50, 1572–1578. doi: 10.1111/j.1528-1167.2008.02001.x
Schomer D. L. and da Silva, F. L.. (2018). Niedermeyer's Electroencephalography: Basic Principles, Clinical Applications, and Related Fields. Oxford: Oxford University Press.
Sitnikova, E., Hramov, A. E., Koronovsky, A. A., and van Luijtelaar, G. (2009). Sleep spindles and spike–wave discharges in EEG: their generic features, similarities and distinctions disclosed with fourier transform and continuous wavelet analysis. J. Neurosci. Methods 180, 304–316. doi: 10.1016/j.jneumeth.2009.04.006
Slooter, A., Vriens, E., Leijten, F., Spijkstra, J., Girbes, A., van Huffelen, A., et al. (2006). Seizure detection in adult ICU patients based on changes in EEG synchronization likelihood. Neurocrit. Care 5, 186–192. doi: 10.1385/NCC:5:3:186
Subasi, A. (2007). Application of adaptive neuro-fuzzy inference system for epileptic seizure detection using wavelet feature extraction. Comput. Biol. Med. 37, 227–244. doi: 10.1016/j.compbiomed.2005.12.003
Szaflarski, J. P., DiFrancesco, M., Hirschauer, T., Banks, C., Privitera, M. D., Gotman, J., et al. (2010). Cortical and subcortical contributions to absence seizure onset examined with EEG/fMRI. Epilepsy Behav. 18, 404–413. doi: 10.1016/j.yebeh.2010.05.009
Tenneti, S. V., and Vaidyanathan, P. (2018). “Absence seizure detection using ramanujan filter banks,” in 2018 52nd Asilomar Conference on Signals, Systems, and Computers (Pacific Grove, CA: IEEE), 1913–1917.
Xanthopoulos, P., Rebennack, S., Liu, C.-C., Zhang, J., Holmes, G. L., Uthman, B. M., et al. (2010). “A novel wavelet based algorithm for spike and wave detection in absence epilepsy,” in 2010 IEEE International Conference on BioInformatics and BioEngineering (Philadelphia, PA: IEEE), 14–19.
Zeng, K., Yan, J., Wang, Y., Sik, A., Ouyang, G., and Li, X. (2016). Automatic detection of absence seizures with compressive sensing EEG. Neurocomputing 171, 497–502. doi: 10.1016/j.neucom.2015.06.076
Keywords: epilepsy, absence seizure, synchronization, wavelets, seizure detection, childhood absence epilepsy, juvenile absence epilepsy, seizure fragmentation
Citation: Glaba P, Latka M, Krause MJ, Kroczka S, Kuryło M, Kaczorowska-Frontczak M, Walas W, Jernajczyk W, Sebzda T and West BJ (2023) EEG phase synchronization during absence seizures. Front. Neuroinform. 17:1169584. doi: 10.3389/fninf.2023.1169584
Received: 19 February 2023; Accepted: 25 May 2023;
Published: 19 June 2023.
Edited by:
Kais Gadhoumi, Duke University, United StatesReviewed by:
Edward M. Merricks, Columbia University, United StatesCopyright © 2023 Glaba, Latka, Krause, Kroczka, Kuryło, Kaczorowska-Frontczak, Walas, Jernajczyk, Sebzda and West. This is an open-access article distributed under the terms of the Creative Commons Attribution License (CC BY). The use, distribution or reproduction in other forums is permitted, provided the original author(s) and the copyright owner(s) are credited and that the original publication in this journal is cited, in accordance with accepted academic practice. No use, distribution or reproduction is permitted which does not comply with these terms.
*Correspondence: Miroslaw Latka, TWlyb3NsYXcuTGF0a2FAcHdyLmVkdS5wbA==
Disclaimer: All claims expressed in this article are solely those of the authors and do not necessarily represent those of their affiliated organizations, or those of the publisher, the editors and the reviewers. Any product that may be evaluated in this article or claim that may be made by its manufacturer is not guaranteed or endorsed by the publisher.
Research integrity at Frontiers
Learn more about the work of our research integrity team to safeguard the quality of each article we publish.