 Lei Zhao1,2,3
 Yun-Kai Sun
 Shao-Wei Xue
 Lan-Hua Zhang
94% of researchers rate our articles as excellent or good
Learn more about the work of our research integrity team to safeguard the quality of each article we publish.
Find out more
ORIGINAL RESEARCH article
Front. Neuroinform., 22 February 2022
Volume 16 - 2022 | https://doi.org/10.3389/fninf.2022.761942
This article is part of the Research TopicImproving Autism Spectrum Disorder Diagnosis Using Machine Learning TechniquesView all 5 articles
An increasing number of resting-state functional magnetic resonance neuroimaging (R-fMRI) studies have used functional connections as discriminative features for machine learning to identify patients with brain diseases. However, it remains unclear which functional connections could serve as highly discriminative features to realize the classification of autism spectrum disorder (ASD). The aim of this study was to find ASD-related functional connectivity patterns and examine whether these patterns had the potential to provide neuroimaging-based information to clinically assist with the diagnosis of ASD by means of machine learning. We investigated the whole-brain interregional functional connections derived from R-fMRI. Data were acquired from 48 boys with ASD and 50 typically developing age-matched controls at NYU Langone Medical Center from the publicly available Autism Brain Imaging Data Exchange I (ABIDE I) dataset; the ASD-related functional connections identified by the Boruta algorithm were used as the features of support vector machine (SVM) to distinguish patients with ASD from typically developing controls (TDC); a permutation test was performed to assess the classification performance. Approximately, 92.9% of participants were correctly classified by a combined SVM and leave-one-out cross-validation (LOOCV) approach, wherein 95.8% of patients with ASD were correctly identified. The default mode network (DMN) exhibited a relatively high network degree and discriminative power. Eight important brain regions showed a high discriminative power, including the posterior cingulate cortex (PCC) and the ventrolateral prefrontal cortex (vlPFC). Significant correlations were found between the classification scores of several functional connections and ASD symptoms (p < 0.05). This study highlights the important role of DMN in ASD identification. Interregional functional connections might provide useful information for the clinical diagnosis of ASD.
Autism spectrum disorder (ASD) is a neurodevelopmental disability characterized by persistent deficits in social communication associated with restricted and repetitive patterns of behavior, interests, or activities (Minshew and Williams, 2007). Individuals with ASD have difficulty with everyday reciprocal social communication and social interactions, causing heavy burdens to individuals, families, and society (Van Loo and Martens, 2007). However, the neural correlates underlying ASD symptoms have not been fully elucidated, and further examination is warranted to gain a more comprehensive understanding of this disorder. Resting-state functional MRI (R-fMRI), which measures the blood oxygen level-dependent (BOLD) signal recorded at rest, has emerged as a promising tool for exploring disorder-related brain function alterations (Biswal, 2012; Lau et al., 2019). Previous R-fMRI studies have demonstrated dispersively distributed functional disruptions in ASD, while this disorder has been increasingly characterized as the dysregulation of brain networks with altered functional connectivity (Hull et al., 2017). Connectivity is a general description of the interactive relationship between two independent brain regions in anatomical space. Functional connectivity aims to describe this relationship from the point of functional synchronization. In the scan of R-fMRI, functional connectivity is measured by statistical dependence in BOLD fluctuations between two brain regions or brain networks. Except for anatomical morphology, the human brain regions can also be subdivided by functional characteristics. In a previous study (Dosenbach et al., 2010), the 160 regions of interest (ROIs) covering the whole brain were labeled and grouped into six networks, namely, the default mode network (DMN), frontoparietal network (FPN), cingulo-opercular network (CON), sensorimotor network (SMN), occipital network (ON), and cerebellum network (CN). This brain atlas was defined based on activation patterns of the brain across different cognitive tasks and may support additional information for interpreting developmental changes in brain function.
According to a previous study, there was a decrease in the functional connectivity of the medial prefrontal cortex (mPFC) with left anterior insula in patients with ASD (Von dem Hagen et al., 2013). In contrast to healthy subjects, patients with ASD exhibited decreased posterior cingulate cortex (PCC) connectivity with the superior frontal gyrus and increased connectivity of which with the parahippocampal gyrus (Monk et al., 2009). Moreover, associations between functional connectivity and ASD symptoms have been observed. For instance, the connectivity between the left anterior insula and bilateral precuneus showed a negative correlation with autism symptom severity (Xu et al., 2018). Atypical functional interactions between the core regions of the DMN, including the PCC and the mPFC, were correlated with impaired social function in patients with ASD (Lynch et al., 2013; Von dem Hagen et al., 2013). These findings indicated that the clinical characteristics of ASD might be represented in aberrant functional interactions in large-scale brain networks.
Machine learning has attracted an increasing amount of attention in R-fMRI studies as a promising technique for identifying patients with neuropsychiatric diseases at the individual level (Geng et al., 2018; Riaz et al., 2018). Previous studies have suggested that functional interactions in large-scale brain networks could be utilized for the classification of patients vs. healthy subjects. For example, interregional functional connections were regarded as discriminative features of support vector machine (SVM) to differentiate patients diagnosed with attention deficit hyperactivity disorder (ADHD) from healthy subjects (Sun et al., 2020). Whole-brain functional connections were also adopted as features of SVM to identify patients with schizophrenia (Li et al., 2019). Machine learning has been regarded as an exploratory framework to characterize the brain functional organization from interregional functional connections that may be implicated in neuropathology underlying neuropsychiatric disorders. For example, the cerebellum showed high discriminative power for identifying patients with ADHD (Sun et al., 2020). The functional connections across the DMN and visual cortical areas showed high discriminative power when discriminating major depressive patients from healthy subjects (Zeng et al., 2012). Despite progress in patient identification using machine learning, it is not yet clear how functional interactions in large-scale brain networks serve as highly discriminative features to realize the classification of ASD.
“Boruta” algorithm (Kursa et al., 2010) preserves the feature set with statistically significant contributions to classification rather than highest contributions and, thus, reduces the overfitting. In this study, the Boruta algorithm was used to determine the ASD-related functional connectivity pattern. Based on this pattern, we distinguished patients with ASD from typically developing controls (TDC) using SVM and then characterized brain network and regions with high discriminative power. Considering that the DMN has been shown to be significantly involved in ASD (Padmanabhan et al., 2017), we expected that the DMN would play an important role in ASD identification.
Table 1 shows the characteristics of all participants in this study. A total of 48 boys with ASD and 50 typically developing age-matched male controls were included. These participants were part of the New York University (NYU) Langone Medical Center dataset on the Autism Brain Imaging Data Exchange (ABIDE) platform (http://fcon_1000.projects.nitrc.org/indi/abide/). The exclusion criteria were as follows: (1) female sex; (2) not between 7 and 18 years old; and (3) excessive head motions. Considering that gender imbalance might interfere with the ASD analysis, we regarded sex as a potential confounding factor and employed a relatively careful participant selection criterion by choosing only male subjects.
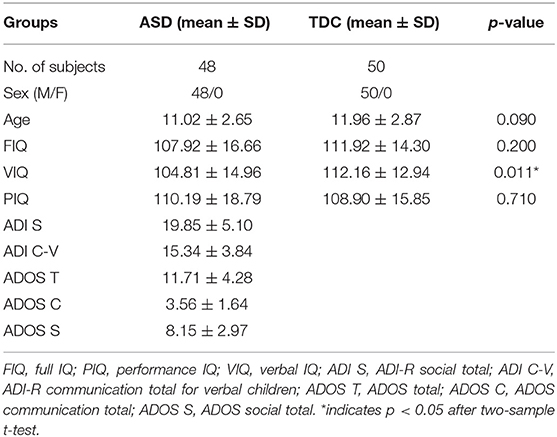
Table 1. Demographic and clinical data.
The Diagnostic and Statistical Manual of Mental Disorders, Fourth Edition (DSM-IV-TR) was used to diagnose ASD. This study was carried out in accordance with the principles of the Declaration of Helsinki and was approved by the Institutional Review Board (IRB) of NYU and the NYU School of Medicine. Prior to participation, informed consent was obtained from all participants and their parents/legal guardians (for participants < 18 years).
All images were acquired using a Siemens MAGNETOM Allegra syngo 3.0 T MR Scanner (Siemens AG, Medical Solutions, Erlangen, Germany). A 8:07 min T1-weighted sagittal MP-RAGE structural image was obtained (flip angle = 7°, time of repetition (TR) = 2,530 ms, time of echo (TE) = 3.25 ms, number of volumes = 256, voxel size = 1.3 × 1 × 1.3 mm, FOV = 256 mm, slice thickness = 1.33 mm, and T1 = 1,100 ms). A 6-min R-fMRI scan was obtained using a T2*-weighted gradient-echo EPI pulse sequence (flip angle = 90°, number of slices = 33, TR = 2,000 ms, TE = 15 ms, number of volumes = 180, voxel size = 3 × 3 × 4 mm, FOV = 240 mm, and slice thickness = 4 mm). During the R-fMRI scan, participants were asked to relax with their eyes open, while a white cross-hair against a black background was projected on a screen.
Data processing was performed using a combination of DPABI (http://www.rfmri.org/), SPM (http://www.fil.ion.ucl.ac.uk/spm/), and custom code written in MATLAB. For each subject, the first 10 volumes of functional images were discarded to allow for magnetization equilibration effects and the adaptation of the participants to the scan circumstances. The remaining images were corrected for slice timing and motion. All participants in this study had a maximum displacement of < 2 mm in the x-, y-, or z-axes and an angular motion of <2°. The corrected images were then normalized into a standard stereotactic space as defined by the Montreal Neurological Institute (resampling voxel size = 3 × 3 × 3 mm) and smoothed using a 6-mm full-width at half-maximum Gaussian kernel. To further reduce the effects of confounding factors, we also regressed out the nuisance signals (Friston-24 motion parameters, white matter signal, and cerebrospinal fluid signal). Finally, functional images underwent temporal band-pass filtering ([0.01–0.08 Hz]).
The Boruta algorithm was adopted based on the interregional functional connections for feature selection before ASD identifying in this study. Interregional functional connections were calculated based on the functional brain atlas (Dosenbach et al., 2010). First, the average R-fMRI time series of 160 ROIs of the atlas (Dosenbach et al., 2010) were extracted to calculate functional connections between all possible pairs of ROIs. Specifically, the functional connections between two ROIs were obtained by calculating the Pearson's correlation coefficient between their average R-fMRI time series. Then, correlation coefficients were subsequently converted to z-values by Fisher's r-to-z transformation to improve the normality of values. Finally, a series of 160 × 160 symmetric matrices represented the whole-brain network of participants, and the upper triangle elements of the matrix were extracted for feature selection.
As a feature selection method built based on a random forest classifier, the Boruta method selects the features that have significantly more relevance with classification than randomly permuted features (Kursa et al., 2010). Compared with general feature selection methods that focus on the so-called “minimal-optimal” problem by obtaining the best possible classification results with possibly minimal feature sets, the Boruta method aims to identify all features that are relevant for classification. In this study, we employed the Boruta method to examine the ASD-related functional connectivity pattern (implemented in Python: https://github.com/scikit-learn-contrib/boruta_py). In brief, the method can be described as follows: each feature of the original feature matrix A is shuffled across subjects to generate shadow features to add randomness and remove correlations between features and class labels, and then, the shadow feature matrix B is concatenated with the original feature matrix A to form a mixture feature matrix C (C = [A, B]) in which the number of features is twice that of the original feature matrix A. A random forest classifier is performed on the mixture feature matrix C (the Gini value was utilized as the cost function; the number of the decision tree was set as 500 in this study). The Gini importance of each feature is calculated. Real features with Gini importance higher than the 95th percentile of shadow features will be assigned a hit and then a statistical test (using a binomial distribution with p = 0.05, two-step correction: FDR and Bonferroni correction) will be performed to mark features as “confirmed” or “rejected.” The features marked as “rejected” will be removed from original feature matrix A. The above steps are repeated until each feature has a mark or the number of iterations reaches the predefined criterion (the maximum of iterations was set as 250 in this study).
We applied a k-means clustering method based on functional connections to classify the aforementioned ASD-related connections into several patterns. Specifically, a matrix with the ASD-related connections as rows and the subjects as columns was constructed. The rows of this matrix were then classified into different clusters based on their distributions across subjects. The connections assigned into the same cluster constitute a unique pattern of connection that covary across subjects.
The brain functional connection network has amounts of nodes and functional interactions and can be represented as a graph. The topological complexity of a brain functional connection network that reflects the global performance of a network was generally characterized with graph theory measures (Bullmore and Sporns, 2012). ASD-related functional connectivity pattern was a sparse presentation of the whole brain and also a specific representation for the classification of ASD. In this study, we aimed to employ the network degree (ND) to describe the topological characteristics of this pattern. The ND of a brain network was defined as the number of direct connections between a predefined brain network and other networks, representing the relative importance of a brain network in regard to the information flow in the brain (Zuo et al., 2012).
Figure 1 shows a flowchart for SVM classification including the construction of whole-brain interregional functional connections, Boruta feature selection, and SVM classification. We defined the ASD-related functional connections after the Boruta feature selection as classification features and used SVM with the radial basis function (RBF) kernel function to distinguish patients with ASD from TDC (implemented using “libsvm”: https://www.csie.ntu.edu.tw/~cjlin/libsvm/). SVM is the most common machine learning technique for the clinical application study of R-fMRI. When the cost of sample acquisition is expensive, SVM displays a key advantage due to its algorithm principle. The hyperplane of SVM used to distinguish different categories can be determined by fewer support vectors and thus exhibit excellent performance in small samples usually. The classification weight of a functional connection was obtained by averaging weights across all trials of leave-one-out cross-validation (LOOCV). We defined the classification weight of a brain region as the sum of the classification weight of all the connections to and from that brain region. The classification weight of each brain network was evaluated by summing the classification weight of all the regions within that brain network. The brain regions whose classification weights were two SDs higher than the average classification weight of brain regions contributing to classification were defined as the important brain regions.
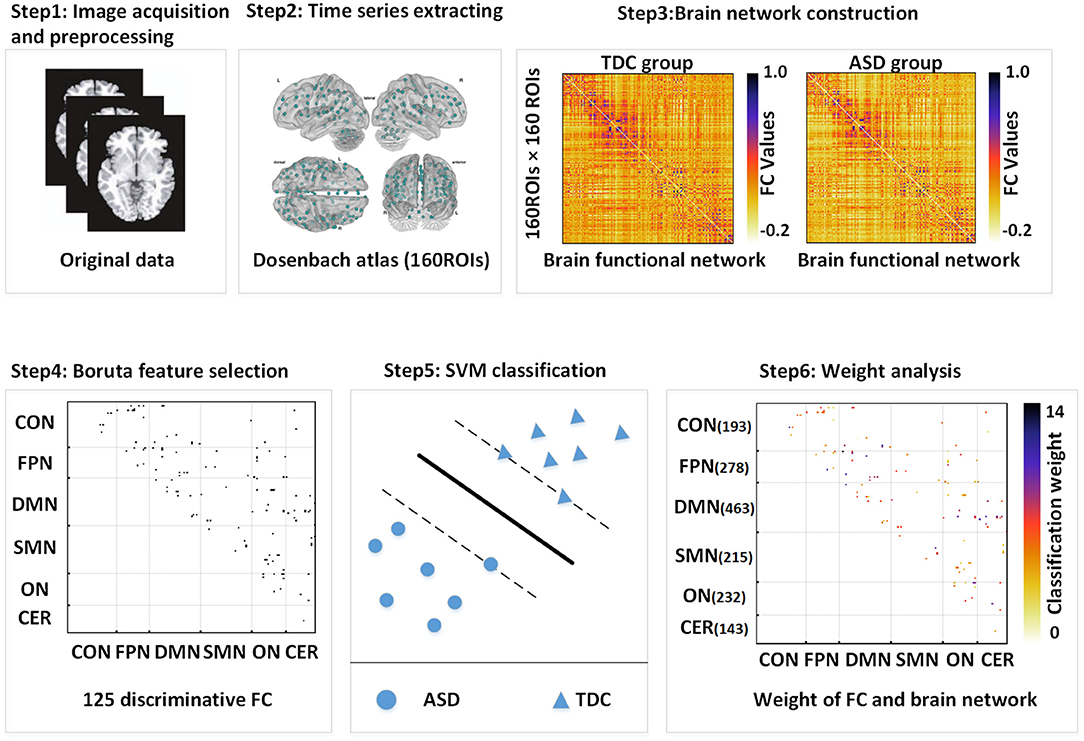
Figure 1. The Boruta-SVM process flowchart. FC, functional connection; SVM, support vector machine; DMN, default mode network; FPN, frontoparietal network; CON, cingulo-opercular network; SMN, sensorimotor network; ON, occipital network; CN, cerebellum network.
The Pearson correlation analyses were performed between the classification scores of the functional connections and ASD symptoms including the Autism Diagnostic Observation Schedule (ADOS: ADOS_total, ADOS_communication, and ADOS_social) and Autism Diagnostic Interview-Revised (ADI_R: ADI_R_social total and ADI_R_verbal total). The p = 0.05 was set as the statistical threshold. We employed a permutation test to evaluate the statistical significance of classification accuracy (Golland and Fischl, 2003). Specifically, after randomly permuting the labels corresponding to the training samples, we trained the classifier on the permuted training samples and then performed validation. The permutation process was conducted 10,000 times in total. It is assumed that classification performance is reliable when the generalization rate obtained by the classifier trained on the real class labels is higher than the 95% CI of the classifier trained on randomly relabeled class labels. To comprehensively evaluate the classification performance, we also assessed sensitivity and specificity. These two measures are commonly utilized together to estimate the predictive performance of a classification model. The sensitivity indicates the proportion of positive predictions in the group of patients, and the specificity indicates the proportion of negative predictions in the group of healthy controls.
The results indicated that 92.9% of subjects were correctly classified using an SVM method by LOOCV (sensitivities = 95.8% and specificities = 90.0%). The classification features were extracted using the Boruta method, and a total of 125 ASD-related functional connections were selected. The distribution of the permutation tests (10,000 times) showed that our classification accuracy (92.9%) was significantly higher than the random level (p < 0.0001, Figure 2).
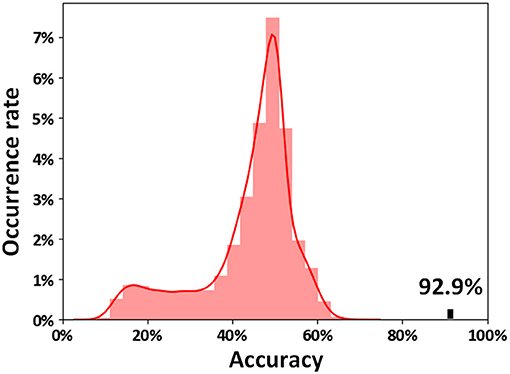
Figure 2. Permutation distribution of the classification accuracy estimate. The permutation was repeated 10,000 times, resulting in 10,000 classification accuracies based on random labels. The classification accuracy (92.9%) based on the true labels exceeded each of the classification accuracies resulting from the permutation, indicating that our classifier can reliably learn the relationship between the features and the labels with a probability higher than the predetermined 95% criterion.
The DMN exhibited the highest ND, followed by the FPN and ON (Figure 3A). As shown in Figure 3B, three interregional connectivity patterns were detected by k-means clustering based on the ASD-related functional connections. Specifically, the DMN and ON showed relatively higher ND in pattern 1, while relatively higher ND was found in the DMN and FPN in pattern 2. Pattern 3 showed lower ND in each network and a higher proportion of within-network connections than other patterns.
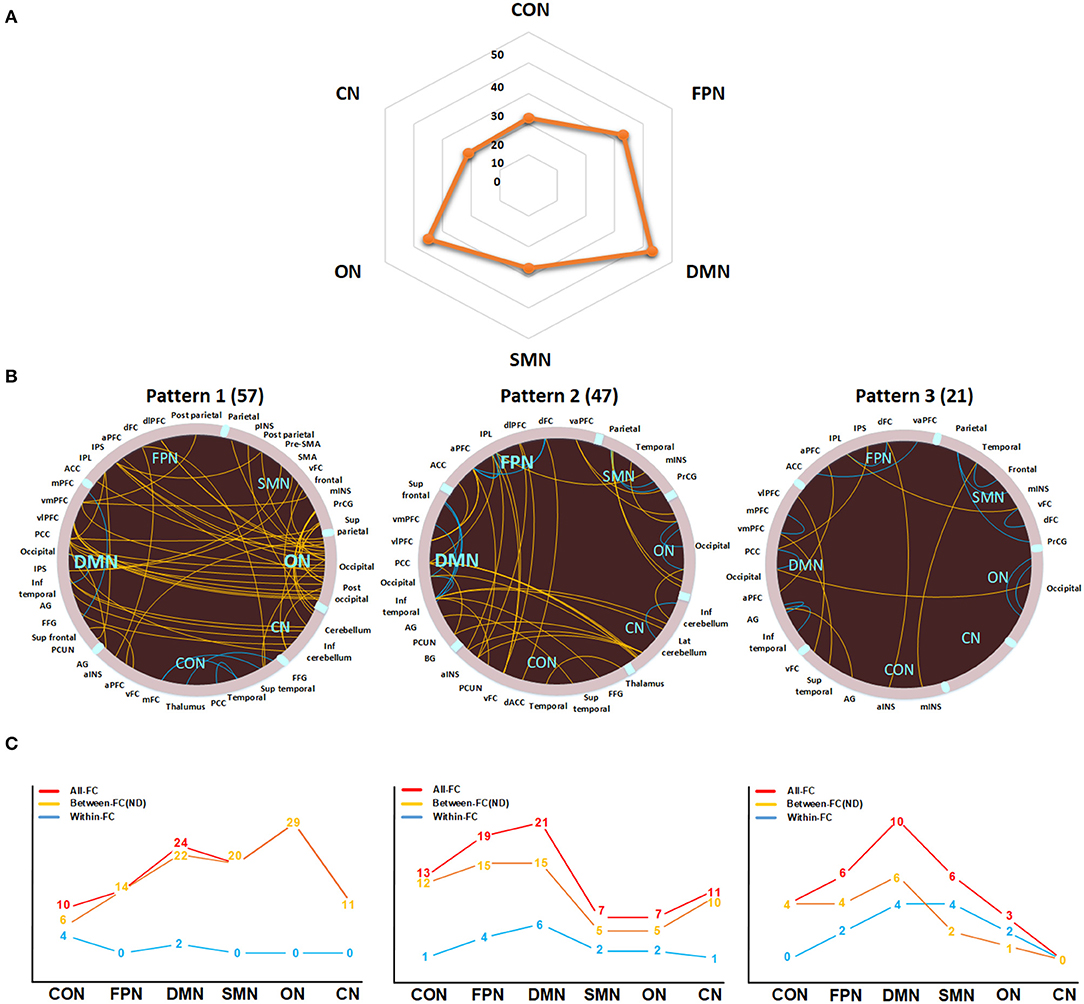
Figure 3. Network degree (ND) analysis of ASD-related functional connections. (A) The ND distribution of six networks. (B) The three functional connectivity patterns identified by k-means clustering. Patterns 1, 2, and 3 consist of 57, 47, and 21 functional connections, respectively. The yellow and blue lines in circles indicate between-network and within-network connections, respectively. The yellow lines in the line charts indicate the ND or the number of between-network connections for each network. The red and blue lines in the line charts indicate the number of functional connections and within-network functional connections for each network, respectively. FC, functional connection; DMN, default mode network; FPN, frontoparietal network; CON, cingulo-opercular network; SMN, sensorimotor network; ON, occipital network; CN, cerebellum network; a, anterior; d, dorsal; dl, dorsolateral; inf, inferior; Lat, lateral; med, medial; post, posterior; sup, superior; v, ventral; vm, ventromedial; vl, ventrolateral; ACC, anterior cingulate cortex; AG, angular gyrus; BG, basal ganglia; FFG, fusiform gyrus; INS, insula; IPL, inferior parietal lobe; IPS, intraparietal sulcus; mINS, middle insula; PCC, posterior cingulate cortex; PCUN, precuneus; PFC, prefrontal cortex; PrCG, precentral gyrus; SMA, supplementary motor area.
As shown in Figure 4, eight important brain regions were identified and ranked by classification weights, including the PCC, ventrolateral prefrontal cortex (vlPFC), anterior prefrontal cortex, superior parietal lobe, inferior parietal lobe, posterior occipital lobe, superior temporal sulcus, and angular gyrus. Most regions were part of the DMN or FPN. Furthermore, the DMN and FPN exhibited higher classification weights.
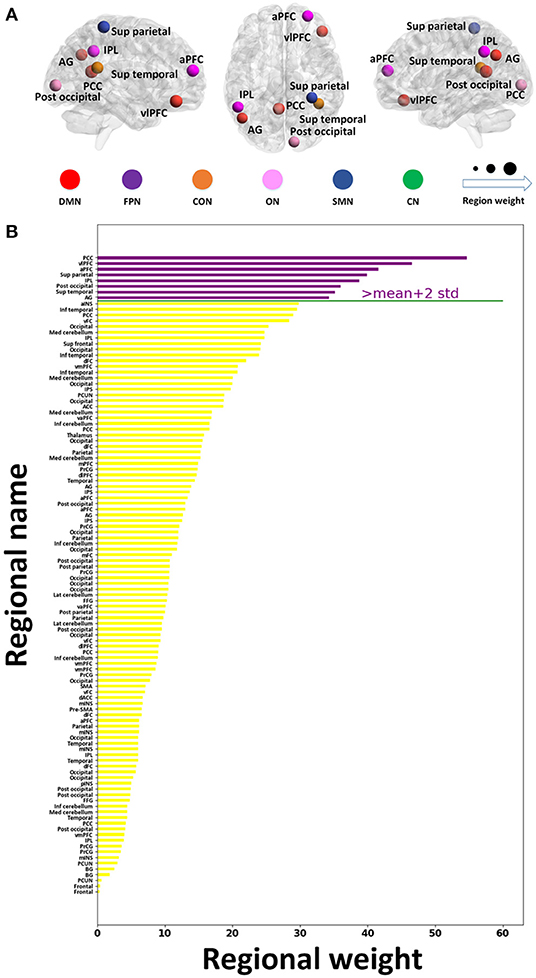
Figure 4. Regional importance in the resting-state network. (A) The location of the top eight important brain regions. (B) Regional importance ranking. The important regions whose classification weights are two SDs above the mean classification weights of all the discriminative regions are presented with purple bars. The y- and x-labels represent the regional name and classification weight, respectively. a, anterior; d, dorsal; dl, dorsolateral; inf, inferior; Lat, lateral; med, medial; post, posterior; sup, superior; v, ventral; vm, ventromedial; vl, ventrolateral; ACC, anterior cingulate cortex; AG, angular gyrus; BG, basal ganglia; FFG, fusiform gyrus; INS, insula; IPL, inferior parietal lobe; IPS, intraparietal sulcus; mINS, middle insula; PCC, posterior cingulate cortex; PCUN, precuneus; PFC, prefrontal cortex; PrCG, precentral gyrus; SMA, supplementary motor area.
As shown in Figure 5; Table 2, there was a significantly negative correlation (p < 0.05) between the classification scores of five DMN-related functional connections and ASD symptoms measured by clinical scales (ADI_R_social total, ADI_R_verbal total, or ADOS_communication) in patients with ASD. The classification scores of fourteen functional connections were positively correlated (p < 0.05) with ASD symptoms (ADI_R_social total, ADI_R_verbal total, ADOS_total, ADOS_social, or ADOS_communication) in patients with ASD.
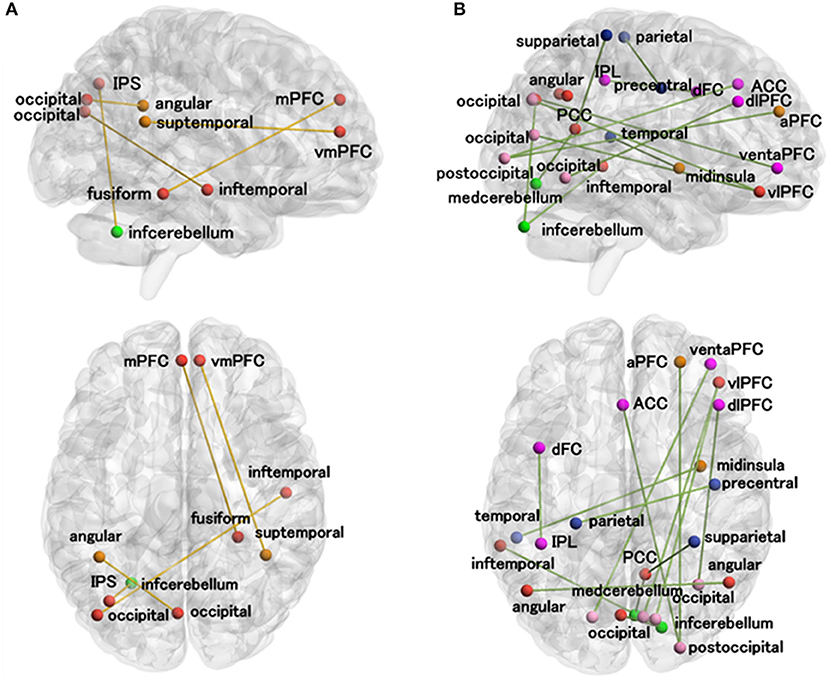
Figure 5. Correlations between the functional connection classification scores and clinical scales in patients with ASD. (A) The functional connections whose classification scores were negatively correlated with at least one of the ASD measures (ADI_R_social total, ADI_R_verbal total, or ADOS_communication). (B) The functional connections whose classification scores were positively correlated with at least one of the ASD measures (ADI_R_social total, ADI_R_verbal total, ADOS_total, ADOS_social total, and ADOS_communication). The meanings of the regional colors are the same as in Figure 3B. a, anterior; d, dorsal; inf, inferior; post, posterior; sup, superior; dl, dorsolateral; vm, ventromedial; v, ventral; vl, ventrolateral; ACC, anterior cingulate cortex; AG, angular gyrus; fusiform gyrus, FFG; IPL, inferior parietal lobe; IPS, intraparietal sulcus; ITG, inferior temporal gyrus; med, medial; mINS, middle insula; mPFC, medial prefrontal cortex; PCC, posterior cingulate cortex; PFC, prefrontal cortex; PrCG, precentral gyrus.
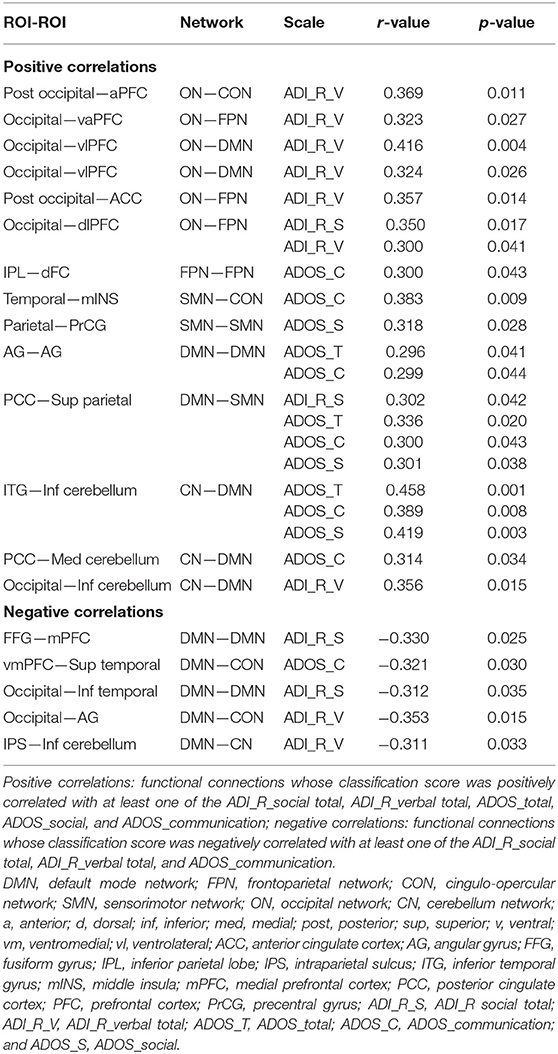
Table 2. Correlations between classification score and clinical scales of functional connections in ASD.
In this study, we distinguished patients with ASD from TDC based on resting-state interregional functional connections using a Boruta-SVM approach. A high classification accuracy of 92.9% was achieved based on the classification features of ASD-related functional connections by means of the Boruta feature selection method. The DMN exhibited a high ND with a larger classification weight. The eight important brain regions with high classification weights, including the PCC, vlPFC, aPFC, superior parietal lobe, inferior parietal lobe, posterior occipital lobe, superior temporal sulcus, and angular gyrus, were primarily located in the DMN and FPN. Thereinto, the PCC and vlPFC presented relatively high discriminative power. We found statistically significant correlations between the classification scores of several ASD-related functional connections and ASD symptoms. The DMN was negatively correlated with ASD symptoms. These findings highlighted an important role of the DMN in distinguishing ASD patients from TDC.
We proposed the Boruta method to select features reflecting ASD-related functional connectivity patterns. The Boruta method recognizes features relevant to the target and was used to construct an interpretable predictive model (Kursa et al., 2010). Most of the previous combined SVM and R-fMRI studies were mainly dedicated to identifying features that were useful for making accurate predictions, but the limitation of those studies was that the interpretability of the predictive model was seldom assessed (Wee et al., 2012). We employed the ND to describe classification features selected using the Boruta method. The highest ND was found in the DMN and might suggest a predominance in the ASD-related functional connectivity pattern. According to the results of the weight analysis, we found that these functional connections involved in the DMN were of high discriminative power during SVM classification, highlighting the importance of the DMN. These findings were consistent with previous results showing an abnormal DMN connectivity pattern in ASD (Cheng et al., 2015; Abbott et al., 2016). For example, patients with ASD exhibited reduced network integration (reduced within-network connections) and increased out-of-network connections for the DMN (Abbott et al., 2016). Furthermore, increased functional connectivity between the DMN and salience network was associated with a higher cognitive impairment in ASD (Abbott et al., 2016). Together, these findings suggest that the DMN might be considered a relevant locus for ASD identification.
The FPN exhibited a relatively higher classification weight and ND in pattern 2, indicating a potential high contribution to the ASD-related functional connectivity pattern. The FPN is crucial for coordinating behavior in an accurate, rapid, and flexible goal-driven manner (Bareham et al., 2018; Fiebelkorn et al., 2018). A growing number of studies implicate the FPN as a neural substrate for impaired executive function, which is a frequently reported symptom of ASD, thus prompting researchers to further examine the potential contribution of the FPN to the underlying pathophysiology of ASD. For example, a significantly decreased FPN-insular participation coefficient was found in children with ASD during a task with executive function demand (Lynch et al., 2017). A previous study demonstrated that patients with ASD exhibited lower levels of network integration in the FPN and that reduced FPN connectivity was related to attention deficit symptoms in the ASD group (Solomon et al., 2009), indicating that functional connection disruptions of the FPN involved in the clinical symptoms of ASD.
This study found that the PCC and vlPFC were the two most discriminative regions. As a central region of the DMN, The PCC showed abnormalities in many neurological and psychiatric disorders including ASD (Sun et al., 2012; Yang et al., 2016). For example, ASD exhibited hypoconnectivity between the PCC and other regions within the DMN (Weng et al., 2010). Moreover, the hyperconnectivity of the PCC with the parahippocampal gyrus has been shown to relate with the severity of ASD symptoms measured by the ADOS (Lynch et al., 2013). The vlPFC is an important region in the FPN that involves goal-appropriate response selection and response inhibition (Aron et al., 2004). Patients with ASD showed significantly decreased brain activation in the vlPFC when participating in a temporal discounting task (Murphy et al., 2017). The functional connection of the vlPFC with the anterior cingulate cortex was associated with the performance of a cognitive control task (Solomon et al., 2014). Compared with TDC, patients with ASD had weaker activation in the occipital area which is mostly associated with face processing (Renzi et al., 2015). Increasing evidence suggests associations between abnormal face processing and impaired social function in ASD (Nomi and Uddin, 2015). A study combining DTI and fMRI found that abnormal structural connectivity and functional activation of the occipital cortex were related to social communication deficits in patients with ASD (Jung et al., 2019).
In the ASD group, several classification scores of functional connections were significantly correlated with ASD symptoms, indicating that the ASD-related functional connectivity pattern has the potential to reflect symptom severity. Notably, the functional connections whose classification scores were correlated with ASD symptoms were widely distributed throughout the whole brain, further supporting the hypothesis that the clinical characteristics of ASD were represented in aberrant functional interactions in large-scale brain networks (He et al., 2007; Fiebelkorn et al., 2018). Functional connections whose classification scores were negatively correlated with ASD symptoms were connected from/to the DMN, which might imply a close relationship between the DMN and ASD symptoms.
Previous studies proposed different pipelines to classify ASD from TDC, while most efforts were made to improve accuracy, and the clinical relevance was partly overlooked. This study further decodes the connectivity patterns which could be used to distinguish ASD from TDC. In addition, we not only replicated the important role of the DMN in ASD from the classification of the disease but also identified the relationships between autistic symptom severity and classification weight of the DMN. These results suggested that the clinical relevance of features served more focus in the machine learning study of R-fMRI studies.
Notably, the functional connections whose classification scores were correlated with ASD symptoms were widely distributed throughout the whole brain, further supporting the hypothesis that the clinical characteristics of ASD were represented in aberrant functional interactions in large-scale brain networks (He et al., 2007; Fiebelkorn et al., 2018). Functional connections whose classification scores were negatively correlated with ASD symptoms were connected from/to the DMN, which might imply a close relationship between the DMN and ASD symptoms.
Two limitations should be considered. First, only male patients were included in the present analysis because ASD is more prevalent among males than among females in the general population; however, this might limit the generalizability of our findings. Therefore, further studies should take into account the relationship between gender and ASD. Second, this study demonstrates that the DMN might play a key role in ASD; however, how the DMN specifically interacts with ASD symptoms needs more in-depth research.
We demonstrated that the ASD-related functional connections identified by the Boruta method could be regarded as features to differentiate patients with ASD from TDC. This finding indicated that resting-state interregional functional connections might provide neuroimaging-based information to clinically assist with the diagnosis of ASD. In particular, the DMN and its core region (the PCC) exhibited high discriminative power for identifying ASD, thereby highlighting the important role of the DMN in understanding the potential pathophysiology of ASD.
Publicly available datasets were analyzed in this study. This data can be found here: Autism Brain Imaging Data Exchange (ABIDE), http://fcon_1000.projects.nitrc.org/indi/abide/.
The studies involving human participants were reviewed and approved by Hangzhou Normal University. Written informed consent to participate in this study was provided by the participants' legal guardian/next of kin.
LZ and Y-KS analyzed the data and summarized the results. LZ and S-WX organized the manuscript and wrote the first draft of the manuscript. X-DL and L-HZ revised the manuscript. All authors have read and approved the final manuscript.
This study was supported by the Zhejiang Medical and Health Science and Technology Project (2022KY1055), the Natural Science Foundation of Zhejiang Province (LY17H180007), the Key Medical Disciplines of Hangzhou, and The Affiliated Hospital of Hangzhou Normal University.
The authors declare that the research was conducted in the absence of any commercial or financial relationships that could be construed as a potential conflict of interest.
All claims expressed in this article are solely those of the authors and do not necessarily represent those of their affiliated organizations, or those of the publisher, the editors and the reviewers. Any product that may be evaluated in this article, or claim that may be made by its manufacturer, is not guaranteed or endorsed by the publisher.
Abbott, A. E., Nair, A., Keown, C. L., Datko, M., Jahedi, A., Fishman, I., et al. (2016). Patterns of atypical functional connectivity and behavioral links in autism differ between default, salience, and executive networks. Cereb. Cortex 26, 4034–4045. doi: 10.1093/cercor/bhv191
Aron, A. R., Robbins, T. W., and Poldrack, R. A. (2004). Inhibition and the right inferior frontal cortex. Trends Cogn. Sci. 8, 170–177. doi: 10.1016/j.tics.2004.02.010
Bareham, C. A., Georgieva, S. D., Kamke, M. R., Lloyd, D., Bekinschtein, T. A., and Mattingley, J. B. (2018). Role of the right inferior parietal cortex in auditory selective attention: an rTMS study. Cortex 99, 30–38. doi: 10.1016/j.cortex.2017.10.003
Biswal, B. B. (2012). Resting state fMRI: a personal history. Neuroimage 62, 938–944. doi: 10.1016/j.neuroimage.2012.01.090
Bullmore, E., and Sporns, O. (2012). The economy of brain network organization. Nat Rev Neurosci 13, 336–349. doi: 10.1038/nrn3214
Cheng, W., Rolls, E. T., Gu, H. G., Zhang, J., and Feng, J. F. (2015). Autism: reduced connectivity between cortical areas involved in face expression, theory of mind, and the sense of self. Brain 138, 1382–1393. doi: 10.1093/brain/awv051
Dosenbach, N. U., Nardos, B., Cohen, A. L., Fair, D. A., Power, J. D., Church, J. A., et al. (2010). Prediction of individual brain maturity using fMRI. Science 329, 1358–1361. doi: 10.1126/science.1194144
Fiebelkorn, I. C., Pinsk, M. A., and Kastner, S. (2018). A dynamic interplay within the frontoparietal network underlies rhythmic spatial attention. Neuron 99, 842–853. doi: 10.1016/j.neuron.2018.07.038
Geng, X. F., Xu, J. H., Liu, B. L., and Shi, Y. G. (2018). Multivariate classification of major depressive disorder using the effective connectivity and functional connectivity. Front. Neurosci. 12, 38. doi: 10.3389/fnins.2018.00038
Golland, P., and Fischl, B. (2003). Permutation tests for classification: towards statistical significance in image-based studies. Inf. Process. Med. Imaging 18, 330–341. doi: 10.1007/978-3-540-45087-0_28
He, B. J., Snyder, A. Z., Vincent, J. L., Epstein, A., Shulman, G. L., and Corbetta, M. (2007). Breakdown of functional connectivity in frontoparietal networks underlies behavioral deficits in spatial neglect. Neuron 53, 905–918. doi: 10.1016/j.neuron.2007.02.013
Hull, J. V., Dokovna, L. B., Jacokes, Z. J., Torgerson, C. M., Irimia, A., and Van Horn, J. D. (2017). Resting-state functional connectivity in autism spectrum disorders: a review. Front Psychiatry 7, 205. doi: 10.3389/fpsyt.2016.00205
Jung, M. Y., Tu, Y. H., Lang, C. A., Ortiz, A., Park, J., Jorgenson, K., et al. (2019). Decreased structural connectivity and resting-state brain activity in the lateral occipital cortex is associated with social communication deficits in boys with autism spectrum disorder. Neuroimage 190, 205–212. doi: 10.1016/j.neuroimage.2017.09.031
Kursa, M. B., Jankowski, A., and Rudnicki, W. R. (2010). Boruta – a system for feature selection. Fund. Inform. 101, 271–285. doi: 10.3233/FI-2010-288
Lau, W. K. W., Leung, M. K., and Lau, B. W. M. (2019). Resting-state abnormalities in autism spectrum disorders: a meta-analysis. Sci. Rep. 9, 3892 doi: 10.1038/s41598-019-40427-7
Li, J., Sun, Y., Huang, Y., Bezerianos, A., and Yu, R. (2019). Machine learning technique reveals intrinsic characteristics of schizophrenia: an alternative method. Brain Imaging Behav. 13, 1386–1396. doi: 10.1007/s11682-018-9947-4
Lynch, C. J., Breeden, A. L., You, X. Z., Ludlum, R., Gaillard, W. D., Kenworthy, L., et al. (2017). Executive dysfunction in autism spectrum disorder is associated with a failure to modulate frontoparietal-insular hub architecture. Biol. Psychiatry Cogn. N 2, 537–545. doi: 10.1016/j.bpsc.2017.03.008
Lynch, C. J., Uddin, L. Q., Supekar, K., Khouzam, A., Phillips, J., and Menon, V. (2013). Default mode network in childhood autism: posteromedial cortex heterogeneity and relationship with social deficits. Biol. Psychiatry 74, 212–219. doi: 10.1016/j.biopsych.2012.12.013
Minshew, N. J., and Williams, D. L. (2007). The new neurobiology of autism: cortex, connectivity, and neuronal organization. Arch. Neurol. 64, 945–950. doi: 10.1001/archneur.64.7.945
Monk, C. S., Peltier, S. J., Wiggins, J. L., Weng, S. J., Carrasco, M., Risi, S., et al. (2009). Abnormalities of intrinsic functional connectivity in autism spectrum disorders. Neuroimage 47, 764–772. doi: 10.1016/j.neuroimage.2009.04.069
Murphy, C. M., Christakou, A., Giampietro, V., Brammer, M., Daly, E. M., Ecker, C., et al. (2017). Abnormal functional activation and maturation of ventromedial prefrontal cortex and cerebellum during temporal discounting in autism spectrum disorder. Hum. Brain Mapp. 38, 5343–5355. doi: 10.1002/hbm.23718
Nomi, J. S., and Uddin, L. Q. (2015). Face processing in autism spectrum disorders: From brain regions to brain networks. Neuropsychologia 71, 201–216. doi: 10.1016/j.neuropsychologia.2015.03.029
Padmanabhan, A., Lynch, C. J., Schaer, M., and Menon, V. (2017). The default mode network in autism. Biol. Psychiatry Cogn. Neurosci. Neuroimaging 2, 476–486. doi: 10.1016/j.bpsc.2017.04.004
Renzi, C., Ferrari, C., Schiavi, S., Pisoni, A., Papagno, C., Vecchi, T., et al. (2015). The role of the occipital face area in holistic processing involved in face detection and discrimination: A tDCS study. Neuropsychology 29, 409–416. doi: 10.1037/neu0000127
Riaz, A., Asad, M., Alonso, E., and Slabaugh, G. (2018). Fusion of fMRI and non-imaging data for ADHD classification. Comput. Med. Imaging Graph 65, 115–128. doi: 10.1016/j.compmedimag.2017.10.002
Solomon, M., Ozonoff, S. J., Ursu, S., Ravizza, S., Cummings, N., Ly, S., et al. (2009). The neural substrates of cognitive control deficits in autism spectrum disorders. Neuropsychologia 47, 2515–2526. doi: 10.1016/j.neuropsychologia.2009.04.019
Solomon, M., Yoon, J. H., Ragland, J. D., Niendam, T. A., Lesh, T. A., Fairbrother, W., et al. (2014). The development of the neural substrates of cognitive control in adolescents with autism spectrum disorders. Biol. Psychiatry 76, 412–421. doi: 10.1016/j.biopsych.2013.08.036
Sun, L., Cao, Q. J., Long, X. Y., Sui, M. Q., Cao, X. H., Zhu, C. Z., et al. (2012). Abnormal functional connectivity between the anterior cingulate and the default mode network in drug-naive boys with attention deficit hyperactivity disorder. Psychiatry Res. 201, 120–127. doi: 10.1016/j.pscychresns.2011.07.001
Sun, Y., Zhao, L., Lan, Z., Jia, X. Z., and Xue, S. W. (2020). Differentiating boys with ADHD from those with typical development based on whole-brain functional connections using a machine learning approach. Neuropsychiatry Dis. Treat. 16, 691–702. doi: 10.2147/NDT.S239013
Van Loo, K. M., and Martens, G. J. (2007). Genetic and environmental factors in complex neurodevelopmental disorders. Curr. Genomics 8, 429–444 doi: 10.2174/138920207783591717
Von dem Hagen, E. A., Stoyanova, R. S., Baron-Cohen, S., and Calder, A. J. (2013). Reduced functional connectivity within and between 'social' resting state networks in autism spectrum conditions. Soc. Cogn. Affect Neurosci. 8, 694–701. doi: 10.1093/scan/nss053
Wee, C. Y., Yap, P. T., Zhang, D., Wang, L., and Shen, D. (2012). Constrained sparse functional connectivity networks for MCI classification. Med. Image Comput. Comput. Assist. Interv. 15, 212–219. doi: 10.1007/978-3-642-33418-4_27
Weng, S. J., Wiggins, J. L., Peltier, S. J., Carrasco, M., Risi, S., Lord, C., et al. (2010). Alterations of resting state functional connectivity in the default network in adolescents with autism spectrum disorders. Brain Res. 1313, 202–214. doi: 10.1016/j.brainres.2009.11.057
Xu, J., Wang, H., Zhang, L., Xu, Z., Li, T., Zhou, Z., et al. (2018). Both hypo-connectivity and hyper-connectivity of the insular subregions associated with severity in children with autism spectrum disorders. Front. Neurosci. 12, 234. doi: 10.3389/fnins.2018.00234
Yang, R., Gao, C., Wu, X., Yang, J., Li, S., and Cheng, H. (2016). Decreased functional connectivity to posterior cingulate cortex in major depressive disorder. Psychiatry Res. Neuroimaging 255, 15–23. doi: 10.1016/j.pscychresns.2016.07.010
Zeng, L. L., Shen, H., Liu, L., Wang, L. B., Li, B. J., Fang, P., et al. (2012). Identifying major depression using whole-brain functional connectivity: a multivariate pattern analysis. Brain 135, 1498–1507. doi: 10.1093/brain/aws059
Keywords: autism spectrum disorder, support vector machine, resting-state functional magnetic resonance neuroimaging (R-fMRI), functional connection (FC), Boruta
Citation: Zhao L, Sun Y-K, Xue S-W, Luo H, Lu X-D and Zhang L-H (2022) Identifying Boys With Autism Spectrum Disorder Based on Whole-Brain Resting-State Interregional Functional Connections Using a Boruta-Based Support Vector Machine Approach. Front. Neuroinform. 16:761942. doi: 10.3389/fninf.2022.761942
Received: 20 August 2021; Accepted: 12 January 2022;
Published: 22 February 2022.
Edited by:
Jiaojian Wang, University of Electronic Science and Technology of China, ChinaReviewed by:
Graham J. Galloway, Herston Imaging Research Facility (HIRF), AustraliaCopyright © 2022 Zhao, Sun, Xue, Luo, Lu and Zhang. This is an open-access article distributed under the terms of the Creative Commons Attribution License (CC BY). The use, distribution or reproduction in other forums is permitted, provided the original author(s) and the copyright owner(s) are credited and that the original publication in this journal is cited, in accordance with accepted academic practice. No use, distribution or reproduction is permitted which does not comply with these terms.
*Correspondence: Shao-Wei Xue, eHVlZHJtQDEyNi5jb20=; Lan-Hua Zhang, YWNtX2ljdEAxNjMuY29t
Disclaimer: All claims expressed in this article are solely those of the authors and do not necessarily represent those of their affiliated organizations, or those of the publisher, the editors and the reviewers. Any product that may be evaluated in this article or claim that may be made by its manufacturer is not guaranteed or endorsed by the publisher.
Research integrity at Frontiers
Learn more about the work of our research integrity team to safeguard the quality of each article we publish.