Department of Biomedical Engineering, Duke University, Durham, NC, USA
Planar electrodes are used in epidural spinal cord stimulation and epidural cortical stimulation. Electrode geometry is one approach to increase the efficiency of neural stimulation and reduce the power required to produce the level of activation required for clinical efficacy. Our hypothesis was that electrode geometries that increased the variation of current density on the electrode surface would increase stimulation efficiency. High-perimeter planar disk electrodes were designed with sinuous (serpentine) variation in the perimeter. Prototypes were fabricated that had equal surface areas but perimeters equal to two, three or four times the perimeter of a circular disk electrode. The interface impedance of high-perimeter prototype electrodes measured in vitro did not differ significantly from that of the circular electrode over a wide range of frequencies. Finite element models indicated that the variation of current density was significantly higher on the surface of the high-perimeter electrodes. We quantified activation of 100 model axons randomly positioned around the electrodes. Input–output curves of the percentage of axons activated as a function of stimulation intensity indicated that the stimulation efficiency was dependent on the distance of the axons from the electrode. The high-perimeter planar electrodes were more efficient at activating axons a certain distance away from the electrode surface. These results demonstrate the feasibility of increasing stimulation efficiency through the design of novel electrode geometries.
Most implanted pulse generators (IPGs) used for neural stimulation are powered with primary cell batteries and require surgical replacement when the battery is depleted. Electrode design is one means to reduce the power requirements and extend the lifetime of existing IPGs, thus reducing both cost and risk associated with repeated IPG replacement surgeries. As well, reduced power demands could enable the use of smaller batteries, thereby reducing the size of IPGs. Previous efforts to increase the efficiency of stimulating electrodes focused on new materials that decreased electrode impedance and/or stimulation thresholds. Oxide coatings including platinized platinum and iridium oxide reduce interface impedance and increase charge capacity for stimulation (Weiland and Anderson, 2000
; Merrill et al., 2005
), but charge capacity during short-duration pulses (∼100 μs) is limited by the rate of electron and ion transport (Cogan, 2008
). Similarly, high surface area porous electrodes reduce interface impedance and pacing thresholds (Mond and Grenz, 2004
), but diffusion limitations prevent accessing the full surface area during short-duration stimulation pulses (Elliott and Owen, 2000
; Weiland and Anderson, 2000
). Steroid-eluting electrodes reduce stimulation thresholds by suppression of inflammation (Mond and Stokes, 1992
) that increases the impedance of implanted electrodes from tissue encapsulation (Stein et al., 1978
; Grill and Mortimer, 1994
). We propose to increase the efficiency of stimulation by alterations of the electrode geometry. The potential advantages of this approach are that novel electrode designs can be implemented with existing manufacturing techniques and will not require the exhaustive biocompatibility testing required for new materials. Further, this approach could be applied in concert with new materials to maximize the efficiency of stimulation.
The proposed approach to increase the efficiency of neural excitation by alterations in the electrode geometry is based on the fundamentals of extracellular neural stimulation. Neural excitation by extracellular sources can be qualitatively predicted with the activating function (f), which is proportional to the second spatial derivative of the extracellular potential (Ve) (i.e., fx ∝ Δ2Ve/Δx2) (Rattay, 1989
). The activating function can be re-written in terms of the current density J and tissue bulk conductivity σ as:
The activating function in the x direction is proportional to the derivative of current density, ΔJx/Δx. Therefore, increasing the spatial non-uniformity of the current density increases ΔJx/Δx, increases fx, and is expected to increase the efficiency of neural excitation. Our design ideas were motivated by geometries that generate higher variation of current density in the tissue than conventional electrodes.
We propose to increase stimulation efficiency by increasing the electrode perimeter. Increasing the electrode perimeter without changing the electrode area is expected to increase the non-uniformity of current density on the electrode surface. Increasing the electrode perimeter by segmenting of cylindrical electrodes increased stimulation efficiency (Wei and Grill, 2005
). To test further the hypothesis that increasing the electrode perimeter increases stimulation efficiency, we investigated high perimeter planar disk electrodes with sinuous (serpentine) variation in the electrode perimeter. Planar electrodes offer a simple, low cost test bed to quantify the effects of increased perimeter on stimulation efficiency, and are of interest for applications including epidural spinal cord stimulation for treatment of pain (Shealy et al., 1967
; Oakley and Prager, 2002
) and epidural cortical stimulation for experimental treatment of epilepsy, pain, and movement disorders (Tsubokawa et al., 1991
; Nguyen et al., 1998
; Katayama et al., 2002
; Kleiner-Fisman et al., 2003
; Rasche et al., 2006
).
The power consumed by the electrode and tissue is equal to  , where it is the current flowing through the tissue and should be above the threshold current, and Zload is the load impedance composed of the series combination of the tissue resistance, the interface impedance of the working electrode, and the interface impedance of the return electrode. It is important to determine how both it and Zload are affected by electrode design to determine efficiency. First, the impedances of prototype serpentine-perimeter electrodes were measured in vitro to quantify the effects of increased perimeter on the interface impedance. Second, finite element models were coupled with cable models of a population of axons to test the hypothesis that increasing the perimeter increases stimulation efficiency by increasing the activating function.
, where it is the current flowing through the tissue and should be above the threshold current, and Zload is the load impedance composed of the series combination of the tissue resistance, the interface impedance of the working electrode, and the interface impedance of the return electrode. It is important to determine how both it and Zload are affected by electrode design to determine efficiency. First, the impedances of prototype serpentine-perimeter electrodes were measured in vitro to quantify the effects of increased perimeter on the interface impedance. Second, finite element models were coupled with cable models of a population of axons to test the hypothesis that increasing the perimeter increases stimulation efficiency by increasing the activating function.Description of Electrode Geometry
The planar electrode designs included a series of circular disks with radii (r0) of ∼5 mm, and serpentine perimeters with different variations in the amplitude (h) and frequency (n) of sinuous variation (i.e., the number of periods around the perimeter) (Figure 1
A). The radius as a function of the angle, θ, is defined by:

When h is 0, the electrode has a circular perimeter with a diameter of ∼1 cm.
The surface area of the electrode can be calculated by polar integration:
For each period of the sinusoid, the length of the curve can be calculated by:
The electrode perimeter can be calculated as n periods of the sinusoid around the perimeter:

Prototype High-Perimeter Planar Electrodes
Design parameters for the prototype electrodes (Table 1
) were selected such that the effects of perimeter on impedance and stimulation efficiency could be isolated by including multiple samples with the same area but with different perimeters (Figure 1
C). Further, the same perimeters were achieved through different variations in the amplitude and frequency of the sinuous variation, and thus the effects on impedance and stimulation efficiency of increasing perimeter through different means could be assessed.
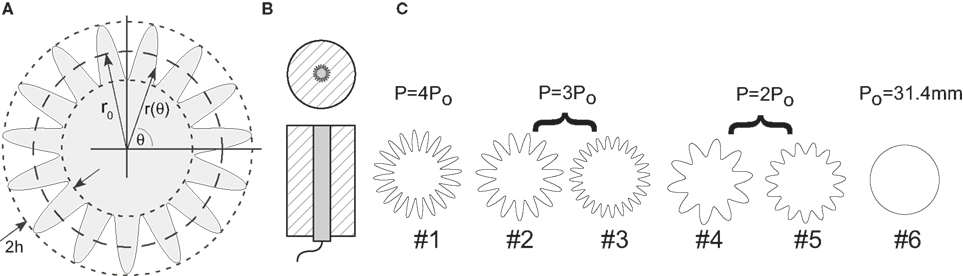
Figure 1. High-perimeter planar electrodes. (A) Planar geometry with serpentine perimeter. (B) Test structure (top and side views) with machined metal sample embedded in epoxy. (C) Test sample geometries with same area (78.5 mm2) but different perimeters (Po = 31.4 mm, 2Po, 3Po and 4Po).
The shape of each sample was machined into the last 5 mm of a 5-cm length of 316L stainless steel (SS) rod using electrical discharge machining. Although clinically used electrodes are more often made of 90% platinum/10% iridium (Pt/Ir), the use of SS results in a substantial cost savings. Further, the impedance properties of SS and Pt/Ir are similar because they both passivate to form oxides on their surface (Jaron et al., 1968
; Geddes and Roeder, 2003
). The rod was centered in a plastic sleeve and encapsulated with epoxy filled flush to the shaped end of the rod (Figure 1
B). The shaped face of the rod was cut perpendicular to the length of the rod and ground flush and polished according to ASTM 03-01, Standard Practice for Preparation of Metallographic Specimens (Vander Voort, 1999
). The other end of the rod was tapped for mechanical and electrical connection. Digital micrographs of the faces of the samples are shown in Figure 2
. The electrode boundaries were traced, and the areas and perimeters of actual samples were calculated using the image processing toolbox of Matlab (Table 1
).
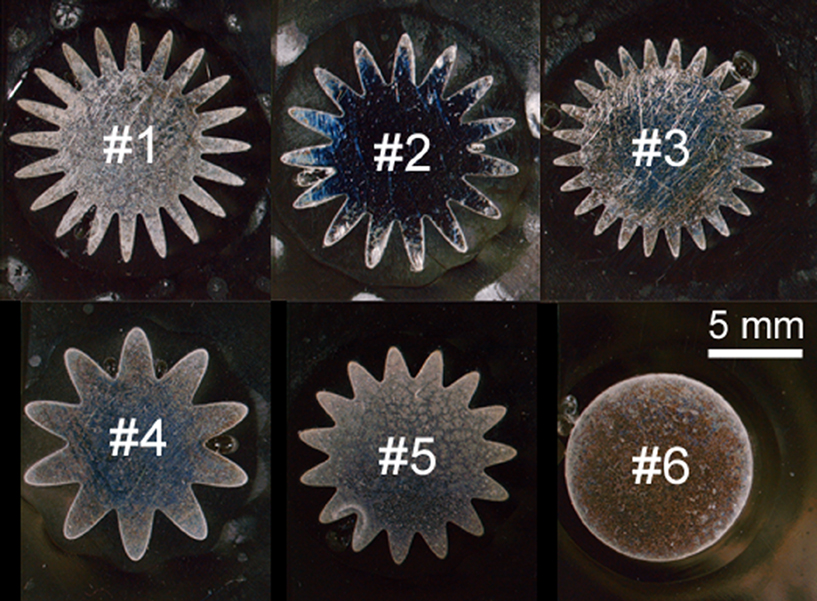
Figure 2. Digital micrographs of the face of each sample (samples #1–#6) illustrated in Figure 1
C.
In Vitro Measurement of Electrode Impedance
The three-electrode technique was used to measure electrode impedance in vitro with an impedance analyzer (Model 1287 Electrochemical Interface + Model 1252 Frequency Response Analyzer, Solartron Analytical, Hampshire, England). The electrode was placed with its planar surface parallel to the ground in the middle of a 1000-ml beaker of physiological saline (0.9% sodium chloride) at room temperature (T ≈ 20°C). Regulated sinusoidal currents with a r.m.s. amplitude of 0.1 mA were applied between the test (working) electrode and a return (counter) electrode formed of SS wire spiraling inside the wall of the beaker at 41 frequencies at equal logarithmic steps between 1 Hz and 10 kHz. The potential between the working electrode and a Ag–AgCl reference electrode (Model RE-5B, BAS Inc., West Lafayette, IN, USA) was measured with the 1252/1287 system which has an input impedance of >10 GΩ in parallel with 50 pF, an amplitude accuracy of 0.2%, and a phase accuracy of 0.2°. The measurement was repeated six times for each electrode sample.
For measurement of voltage transients, electrodes were pulsed with regulated current symmetrical biphasic pulses with amplitude of 1 mA and pulse width of 200 μs, delivered between the working electrode and the counter electrode. Voltage transients were measured between the working electrode and the reference electrode with an isolated differential amplifier (Stanford Research SR560: input impedance >100 MΩ in parallel with 25 pF, frequency response ± 0.5 dB to 1 MHz), captured with a digital oscilloscope (1 M sample/s), and transferred to a computer for storage and analysis.
Finite Element Models of High-Perimeter Planar Electrodes
We developed three-dimensional finite element models of planar electrodes adjacent to a semi-infinite homogenous tissue medium (Figure 3
). The model included an electrode surface with a potential of 1 V, an insulating surface around the electrode, and a homogenous volume conductor representing CNS tissue (σ = 0.2 S/m; Ranck, 1963
). The tissue adjacent to the electrode was modeled as a cylinder with a diameter of 20 cm and a height of 20 cm and the outer boundaries set to ground (V = 0) except for the boundary on the electrode side. The three-dimensional models were implemented in COMSOL Multiphysics (version 3.4, Stockholm, Sweden), and were partitioned into between 32,743 and 34,589 tetrahedral elements. The sizes of the tissue volume and element mesh were set such that doubling the volume of the tissue or reducing the mesh size resulted in <3% change in both the potentials near the electrode surface and the total current delivered by the electrode, calculated by integrating of the current density over the electrode surface. The conjugate gradient method with preconditioning (algebraic multigrid) was used to solve the model.
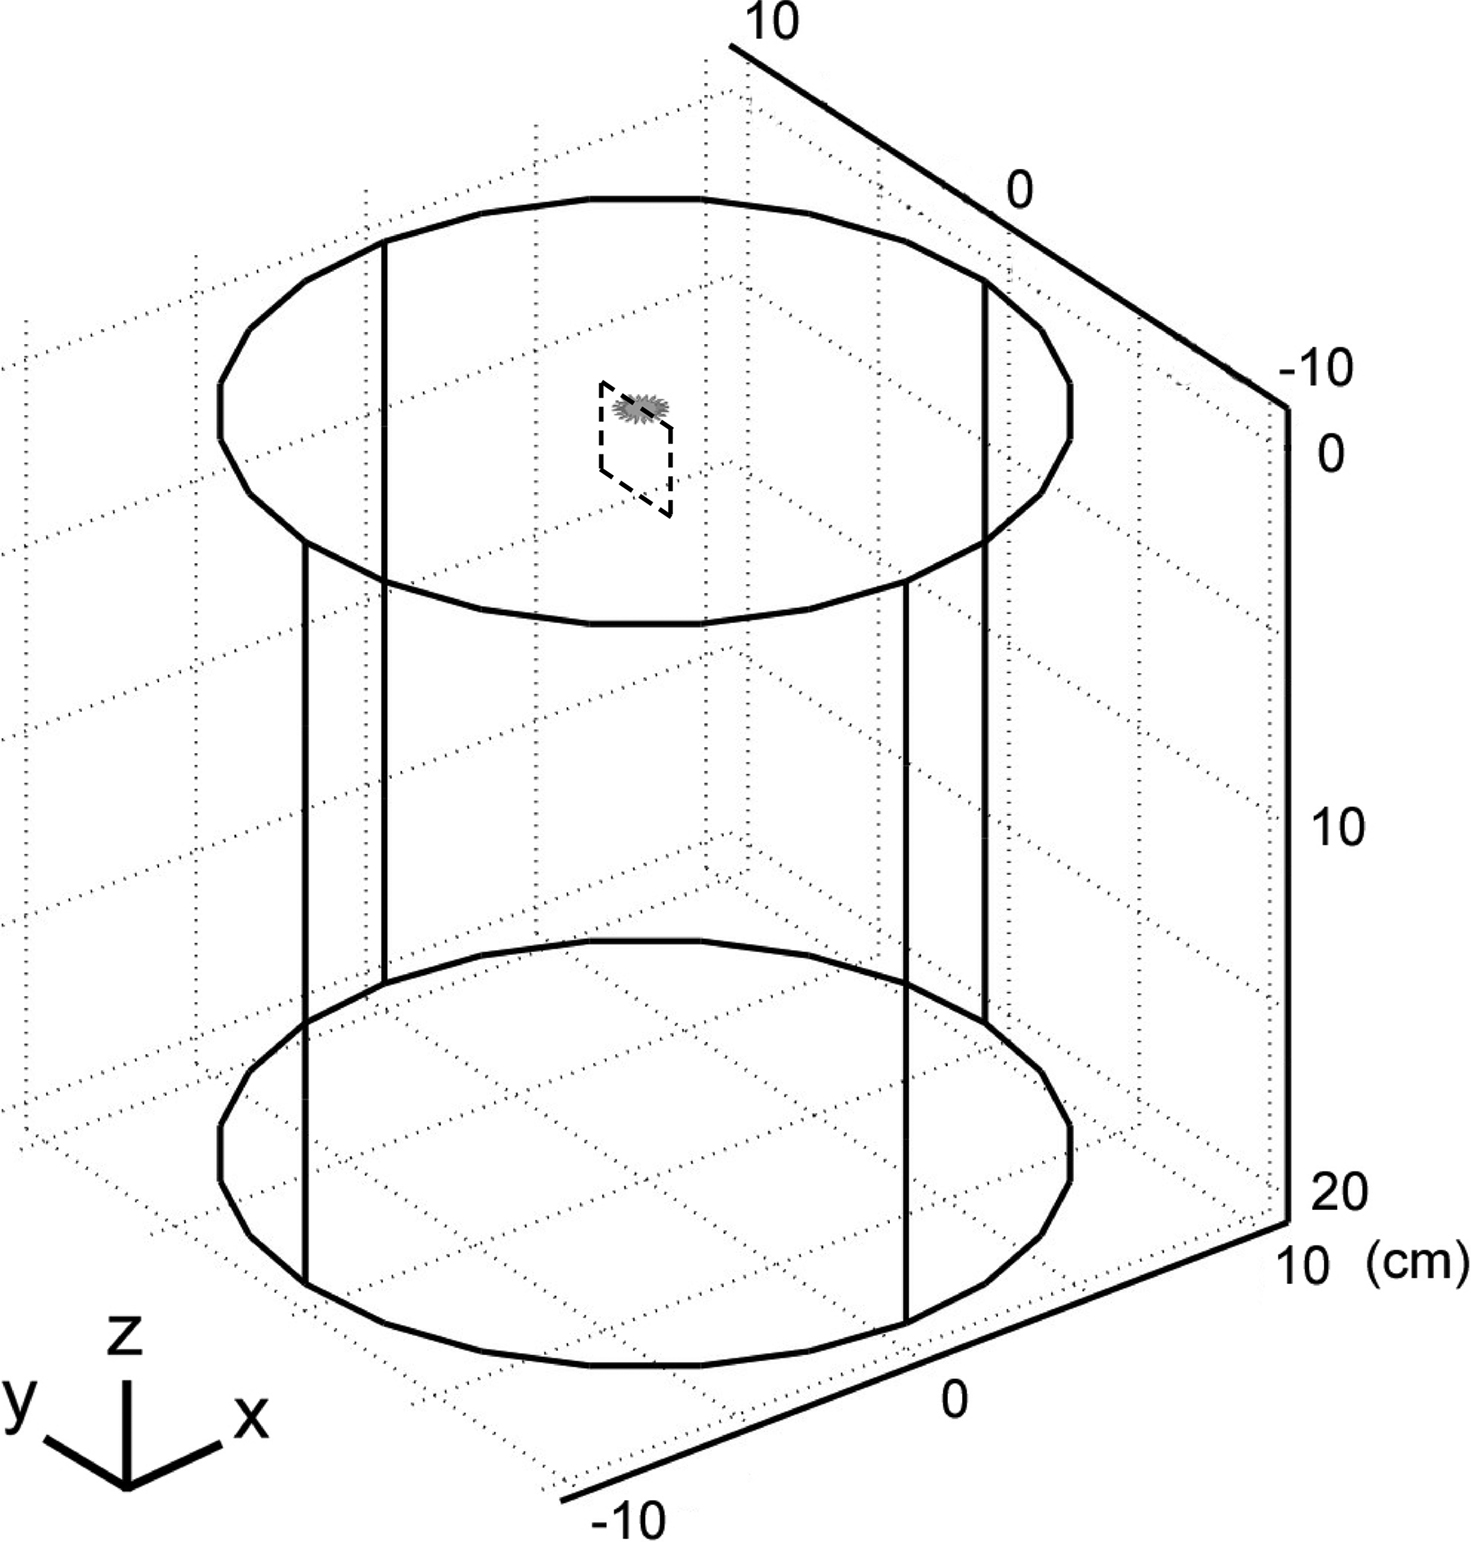
Figure 3. Geometry of the finite element model of a planar electrode (grey) adjacent to a semi-infinite homogenous volume conductor. The tissue medium was modeled as a cylinder 20 cm in diameter and 20 cm in height with a conductivity of 0.2 S/m. The dashed box represents the cross section (range: y: −10 to 10 mm, z: 0 to 20 mm) through which the population of 100 model axons passed, oriented in the x direction.
Computer Simulation of Neuronal Activation
We quantified the stimulation efficiency of different electrode geometries using a population of modeled mammalian myelinated axons. The geometrical parameters of the axon model are summarized in Table 2 and all electrical parameters were as in Sweeney et al. (1987
). The models were implemented in NEURON version 6.1 (Hines and Carnevale, 1997
) and solved using backward Euler implicit integration with a time step of 0.001 ms. The threshold voltages were calculated with a binary search algorithm with a tolerance of 1 μV. We distributed 100 axons parallel to the surface of planar electrodes (oriented in the x direction) randomly positioned inside a 20 mm by 20 mm box (dashed box in Figure 3
). The extracellular potential at each node of Ranvier was determined by quadratic spline interpolation from the potentials solved by the finite element models. Input–output (recruitment) curves of the percentage of activated axons as a function of stimulus amplitude were generated by applying a monophasic cathodic voltage pulse with a pulse width of 100 μs to the planar electrode. Input–output curves of the percentage of activated axons as a function of the power consumption were also generated by multiplying the threshold voltage by the delivered current at the threshold voltage. The second spatial difference of the extracellular voltages (∝fx) was calculated in the region around the electrode using the inter-nodal length of the myelinated model axons as the space step, Δx (=1.2 mm, as in Table 2
) to assist in interpretation of the results.
We quantified both electrode impedance and stimulation threshold to determine the efficiency of high-perimeter planar electrodes. We measured the interface impedance of the electrode prototypes in vitro, calculated the tissue resistance using finite element models, and compared threshold voltage and power consumption by calculating input–output curves of activation in a population of model axons. We primarily illustrate the results of electrode samples #1 and #6, as sample #1 represents the extreme case of high perimeter among the samples and sample #6 acts as the control.
Load Impedance
The load impedance is composed of the series combination of the interface impedance of the stimulating (working) electrode and the tissue resistance between the stimulating electrode and the return electrode. The impedance spectra (amplitude and phase) of electrode samples #1 and #6 are shown in Figure 4
. The series access resistance Rs between the working electrode and the reference electrode, determined from the asymptotic high-frequency impedance, was 34.8 Ω for sample #1, and 37.6 Ω for sample #6. The interface impedance was calculated by subtracting Rs from the measured impedance. Two-way ANOVA indicated that both electrode and frequency had significant effects on interface impedance (p < 0.001). However, post hoc paired comparisons using Fisher’s PLSD method showed there were no significant differences (p > 0.05) between the impedances of sample #1 and sample #6 at most (30 out of 41) of the measured frequencies. Similarly, no significant differences were found between the impedances of sample #1 and samples #2–#5 at most (33–41 out of 41) of the measured frequencies. Thus, there were no systematic differences in the interface impedances across the group of prototype electrodes.
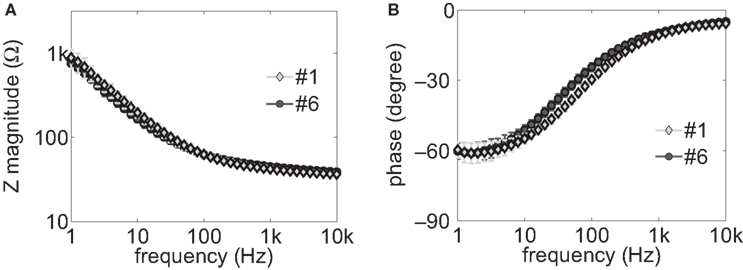
Figure 4. Impedance spectra of the electrode samples #1 and #6. (A) Magnitude spectra. (B) Phase spectra. The impedance spectra were measured in vitro in saline solution with sinusoidal currents with a r.m.s. amplitude of 0.1 mA at 41 frequencies evenly distributed on a log scale from 1 Hz to 10 kHz.
The spreading tissue resistance between each electrode and the ground was calculated with the finite element model by dividing the electrode voltage (1 V) by the total current delivered by the electrode (Figure 5
A). The spreading tissue resistance decreased with increasing perimeter of the planar electrodes, and at the same perimeter (#2 and #3, #4 and #5) the electrode with larger amplitude of the sinuous variation exhibited lower tissue resistance than the electrode with more periods around the perimeter (Figure 5
A).
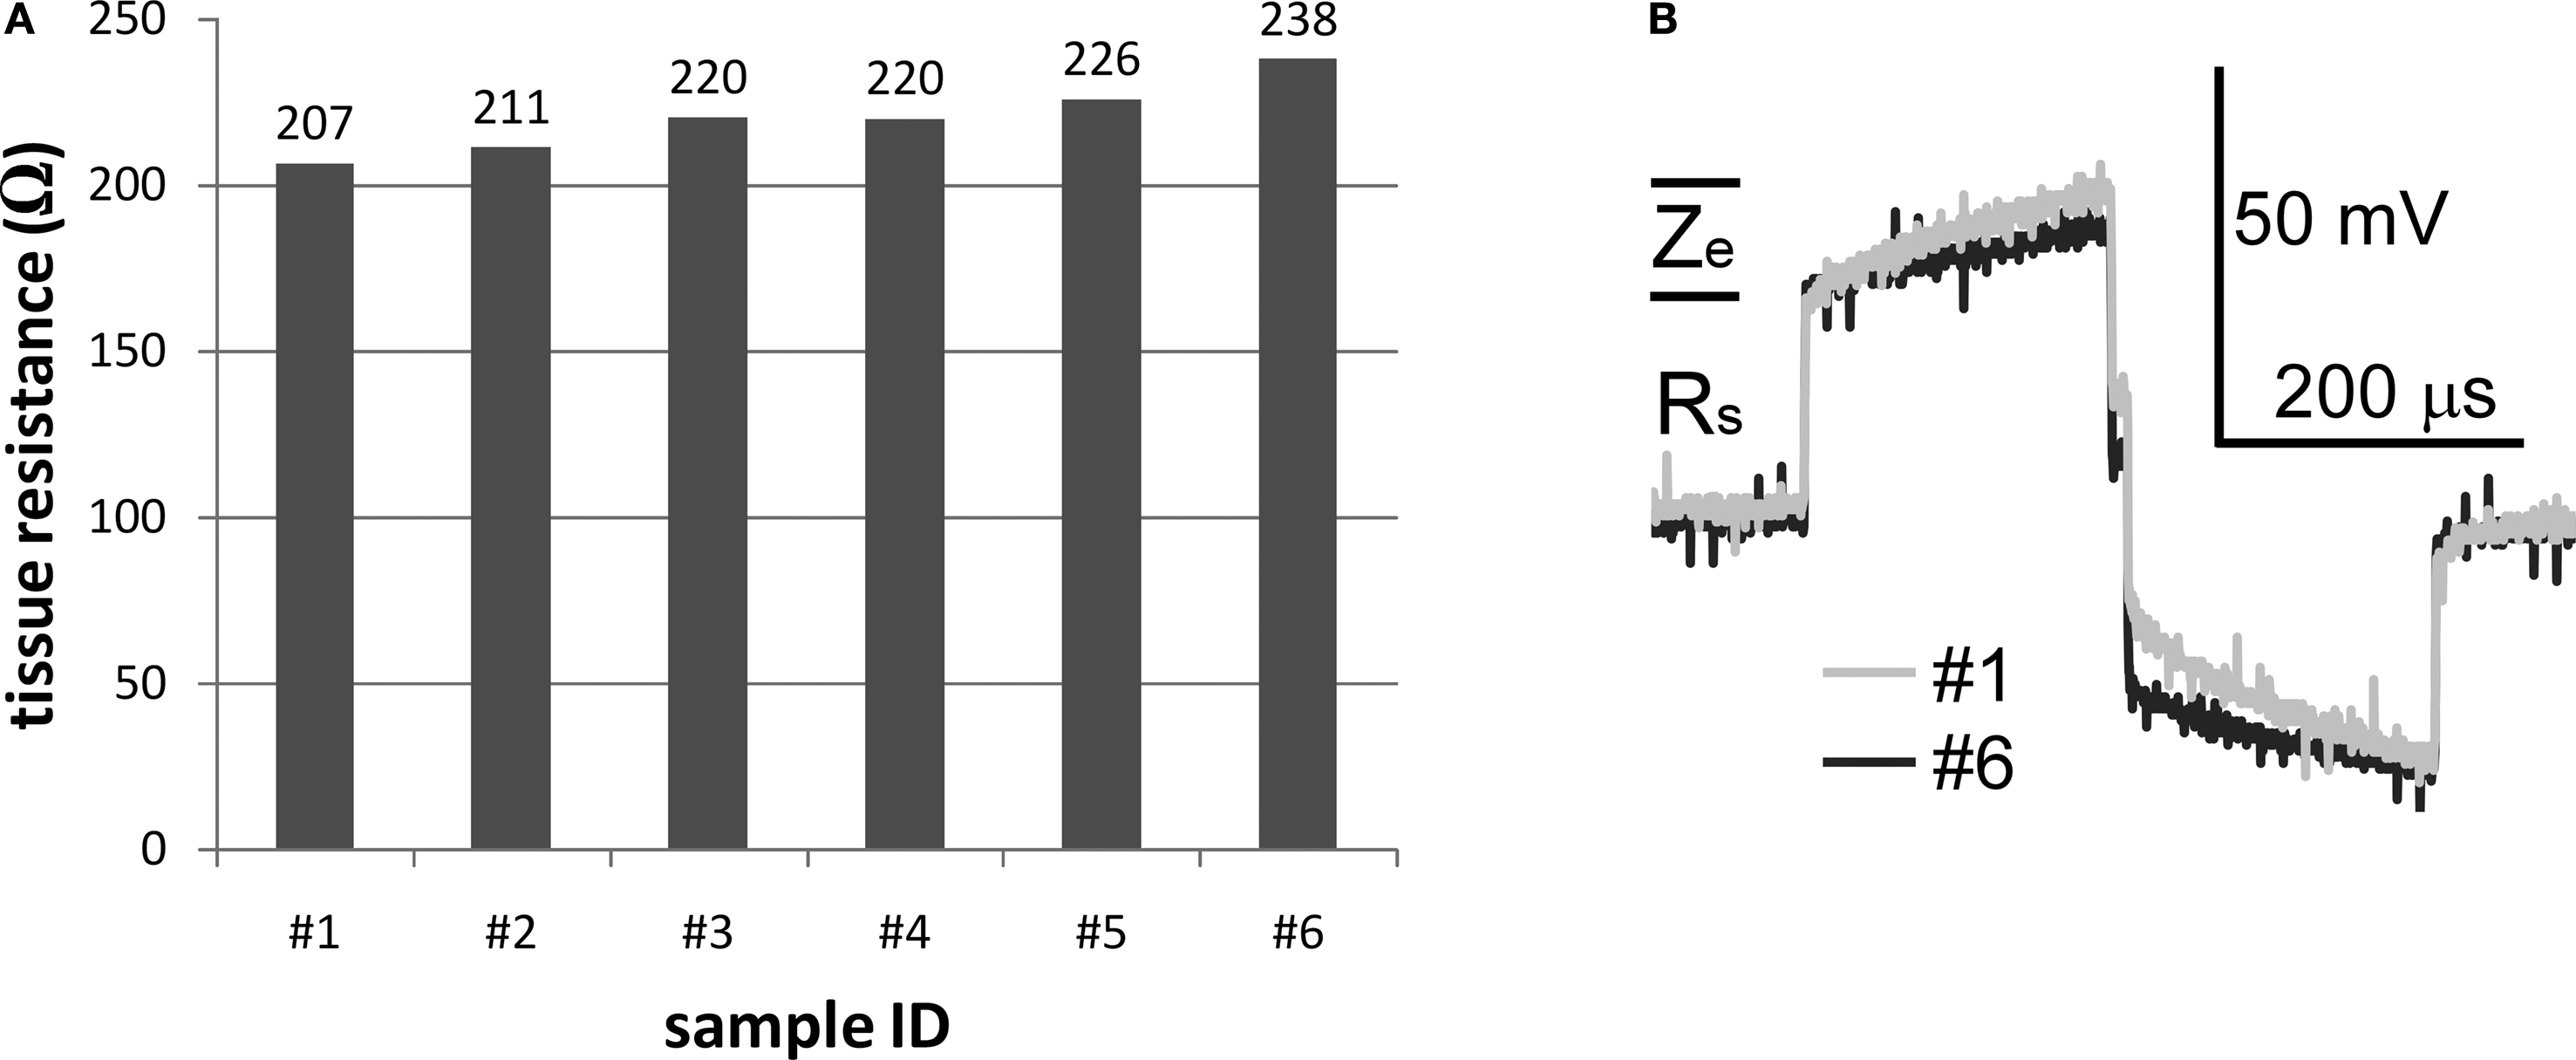
Figure 5. Tissue resistances calculated with the finite element model and voltage responses to rectangular currents measured in vitro. (A) The spreading tissue resistances between the electrode prototypes and the ground calculated with the finite element model. (B) Voltage responses measured in vitro to symmetrical biphasic rectangular currents with amplitudes of 1 mA and pulse widths of 200 μs for electrode samples #1 and #6. The approximate components of the voltage responses attributable to the series resistance (Rs) and the electrode interface impedance (Ze) are indicated.
The voltage responses to symmetrical biphasic rectangular current pulses with amplitudes of 1 mA and pulse widths of 200 μs for electrode samples #1 and #6 are shown in Figure 5
B. The series access resistance Rs caused the instantaneous voltage increase at the onset of the pulse and was ∼30 Ω. The instantaneous interface impedance (Ze) at the end of 200 μs pulse was ∼10 Ω for sample #1, ∼15 Ω for sample #6, and ∼12–15 Ω for samples #2–#5, over one order of magnitude smaller than the spreading tissue resistances (>200 Ω), indicating that most of the voltage drop and power consumption occurred in the tissue and not across the electrode–tissue interface during application of short current pulses.
Distributions of Current Density on the Electrode Surface
The current density distributions on the surface of electrodes #1 and #6 when a constant voltage of 1 V was applied are shown in Figure 6
. Current density increased towards the perimeter of the electrodes. For electrode #1, current density was highly non uniform along the serpentine perimeter, and was highest at the crests and lowest in the troughs. For electrode #6, current density was uniform along the circular perimeter. Thus, the electrodes with serpentine perimeters exhibited more non-uniform patterns of current density.
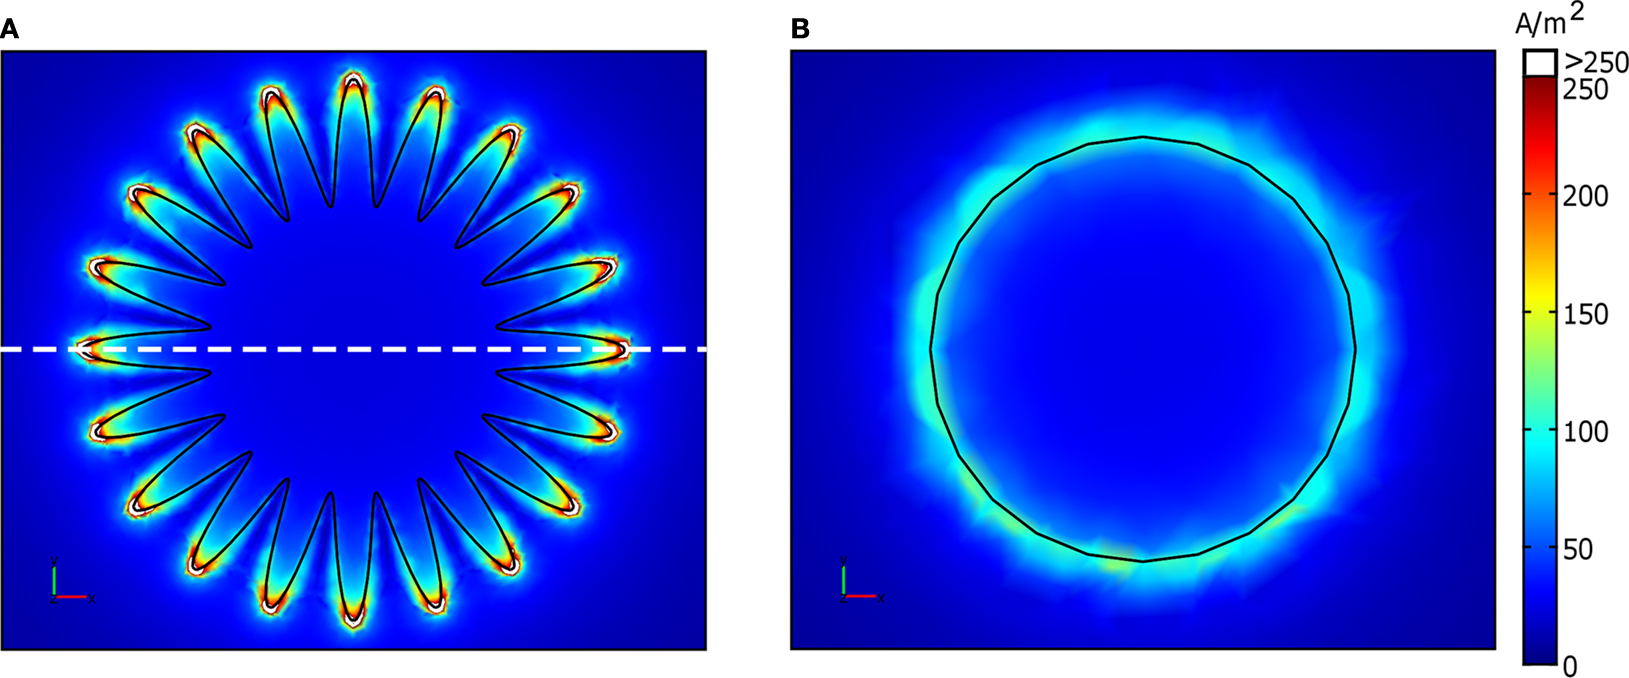
Figure 6. Distributions of current density on the surface of the electrodes when a constant voltage of 1 V was applied. (A) Electrode #1. (B) Electrode #6. The white dashed line in (A) indicates the location beneath which the activating function profiles in Figure 9
were calculated.
Input–Output Curves of Activation of Model Axons
A population of 100 model axons parallel to the surface of the planar electrodes and randomly distributed within 20 mm of the electrode surface (Figure 3
) was used to calculate input–output curves of the percentages of activated axons as a function of stimulus amplitude (Figure 7
A) or stimulus power (Figure 7
B). Electrode #1 decreased the average threshold voltage (Vt) by 10.1 ± 0.6% (n = 5 differently randomized populations of model axons), and decreased the average power consumption by 9.5 ± 1.2% (n = 5), as compared to electrode #6. Electrode #6 activated the first 25 ± 4 (n = 5) axons with lower thresholds, while electrode #1 activated the remaining 75 ± 4 (n = 5) axons with lower thresholds (Figure 7
A inset), suggesting that the serpentine perimeter resulted in more efficient stimulation of axons positioned farther from the electrode.
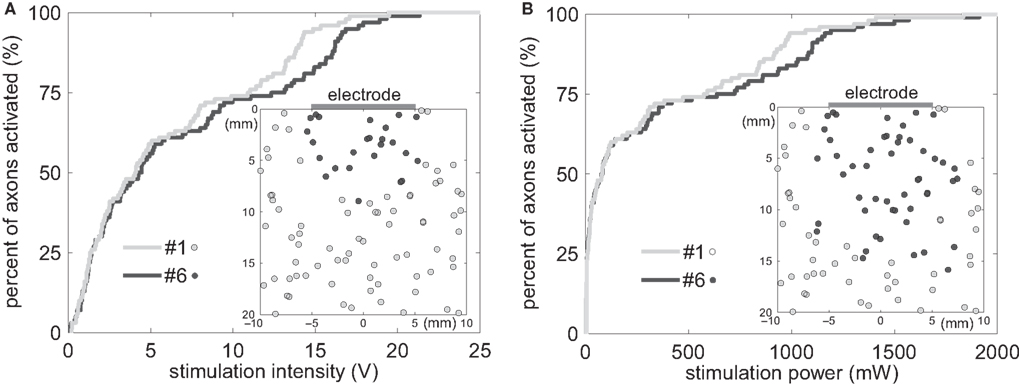
Figure 7. Input–output curves of activation of model axons. (A) Percent of activated axons as a function of stimulus voltage for electrode #1 and electrode #6. Electrode #1 decreased the average threshold voltage by 10.1% as compared to electrode #6. The inset shows the axons that were activated by electrode #1 with lower thresholds (grey circles) and those activated by electrode #6 with lower thresholds (black circles). (B) Percent of activated axons as a function of power consumption for electrode #1 and electrode #6. Electrode #1 decreased the average power consumption by 9.5% as compared to electrode #6. The inset shows the axons that were activated by electrode #1 with lower power requirement (grey circles) and those activated by electrode #6 with lower power requirement (black circles).
The decreases in average threshold voltage and average power consumption of the serpentine-perimeter designs (samples #1–#5) as compared to the circular-perimeter electrode (#6) are summarized in Figure 8
. Increasing the electrode perimeter reduced threshold voltage as compared to the circular-perimeter electrode. However, increasing the electrode perimeter also increased the total current delivered to the tissue at the same electrode voltage, and the decrease in power consumption as compared to the circular-perimeter electrode did not increase with increasing the electrode perimeter. Between the electrodes with the same perimeter (#2 and #3, #4 and #5), the electrodes with more periods but smaller amplitude of sinuous variation exhibited larger reductions in power consumption.
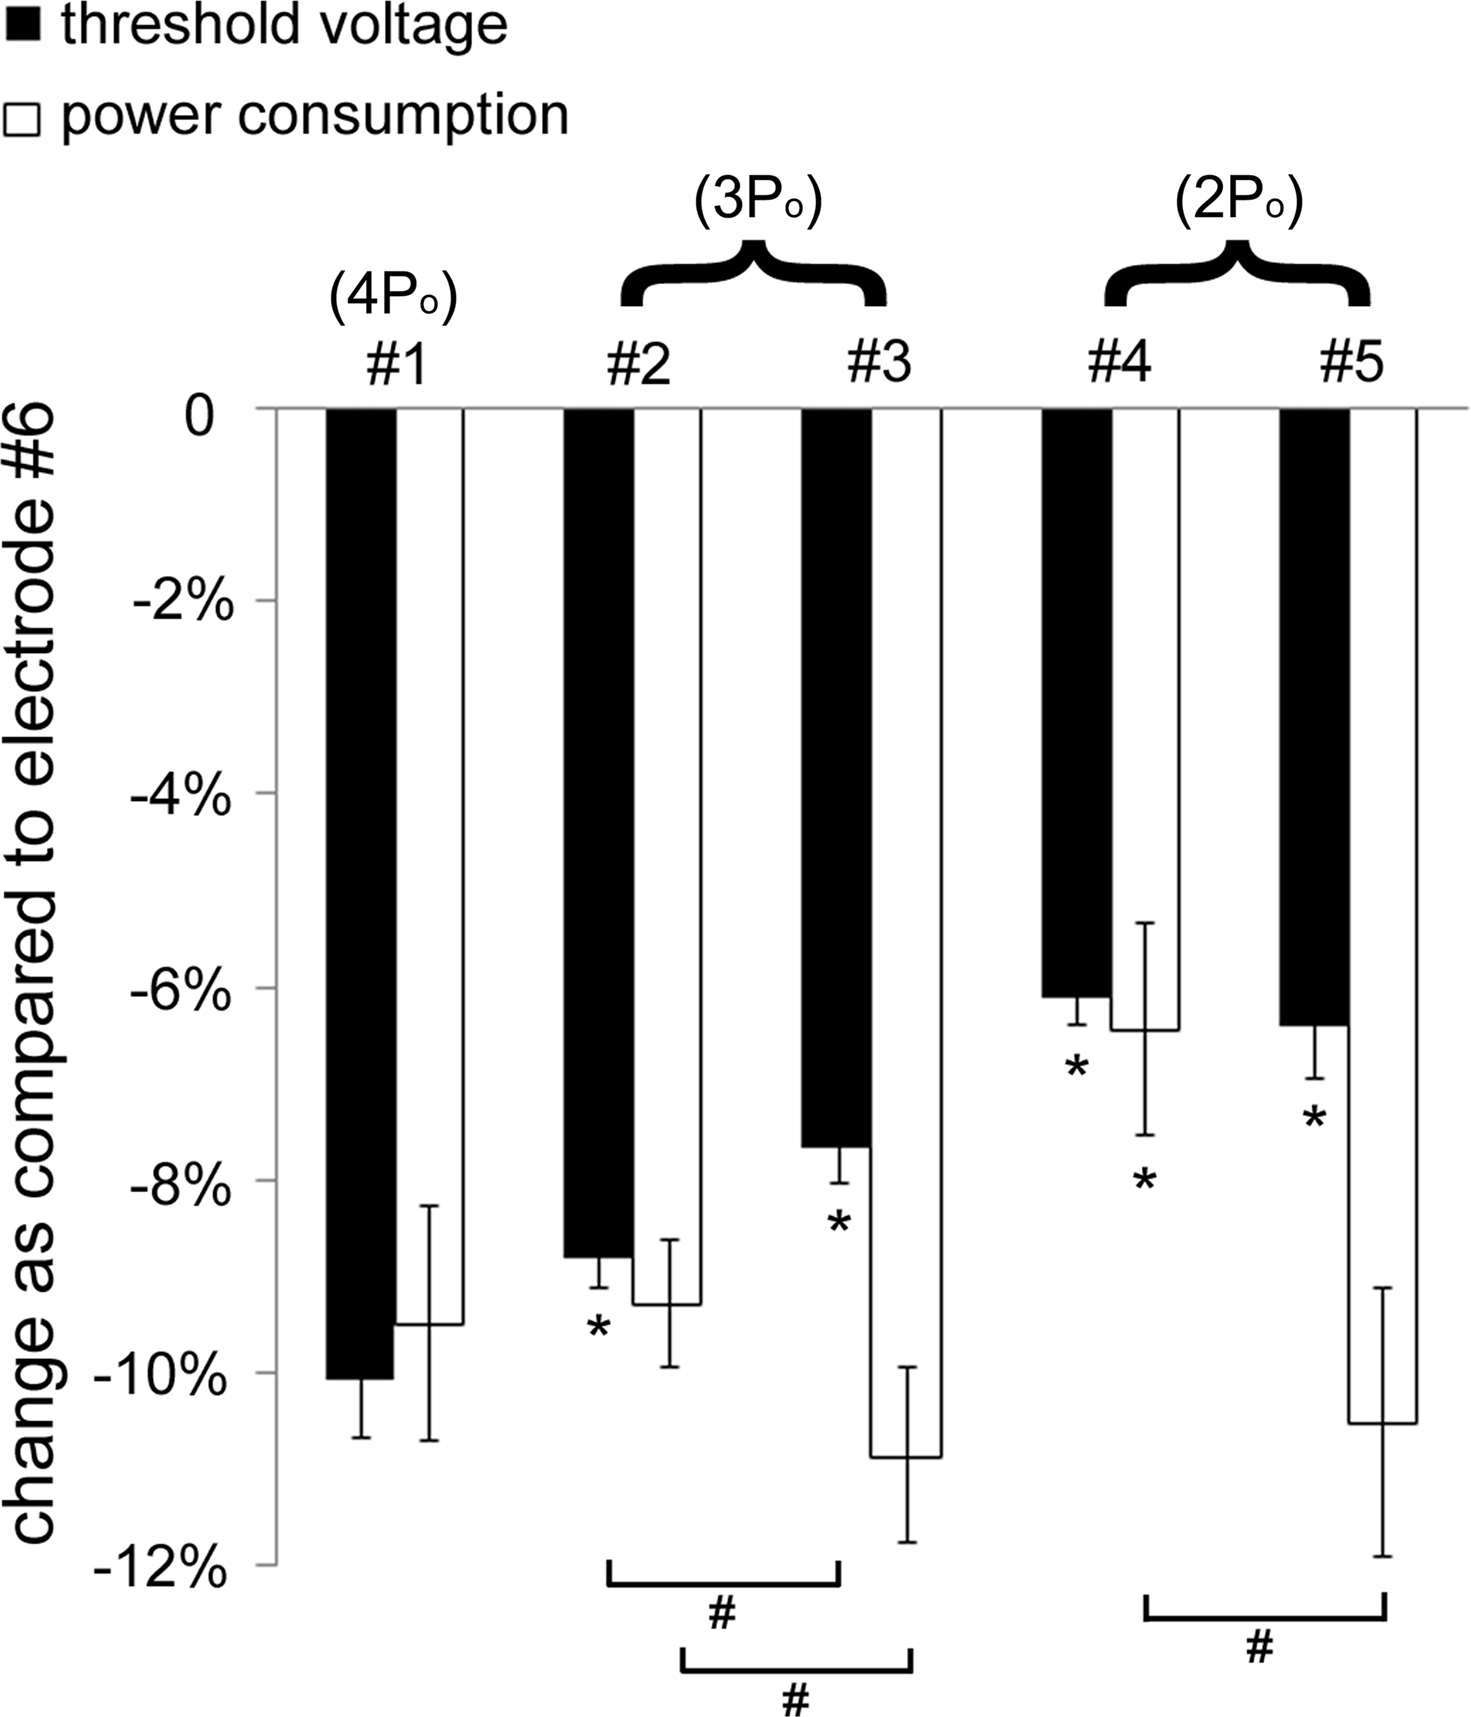
Figure 8. Reductions in threshold voltage and power consumption with the serpentine-perimeter electrodes (#1–#5) as compared to the circular-perimeter electrode (#6). The means and standard deviations were calculated across five randomized populations of model axons. The threshold voltage (p < 0.001) and power consumption (p < 0.001) were dependent on the electrode design (ANOVA). Post hoc paired comparisons with Fisher’s PLSD test revealed significant differences (p < 0.05) as compared to electrode #1 (*), and significant differences (p < 0.05) between electrodes with the same perimeter (#).
Distributions of the Activating Function
Profiles of Δ2Ve/Δx2 were plotted along a line parallel to the electrode surface (Figure 6
A) at four electrode-to-axon distances (Figure 9
). The circular-perimeter electrode (#6) generated higher maximum activating functions at electrode-to-axon distances of 0.1 mm (Figure 9
A) and 1 mm (Figure 9
B), while the serpentine-perimeter electrode (#1) generated higher maximum activating functions at electrode-to-axon distances of 10 mm (Figure 9
C) and 20 mm (Figure 9
D). This corroborates the results of the input–output curves indicating that the serpentine perimeter resulted in more efficient stimulation of axons positioned farther from the electrode.
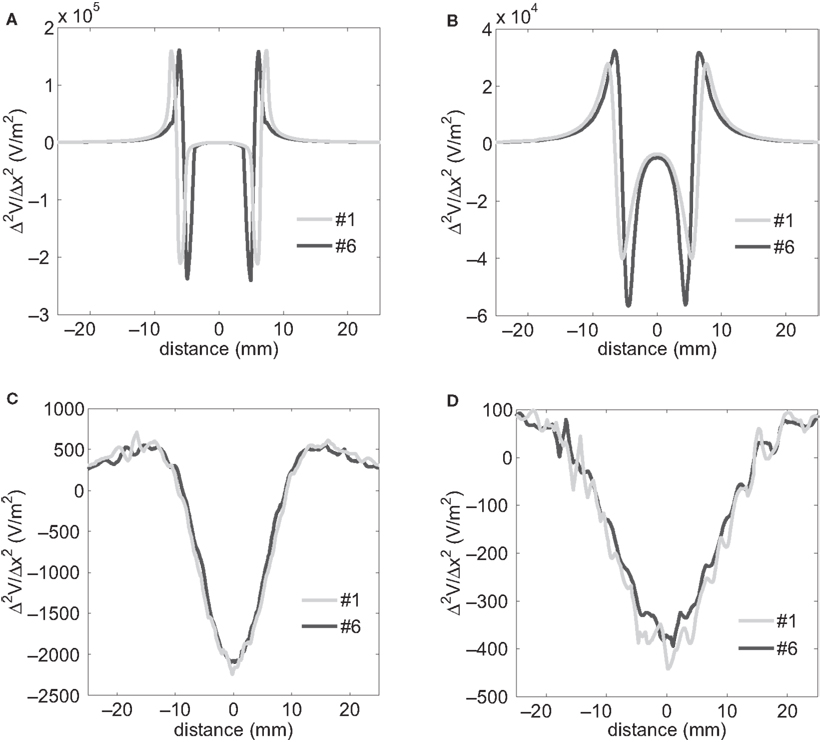
Figure 9. Second spatial difference of extracellular potential. Second spatial difference of the extracellular potentials (Δ2Ve/Δx2) generated by electrodes #1 and #6 was calculated on a line parallel to the electrode surface at various electrode-to-axon distances (0.1 mm (A), 1 mm (B), 10 mm (C) and 20 mm (D)). The second difference of potentials was calculated using a spatial step equal to the inter-nodal length of the model axons (Δx = 1.2 mm). The projection of the line along which the above profiles were calculated is illustrated by the white dashed line in Figure 6
A.
The objective of this study was to increase the stimulation efficiency of planar disk electrodes through novel high-perimeter designs. Increases in stimulation efficiency will reduce the power requirements of IPGs, thereby increasing device lifetime. We fabricated prototypes of high-perimeter planar electrodes that had the same surface area, but had perimeters two, three, or four times larger than a planar electrode with a circular perimeter. The interface impedance of the prototypes was measured in vitro, and indicated that the impedance of the high-perimeter planar electrode did not differ significantly from the impedance of the circular electrode across a wide range of sinusoidal frequencies. Finite element models were used to calculate the potentials in a modeled tissue medium, and the potentials were coupled to a population of model axons to quantify stimulation efficiency. The planar electrodes with serpentine perimeters were more efficient in activating axons farther away from the electrode surface and reduced power consumption by ∼10%.
Synthesis of Results
The input–output curves of activation of axons as a function of stimulation intensity indicated that the stimulation efficiency was dependent on the distance of the axons from the electrode. The serpentine perimeter resulted in more efficient stimulation of axons positioned farther from the electrode. The average power reduction of ∼10% was based on our choice of the region for the randomized distribution of axons and would increase if the axons were positioned farther from the electrode. As illustrated in Figure 7
, the input–output curves of activation of axons as a function of stimulus voltage for electrodes #1 and #6 crossed at ∼25% activation, and the input–output curves of activation of axons as a function of power consumption for electrodes #1 and #6 crossed at ∼50% activation. This suggests that the serpentine perimeter resulted in lower threshold currents for axons positioned even farther from the electrode. Indeed, when the activation of axons was plotted as a function of stimulus current, the crossing of the curves for electrodes #1 and #6 occurred at ∼80% activation.
According to Ohm’s law, the calculation of power consumption using Vt × it is equivalent to  . The interface impedance (Ze) of the electrode was not included in the model, thus Zload only included the spreading tissue resistance (Rtissue) from the electrode surface to infinity (the theoretical ground). This is a fair approximation because Rtissue was over one order of magnitude larger than Ze during short-duration current pulses (Figure 5
). In the homogeneous medium the path of least resistance was the shortest geometric path from the electrode to the boundary, and this resulted in different spreading resistances across the electrode geometries. The serpentine perimeter resulted in smaller spreading tissue resistance, and this contributed to the power reduction of the serpentine-perimeter electrodes, regardless of the electrode-to-axon distance.
. The interface impedance (Ze) of the electrode was not included in the model, thus Zload only included the spreading tissue resistance (Rtissue) from the electrode surface to infinity (the theoretical ground). This is a fair approximation because Rtissue was over one order of magnitude larger than Ze during short-duration current pulses (Figure 5
). In the homogeneous medium the path of least resistance was the shortest geometric path from the electrode to the boundary, and this resulted in different spreading resistances across the electrode geometries. The serpentine perimeter resulted in smaller spreading tissue resistance, and this contributed to the power reduction of the serpentine-perimeter electrodes, regardless of the electrode-to-axon distance.Our hypothesis was that serpentine perimeter would increase the variation of current density on the electrode surface and generate larger activating functions for surrounding neurons, thereby increasing stimulation efficiency. Consistent with the input–output curves, the profiles of activating function along parallel axons (Δ2Ve/Δx2) indicated that the serpentine-perimeter electrode generated higher maximum activating functions only for axons positioned farther from the electrode (Figure 9
). This can be explained by the fact that the current flow out of the electrode surface is in the normal direction (z direction). For parallel axons (in x direction), the non-uniformity of current density on the electrode surface created by the serpentine perimeter can only be translated into the higher variation of current density along the direction of the axons farther from the electrode surface where the current has diverged with a stronger parallel component.
The prototype electrodes that we analyzed were larger than present clinical planar electrodes for epidural spinal cord stimulation for treatment of pain. For example, the circular planar electrodes designed by Medtronic Inc. (Models 3587A, 3986A, and 3987A) have a diameter of 4.1 mm, thus are approximately six times smaller in area than the prototypes. The larger size of the prototype electrodes enabled fabrication of serpentine perimeter with high precision. The effects of serpentine perimeter on the current density distributions and activating functions apply qualitatively to planar electrodes of different sizes, and thus the impact of the geometric changes analyzed with the prototype electrodes are expected to scale and apply to the clinical electrodes. However, a smaller electrode has a higher interface impedance. If the interface is modeled as the parallel combination of a double layer capacitance and a Faradaic resistance, the interface impedance is inversely proportional to the electrode area. The spreading resistance of a circular disk electrode adjacent to a semiconductor is inversely proportional to the diameter of the circular disk (i.e., the square root of electrode area) (Polyakov and Kon’kov, 1970
; Denhoff, 2006
). Therefore, the interface impedance will increase at a faster rate with the decrease of electrode size than the spreading tissue resistance. This will result in higher proportion of the power consumed by the electrode–tissue interface, and the increase of interface impedance of the serpentine electrode as compared to the circular electrode (Figure 5
B) may become critical in determining the power efficiency of stimulation.
Estimation of Tissue Damage
The serpentine perimeter increased the current density on the electrode surface, and this may increase the propensity for tissue damage. A quantitative model of neural damage was used to analyze the effects of increasing electrode perimeter on tissue damage. Charge per phase and charge density per phase are cofactors in the generation of neural damage (McCreery et al., 1988
, 1990
), and this relationship is described by:

where Q is the charge per phase, A is the electrode area, and k is a constant derived from data to define the boundary between stimulus parameters that produced tissue damage and those that did not (Figure 10
) (Shannon, 1992
). The proposed limit for non-damaging stimulation levels using circular disk electrodes was k = 1.5, but this value was estimated using geometrical (average) charge density over the electrode surface (Shannon, 1992
).
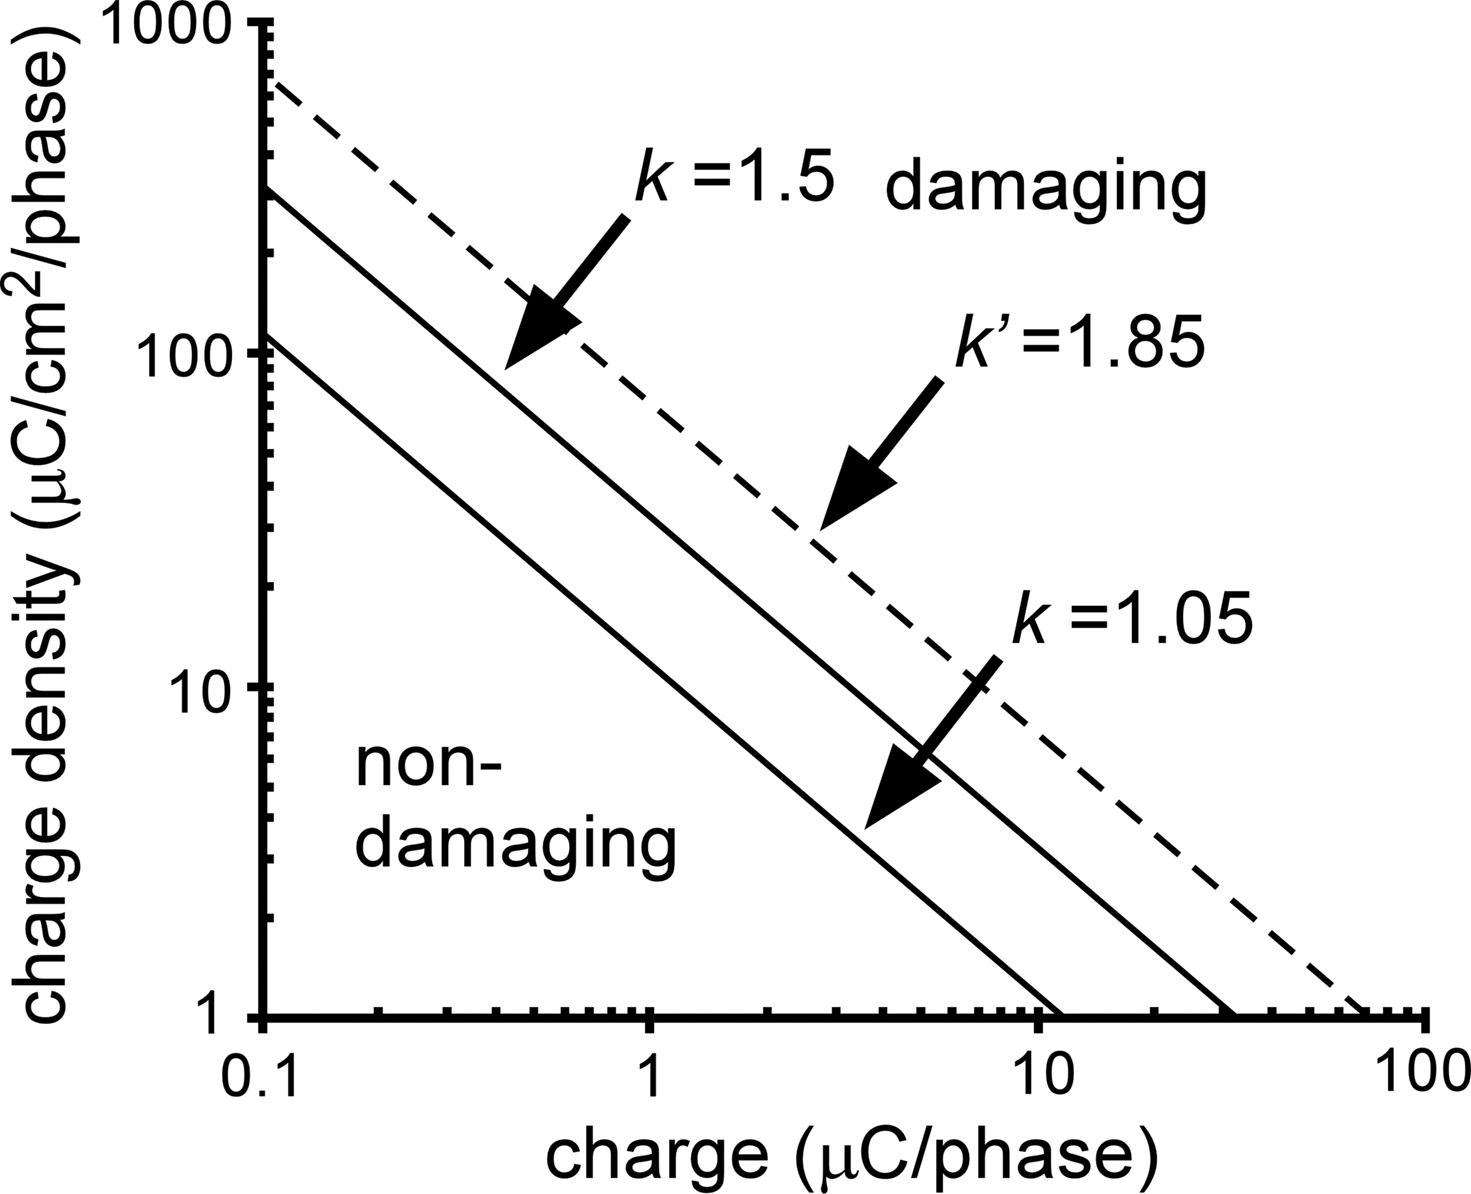
Figure 10. Relationship between charge per phase (Q), charge density per phase (Q/A), and stimulation induced tissue damage. The k value defines the boundary between stimulus parameters that produce tissue damage and those that do not, and k = 1.5 was estimated using geometrical charge density of circular disk (planar) electrodes. In the modified model where the ordinate represents maximum charge density, the new k value (k′) was 1.85. Applying k′ to the serpentine-perimeter planar electrode (#1) yielded k equal to 1.05 when geometrical charge density was considered.
As current density was higher around the perimeter of the electrode, and this non-uniformity was more pronounced for electrodes with serpentine edge, we calculated the average current density (Javg) and maximum current density (Jmax, average over the 1% of the electrode area with the highest current density) on the surface of electrodes #1 and #6. The ratio Jmax/Javg is the same as the ratio of maximum charge density (Q/A)max to average charge densities (Q/A)avg. The increases in k (Δk) were calculated when (Q/A)max, instead of (Q/A)avg, was considered (Table 3
). Replacing (Q/A)avg with (Q/A)max in Eq. 6 for a circular disk electrode produces an adjusted k value (k′ in Figure 10
) that is transferable to other electrode geometries when maximum charge density is considered. Assuming that k is estimated to be 1.5 with the average charge density of the circular disk electrode (#6), Table 3
suggests that the adjusted k (k′) is 1.85 when the maximum charge density is considered. Calculated from k′, k for electrode #1 is 1.05 when the average charge density is considered, resulting in a smaller region of non-damaging stimulus parameters (Figure 10
). This suggests that at the same stimulus parameters, the planar electrode with serpentine perimeter has a higher propensity of inducing local tissue damage than the planar electrode with circular perimeter.
Model Limitations
Finite element models of electrodes and the surrounding volume conductor were coupled to compartmental cable models of a population of axons to study the effects of increasing the perimeter of planar electrodes on stimulation efficiency. The electrical potentials were calculated based on the assumption that the tissue medium was homogenous and isotropic. Although the true biological volume conductor is inhomogeneous and anisotropic, a recent study of deep brain stimulation indicated that a homogenous isotropic model provided predictions of voltage distributions remarkably similar to a more detailed inhomogenous and anisotropic model (Miocinovic et al., 2009
). Further, the present study did not focus on the absolute stimulation efficiency of an electrode, but rather the comparative stimulation efficiency between electrodes with various geometries, and therefore the simplified model was appropriate.
The population of model axons had specific orientations (parallel to the electrodes) and did not include cell bodies, dendrites, or synaptic inputs. Although both experimental studies (Nowak and Bullier, 1998a
,b
) and computational models (McIntyre and Grill, 1999
) indicate that during extracellular stimulation, action potential initiation occurs in the axon, the impact of changes in geometry on the efficiency of activating other neural elements may differ from those for axons. Investigations of high-perimeter electrode designs for specific applications, such as epidural spinal cord stimulation or epidural cortical stimulation, should consider using compartment cable models with more specified orientations, more detailed membrane dynamics, and morphology representative of the target neurons.
The authors are inventors on optioned intellectual property owned by Case Western Reserve University and Duke University. If this intellectual property is licensed, then according to institutional revenue sharing policies, the authors may receive a share of fees and or royalty payments.
This work was supported by the Nation Institutes of Health (R21 NS-054048). The authors would also like to thank Bob Strother for designing and fabricating the electrode test samples.