
94% of researchers rate our articles as excellent or good
Learn more about the work of our research integrity team to safeguard the quality of each article we publish.
Find out more
ORIGINAL RESEARCH article
Front. Neuroeng. , 03 January 2012
volume 4 - 2011 | https://doi.org/10.3389/fneng.2011.00018
This article is part of the Research Topic Bioinspired solutions to the challenges of chemical sensing View all 14 articles
Sensory perception results from the way sensory information is subsequently transformed in the brain. Olfaction is a typical example in which odor representations undergo considerable changes as they pass from olfactory receptor neurons (ORNs) to second-order neurons. First, many ORNs expressing the same receptor protein yet presenting heterogeneous dose–response properties converge onto individually identifiable glomeruli. Second, onset latency of glomerular activation is believed to play a role in encoding odor quality and quantity in the context of fast information processing. Taking inspiration from the olfactory pathway, we designed a simple yet robust glomerular latency coding scheme for processing gas sensor data. The proposed bio-inspired approach was evaluated using an in-house SnO2 sensor array. Glomerular convergence was achieved by noting the possible analogy between receptor protein expressed in ORNs and metal catalyst used across the fabricated gas sensor array. Ion implantation was another technique used to account both for sensor heterogeneity and enhanced sensitivity. The response of the gas sensor array was mapped into glomerular latency patterns, whose rank order is concentration-invariant. Gas recognition was achieved by simply looking for a “match” within a library of spatio-temporal spike fingerprints. Because of its simplicity, this approach enables the integration of sensing and processing onto a single-chip.
Identifying and localizing volatile compounds is an important challenge in numerous applications such as, among others, explosive detection (civil or military security), aliment quality control, air pollution analysis (Gardner and Bartlett, 1999; Röck et al., 2008). During the past few years, there has been an increasing effort for developing low-cost microelectronic gas sensors allowing quantitative and qualitative analyses (Röck et al., 2008). Nevertheless, whatever the technology is (e.g., metal oxide, conducting polymer, piezo-electric quartz), a common feature of the sensors is their lack of selectivity (Röck et al., 2008). Gas sensors react to a large number of chemical compounds and it seems likely that the situation will continue in the long run. We can even ask whether it is useful to have selective sensors as it is cost intensive and time consuming to develop a specific sensor for every odorant to be detected. Note that lack of selectivity is also encountered in olfactory receptor neurons (ORNs). Yet, biological systems are not less very efficient. Mice and bees for example recognize learned odors in less than 200 ms (Abraham et al., 2004; Buck, 2005; Bhandawat et al., 2010; Chen et al., 2011), thereby indicating a rapid processing of the olfactory input. More strickling is the fact that primary olfactory centers in insects and vertebrates share a common design both at anatomical (cellular organization) and functional (mechanisms for olfactory coding) levels (Hildebrand and Shepherd, 1997; Strausfeld and Hildebrand, 1999; Jacquin-Joly and Lucas, 2005). The efficiency of biological olfactory systems and their similarities across species imply that nature has found an optimal solution for encoding odors (Ache and Young, 2005). The current knowledge about architectural and computational strategies used in biological systems should therefore guide the development of algorithms for processing gas sensor data.
The concept of electronic nose as a bionic system of artificial olfaction appeared about 30 years ago (Persaud and Dodd, 1982). It consisted in using an array of different sensors whose activation pattern contains the signature of the odorant to be identified, in the same way as our olfactory perception results from the activation of multiple ORNs by the odorant molecules. The analogy stops here however. The current artificial noses are only a weak imitation of the sense of smell with performance far below that of their biological counterparts. The reason is twofold.
• The organization of both systems, artificial and biological, is not comparable. In electronic noses, the sensing elements are mapped on a two-dimensional array without particular organization. In biological olfactory systems on the contrary, the sensory neurons distributed on insect antennae or in vertebrate epithelia converge onto individually spherical neuropils, called glomeruli, where all synaptic connections between ORNs and second-order neurons are made (Figure 1). Olfactory glomeruli are individually identifiable across animals and are functionally specialized in terms of odor processing (Rospars, 1988; Baier and Korsching, 1994). It is now well established that single ORN projects onto a few (most often only one) glomeruli and that all ORNs from a given glomerulus express the same olfactory receptor (OR), (Mombaerts, 1996, 2001; Vosshall et al., 2000). The ORNs of a given glomerulus are thus homogeneous in terms of receptor type. It has been shown however that in an homogeneous population with same OR, the ORNs present variable odorant response properties (Grosmaitre et al., 2006; Grémiaux et al., 2011). Computational advantages for such a variability are still unclear but they could include lower detection thresholds and wider dynamic ranges by averaging many independent inputs (Grosmaitre et al., 2006).
• The processing of gas sensor arrays currently based on statistical methods (e.g., discriminant analysis, kernel methods) is very far from the biological reality (neurons firing action potentials or spikes). Second-order neurons (mitral cells in the vertebrate olfactory bulb, projection neurons in the insect antennal lobe) were found to encode information in a few spikes, using relative latencies after stimulus onset as an information carrier (Hopfield, 1995; Margrie and Schaefer, 2003; Junek et al., 2010; Belmabrouk et al., 2011; Smear et al., 2011). Timing of activity relative to the sampling behavior (e.g., sniffing in rodents) leads to a concentration-invariant code for odor identity (Hopfield, 1995; Margrie and Schaefer, 2003) and may play a significant role in the context of fast information processing, a rat for example recognizing a novel odor in less than 200 ms (Abraham et al., 2004; Wesson et al., 2008) and a drosophila in 90 ms (Bhandawat et al., 2010).
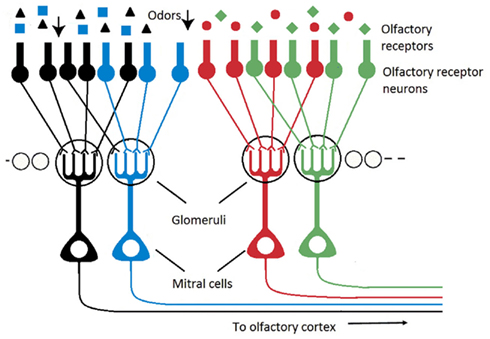
Figure 1. Schematic of the olfactory pathway (olfactory bulb) illustrating that the ORNs expressing the same OR converge onto spherical individual neuropils, called glomeruli, where all synaptic connections between ORNs and second-order neurons (mitral cells) are made.
Taking inspiration from the organizational and functional characteristics of the olfactory pathway (glomerular convergence and latency coding), we designed a simple yet robust glomerular latency coding scheme for processing gas sensor data.
Using an in-house 5 μm, 2-metal, 1-poly process, we have fabricated a 4 × 4 gas sensor array consisting of 16 SnO2 sensors, corresponding to different combinations of dopants and catalysts. The structure of the fabricated 4 × 4 gas sensor array is shown in Figure 2. Sensors belonging to the same column share the same metal catalyst (Pt, Ag, or Au), while row wise sensors share the same dopant (B, P, or H). Note that a single row of sensors has no implanted dopant (ND) and a single column of sensors has no metal catalyst (NC). Each individual sensor integrates a micro-hotplate (MHP) heater (Figure 2), which consists of a membrane stretched over a rigid frame (Graf, 2007). The membrane plays two roles: (i) it acts as a support for the functional elements of the sensor (e.g., heater and sensing layer), and (ii) it provides thermal isolation of the hot sensing area through its low heat conductivity (Graf, 2007). The presence of a target gas is detected through changes in the conductance of the sensing film, which depends on the gas type and concentration, its operating temperature but also on the deposited sensing film. In our array, a 100-nm SnO2 film was deposited on the MHP structure, using sputtering and lift-off techniques. Dopant implantation (B, P, or H) was selectively carried out at a dose of 5 × 1012 cm−2 and energy of 30 keV. Different catalysts (Pt, Ag, or Au) were subsequently deposited on individual sensing films by RF sputtering. Each MHP is a 190 × 190-μm2 oxide/low-stress nitride/oxide (O/N/O) multilayer membrane. A 2.8-μm air gap separates MHP and substrate to reduce heat losses to the substrate. The air gap was formed by etching a sacrificial polysilicon layer. A serpentine Pt microheater was patterned at the center of the MHP, using sputtering and lift-off techniques (Figure 2). The microheater has a width of 10 μm and a thickness of 100 nm. Its resistance is about 297 Ω at room temperature and 441 Ω at the 300°C operating temperature. Plasma enhanced chemical vapor deposition (PECVD) was used to deposit an insulating oxide/nitride/oxide multilayer on top of the microheater. The resistance change of each individual sensing film is measured across two Pt electrodes. In the fabricated 4 × 4 gas sensor array, the catalysts play the role of the receptor and the dopants add heterogeneity in the sensors’ responses.
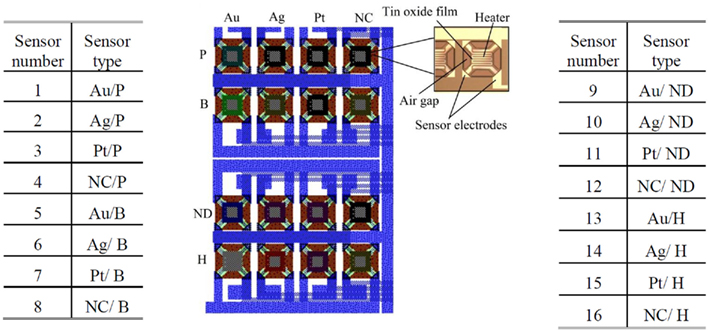
Figure 2. The fabricated 4 × 4 SnO 2 gas sensor array with the structure of an individual sensor highlighted on the right. There are 16 SnO2 sensors, corresponding to different combinations of dopants and catalysts. Sensors belonging to the same column share the same metal catalyst (Pt, Ag, or Au), while row wise sensors share the same dopant (B, P, or H). A single row has no dopant (ND) and a single column has no metal catalyst (NC). Note that the above sensor numbering is kept for all subsequent figures.
The fabricated electronic nose was characterized in a controlled laboratory environment, using an automated gas delivery system (Figure 3). Test gases used in the experiments were methane, carbon monoxide, and ethanol. Flow rates were set by adjusting the voltage of computer controlled mass-flow-controllers (MFCs). The control of the gas concentration, within the 2.5-cm radius 30 cm3 cylinder testing chamber, was achieved by mixing the target gas with dry air at different flow rates. The relative small size of the chamber contributes to the uniformity of the gas concentration across the sensor array. Prior to each gas exposure, the surface of the sensor array was cleaned by injecting dry air. The sensor array was subsequently exposed to the target gas for up to 300 s. Throughout each clean-and-expose-cycle, resistance variations across the array were recorded simultaneously using 10-bit digital multimeters. The sensor steady state resistance was sampled just before the end of the analyte injection period.
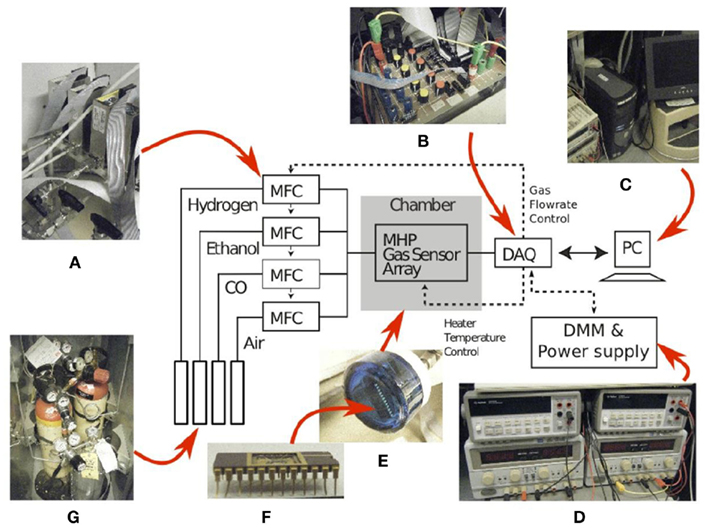
Figure 3. Experimental setup used to characterize the gas sensor array: (A) four mass-flow-controllers, (B) a data-acquisition-board (DAQ), (C) a desktop computer, (D) power supplies and digital multimeters, (E) a chamber housing the gas sensor array packaged in a (F) 24-pins Ceramic Dual-Inline-Package (CDIP24) and (G) three gases namely H2, ethanol, and CO.
In the generalist olfactory pathway, ORNs are sensitive to multiple odorants, and each odorant activates thousands of ORNs, leading to a massive combinatorial code at the receptor level. Yet this code is not only combinatorial, it is also structured temporally by the sampling behavior of the animal (e.g., sniffing in rodents) which provides a temporal frame of reference. Recent evidence shows that mice are able to discriminate between olfactory inputs merely on the basis of timing information relative to the respiration cycle (Smear et al., 2011). Electrophysiological recordings in the mouse olfactory bulb have revealed that the firing latency of mitral cells relative to the respiration cycle depends on odor intensity in a logarithmic way (Margrie and Schaefer, 2003) and theoretical works have suggested that such a logarithmic transformation makes relative latencies invariant to odor concentration (Hopfield, 1995). We have exploited the above ideas to design a spike latency coding scheme that converts the sensor responses into a unique sequence of latency spikes (Martinez et al., 2006; Ng et al., 2009; Chen et al., 2011). The firing latency ti associated to the i-th sensor exposed to a target gas j is proportional to the logarithm of the sensor resistance

where γij is a parameter which depends both on the type of gas j and sensing material i and Rij is the resistance of sensor i when exposed to target gas j. The resistance Rij is here modeled as a power law (Gardner and Bartlett, 1999; Yamazoe and Shimanoe, 2008) leading to

where αij is a parameter depending both on sensor i and gas j and Cj is the concentration of gas j. Considering the previous equation, the relative latency between sensors p and q can be expressed as

Note that the relative latency is concentration independent (Cj does not appear in Eq. 3) while being gas dependent (both α and γ depend on the type of gas). As a result, the rank order (i.e., firing order of sensors) can be used as a signature (Figure 4, top) and gas recognition can be simply achieved by looking for a match within a library of spatio-temporal spike signatures.

Figure 4. Spike and glomerular latency coding. Top: spike latency coding (Eq. 1) converts the response of the fabricated 4 × 4 sensor array into a unique sequence of 16 spikes with the firing latency mapping the strength of the stimulation across the array. Sensor numbering corresponds to that of Figure 2, with a single color associated to sensors sharing the same catalyst (Au, Ag, Pt, or NC). Bottom: glomerular latency coding (Eq. 4) converts the sensor array into a unique sequence of four spikes which correspond to the four virtual glomeruli defined by grouping the sensors according to their catalysts.
In the olfactory pathway, each glomerulus receives inputs from ORNs expressing the same OR (Figure 1). We have emulated glomerular convergence in the fabricated gas sensor array, by making an analogy between OR expressed and metal catalyst used. In this way, we defined four glomeruli (considering the four types of sensors Pt, Ag, Au, and NC), each one receiving four sensory inputs. We further considered that the elementary unit of the olfactory code is a glomerular module that consists of a glomerulus together with its associated second-order neurons (Mori et al., 1999; Koulakov et al., 2007). The onset latency of a glomerular module p was defined as

where the sensors i are of the same type (i.e., with same catalyst p). Considering a power law sensor response leads to

and the relative latency between two glomerular modules p and q (catalysts p and q) is expressed as

As for the spike latency coding, the relative latency is concentration independent (Cj does not appear in Eq. 6) while being gas dependent (both α and γ depend on the type of gas). The glomerular latency code (Figure 4, bottom) is however more compact than the spike latency code (Figure 4, top). For both spike and glomerular latency codes, the parameters required to convert the sensor resistances into firing times are the sensitivities γij (see Eqs 1 and 4). These parameters were estimated empirically by calibration, i.e., by exposing the sensor array to each target gas j delivered at different known concentrations Cj ranging from 20 to 200 ppm, and determining the slope of the linear regression of ln Rij versus ln Cj. Because individual γij parameters depend both on the type of gas j and sensing material i, 64 parameters have been extracted given that we considered four target gases and 16 different sensors. The range of sensitivity values was found to be 0 < γij < 1.1.
Hydrogen, methane, carbon monoxide, and ethanol, at concentrations ranging from 20 to 200 ppm, were used to characterize the fabricated gas sensor array, operated at 300°C. Examples of recorded response curves of individual sensors exposed to ethanol at different concentrations are shown in Figure 5. Note that following each gas exposure (at a given concentration), the gas chamber was subsequently cleaned by injecting dry air. After the cleaning process, the sensor array was exposed to the same gas but at another concentration level. Observe that increasing gas concentration has the effect of decreasing the sensor resistance, which follows a power law. This is the case because all target gases are reducing gases. When dry air is injected, the sensor resistance increases back to the initial baseline resistance. Interestingly, we found that the sensors sharing the same catalyst exhibited similar sensitivities to the target gases. As an example, the sensitivities of the sensors to ethanol, as measured by the γij parameters, were 0.95 ± 0.09 (mean ± SD) with catalyst Pt (red curves in Figure 5), 0.22 ± 0.06 with Au (black curves in Figure 5), and 0.29 ± 0.08 with Ag (blue curves in Figure 5).
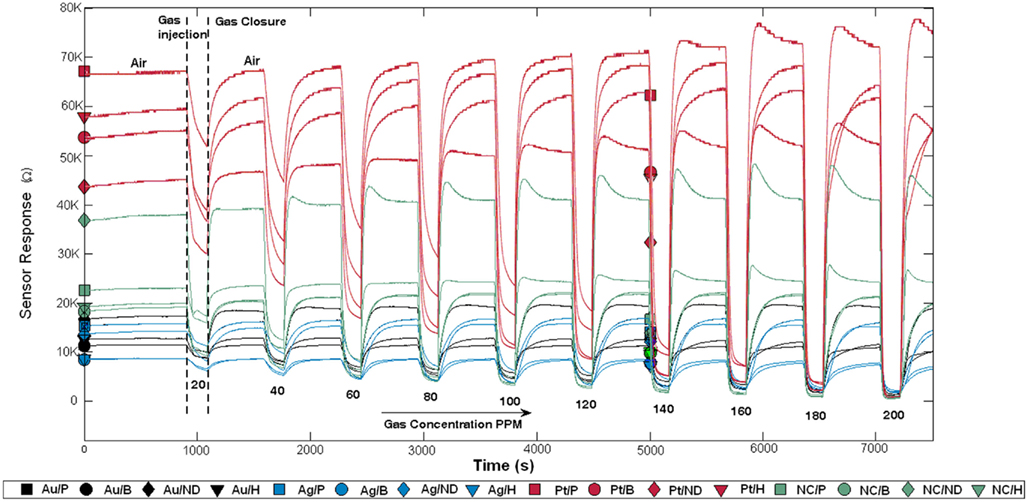
Figure 5. Sensor array response to ethanol at concentrations ranging from 20 to 200 ppm. After each exposure, the sensor array is cleaned by injecting dry air. Observe that sensor resistances decrease during exposures because all target gases are reducing gases. Sensors sharing the same catalyst are plotted with the same color. ND stands for No Dopant and NC for No Catalyst.
One major challenge to gas identification is the inherent drift of gas sensors, which results in temporal variations of the sensor response with repeated experiments. Figure 6 shows the drift of the sensors as defined by  where Rij is the resistance of sensor i exposed to gas j measured in the first cycle while
  is the sensor resistance measured after the experiment has been repeated n times. The drift sensitivities, computed as the slopes of the linear regressions in Figure 6, were 0.76 ± 0.002 (mean ± SD) with catalyst Pt (red curves in Figure 6), 0.23 ± 0.0003 with Au (black curves in Figure 6), and 0.25 ± 0.001 with Ag (blue curves in Figure 6). As within catalyst-group variances are small, these results indicate that sensors with the same catalyst exhibit similar drift behaviors.
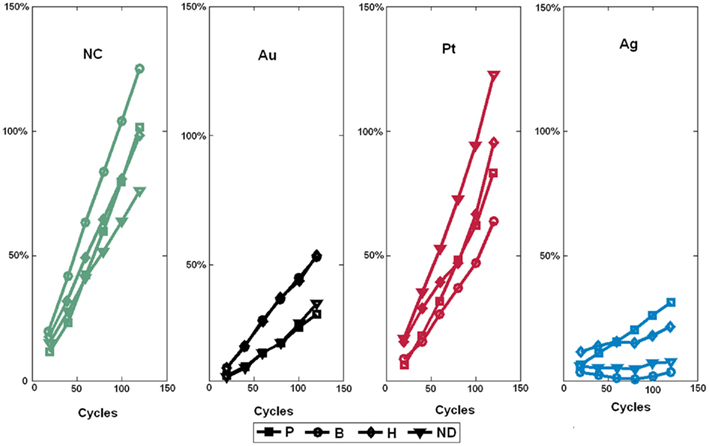
Figure 6. Drift behavior of sensors sharing the same catalyst as a function of the number of clean-expose cycles. The injected gas was ethanol at 200 ppm. Note that the sensor drift behavior is mainly determined by the catalyst and not the type of dopant. ND stands for No Dopant and NC for No Catalyst.
Most current approaches to gas identification rely on statistical pattern-recognition techniques (Gutierrez-Osuna, 2002). The silicon area and thus cost associated to their implementation are too prohibitive to envision their on-chip integration with the sensor array (Gutierrez-Osuna, 2002). To address this issue, we have developed a bio-inspired encoding scheme that can convert the response of the sensor array into a unique sequence of spikes, with the firing delay mapping the strength of the stimulation across the array. In spike latency coding (Eq. 1 in Materials and Methods, see also Figure 4 top), the inter-spike interval is concentration independent while the firing order of the spikes is gas dependent. This means that the rank order (i.e., firing order of sensors) can be used as a signature to identify the target gas. We have experimentally validated this encoding scheme using the fabricated in-house 4 × 4 SnO2 gas sensor array. For any target gas (methane, hydrogen, ethanol, and carbon monoxide) the rank order of the spike latency code did not change much when the gas concentration increased. The corresponding rank order signatures are shown in Figure 7A, with a correct detection rate ranging from 80 to 99.1% (Table 1). These results suggest that the traditionally complex and computationally intensive task of gas recognition can be dramatically simplified to the task of looking for a match within a library of spatio-temporal spike signatures. To assess the benefit of spike encoding in terms of pattern separability, we projected the 16-dimensional spike vectors onto a two-dimensional space by using principal component analysis (PCA). The first two eigenvectors accounted for 99.7% of the variance and four clusters corresponding to the target gases were easily identifiable (see Figure 8B). For comparison, the raw sensor data (sensor resistances) were also projected using PCA and a much larger within-class scatter was obtained (Figure 8A).
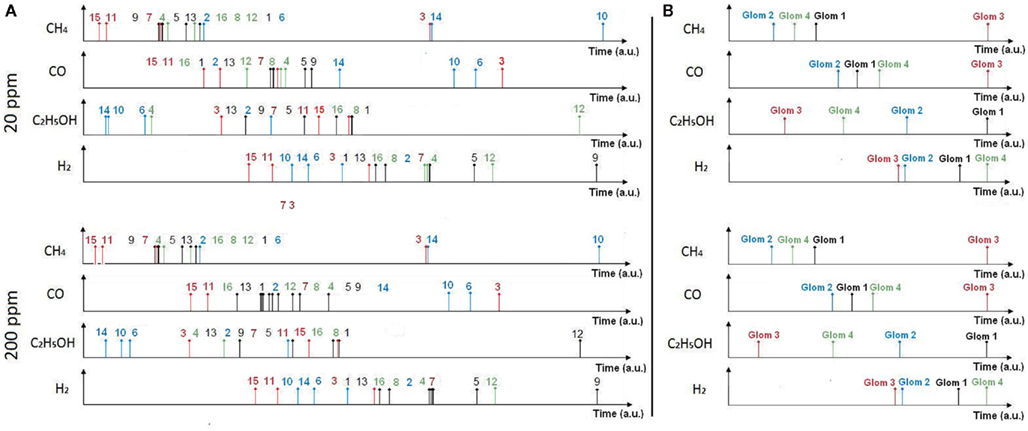
Figure 7. Rank order signatures of the target gases at concentrations of 20 and 200 ppm using spike latency coding (A) and glomerular latency coding (B). In spike latency coding (A) the rank order corresponds to the sensor labeling given in Figure 2. In glomerular latency coding (B), the rank order (1, 2, 3, 4) corresponds to four virtual glomeruli formed by catalysts Au, Ag, Pt, and NC, respectively. Note that the rank order signature is 100% concentration-invariant in the case of glomerular latency coding. The resistance to time conversion was achieved using Eqs 1 and 4 for spike and glomerular latency codes, respectively.
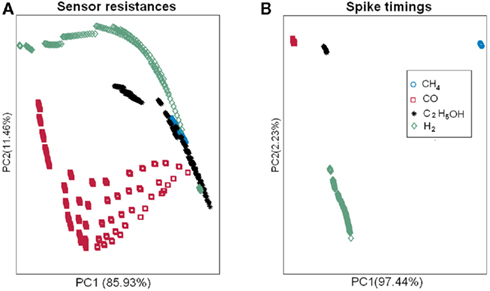
Figure 8. Pattern separability achieved with spike latency coding (B) as compared to the raw sensor data (A). For spike latency coding (B), the 16-dimensional spike vectors were projected onto a two-dimensional space by using principal component analysis (PCA). The first two eigenvectors accounted for 99.7% of the variance and four clusters corresponding to the target gases were easily identifiable. For comparison, the raw sensor data (sensor resistances) were also projected using PCA and a much larger within-class scatter was obtained (A).
In the mammalian olfactory bulb and the insect antennal lobe, glomeruli are generally thought to represent functional units of olfactory coding. A glomerulus receives axonal inputs from thousands of ORNs that all express the same OR. This glomerular convergence is believed to provide improved signal-to-noise ratio as well as increased sensitivity. We have emulated glomerular convergence using the fabricated in-house 4 × 4 SnO2 gas sensor array, by noting the possible analogy between OR protein expressed and metal catalyst used across the sensor array. In this way, we defined four glomeruli by considering the four types of sensors (catalysts Au, Pt, Ag, and NC), each one processing inputs from four sensors (glomerular latency coding given by Eq. 4 in Materials and Methods, see also Figure 4 bottom). The proposed glomerular latency coding serves two computational functions. (i) It leads to a more compact odorant representation (e.g., four glomerular spikes in Figure 7B) than that available at the sensory level. (ii) It averages out uncorrelated noise by summation of sensory inputs of the same type, resulting in 100% accuracy for our dataset (Table 1). These bio-inspired computational advantages were obtained because the processed sensors had similar gas affinity, similarly to ORNs of the same type converging to a given glomerulus.
To assess the gas affinity of the sensors sharing the same catalyst, we projected the sensors’ responses of each gas onto a two-dimensional space by using PCA (Figure 9). Four separate clusters corresponding to the four catalysts were identified. The clusters were well separated for three gases (methane, hydrogen, and carbon monoxide) and the model thus mimics the formation of individual glomeruli. For ethanol however, only the Pt cluster is well separated, with the other catalyst clusters exhibiting similar response to ethanol. This difference can be explained from the mean sensitivities to ethanol (γij = 0.95 on average for Pt versus 0.22 and 0.29 for Au and Ag). For comparison, we performed a similar analysis by grouping the sensors according to their dopants. The PCA plots did not reveal any particular clusters for any of the target gases specified above (see Figure 9). All together, these results suggest that sensors sharing the same catalyst have similar gas affinity to the majority of the target gases (methane, hydrogen, and carbon monoxide) thereby validating the analogy with ORNs expressing the same OR.
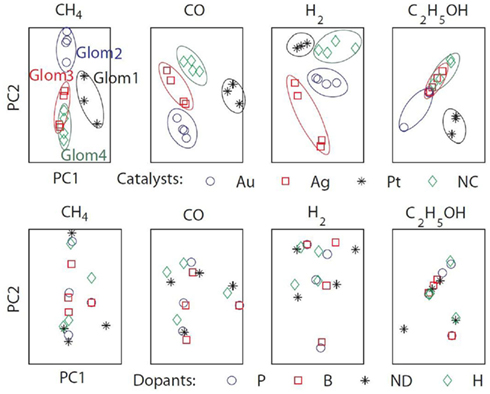
Figure 9. The sensors’ responses to target gases (methane, hydrogen, ethanol, and carbon monoxide) were projected onto two-dimensional spaces by using PCA. The first two eigenvectors accounted for more than 99% of the variance. Top: grouping the sensors according to their catalysts revealed four identifiable clusters mimicking the formation of biological glomeruli (Glom1, 2, 3, and 4). Bottom: grouping the sensors according to their dopants did not reveal any particular clustering.
The front-end of the olfactory pathway comprises a massive number (~10–100 million) of ORNs, each of which selectively expresses one or a few genes from a large (~1,000) family of receptor proteins (Buck, 2005). This massively redundant representation improves signal-to-noise ratio, providing increased sensitivity in the subsequent processing layers (Pearce et al., 2003; Koickal et al., 2007). Unlike the biological olfactory system, the electronic nose uses very few sensors with commonly one replica of only several sensor types. Progress in the fabrication of largely redundant and diverse arrays has been hindered by process complexity, variability, and cost. This is not surprising given the number of process variables (e.g., sputtering power, substrate temperature, reactant concentration, etc.) that can affect a material (Pearce et al., 2003; Röck et al., 2008). Even if a high degree of sensory diversity and redundancy was implemented, the number of connections required to read-out such an array would still be unmanageable using conventional read-out techniques. In this work, we fixed the size of our gas sensor array to 4 × 4 to limit the complexity and cost associated to the fabrication process.
When an odorant binds to an odor receptor, the receptor undergoes structural changes. This activates the olfactory-type G protein that is inside the OR neuron. Molecular studies have suggested that each ORN expresses a single type of OR genes. ORN specificity has been ascribed to that of its OR protein. Achieving analogous selective sensor response toward particular target gases involves altering the sensing surface. This can be achieved, during sensor fabrication, through the introduction of dopants (e.g., P, B, H) and/or metal additives (e.g., Pt, Ag, Au). In the fabricated 4 × 4 SnO2 sensor array, we emulated ORN specificity through the use of catalysts, with each playing the role of the OR protein. This is possible because catalysts are known to dominate the sensing mechanism and the equilibrium rate of the redox reactions between detected gas and sensor surface (Vlachos et al., 1997). This may explain why sensors sharing the same catalysts are seen to exhibit the same drift behavior (Figure 6). Mechanisms proposed to explain the catalyst control are all based on oxygen reactions at the sensor surface. The sensitivity provided by a given metal catalyst has been shown to depend on its work function because the depletion region formed inside the semiconductor has the effect of reducing the electron availability of semiconducting grains. This makes their active size smaller than the geometrical one. Furthermore, experimental results have shown that sensitivity provided by a given catalyst is directly correlated to the active grain size (Vlachos et al., 1997). In regard to the implanted dopants, their effect is to further enhance the sensitivity of the sensor by introducing impurities into the sensing material. These impurities take up some of the substitutional and interstitial sites in the lattice, creating more oxygen vacancies for adsorption.
Experimental studies have established that ORNs expressing the same OR converge precisely to a single glomerulus (or a small number of glomeruli). The implications of this convergence, in terms of coding are believed to be twofold: improved sensitivity so as to ensure detection and increased signal-to-noise ratios by averaging out of uncorrelated noise (Laurent, 1999). Raman et al. (2006) have sought to emulate this glomerular convergence by dynamically modulating the operating temperature so as to create thousands of virtual sensors.
However, the specificity of the sensors belonging to the same glomerulus cannot be controlled as it is in our technique with the analogy made between the receptor protein expressed in ORNs and the metal catalyst used in SnO2 sensors. Although capable of emulating a large number of pseudo-sensors, the approach followed in Raman et al. (2006) provides highly correlated and redundant data given that only two real sensors are used. In contrast, the sensors sharing the same catalysts in our fabricated gas sensor array exhibited different dopants to mimic the variability in terms of odorant response properties found in ORNs expressing the same OR (Grosmaitre et al., 2006; Grémiaux et al., 2011).
The actual number of virtual glomeruli was limited to 4, because of process complexity and cost considerations. Increasing the number of glomeruli to n, would increase the discriminability capability with the number of possible rank order codes increasing from 4! (i.e., 24) to n! Increasing the number of ORNs converging into a single glomerulus would further improve the sensitivity. Concentration-invariance of glomerular latency coding resulted from the power law sensor response. However, this relationship might break down at very low concentrations (Gardner and Bartlett, 1999). Our experimental setup does not allow us to control gas concentration at those levels, which would be required for applications such as trace detection of explosives or drugs. Another important factor that needs to be considered is the impact of long-term drift which occurs as a result of dynamic processes (e.g., poisoning or aging) or environmental changes (e.g., temperature and pressure conditions). Our experimental results (Figure 6) show that sensors sharing the same catalyst (i.e., belonging to the same glomerulus) exhibit the same long-term drift behavior. This observation was also reported by Sulz et al. (1993) who suggested that the overall sensor drift behavior is mainly determined by the chosen catalyst rather than the chosen dopant (Sulz et al., 1993). Vlachos et al. (1997) explained that such a behavior may be most probably due to the fact that catalysts dominate the sensing mechanism and the equilibrium rate (Vlachos et al., 1997). The above results suggest that the specificity of the catalyst and thus that of its associated glomerulus is still preserved after long-term drift. These observations could explain why the rank order of the glomerular latency code did not change after hundreds of measurements taken.
In existing electronic noses, all sensor data need to be transferred to the pattern-recognition engine to identify ambient gases (Gutierrez-Osuna, 2002). The size and power consumption required to support this traditional architecture are prohibitive because most of the current approaches for processing multivariate sensor data are direct applications of statistical and chemometric pattern-recognition techniques (Gutierrez-Osuna, 2002). In addition, these techniques rapidly break down when the dimensionality of the input space becomes large. As a result, the co-integration of sensor and circuitry has been so far limited to on-chip signal amplification, conditioning, and/or analog-to-digital conversion (Hagleitner et al., 2001; Hierlemann and Baltes, 2003; Graf, 2007). In contrast, the proposed glomerular latency coding turns the task of gas recognition into a simple code matching task. The matching can be carried out by means of simple XOR gates, enabling the integration of sensing, and processing elements on a single-chip. Furthermore, “fingerprint matching” can easily handle large sensor arrays, since it can be aborted as soon as the detected spike does not match. The proposed scheme requires a single off-line calibration to determine gas fingerprints, while gas parameters γi can be stored on-chip.
Although the proposed glomerular latency coding constitutes an excellent tradeoff between classification accuracy and implementation complexity, further work is required to generalize these results to other types of sensors and target gases.
The authors declare that the research was conducted in the absence of any commercial or financial relationships that could be construed as a potential conflict of interest.
Abraham, N. M., Spors, H., Carleton, A., Margrie, T. W., Kuner, T., and Schaefer, A. T. (2004). Maintaining accuracy at the expense of speed: stimulus similarity defines odor discrimination time in mice. Neuron 44, 865–876.
Ache, B. W., and Young, J. M. (2005). Olfaction: diverse species, conserved principles. Neuron 48, 417–430.
Baier, H., and Korsching, S. (1994). Olfactory glomeruli in the zebrafish form an invariant patternand are identifiable across animals. J. Neurosci. 14, 219–230.
Belmabrouk, H., Nowotny, T., Rospars, J.-P., and Martinez, D. (2011). Interaction of cellular and network mechanisms for efficient pheromone coding in moths. Proc. Natl. Acad. Sci. U.S.A. 108, 19790–19795.
Bhandawat, V., Maimon, G., Dickinson, M. H., and Wilson, R. I. (2010). Olfactory modulation of flight in Drosophila is sensitive, selective and rapid. J. Exp. Biol. 213, 3625–3635.
Buck, L. B. (2005). Unraveling the sense of smell (Nobel lecture). Angew. Chem. Int. Ed. Engl. 44, 6128–6140.
Chen, H. T., Ng, K. T., Bermak, A., Law, M. K., and Martinez, D. (2011). Spike latency coding in a biologically inspired micro-electronic nose. IEEE Trans. Biomed. Circuits Syst. 5, 160–168.
Gardner, J. W., and Bartlett, P. N. (1999). Electronic Noses, Principles and Applications. Oxford: Oxford University Press.
Grémiaux, A., Nowotny, T., Martinez, D., Lucas, P., and Rospars, J.-P. (2011). Modelling the signal delivered by a population of first-order neurons in a moth olfactory system. Brain Res. doi:10.1016/j.brainres.2011.09.035
Grosmaitre, X., Vassalli, A., Mombaerts, P., Shepherd, G. M., and Ma, M. (2006). Odorant responses of olfactory sensory neurons expressing the odorant receptor MOR23: a patch clamp analysis in gene-targeted mice. Proc. Natl. Acad. Sci. U.S.A. 103, 1970–1975.
Gutierrez-Osuna, R. (2002). Pattern analysis for machine olfaction: a review. IEEE Sens. J. 2, 189–202.
Hagleitner, C., Hierlemann, A., Lange, D., Kummer, A., Kerness, N., Brand, O., and Baltes, H. (2001). Smart single-chip gas sensor microsystem. Nature 414, 293–296.
Hildebrand, J. G., and Shepherd, G. M. (1997). Mechanisms of olfactory discrimination: converging evidence for common principles across phyla. Annu. Rev. Neurosci. 20, 595–631.
Hopfield, J. J. (1995). Pattern recognition computation using action potential timing for stimulus representation. Nature 376, 33–36.
Jacquin-Joly, E., and Lucas, P. (2005). Pheromone reception and transduction: mammals and insects illustrate converging mechanisms across phyla. Curr. Top. Neurochem. 4, 75–105.
Junek, S., Kludt, E., Wolf, F., and Schild, D. (2010). Olfactory coding with patterns of response latencies. Neuron 67, 872–884.
Koickal, T. J., Hamilton, A., Tan, S. L., Covington, J. A., Gardner, J. W., and Pearce, T. C. (2007). Analog VLSI circuit implementation of an adaptive neuromorphic olfaction chip. IEEE Trans. Biomed. Circuits Syst. 54, 60–73.
Koulakov, A., Gelperin, A., and Rinberg, D. (2007). Olfactory coding with all-or-nothing glomeruli. J. Neurophysiol. 98, 3134–73142.
Margrie, T. W., and Schaefer, A. T. (2003). Theta oscillation coupled spike latencies yield computational vigour in a mammalian sensory system. J. Physiol. 546, 363–374.
Martinez, D., Rochel, O., and Hugues, E. (2006). A biomimetic robot for tracking specific odors in turbulent plumes. Auton. Robots 20, 185–195.
Mori, K., Nagao, H., and Yoshihara, Y. (1999). The olfactory bulb: coding and processing of odor molecule information. Science 286, 711–715.
Ng, K. T., Chen, H. T., Boussaid, F., Bermak, A., and Martinez, D. (2009). A robust spike-based gas identification technique for SnO2 gas sensors. IEEE Int. Symp. Circuits Syst. 553–556.
Pearce, T. C., Schiffman, S. S., Nagle, H. T., and Gardner, J. W. (2003). Handbook of Machine Olfaction. Weinheim: Wiley-VCH.
Persaud, K., and Dodd, G. H. (1982). Analysis of discrimination mechanisms in the mammalian olfactory system using a model nose. Nature 299, 352–355.
Raman, B., Sun, P. A., Gutierrez-Galvez, A., and Gutierrez-Osuna, R. (2006). Processing of chemical sensor arrays with a biologically inspired model of olfactory coding. IEEE Trans. Neural Netw. 17, 1015–1024.
Röck, F., Barsan, N., and Weimar, U. (2008). Electronic nose: current status and future trends. Chem. Rev. 108, 705–725.
Rospars, J. P. (1988). Structure and development of the insect antennodeutocerebral system. Int. J. Insect Morphol. Embryol. 17, 243–294.
Smear, M., Shusterman, R., O’Connor, R., Bozza, T., and Rinberg, D. (2011). Perception of sniff phase in mouse olfaction. Nature 479, 397–400.
Strausfeld, N. J., and Hildebrand, J. G. (1999). Olfactory systems: common design, uncommon origins? Curr. Opin. Neurobiol. 9, 634–639.
Sulz, G., Kühner, G., Reiter, H., Uptmoor, G., Schweizer, W., Low, H., Lacher, M., and Steiner, K. (1993). Ni, In and Sb implanted Pt and V catalysed thin-film SnO2 gas sensors. Sens. Actuators B Chem. 16, 390–395.
Vlachos, D. S., Papadopoulos, C. A., and Avaritsiotis, J. N. (1997). Characterization of the catalyst-semiconductor interaction mechanism in metal-oxide gas sensors. Sens. Actuators B Chem. 44, 458–461.
Vosshall, L. B., Wong, A. M., and Axel, R. (2000). An olfactory sensory map in the fly brain. Cell 102, 147–159.
Wesson, D. W., Carey, R. M., Verhagen, J. V., and Wachowiak, M. (2008). Rapid encoding and perception of novel odors in the rat. PLoS Biol. 6, e82. doi:10.1371/journal.pbio.0060082
Keywords: glomerular convergence, latency coding, olfaction, electronic nose, chemical sensing, gas sensors, neuromorphic engineering
Citation: Yamani JA, Boussaid F, Bermak A and Martinez D (2012) Glomerular latency coding in artificial olfaction. Front. Neuroeng. 4:18. doi: 10.3389/fneng.2011.00018
Received: 30 September 2011;
Paper pending published: 16 October 2011;
Accepted: 02 December 2011;
Published online: 03 January 2012.
Edited by:
Thomas Nowotny, University of Sussex, UKReviewed by:
Agustín Gutierrez-Galvez, Universitat de Barcelona, SpainCopyright: © 2012 Yamani, Boussaid, Bermak and Martinez. This is an open-access article distributed under the terms of the Creative Commons Attribution Non Commercial License, which permits non-commercial use, distribution, and reproduction in other forums, provided the original authors and source are credited.
*Correspondence: Dominique Martinez, Unité Mixte de Recherche 7503, Laboratoire Lorrain de Recherche en Informatique et ses Applications, CNRS, 54506 Vandoeuvre-lès-Nancy, France. e-mail:ZG9taW5pcXVlLm1hcnRpbmV6QGxvcmlhLmZy
Disclaimer: All claims expressed in this article are solely those of the authors and do not necessarily represent those of their affiliated organizations, or those of the publisher, the editors and the reviewers. Any product that may be evaluated in this article or claim that may be made by its manufacturer is not guaranteed or endorsed by the publisher.
Research integrity at Frontiers

Learn more about the work of our research integrity team to safeguard the quality of each article we publish.