- IMS Laboratory, UMR 5218 CNRS, Polytechnic Institute of Bordeaux, University of Bordeaux, Talence, France
We present a study on wavelet detection methods of neuronal action potentials (APs). Our final goal is to implement the selected algorithms on custom integrated electronics for on-line processing of neural signals; therefore we take real-time computing as a hard specification and silicon area as a price to pay. Using simulated neural signals including APs, we characterize an efficient wavelet method for AP extraction by evaluating its detection rate and its implementation cost. We compare software implementation for three methods: adaptive threshold, discrete wavelet transform (DWT), and stationary wavelet transform (SWT). We evaluate detection rate and implementation cost for detection functions dynamically comparing a signal with an adaptive threshold proportional to its SD, where the signal is the raw neural signal, respectively: (i) non-processed; (ii) processed by a DWT; (iii) processed by a SWT. We also use different mother wavelets and test different data formats to set an optimal compromise between accuracy and silicon cost. Detection accuracy is evaluated together with false negative and false positive detections. Simulation results show that for on-line AP detection implemented on a configurable digital integrated circuit, APs underneath the noise level can be detected using SWT with a well-selected mother wavelet, combined to an adaptive threshold.
Introduction
Analyzing and understanding signals in human cerebral cortex, is the ultimate goal of many scientists in the field of neuroscience. This work proposes insights on analyzing tools for better decoding neural signals and consequently understand mechanisms of cortical computation (Fee et al., 1996; Cao, 1997; Azouz and Gray, 1999; Nirenberg and E-Lathman, 2003; Brown et al., 2004; Laubach, 2004; Obeid and Wolf, 2004), by the mean of wavelet detection methods of neuronal activity. Decoding communication between neurons and networks is for example mandatory in prosthesis intended to overcome handicaps such as blindness or limb amputation (Burrow et al., 1997; Buffoni et al., 2003; Carmena et al., 2003; Rothschild, 2010). One bottleneck in this domain is the lack of generic rules for deciding neural signal. A bottom-up axis of research is to measure the influx exchange between neurons, known as action potentials (AP) or spikes. An AP is a pulse in the membrane voltage of an excitable biological cell, like a neuron, after a membrane depolarization in response for example to stimulation inputs received from presynaptic neurons or sensory inputs. When neural signals are recorded using extracellular electrodes, spikes are measured by capacitive coupling and appear as weak amplitude signals (50–500 μV) with a low signal to noise ratio (SNR); APs frequency components are in the 100-Hz to 10-kHz frequency band, and their duration is a few milliseconds (Rangayyan, 2002; Finn and Lopresti, 2003). For active neurons, the spiking rate usually varies from 10 to 120 occurrences per second (Harrison et al., 2007). With these characteristics, visual spike detection becomes ineffective (Wood et al., 2004). Therefore automatic and real-time AP detection is essential for any application that requires continuous communication between excitable cells and electronics.
Extracellular recordings present a major advantage (compared to intracellular recordings) in terms of success rate and long-term monitoring; but they present a particularly low AP signal/noise ratio. Main noise sources are: – the cellular activity in the electrode spatial environment; – measurement device and electronics (Oweiss and Anderson, 2001; Obeid and Wolf, 2004). Due to its multiple components, characterizing precisely noise in cortical extracellular electrode is extremely complex (Musial et al., 2002; Pouzat et al., 2002; Kim and Kim, 2003). However, noise is commonly considered to follow a Gaussian distribution (Sahani et al., 1998; Oweiss and Anderson, 2001), and to have a flat power spectral density (« white») in the neural signal frequency band (Chandra and Optican, 1997; Folkers et al., 2003; Watkins et al., 2004).
Automatic biopotential detectors have been proposed for real-time detection (Harrison, 2003; Watkins et al., 2004; Olsson and Wise, 2005; Gosselin and Sawan, 2008, 2009). The most intuitive method is to use an adaptive threshold on the raw signal to detect APs. But in noisy environments like cells cultures, when APs are embedded in background noise, this method becomes ineffective. An alternative is to use a pre-processor which amplifies AP-like shapes and attenuates out-of-band noise. Followed by a thresholding function, it will increase the detection rate together with the spike-to-noise ratio. Mtetwa and Smith (2006), Paterson et al. (2008) introduce efficient pre-processing methods for APs detection (Teager Energy Operator, Normalized Cumulative Energy Difference, Phase-Space, Summation, Convolution-based template matching). However most of these methods are not efficient when processing noisy signals (SNR < 5). This justifies investigations on alternative spike detection techniques.
The wavelets transform was considered only recently as a relevant pre-processing method in the context of neural signal processing. It has since been successfully used in biomedical applications (Sweldens, 1995; Unser and Aldroubi, 1996; Hulata et al., 2000; Nakatani et al., 2001; Addison, 2002; Folkers et al., 2003; Karel et al., 2005; Lee and Kipke, 2006; Yuning et al., 2010). The interest for this method lies in its capability of compression and time–frequency localization for feature extraction. Some wavelet-based methods were already successfully implemented for offline neural processing (Lewicki, 1994; Wickerhauser, 1994; Hwan and June, 2003; Kim and Kim, 2003; Salmanpour et al., 2008; Manjunath and Ravikumar, 2010). These methods were tested for specific AP shapes, and were implemented in software. In most cases, real-time computation was not considered as an issue (by “real-time” we mean here and for the rest of the paper that the period for processing incoming data is lower than the sampling period, i.e., each new sample is processed before the arrival of the next sample).
We present here a study on wavelet detection methods of neuronal APs. Our final goal is to implement the selected algorithms on custom integrated electronics for on-line processing of neural signals. For that purpose, we investigate the influence on spike detection success rate of different wavelet types and detection parameters.
This paper is organized as follow: Section “Materials and Methods” reviews the wavelet theory. Section “Results” describes the generation of artificial neural signals, APs detection, and the process evaluation. Section “Discussion” presents experimental results with artificial and real neural signals, and concludes the paper.
Materials and Methods
Wavelet Theory
The wavelet principle has been developed as an alternative to the Fourier transform for overcoming eventual resolution problem (Phillies et al., 1996). The wavelet analysis is built in a similar way to the Fourier one: a signal is convolved by a function identified as the mother wavelet (1) [similarly to the window function for the Fourier transform (2)] and the transform is computed for different segments of the signal in the temporal (translation factor b) and in the frequency field (dilatation factor a). While the Fourier transform has a uniform time–frequency distribution the wavelet transform provides a multi resolution analysis (MRA; Daubechies, 1992; Finn and Lopresti, 2003).

where  is the mother wavelet and ψ(t) a wave-like window function with zero means.
CWT corresponds to the continuous wavelet transform. a (dilatation factor) and b (translation factor) provide the wavelet MRA advantage and represent respectively the temporal and frequency field.

where STFT represents the short time Fourier transform, g(t) a positive window function centered on zero and  .
.
In CWT, thanks to the dilatation factor (a), the window (mother wavelet: ψa,b) width decreases when frequency increases, while the window (g) width for STFT is constant. In that case, this wavelet convolution method provides both a good time resolution at high frequencies and a good frequency resolution at low frequencies. These features are significant when the real signal has high frequency components for short periods and low frequency components for long periods. As APs present these exact features, wavelets-based processing seems to be relevant for AP detection.
Discrete wavelet transform filter bank
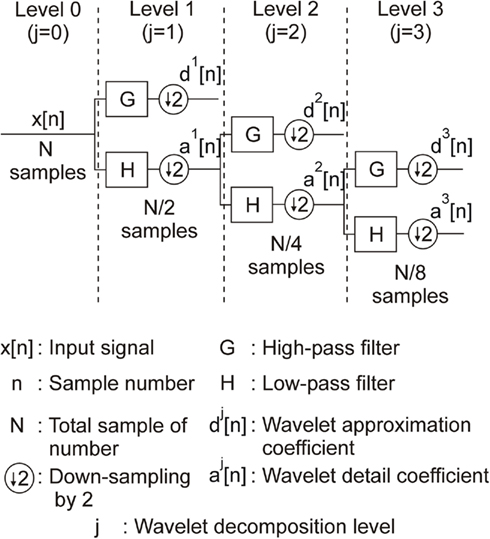
One of the most reliable digital implementation methods of wavelet transforms is based on a pyramidal algorithm called discrete wavelet transform (DWT) and developed by Mallat (1989). This method is based on a filter bank decomposition on an orthogonal base realized by a convolution between an original signal x[n] and two filters: an high-pass filter (G) which computes dj[n] (so-called “wavelet detail coefficient”) at decomposition level j; a low-pass filter (H) which computes aj[n] (so-called “wavelet approximation coefficient”) at decomposition level j (see Figure 1).
Convolution operations realized by G and H are described by Eqs 3 and 4.


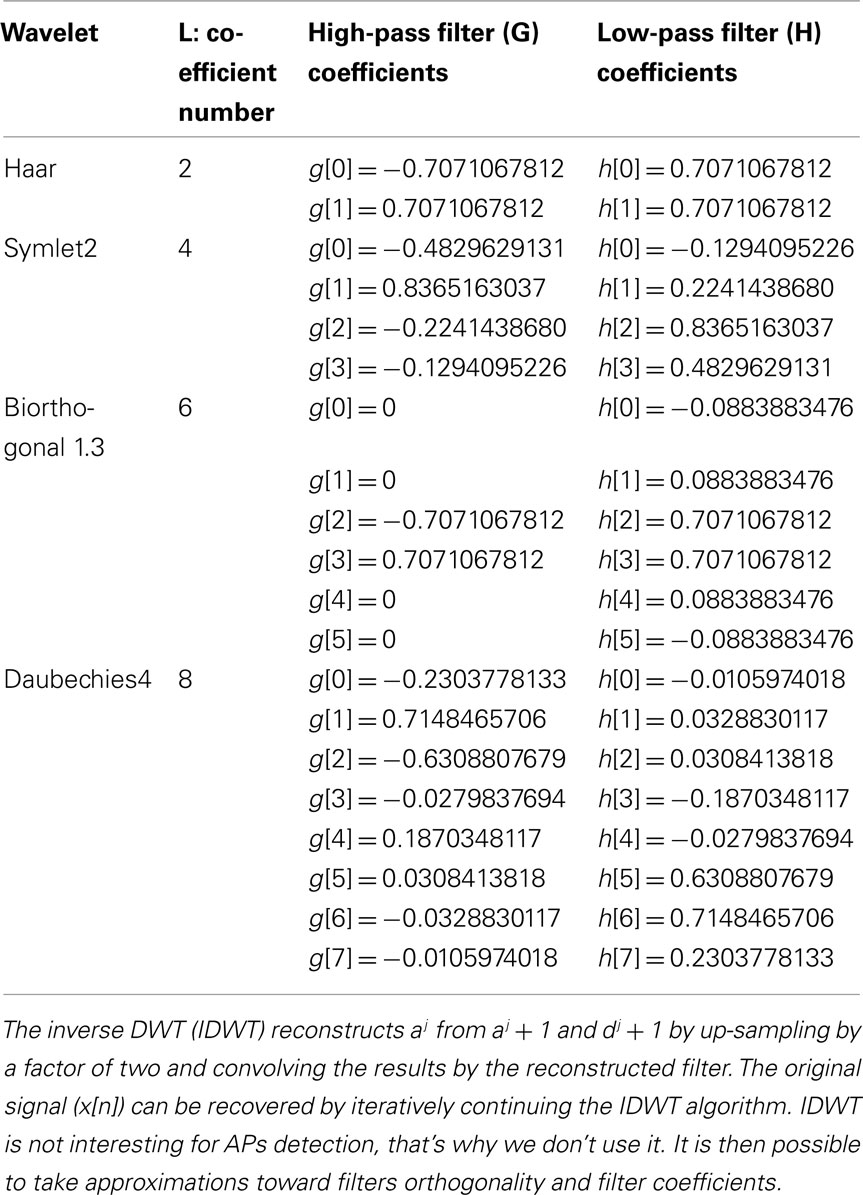
where L represents the order of the wavelet filters, typically between 2 and 8 (see Table 1), j the current wavelet decomposition level, n the sample number. g[k] and h[k] are the filter coefficients of the low-pass and the high-pass filters. Note that both approximation and detail wavelet coefficients at level j only depend on the approximation wavelet coefficient at level (j − 1). This set of two wavelet filters composes the mother wavelet, which shape is adjusted by the coefficients (g[k] and h[k]) contrary to the Fourier transform where the convolution function is fixed. The choice of the mother wavelet coefficients has to be done carefully; usually, the more the mother wavelet shape is similar to the AP shape, the more the detection is efficient.
As illustrated in Figure 1, each wavelet detail coefficient at level j (dj) is a band-pass filter between [1/4; 1/2]*2−j using normalized frequencies. In our application, with a sampling frequency of 10 kHz, the frequency bands are respectively [625; 1250]Hz for d2, [312; 625]Hz for d3, and [156; 312]Hz for d4. This helps optimizing the wavelet detection level according to the energy in frequency domain for a specific AP type.
In Figure 2, we can see mother wavelets which shape is similar to the AP we chose for our study. Table 1 lists the corresponding coefficients g[n] and h[n]. These coefficients can be found in Meyer (1992), Coifman et al. (1992), Strang and Nguyen (1996), and Mallat (1998).
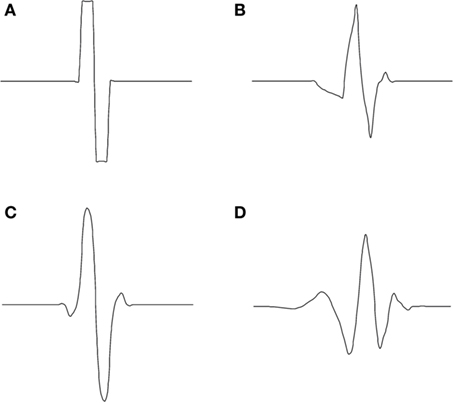
Figure 2. Examples of mother wavelets: (A) Haar, (B) Symlet2, (C) Biorthogonal 1.3, and (D) Daubechies4 (Daubechies, 1992).
Stationary wavelet transform filter bank
The main problem for the practical use of DWT is that it is not time-invariant, which means that temporal shifts in the input signal will produce different sets of DWT coefficients (Salmanpour et al., 2008).
Stationary wavelet transform (SWT) solves that issue by omitting the DWT down-sampling decimation. The approximation and the detail outputs of each level of SWT contain the same number of samples as the input. Figure 3 represents the digital SWT filter bank.
A N input vector gives N detail coefficients and N approximation coefficients at each level of decompositon. The resulting information redundancy increases the power of wavelet detection.
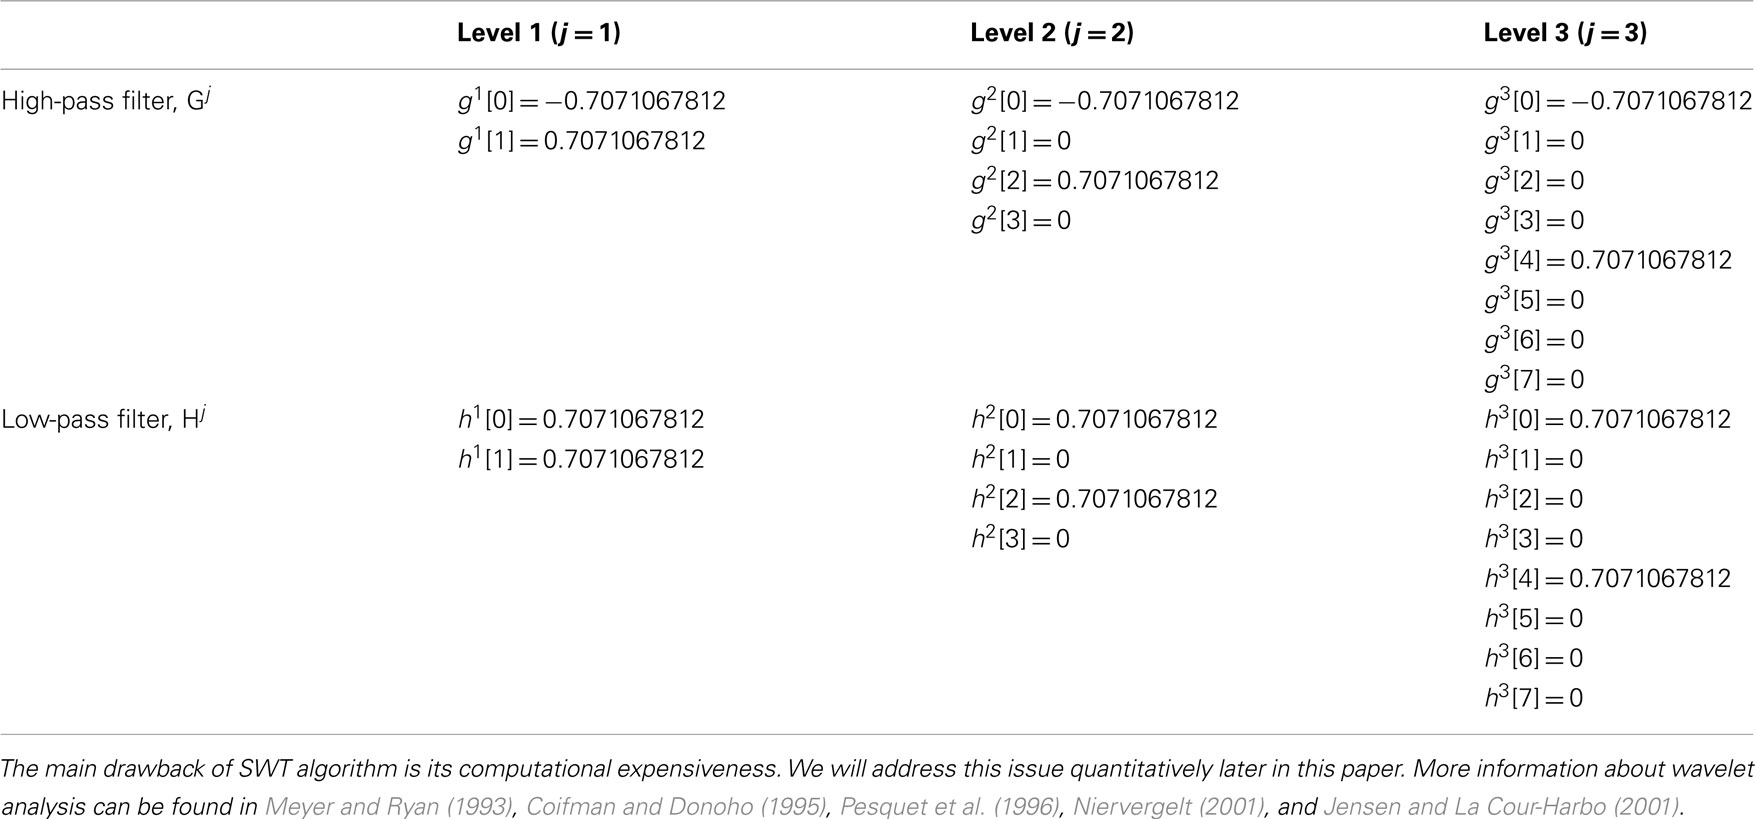
Contrary to the DWT where all filter coefficients are identical, in SWT they are different thanks to up-sampling (Figure 3). One example of the coefficients of the up-sampled filter is presented for Haar mother wavelet in Table 2.
Action Potential Detection Strategy
We describe in this paragraph the different strategies we used for AP detection, together with the related wavelet algorithms. The associated architectures were designed for future implementation on a configurable digital integrated circuit (FPGA type).
Raw thresholding (adaptive or not) is the cheapest method to extract APs, in terms of computational cost. Threshold-based detection is applied directly on the raw signal without any pre-processing. A spike is detected when the absolute value of the signal is above the threshold. An absolute threshold can be set manually above the background activity level, and be roughly optimized to minimize detection errors. But in most cases this method is not robust enough for extracting AP in a noisy or unstable environment.
Donoho proposes to use an adaptive threshold (T) defined using the algorithm introduced in Donoho (1994). Equations are given in Eqs 5 and 6. This algorithm was developed with the assumption that the input to the system consists of spikes added to band-limited white Gaussian noise (Watkins et al., 2004).

where N is the number of samples of the full-length neural signal, σ is the SD of the Gaussian noise calculated by Eq. 6.

s[n] is the input signal where the SD is computed. This SD computation method is generally used for offline AP detection. It is not adapted for real-time APs extraction since it post-processes the whole signal to detect local events. Without pre-processing s[n] corresponds to the raw signal but with wavelet pre-processing it corresponds to the first detail level d1[n].
To ensure real-time computation, a first step is to add a low-pass filter for a continuous estimating of σ. Depending on the filter time constant, a preset period has to be considered at the start of the experiment before the threshold is correctly set. For low SNR signals this detection method is however limited as APs amplitude can be lower than average noise.
Our strategy for on-line AP detection is to implement a pre-processor which emphasizes APs shapes and attenuates out-of-band noise, followed by a thresholding circuit which discriminates AP events. In our case, the pre-processing algorithm is the DWT or the SWT and the thresholding is computed in real-time.
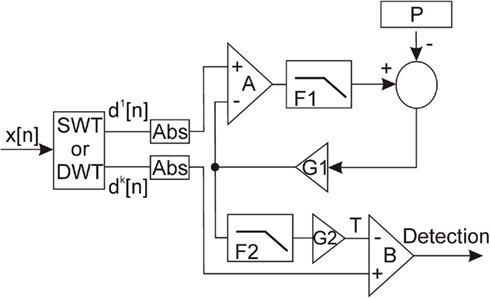
A block diagram of the wavelet detection module is presented in Figure 4. The SWT or DWT module provides the first level d1 and the most effective detail level (dk) for the application of the threshold. σ is dynamically estimated on the first detail level d1 using a feedback loop. We use d1 instead of the raw signal because it is obtained after a high-pass filter which keeps only the highest frequency of the signal. In these conditions signal with low variations are removed and a better computation of the SD is obtained. Within the loop the signal and its estimated σ are compared (Harrison, 2003) by the comparator A. The output of A is a binary pulsatile signal, which mean value is a linear representation of the ratio of samples above the estimated σ. A low-pass filter (F1) extracts this mean value with a gain of G1. The difference between this value and a reference P is fed back to the comparator A. This signal is an estimation of the input data SD σ. The user must set the reference P depending on the approximate distribution of the processed signal. For a white Gaussian noise signal, the probability of a sample absolute value to be over σ is 0.318. In that case the reference in the control loop is set to 0.318. We chose that configuration according to Addison (2002). We use absolute sample values to increase the reference ratio and reduce constraints on the low-pass filter F1. Finally, after a low-pass filter (F2) that stabilizes its value, the threshold T is calculated as shown in Eq. 7, where G2 gain is an integer in the range of 0 and 3.

G2 is defined by the user according to its experience and to the neural signal. For a white Gaussian noise, 95% of samples are between 0 and 3σ, so setting the threshold above this range ensures a correct spike detection (Watkins et al., 2004).
The transfer function of the digital low-pass filters F1 and F2 is:

H is a Butterworth low-pass filter, which cut-off frequency is 10 Hz and sampling frequency is 10 kHz. Due to the hardware implementation prospective, we encode H parameters in fixed-point 16 bits format. They were computed using MATLAB and are listed in Table 3.
In all our analysis, we assume that the noise is Gaussian and white. If noise is colored, a preliminary noise characterization is necessary and G1 and the P reference have to be adjusted consequently.
Materials and Methods
Method for generating references neural signal
We intend in this paper to compare different methods for APs detection on various of neural signals. For a quantitative comparison, we ran initial tests on artificial neural signals for which the waveform and timing of all APs are known. We present results obtained using three types of neural signals (see Figure 5, for APs waveforms and patterns).
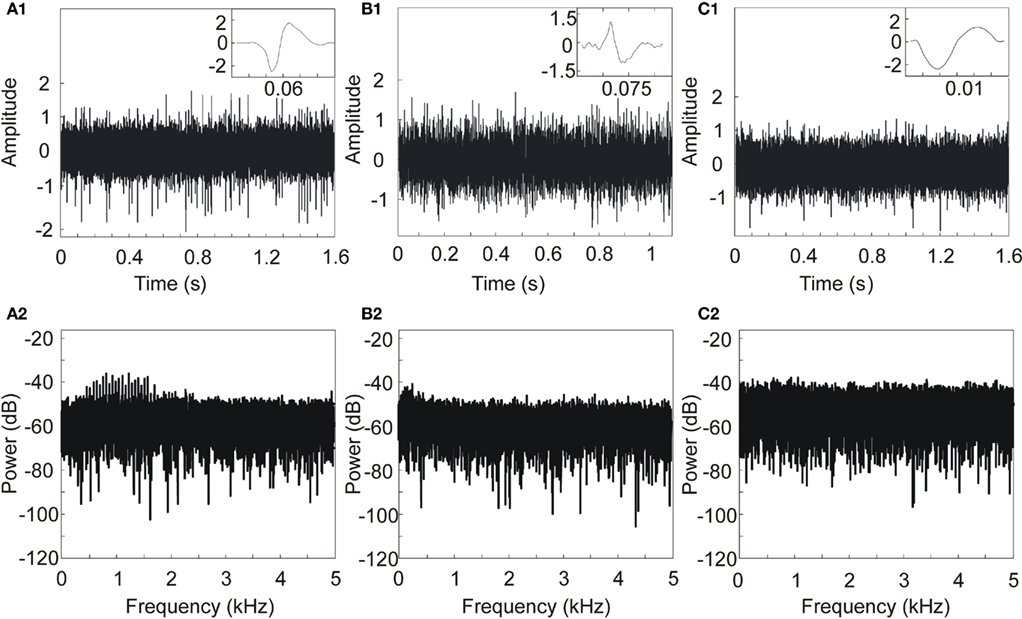
Figure 5. Three artificial neural signals with SNR = 5 and different APs shapes and patterns. (A) 50-AP pattern; AP from monkey in vivo recordings (courtesy from Boraud et al., 2005), (B) 18-AP pattern; APs are reconstructed from Quiroga et al. (2004) APs, (C) 10-AP pattern; APs are reconstructed from Nenadic and Burdick (2005) APs. Upper line: AP shapes and neural signals. Bottom line: power spectral density of neural signals.
The design of artificial neural signals consists in three steps: the first one is to define the AP waveform, specific to each of our test signals. Two of them are inspired from literature: Figure 5B (Quiroga et al., 2004) and Figure 5C, (Nenadic and Burdick, 2005). The third AP (Figure 5A) was recorded in vivo from Macaca mulatta monkeys in the resting state with glass-coated tungsten microelectrodes (impedance 0.5 MΩ at 1 kHz) at a frequency of 10 kHz. The second step consists in creating a signal (x[n]) where AP waves appear randomly (with three different amplitudes). Finally, by adding a Gaussian noise to x[n] (Eq. 9), we obtain the artificial neural signal (y[n]) with a defined SNR.

K is a coefficient chosen in order to define a specific SNR for each neuronal signal. n is the sample number. χ[n] is a pseudo-random sequence which distribution is centered on 0 and variance is 1.
Signal to noise ratio is computed using Eq. 11, which is a variation of the general SNR Eq. 10. Equation 11 emphasizes the weight of APs in the SNR, which would not be significant otherwise considering the short duration of AP event.


spike corresponds to the AP shape, x[n] is s[n] in Eq. 6.
We ran simulations with different SNR values: from 0 to 10 dB by steps of 1 dB. Figure 5 shows three examples of artificial neural signals designed with a SNR of 5 and different AP shapes. The number of APs in each signal is variable: 50 spikes in Figure 5A, 18 spikes in Figure 5B and 10 spikes in Figure 5C, with no overlap between APs. The signal was computed using MATLAB©. To complete the characterization, we computed for each signal its power spectral density. Spectra don’t present signature lines that would be representative of AP occurrence; therefore a simple Fourier analysis would not have been sufficient to detect all APs.
The AP waves are sampled at 10 kHz and have to be noiseless, as a Gaussian noise is added during the construction of the neural signal. This characteristic is essential for the success of the wavelet AP detection in our simulations. If the original AP has its own noise component, SNR will be lower than expected because of the added Gaussian noise. To fit that constraint, we have applied a smoothing algorithm (median method) on the in vivo recorded AP, with the method of the median, as shown in Figure 6.
Evaluation method for the AP detection algorithm
Our method do classify AP detection algorithms for a future hardware implementation, is as follows:
At first the method for calculating the threshold has to be defined. We don’t know a priori which level of the wavelet transform gives the best compromise for threshold detection of APs for a given mother wavelet.
Then, we compare the detection methods described above (raw thresholding, DWT, and SWT). The detection ratio for each method is an important parameter, but we also consider the number of operations for each method in order to reduce the estimated implementation cost on an integrated circuit (device area and power consumption).
Thirdly, we underline the role of the mother wavelet in APs detection by comparing the results with different kinds of mother wavelets. We implemented two computation schemes for each of these mother wavelets. These schemes correspond to different precision levels on the filter coefficients: standard 10-digits coding from the literature, then lower precision (1% of the full range value).
Results
This section shows the simulation results obtained with MATLAB. Statistical analysis was conducted on 50 realizations. Input signals length is in the range [1s; 2s] (specified in figures); sampling frequency is 10 kHz. The p-values and errors bars have been calculated, but not plotted due to its extremely low values, which was expected as we present a synthesis of software simulations.
Thresholding Computation Effects on APs Wavelet Detection
This section addresses the discussion of Section “Evaluation Method for the AP Detection Algorithm”: at which wavelet level should the thresholding be applied to detect APs? Indeed as shown in Figure 7, it depends from the detail level in the wavelet decomposition.
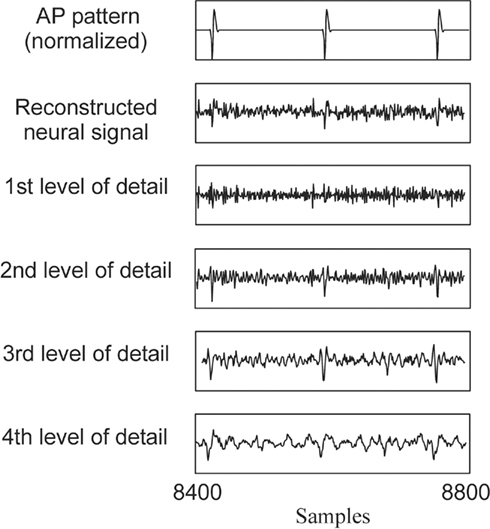
Figure 7. Stationary wavelet decomposition from the signal with monkey APs (Figure5A).
In order to set a level for APs detection, we have simulated the response to threshold detection when changing the decomposition level after which we compute the threshold. Results are presented in Figure 8.
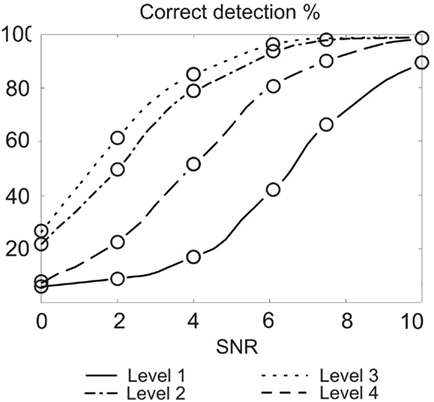
Figure 8. Correct detection rate for different thresholding at different decomposition level, depending on SNR. We used SWT and Haar mother wavelet. Maximum error bar is 0.93% (not represented); p-values and false positive are not significant.
Results show that for SWT with a neural signal sampled at 10 kHz, the percentage of correct detection is the best when applying the threshold on the third level of wavelet decomposition. In term of operations, computation cost on level three is three times higher than on level 1. Detection rate is also correct on level 2 with a cost of two times that of level 1. Still, for a given SNR, level 3 detection provides performance of level 2 if the SNR is lower by 1 dB. The 50% increase in computational cost is acceptable compared to the efforts required to provide such a SNR difference. This result will change with the increase of the sampling frequency, improving results for the level 3 based detection. Above 17 kHz sampling, level 4 becomes in turn more performing than level 3, which is expected since digital filters frequency response is highly dependent on the sampling frequency. Level 3 detection is then accurate from 8.5 to 17 kHz, which is compatible with biological signal features (spectrum of APs is below 3 kHz). We expect best performance of our system at the geometrical center of this band, which is about 12 kHz but this needs to be further studied and confirmed.
Denoising Technique Effects on APs Detection
We compare here the three detection methods for the three artificial neural signals at various SNR. The first method uses raw signals (no transformation), the second one uses DWT, and the last uses SWT. We plotted in Figure 9: the rates of correct detection for each signal with three different detection methods.
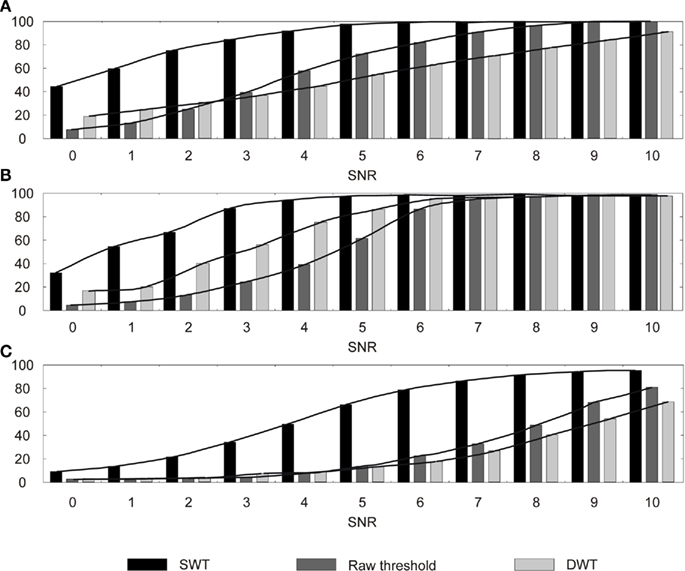
Figure 9. Action potential detection results for three detection methods (Raw threshold, SWT, DWT) depending on the signal SNR for: (A) In vivo monkey APs, (B) Quiroga APs, (C) Nenadic APs. Maximum error bar is 0.86% (not represented); p-values and false positive are not significant.
In terms of detection efficacy, SWT is clearly the best solution for all signals. Its results are comparable to other methods with SNR lower by 2–4 dB. In terms of algorithm computation, if we consider that a level of wavelet decomposition costs one resource unit, DWT costs 1.75 resources thanks to the factor 2 down-sampling (1 for the first level, 0.5 for the second level, and 0.25 for the third) and the SWT costs 3 resources. As a result, SWT uses 58.3% resources more than DWT. Despite this drawback, SWT appears to be the best choice compared to DWT and raw threshold when the dominant objective is detection performance.
It is also worth mentioning that for a 5-dB SNR (Figure 5), AP extraction with a simple threshold is not possible whereas SWT provides excellent results. We get very high detection rates for in vivo monkey spikes and Nenadic spikes and above 60% for Quiroga spikes, which is still relevant for analyzing a network activity. This comparison shows the power of SWT for extracted AP from noisy signal, but also demonstrates the strong dependence of the detection rate to the nature of the neural signal.
Effect on APs Detection of Mother Wavelet Shape and Coefficient Reduction
In this section, we study the effect of the mother wavelet shape on the APs detection. We illustrate the study in Figure 10 by measurements on the in vivo AP-based neural signals.
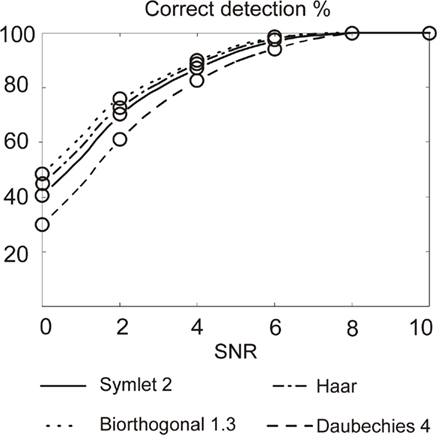
Figure 10. Correct detection rate with four mother wavelets on in vivo AP neural signal. Maximum error bar is 0.99% (not represented); p-values and false positive are not significant.
We observe that the use of the Bior1.3 (Biorthogonal 1.3) mother wavelet results in the best correct detection rate. Figure 2, which represents the four mother wavelets used in this study, shows the similarities between the Bior1.3 mother and the AP. This confirms SWT detection is all the more efficient than the shape of the mother is similar to the APs in the neural signal.
In terms of computation cost, we expect a mother wavelet with as less coefficients as possible (see number of coefficients in Table 1). For a hardware implementation, Haar mother wavelet with its four coefficients and it good detection results is definitely appropriate for APs detection in our configuration.
In parallel, in order to minimize the silicon area for hardware implementation, it is possible to reduce the computation precision while limiting the degradation of the AP detection rate. As an illustration, we present in Figure 11 the AP detection rate when the same mother wavelet is computed with high and low precision coefficients.
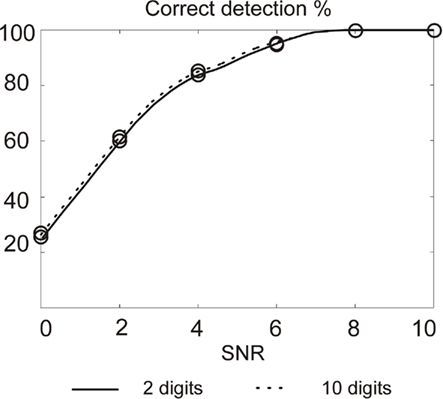
Figure 11. Action potentials detection rate using 2 and 10 digits for coding wavelet filters coefficients. Maximum error bar is 0.94% (not represented); p-values and false positive are not significant.
Results show a small difference on the detection rate. Of course, using 2-digit coefficients implies loosing the precise orthogonality of the two filters. This is however not a case of matter since we are not interested by the properties it brings in terms of signal reconstruction.
A 2-digit coefficient can be coded using 8 bits, while a 10-digit value requires 34 bits. Silicon area in digital hardware almost linearly depends on the date format (number of bits) for storage and additions. For multipliers, the relationship is quadratic for a given computation time or just linear if we extend linearly the computation time. By limiting the coefficients resolution, we will therefore release the constraints on the silicon area, which is usually a limiting factor in the context of implementing parallel detection devices on high density multi-electrode arrays.
Discussion
We propose in this paper an implementation study for an adaptive detection method using wavelet transforms. We investigated the influence on the detection success rate of different design choices: detection method, mother wavelet, wavelet detection level, sampling frequency, digital resolution of coefficient.
Our main conclusions are: (a) in terms of APs detection rate, SWT appears as the best solution. Although this method requires more computational power than DWT, its cost is limited by the fact that it is only requires computation at the third detail level; (b) the mother wavelet has to be defined in accordance with the AP shape; (c) wavelet filters with few coefficients perform excellent spike detection in a noisy environment; (d) that high-precision computation is not necessary: encoding the wavelet filter coefficients on 2 bits rather than 10 bits only degrades the detection rate by a few percents, and strongly reduces the computational cost.
This study provides new inputs for the implementation of adaptive threshold wavelet-based detection, adapted to neural signals in extracellular recordings. We will use it for the design of a hardware microelectronic device, to be integrated with micro-electrode arrays in neural acquisition systems.
Conflict of Interest Statement
The authors declare that the research was conducted in the absence of any commercial or financial relationships that could be construed as a potential conflict of interest.
Acknowledgments
This work was supported by the European Union (EU Grant 15879, FACETS) and University of Bordeaux. The authors thank Emilie Syed from MAC laboratory, UMR 5227, University of Bordeaux 2 for experimental data, and Timothée Levi from IMS laboratory, UMR 5218, University of Bordeaux 1 for MATLAB support.
References
Addison, P. (2002). The Illustrated Wavelet Transform Handbook: Introductory Theory and Applications in Science, Engineering, Medicine and Finance. Bristol: Institute of Physics Publishing.
Azouz, R., and Gray, C. M. (1999). Cellular mechanisms contributing to response variability of cortical neurons in vivo. J. Neurosci. Methods 19, 2209–2223.
Boraud, T., Brown, P., Joshua, A., Goldberg, J. A., Graybiel, A. M., and Magill, P. J. (2005). “Oscillation in the basal ganglia: the good, the bad, and the unexpected,” in The Basal Ganglia VIII, eds J. P. Bolam, C. A. Ingham, and P. J. Magill (New York, NY: Springer Science and Business Media), 632.
Brown, E. N., Kass, R. E., and Mitra, P. P. (2004). Multiple neural spike data analysis: state-of-the-art and future challenges. Nat. Neurosci. 7, 4456–4461.
Buffoni, L. X., Coulombe, J., and Sawan, M. (2003). An image processing system dedicated to cortical visual stimulators. IEEE CCECE 3, 1497–1500.
Burrow, M., Dugger, J., Humphrey, D., Reed, D. J., and Hochberg, L. R. (1997). Cortical Control of a Robot Using a Time-Delay Neural Network. Final Report, NIH/NINDS Contract N01-NS-1–2308.
Cao, S. (1997). Detection, classification, and superposition resolution of action potentials in multiunit single-channel recordings by an on-line real-time neural network. IEEE Trans. Biomed. Eng. 44, 403–412.
Carmena, J. M., Lebedev, M. A., Crist, R. E., O’Doherty, J. E., SantucciI, D. M., Dimitrov, D. F., Patil, P. G., Henriquez, C. S., and Nicolelis, M. A. (2003). Learning to control a brain-machine interface for reaching and grasping by primates. PLoS Biol. 1, 1–16. doi:10.1371/journal.pbio.0000042
Chandra, R., and Optican, L. M. (1997). Detection, classification, and superposition resolution of action potentials in multiunit single-channel recordings by an on-line real-time neural network. IEEE Trans. Biomed. Eng. 44, 403–412.
Coifman, R. R., and Donoho, D. L. (1995). Translation-invariant de-noising. Lect. Notes Stat. 103, 125–150.
Coifman, R. R., Meyer, Y., and Wickerhauser, M. V. (1992). “Wavelet analysis and signal processing,” in Wavelets and their Applications, ed. B. Ruskai (New York, NY: Jones and Barlett) 125–150.
Daubechies, I. (1992). Ten Lectures on Wavelets. Philadelphia, PA: Society for Industrial and Applied Mathematics.
Donoho, D. L. (1994). Nonlinear wavelet methods for recovery of signals, densities, and spectra from indirect and noisy data. Proc. Sympos. Appl. Math. 173–205.
Fee, M. S., Mitra, P. P., and Kleinfeld, D. (1996). Variability of extracellular spike waveforms of cortical neurons. J. Neurophysiol. 76, 3823–3833.
Finn, W., and Lopresti, P. (2003). Handbook of Neuroprosthetic Methods, 1st Edn. Boca Raton: CRC Press.
Folkers, A., Mosch, F., Malina, T., and Hofmann, U. G. (2003). Realtime bioelectrical data and processing from 128 channels utilizing the wavelet-transformation. Neurocomputing 52–54, 247–254.
Gosselin, B., and Sawan, M. (2008). An ultra low-power CMOS action potential detector. IEEE Circuits Syst. 1, 2733–2736.
Gosselin, B., and Sawan, M. (2009). An ultra low-power CMOS automatic action potential detector. IEEE Trans. Neural Syst. Rehabil. Eng. 17, 346–353.
Harrison, R. R. (2003). “A low-power integrated circuit for adaptive detection of action potentials in noisy signals,” Engineering in Medicine and Biology Society, in Proceedings of the 25th Annual International Conference of the IEEE, Seattle, WA, Vol. 4, 3325–3328.
Harrison, R. R., Watkins, P. T., Ryan, J. K., and Solzbacher, F. (2007). A low-power integrated circuit for a wireless 100-electrode neural recording system. Proc. IEEE Int. Solid-State Circuits 42, 123–133.
Hulata, E., Segev, R., Shapira, Y., Benveniste, M., and Ben-Jacob, E. (2000). Detection and sorting of neural spikes using wavelet packets. Phys. Rev. Lett. 85, 4637.
Hwan, K. K., and June, K. S. (2003). A wavelet-based method for action potential detection from extracellular neural signal recording with low signal-to-noise ratio. IEEE Trans. Biomed. Eng. 50, 999–1011.
Jensen, A., and La Cour-Harbo, A. (2001). Ripples in Mathematics: The Discrete Wavelet Transform. New York, NY: Springer Verlag.
Karel, J. M. H., Peeters, R. L. M., Westra, R. L., Moermans, K. M. S., Haddad, S. A. P., and Serdijn, W. A. (2005). “Optimal discrete wavelet design for cardiac signal processing,” in Proceedings of the 27th Annual International Conference on Engineering in Medicine and Biology Society of the IEEE-EMBS, Shanghai, 2769–2772.
Kim, K. H., and Kim, S. J. (2003). A wavelet-based method for action potential detection from extracellular neural signal recording with low signal-to-noise ratio. IEEE Trans. Biomed. Eng. 3, 277–283.
Laubach, M. (2004). Wavelet-based processing of neuronal spike trains prior to discriminant analysis. J. Neurosci. Methods 134, 159–168.
Lee, J., and Kipke, D. (2006). “Neural signal processing using discrete wavelet transform for neural interfaces,” in Proceedings on the International Conference on Microtechnologies in Medicine and Biology, Okinawa, 169–172.
Lewicki, M. (1994). Bayesian modeling and classification of neural signals. Neural Comput. 6, 1005–1030.
Mallat, S. G. (1989). A theory for multiresolution signal decomposition: the wavelet representation. IEEE Trans. Pattern Anal. Mach. Intell. 11, 674–693.
Manjunath, A., and Ravikumar, H. M. (2010). Comparison of discrete wavelet transform (DWT), lifting wavelet transform (LWT) stationary wavelet transform (SWT) and S-transform in power quality analysis. Eur. J. Sci. Res. 39, 569–576.
Meyer, Y., and Ryan, R. (1993). Wavelets: Algorithms and Applications. Philadelphia: Society for Industrial and Applied Mathematics.
Mtetwa, N., and Smith, L. S. (2006). Smoothing and thresholding in neuronal spike detection. Neurocomputing 69, 1366–1370.
Musial, P. G., Baker, S. N., Gerstein, G. L., King, E. A., and Keating, J. G. (2002). Signal-to-noise ratio improvement in multiple electrode recording. J. Neurosci. Methods 115, 29–43.
Nakatani, H., Watanabe, T., and Hoshimiya, H. (2001). Detection of nerve action potentials under low signal-to-noise ratio condition. IEEE Trans. Biomed. Eng. 48, 845–849.
Nenadic, Z., and Burdick, J. W. (2005). Spike detection using the continuous wavelet transform. IEEE Trans. Biomed. Eng. 52, 74–87.
Niervergelt, Y. (2001). Wavelets Made Easy, 2nd Printing, Illustrated, Hardcover, Boston, MA: Birkhauser Boston Inc.
Nirenberg, S., and E-Lathman, P. (2003). Decoding neuronal spike trains: how important are correlations? Proc. Natl. Acad. Sci. U.S.A. 100, 7348–7353.
Obeid, I., and Wolf, P. D. (2004). Evaluation of spike-detection algorithms for a brain-machine interface application. IEEE Trans. Biomed. Eng. 51, 905–911.
Olsson, R., and Wise, K. (2005). A three-dimensional neural recording microsystem with implantable data compression circuitry. Proc. Solid-State Int. Circuits Conf. 1, 558–559.
Oweiss, K. G., and Anderson, D. J. (2001). Noise reduction in multichannel neural recordings using a new array wavelet denoising algorithm. Neurocomputing 38, 1687–1693.
Paterson, C., Curry, R., Purvis, A., and Johnson, S. (2008). Detection of action potentials in the presence of noise using phase-space techniques. Proc. World Acad. Sci. Eng. Technol. 34, 77–79.
Pesquet, J. C., Krim, H., and Carfantan, H. (1996). Time-invariant orthonormal wavelet representations. IEEE Trans. Signal Process. 44, 1964–1970.
Phillies, G. D. J., Gould, H., and Tobochnik, J. (1996). Wavelets: a new alternative to Fourier transforms. Comput. Phys. 10, 247–252.
Pouzat, C., Mazor, O., and Laurent, G. (2002). Using noise signature to optimize spike-sorting and to assess neuronal classification quality. J. Neurosci. Methods 122, 43–57.
Quiroga, R. Q., Nadasdy, Z., and Ben-Shaul, Y. (2004). Unsupervised spike detection and sorting with wavelets and superparamagnetic clustering. Neural Comput. 16, 1661–1687.
Rangayyan, R. (2002). Biomedical Signal Analysis: A Case-Study Approach Hoboken, NJ: Wiley-IEEE Press.
Rothschild, R. M. (2010). Neuroengineering tools/applications for bidirectional interfaces, brain computer interfaces, and neuroprosthetic implants – a review of recent progress. Front. Neuroeng. 3:112. doi: 10.3389/fneng.2010.00112
Sahani, M., Pezaris, J. S., and Andersen, R. A. (1998). On the separation of signals from neighboring cells in tetrode recordings. Adv. Neural Inf. Process Syst. 10, 222–228.
Salmanpour, A., Brown, L. J., and Shoemaker, J. K. (2008). “Performance analysis of stationary and discrete wavelet transform for action potential detection from sympathetic nerve recordings in humans,” in Proceedings of the 30th Annual International Conference on Engineering in Medicine and Biology Society of the IEEE, Vancouver, BC, 2932–2935.
Strang, G., and Nguyen, T. (1996). Wavelets and Filter Banks. Wellesley, MA: Wellesley-Cambridge Press.
Sweldens, W. (1995). The lifting scheme: a construction of second generation wavelets. SIAM J. Math. Anal. 2, 511–546.
Unser, M., and Aldroubi, A. (1996). A review of wavelets in biomedical applications. Proc. IEEE 4, 626–638.
Watkins, P. T., Santhanam, G., Shenoy, K. V., and Harrison, R. R. (2004). “Validation of adaptive threshold spike detector for neural recording,” Engineering in Medicine and Biology Society, 2004, IEMBS‘ 04, in 26th Annual International Conference of the IEEE, Vol. 2, San Francisco, CA, 4079–4082.
Wickerhauser, M. V. (1994). Adapted Wavelet Analysis from Theory to Software. London: A K Peters/CRC Press.
Keywords: wavelet transform, threshold detection, action potential, spike detection, real-time processing, spiking neurons
Citation: Quotb A, Bornat Y and Renaud S (2011) Wavelet transform for real-time detection of action potentials in neural signals. Front. Neuroeng. 4:7. doi: 10.3389/fneng.2011.00007
Received: 18 April 2011;
Accepted: 01 July 2011;
Published online: 15 July 2011.
Edited by:
Jay Nadeau, McGill University, CanadaReviewed by:
Andre Khalil, University of Maine, USAStephane Roux, École Normale Supérieure de Lyon, France
Copyright: © 2011 Quotb, Bornat and Renaud. This is an open-access article subject to a non-exclusive license between the authors and Frontiers Media SA, which permits use, distribution and reproduction in other forums, provided the original authors and source are credited and other Frontiers conditions are complied with.
*Correspondence: Sylvie Renaud, IMS Laboratory, CNRS UMR 5218, Polytechnic Institute of Bordeaux, University of Bordeaux 1, Bat A31, 351, Cours de la Liberation, 33405 Talence, France. e-mail:c3lsdmllLnJlbmF1ZEBpbXMtYm9yZGVhdXguZnI=
 Adam Quotb