The energy requirements of the brain are amazingly high; indeed, while representing only about 2% of the body weight, its oxygen and glucose utilization account for approximately 20% of those of the whole organism, almost 10 times more than what would be predicted on a weight basis (
Kety, 1957
;
Magistretti, 2008
;
Rolfe and Brown, 1997
;
Sokoloff, 1960
). A similar mismatch is also observed for blood flow destined to the brain, which represents over 10% of cardiac output. A central feature of brain energy metabolism is that it is tightly coupled to neuronal activity. This tight coupling is at the basis of functional brain-imaging techniques, such as positron emission tomography and functional magnetic resonance imaging (
Magistretti and Pellerin, 1999
). However, the exact principles underlying this coupling and in particular the nature and role of neuron-glia metabolic interactions are still a subject of active research (
Gordon et al., 2008
;
Rouach et al., 2008
) and of controversy at times (
Hertz et al., 2007
). Similarly, the precise energy budget of the brain and in particular the cost associated with neuronal signaling is still not well understood (
Attwell and Laughlin, 2001
;
Lennie, 2003
).
Neuron-glia metabolic interactions have been the subject of several recent modeling studies (
Aubert et al., 2005
,
2007
;
Hyder et al., 2006
). Most of these studies tend to support the presence of an activity-regulated lactate shuttle from astrocytes to neurons as originally proposed by
Pellerin and Magistretti (1994)
. The presence of this shuttle has recently been reported in slices (
Rouach et al., 2008
). Similarly, several mathematical methods have been derived to assess the energy budget of the brain. These methods are traditionally based on a bottom-up approach in which the energy demand of individual biophysical processes are first estimated independently and then summed up to compute the brain’s total energy budget (
Attwell and Laughlin, 2001
;
Lennie, 2003
;
Nawroth et al., 2007
). Most of these methods focus on energy requirements rather than on energy supply.
Here, we introduce a novel top-down approach that addresses the question of the brain’s energy budget from the opposite perspective. We re-analyzed datasets reporting average glucose and oxygen utilization in the human and rodent brains in different activation states (
Gjedde, 2007
). Using these figures, it is possible to evaluate the average tissue ATP production corresponding to the different activation states. We then proceed to show that neuronal versus glial (i.e. astrocytic) oxygen and glucose metabolism can be evaluated by combining this first dataset with data reporting the rate of neuronal glucose-equivalent oxidation as a function of the rate of cycling of neurotransmitters (
Hyder et al., 2006
;
Sibson et al., 1998
). This can be achieved with minimal underlying hypotheses. It is then possible to compute the brain’s energy budget as well as the cycling rate of neurotransmitters corresponding to the different activation states. Finally, using our prediction of the compartmentalization of neuronal versus astrocytic glucose and oxygen utilization, it is possible to evaluate whether these two cell populations completely oxidize the glucose they take up or rather import or export glucose-derived metabolites.
Our results suggest that a significant part of glucose is taken up by astrocytes while oxygen is mostly consumed within the neuronal population. We find that this bias tends to increase with the level of activation. The higher the activation state, the higher the proportion of oxygen being used by neurons and the higher the proportion of glucose entering glia. Moreover, our approach yields an energy budget for different brain states. At high levels of activation, we find that about 80% of energy is produced to support neuronal signaling while glia only use up a small fraction of energy to recycle neurotransmitters (5–6%). Finally, we find that the glial population takes up more glucose than it can oxidize while the neurons oxidize more glucose-derived metabolites than the amount of glucose they take up. This is suggestive of a transfer of glucose-derived metabolites from the astrocytes to the neurons. Furthermore, the amplitude of this transfer is shown to be proportional to the level of activity as measured by the cycling of neurotransmitters, a finding consistent with the astrocyte-neuron lactate shuttle hypothesis (
Pellerin and Magistretti, 1994
). While lacking the details of a more biophysical approach (
Attwell and Laughlin, 2001
;
Nawroth et al., 2007
), our approach yields an energy budget that matches observed tissue glucose and oxygen utilization as well as the compartmentalization of glucose transport and oxygen utilization between neurons and astrocytes across different levels of brain activation. The resulting budget is in agreement with the one detailed in the work of
Attwell and Laughlin (2001) and at the same time supports the view of an activity-regulated transfer of glucose-derived metabolites from astrocytes to neurons.
Our goal is to segment energy production in the cerebral gray matter in signaling (s) versus housekeeping or non-signaling components (hk) and further in astrocytic (a) versus neuronal (n) components. The detail of processes contained in these categories is discussed in the “Results” section. By construction,
To this end, we combine two preexisting datasets. The first dataset is the average tissue glucose (CMR
glc) and oxygen (CMR
O2) utilization computed for the different brain states as defined in
Gjedde (2007)
. These four states
S are: (1) no function, (2) low function/unconscious, (3) high function/awake and (4) maximum cortical activation. The second dataset is the measured empirical linear relation linking the total cycling of neurotransmitters
Vcyc(tot) to the neuronal oxidative glucose utilization

as recently reviewed in
Hyder et al. (2006)
. The following analysis further assumes (i) that cells other than glia or neurons can be neglected (for simplicity, all glial cells are pooled together and are hereafter referred to as astrocytes), (ii) that the system is at steady-state which was also assumed during the collection of the two datasets to be used and (iii) that energy measured as adenosine triphosphate production (ATP) is used in the compartment where it is produced.
Average CMR
glc and CMR
O2 lead to the average tissue (T) ATP yield for each state
S = 1,…,4 through the following stoichiometric relation (
Gjedde, 2007
;
Gjedde et al., 2002
)
Theoretically, λ = 6 yielding a total of 38 ATP molecules per glucose molecule in the case of complete oxidation. Here, we use λ = 28/6 for a total of 30 ATP molecules, a yield closer to experimental measurements (
Berg et al., 2006
;
Hinkle et al., 1991
). It is worth noting however, that we find no significant difference in the results reported when using λ = 6.
As reviewed in
Hyder et al. (2006)
, the total cycling of neurotransmitters
Vcyc(tot) and the neuronal oxidative glucose utilization

are linked by
with
A and
B parameters to be determined. As shown in
Jolivet et al. (2009)
, assuming most of glucose entering the tricarboxylic acid (TCA) cycle in neurons is ultimately oxidized (
Gjedde, 2007
), Eq. 2 can be rewritten
with rO2 the astrocytic contribution to oxygen utilization. All CMRs in our analysis describe rates measured in μmol g−1 min−1.
From these premises, state S = 1 (no function) can be readily identified to Vcyc(tot) = 0. It follows that the total fraction of energy used for housekeeping metabolism (tot = n + a) is given by
and as a consequence, the fraction of energy used for signaling is
To go one step further, we now make the hypothesis that the fraction of energy used for signaling is proportional to Vcyc(tot)
with k a constant to be determined. Combining Eqs 3 and 5 leads to
Choosing rO2 for a specific state S allows the determination of k. Inserting k back in Eq. 6 then determines rO2 for the other states. In other words, the hypothesis that the fraction of energy used for signaling is proportional to Vcyc(tot) (Eq. 5) makes the astrocytic contributions to oxygen utilization (rO2) interdependent over different activation states. rO2(S) can then be inserted into Eq. 3 to compute Vcyc(tot)(S). The fraction of energy expended by astrocytes for signaling is then given by
with
Na the cost of recycling one neurotransmitter molecule and
We then estimate the housekeeping metabolism of neurons from the value of B. Assuming that neurons are only fed on glucose in state 1, we write
and thus

It is then possible to compute
rglc, the astrocytic contribution to glucose utilization by comparing
with the amount of energy produced by astrocytes computed from the fractions of glucose and oxygen that they use. Some algebra leads to
Finally, we compute the amount of non-oxidized carbons released or captured by neurons and astrocytes by comparing the utilization of glucose and oxygen in both cell types. To that end, we use
Gjedde (2007)
for neurons and Jcarbons,a(S)=2rglc(S)CMRglc(S)–λrO2(S)CMRO2(S) for astrocytes with Jcarbons being positive if carbons are released or negative if carbons are required to satisfy for the observed oxygen utilization in that compartment.
Parameters in this study were chosen as follows.
A and
B were obtained by fitting Eq. 2 to the data in Figures
1
A,B (least-square fit; data equally weighted). In the case of humans, because of the lack of data in the range
Vcyc(tot) ≈ 0, we imposed the value of
B to be three times smaller than the value of
B obtained for rodents to account for the fact that human glucose utilization in state 1 is one-third of the one in rodents (see Figures
1
C,D) (
Gjedde, 2007
). This procedure yields
A = 0.86,
B = 0.1 (μmol g
−1 min
−1) for rodents and
A = 1.14,

(μmol g
−1 min
−1) for humans. Finally, we used
Na = 2.2 assuming first that GABA constitutes ∼20% of the total neurotransmitter cycling (
Patel et al., 2005
) and second that recycling one glutamate molecule requires 2.33 ATPs (
Attwell and Laughlin, 2001
) while recycling one GABA molecule only uses 1.66 ATPs (
Chatton et al., 2003
).
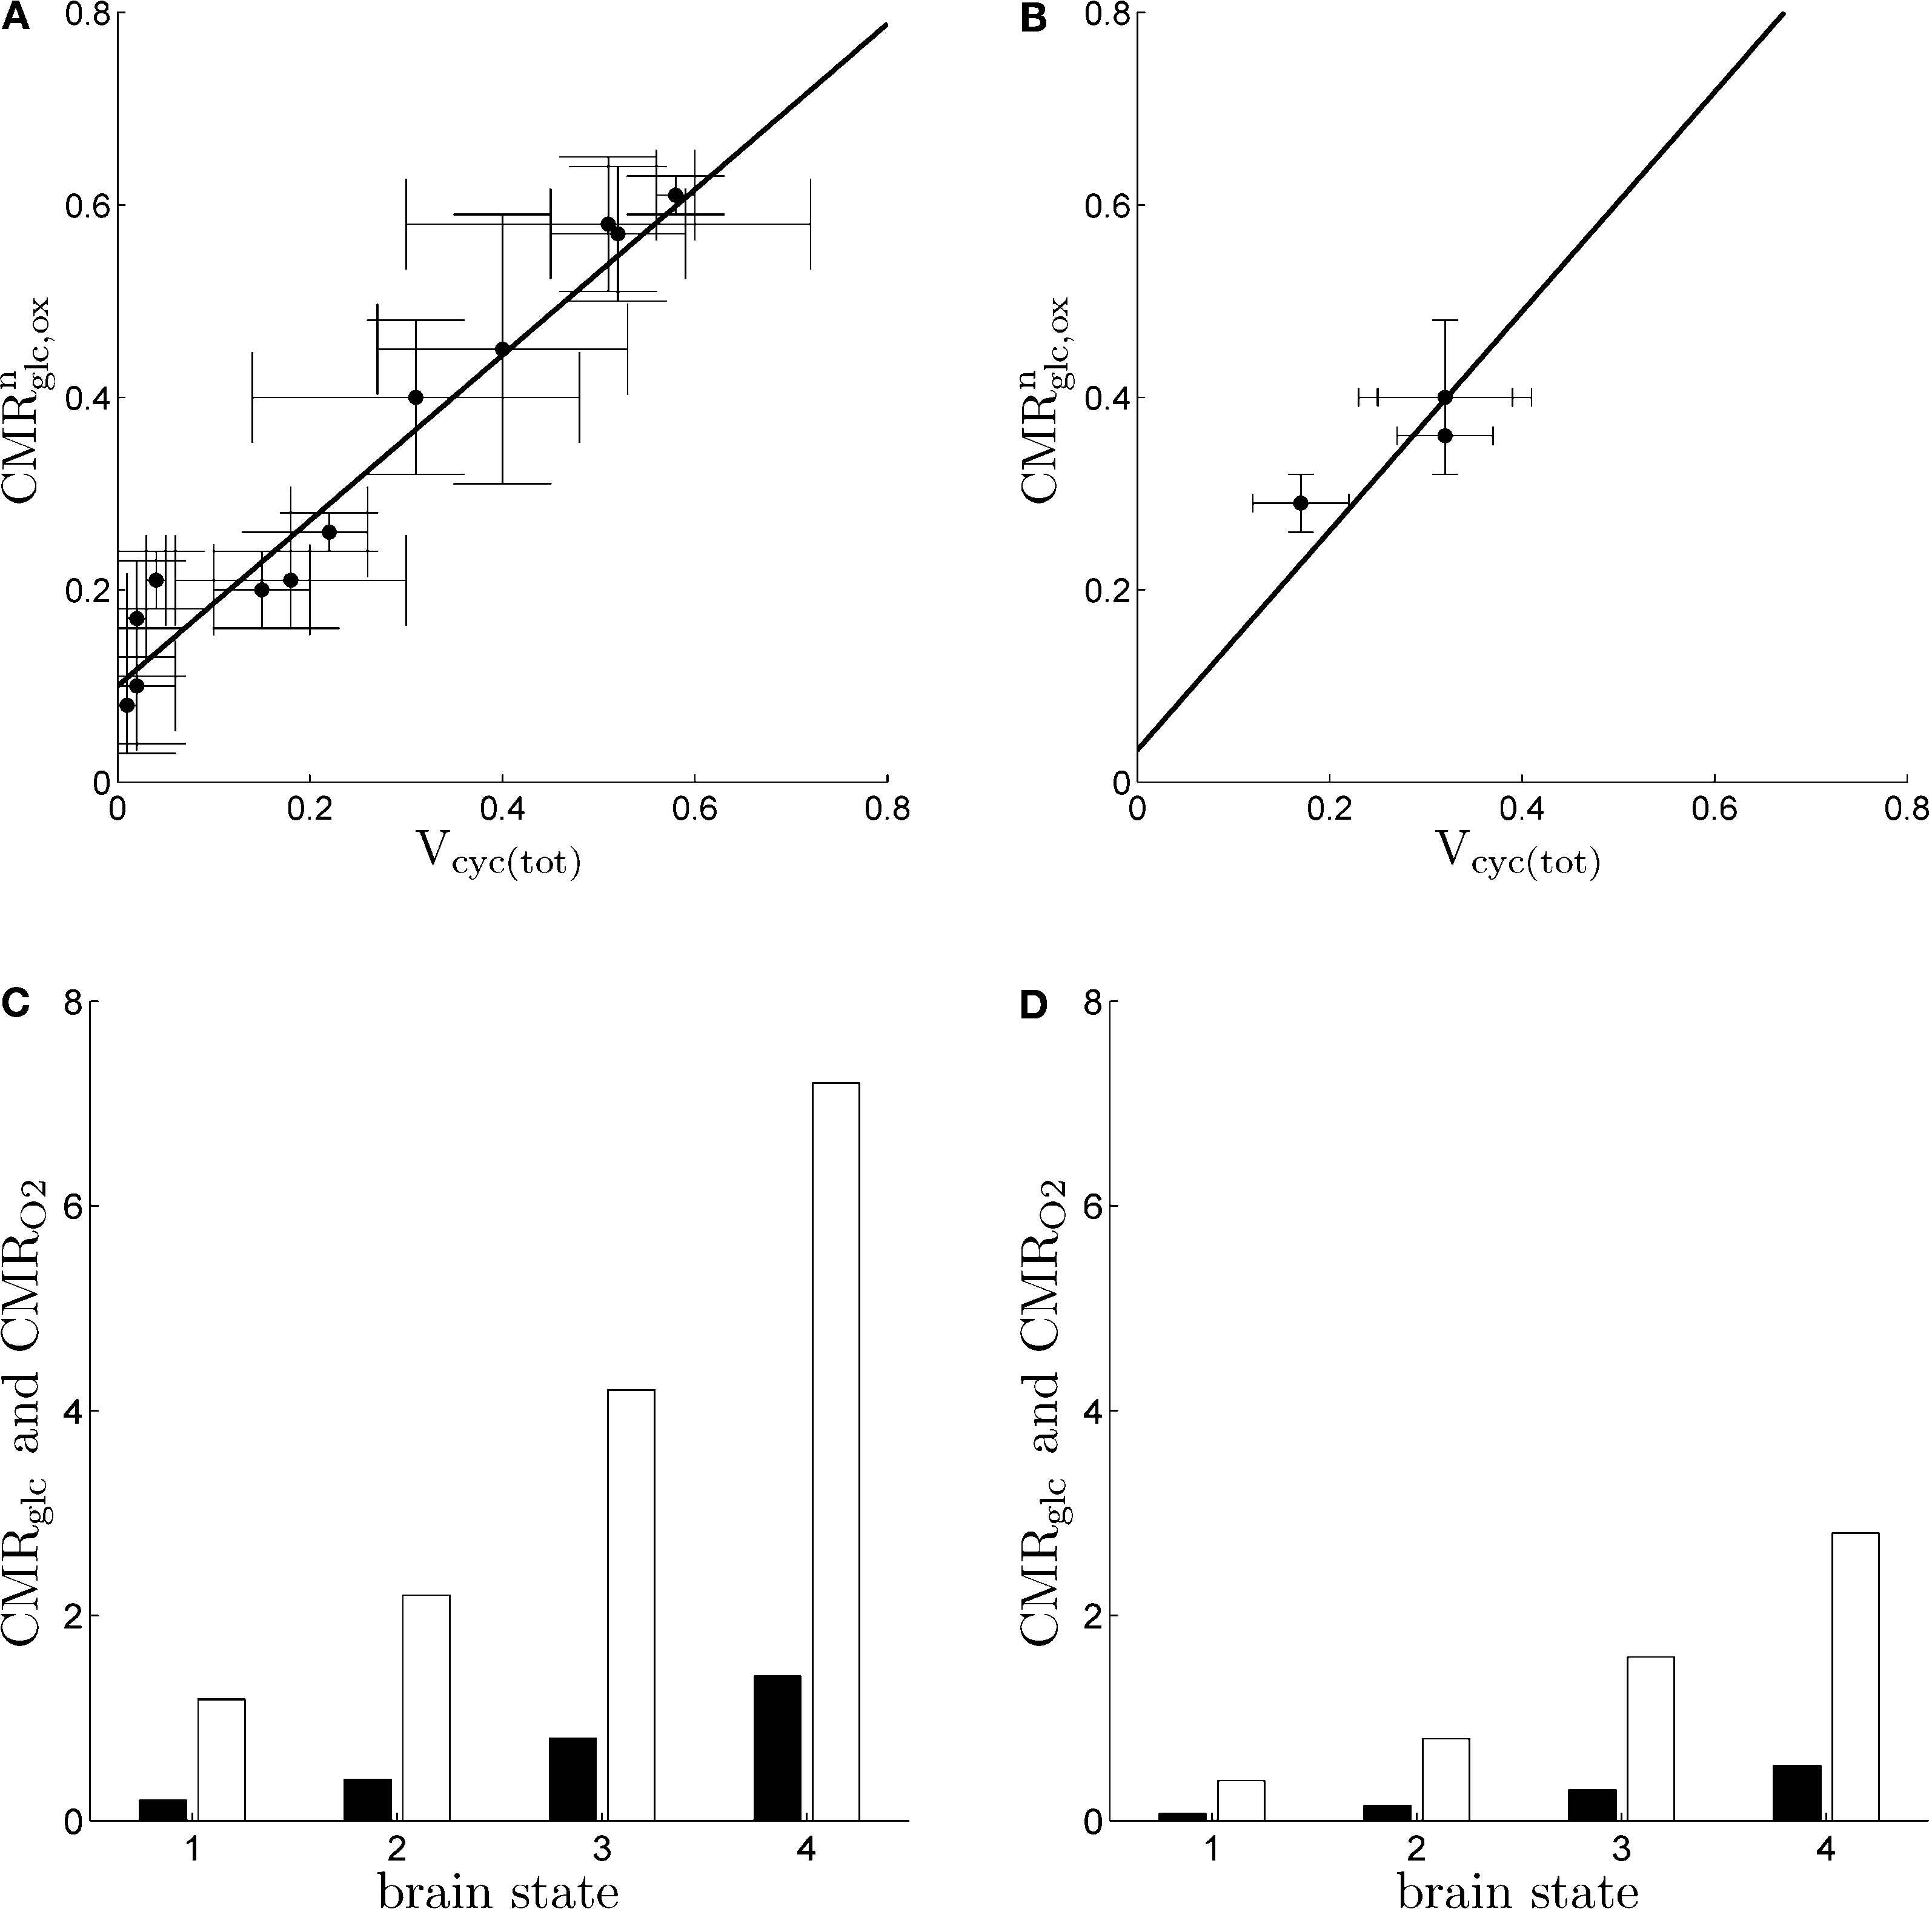
Figure 1. Cerebral glucose and oxygen utilization derived from the literature. (A) Neuronal oxidation of glucose equivalents

as a function of the total neurotransmitter cycling
Vcyc(tot) in the rodent brain (μmol g
−1 min
−1).
(B) Same as in
(A) but in the human brain. In both
(A) and
(B), the solid lines indicate the least-square fit of the data points (see Materials and Methods). Data in
(A) and
(B) are adapted from
Hyder et al. (2006)
. Values have been calculated based on measurements of
13C labeling of glutamate from [1-
13C]glucose.
(C) Average tissue glucose (black) and oxygen (white) utilization in the rodent brain (μmol g
−1 min
−1) in the four brain states defined in the text.
(D) Same as in
(C) in the human brain. Data in
(C) and
(D) and brain states are adapted from
Gjedde (2007)
.
We aim at computing an energy budget of cerebral gray matter for different states of activity (
Gjedde, 2007
). Rather than computing this budget in a bottom-up fashion by evaluating and then summing up the contribution of individual biophysical processes (
Attwell and Laughlin, 2001
;
Nawroth et al., 2007
), a useful approch, which however relies on a considerable number of estimates and approximations, we start from the total steady-state energy production and introduce a method to segment energy production of different compartments and categories of interest. More specifically, we aim at segmenting energy production in the gray matter in signaling versus non-signaling components (housekeeping) and further in glial versus neuronal components. To this end, we combine two preexisting datasets. The first dataset is the empirical linear relation linking the total cycling of neurotransmitters
Vcyc(tot) to the neuronal oxidative glucose utilization

(
Hyder et al., 2006
) (see Figures
1
A,B). The second dataset is the average tissue glucose (CMR
glc) and oxygen (CMR
O2) utilization computed for the different brain states
S = 1,…,4 (see Figures
1
C,D). These four states
S are defined as: (1) no function, (2) low function/unconscious, (3) high function/awake and (4) maximum cortical activation (see
Gjedde, 2007
for further details). It is shown in the “Materials and Methods” section that these two datasets are sufficient to compute a steady-state budget for gray matter under the hypothesis that the energy used for signaling is proportional to
Vcyc(tot), neglecting cells other than glia or neurons and assuming that energy measured as adenosine triphosphate production is used in the compartment where it is produced. For the sake of simplicity, all glial cells are pooled together and are hereafter indiscriminately referred to as astrocytes or glia. These two datasets are taken from the literature. All the other results presented in this section have been calculated on the basis of these data.
In order to segment energy production between the neuronal and the glial compartments, it is necessary to know their corresponding glucose and oxygen utilization. Direct and indirect measurements of the compartmentalization of glucose utilization are available for various conditions and systems but have yielded relatively different figures with estimates of the glial contribution to glucose utilization (
rglc) ranging from about 50% to 100% (
Nehlig et al., 2004
;
Tsacopoulos et al., 1988
;
Véga et al., 2003
;
Zielke et al., 2007
). So far, there is no direct measurement of the glial contribution to oxygen utilization (
rO2), however the relative activities of the TCA cycle could be used as a proxy (see
Jolivet et al., 2009
). It is however very difficult to relate these measurements to the abovementioned brain states
S = 1,…,4. As demonstrated in the “Materials and Methods” section, the values of
rO2(
S) become interdependent under the hypothesis that the fraction of energy used for signaling is proportional to
Vcyc(tot). In other words, choosing the value of
rO2 for any given state determines the value of
rO2 for all the other states. In the following analysis, we consider two scenarios. In the first scenario, we assume that glial oxygen utilization is approximately constant across all states (

), consistent with the observation made in hippocampal slices by
Kasischke et al. (2004)
that NADH autofluorescence is constant in astrocytic mitochondria upon activation. In the second scenario, we assume that glial oxygen utilization increases by 15% from state 3 to state 4 (

) (
Cruz et al., 2005
).
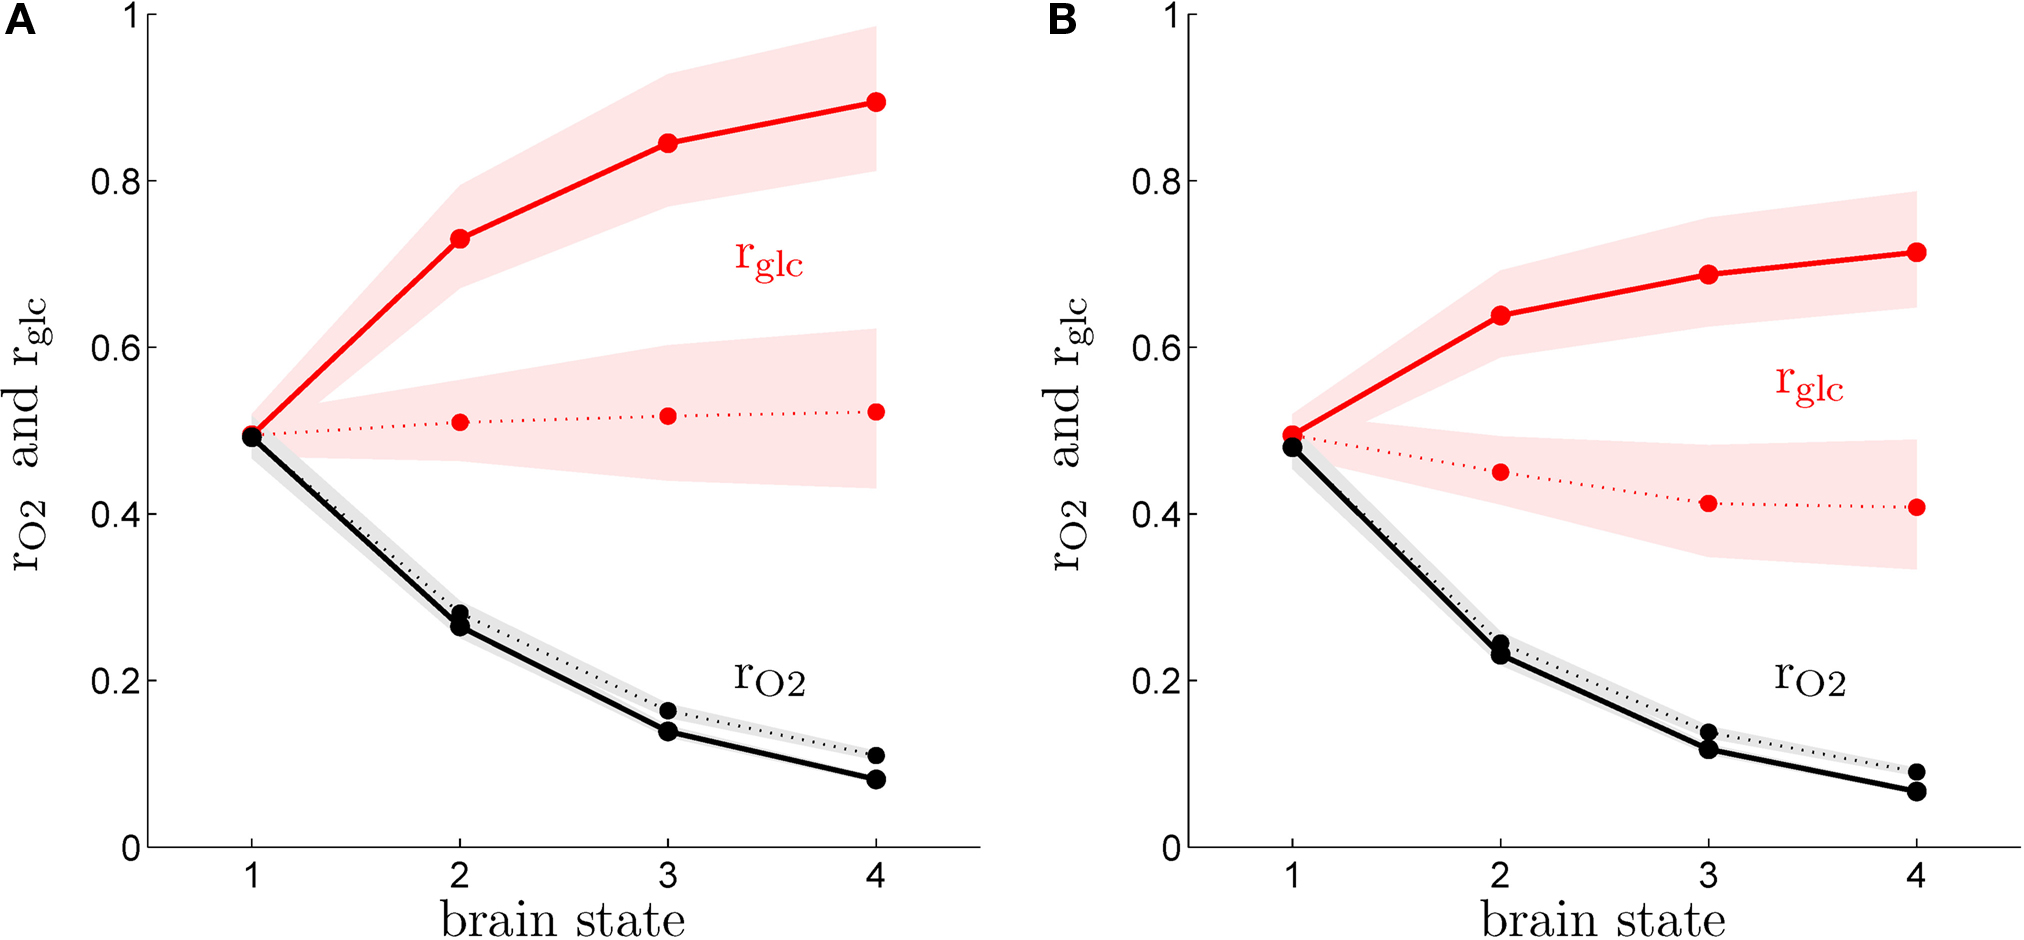
Figure
2
shows
rO2 and
rglc computed following the procedure detailed in the “Materials and Methods” section for rats (A) and humans (B) in the first (solid lines) and the second scenario (dashed lines). Our method yields results very similar for both species and consistent with experimental findings. We find that
rglc is increasing with the level of activation and typically rests between 49% and 78% in humans and between 49% and 98% in rats in agreement with
in vivo measurements (
Nehlig et al., 2004
) and other modeling efforts (
Hyder et al., 2006
). The increase of
rglc with the level of activation is less prominent in the second scenario than in the first scenario and this effect is more pronounced in humans with
rglc being almost constant in the latter case. In both species, we find the glial oxygen utilization fraction
rO2 to be decreasing with the level of activation from about 49% in state 1 to approximately 10% in state 4. Again, these predictions are consistent with experimental findings showing that the relative contribution of glia to the total TCA cycle might be higher in anaesthetized animals (∼41%) (
Choi et al., 2002
) than in awake animals (∼21%) (
Öz et al., 2004
). Likewise, we find
rO2 values in the range 6–17% in states 3 and 4 consistent with measurements in awake humans reporting ∼8% (
Shen et al., 1999
), ∼10% (
Gruetter et al., 2001
) and ∼11% (
Lebon et al., 2002
) (calculated from the ratio of TCA cycles as summarized in
Hyder et al., 2006
). Fluctuations in the order of ±5% in the parameters convert into about ±5% fluctuations in the predicted value of
rO2 and about ±19% fluctuations in the predicted value of
rglc. However, the compartmentalization is not strongly affected with most of oxygen being used by neurons in both scenarios, most of glucose being used by astrocytes in the first scenario and a more balanced situation with about the same amount of glucose being used by both compartments in the second scenario. Finally, we observe that the values computed for
rO2 in the activated state are remarkably close to the distribution of mitochondria between neurons and glia (
Wong-Riley, 1989
).
Figure 2. Calculated astrocytic contribution to glucose and oxygen utilization. (A) Astrocytic contribution to glucose (rglc; red) and oxygen utilization (rO2; black) in the rodent brain for the first scenario (constant astrocytic oxygen utilization; solid) and the second scenario (astrocytic oxygen utilization increases by 15% from state 3 to state 4; dotted). (B) Same as in (A) in the human brain. Shaded areas delimit the maximal deviations observed with ±5% parameter fluctuations (see text).
We formulated the two scenarios considered here as an increase of astrocytic oxygen utilization from state 3 to state 4 because it is numerically convenient. It is interesting to note however that in the second scenario, the astrocytic oxygen utilization (
rO2·CMR
O2) continuously increases from state 1 to state 4 (
Choi et al., 2002
;
Öz et al., 2004
;
Serres et al., 2008
). We consider that GABA constitutes 20% of the total neurotransmitter cycling (see Materials and Methods). If GABA is recycled by astrocytes, it seems surprising that
rO2 can be significantly lower than this value. However, each GABA recycled by astrocytes might lead to the production of NADH and FADH
2 requiring a maximum of 1.5 O
2 per GABA molecule. Hence,
rO2 can be smaller than 20% as long as

which is always the case in our results (data not shown). Similarly, it has been reported by several groups that the rate of glial anaplerotic glutamine synthesis might be as high as one-third of the rate of the glutamate-glutamine cycle (
Lieth et al., 2001
;
Merle et al., 2002
;
Sibson et al., 2001
;
Xu et al., 2004
). Glutamine generated in that way might lead to the production of NADH requiring a maximum of 1.5 O
2 per glutamine molecule. Hence,
rO2 can be smaller than 33% as long as

which is always the case in our results (data not shown).
With
rO2(
S) and
rglc(
S) available, it is possible to compute the energy budget for four categories of interest. They are the astrocytic housekeeping metabolism category, the neuronal housekeeping metabolism category, the astrocytic signaling category and the neuronal signaling category (see Materials and Methods). By construction, these categories cover the following biophysical processes. The housekeeping categories contain all energy demanding processes which are not related to signaling tasks, that is essentially maintaining the electrochemical gradient across the cell membrane by activating the Na
+/K
+ pump as well as biochemical processes required to maintain structural integrity. The neuronal signaling category contains the energy expended after the activation of postsynaptic receptors and after the generation and propagation of action potentials, mostly due to the activation of the Na
+/K
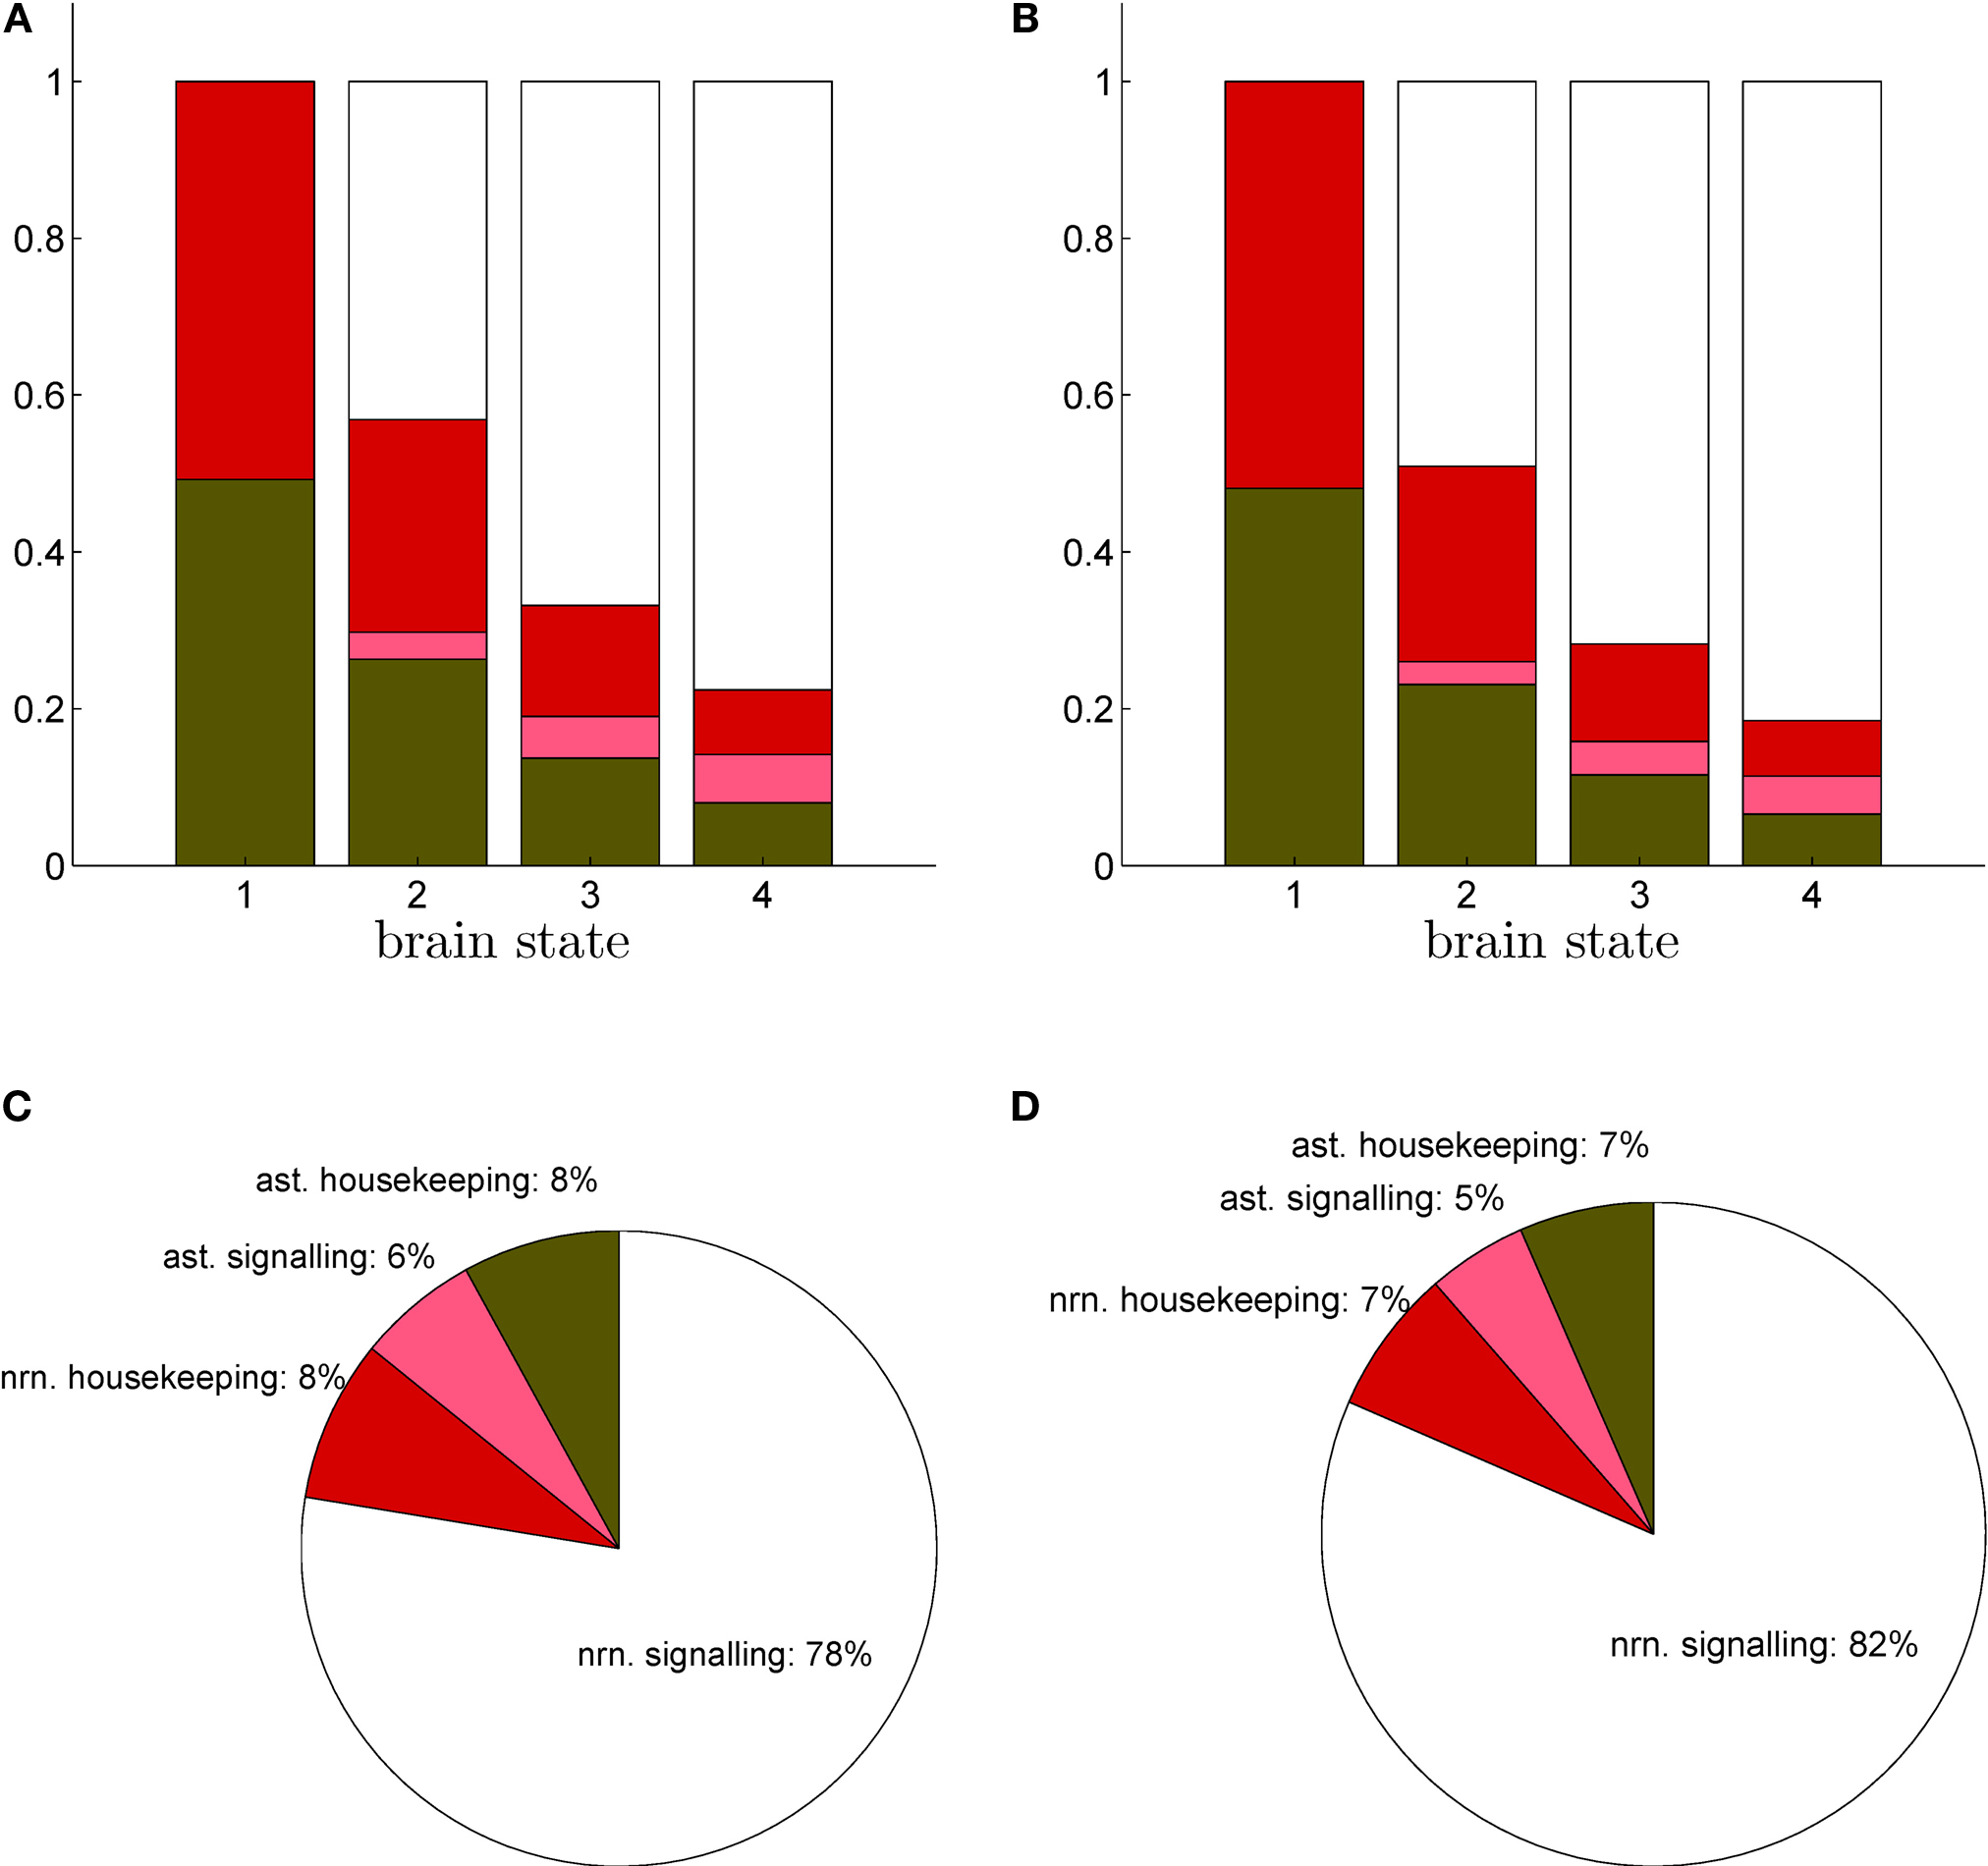
+ pump needed to restore the electrochemical gradients across the cell membrane. It also includes the energy required to package neurotransmitters into vesicles at presynaptic terminals. Finally, the astrocytic signaling category contains the energy used to capture and metabolically process neurotransmitters. Figure
3
shows the energy budget computed (first scenario) for these four categories for rats (A) and humans (B) and details the exact percentages for state 4 (C–D). By construction, these four fractions sum up to 1 in all four states. As expected, the fraction of energy dedicated to housekeeping metabolism decreases with the level of activation while the fraction of energy dedicated to signaling increases with the level of activation to reach 84% and 86% in rodents and in humans respectively. Of these, the astrocytes only contribute for a small fraction of 7% in rodents and 5% in humans. The rest, about 80%, is used for neuronal signaling. Our approach yields figures for the energy budget remarkably similar to the results of
Attwell and Laughlin (2001)
. Interestingly, the computed energy budget is not significantly dependent on the scenario considered, and therefore only the first scenario is shown.
Figure 3. Calculated energy budget for the first scenario. (A) Fractions of energy spent for astrocytic housekeeping (green), astrocytic signaling (pink), neuronal housekeeping (red) and neuronal signaling (white) in the rodent brain. (B) Same as in (A) in the human brain. (C) Pie chart of these fractions in state 4 in the rodent brain. (D) Same as in (C) in the human brain. Abbreviations ast and nrn refer to astrocytes and neurons respectively.
Using the values of
rO2(
S) we have derived together with Eq. 3, it is now possible to compute
Vcyc(tot)(
S), i.e. the amplitude of the cycling of neurotransmitters corresponding to brain states
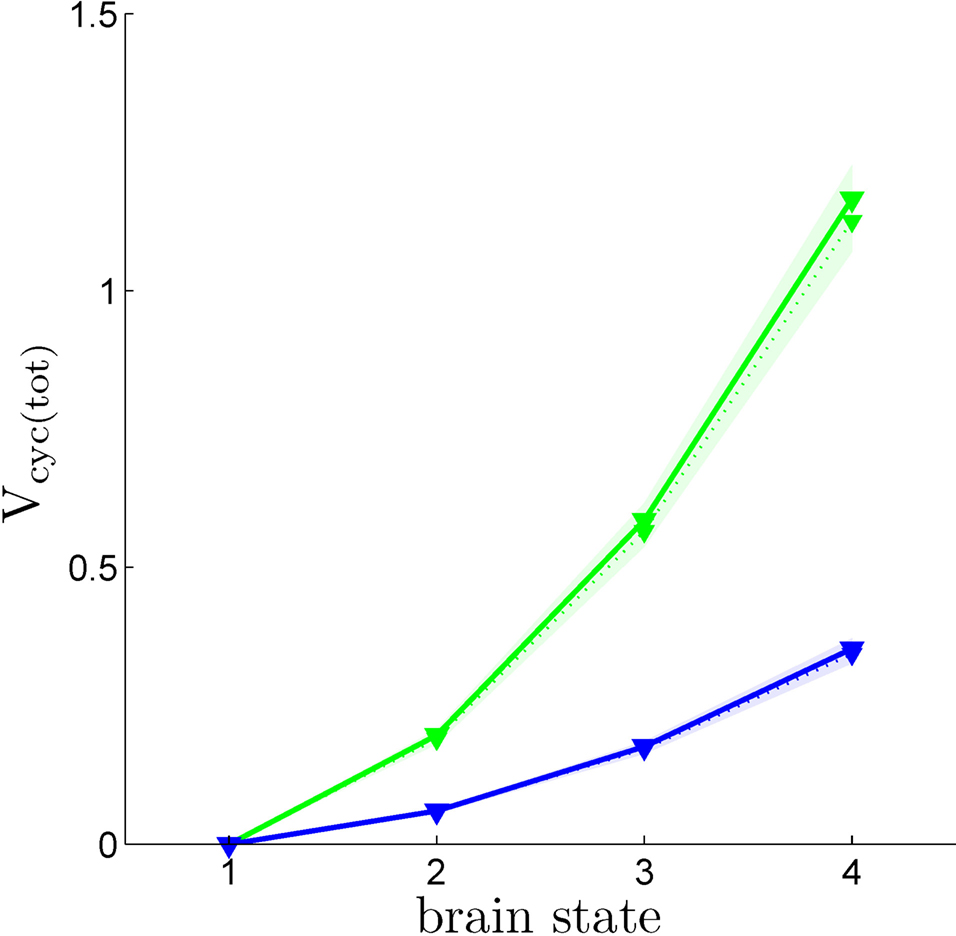
S = 1,…,4. Figure
4
shows
Vcyc(tot)(
S) calculated in this way for both humans and rodents in both scenarios. This procedure yields values in range of experimental measurements. We find values of
Vcyc(tot) between 0 and 0.35 for humans and between 0 and 1.17 for rodents. Interestingly, these results closely match the ones reported by Gjedde, obtained with a different approach (
Gjedde, 2007
). He finds
Vcyc(tot)(1)≈0,
Vcyc(tot)(2)≈0.2 and
Vcyc(tot)(3)≈0.5 for the rodent, whereas we can deduce
Vcyc(tot)(1)≈0,
Vcyc(tot)(2)≈0.2 and
Vcyc(tot)(3)≈0.6. Note that the choice of a specific scenario does not affect the results significantly, nor do ±5% fluctuations in the free parameters (i.e.
A,
B and
Na the average cost of recycling one neurotransmitter molecule).
Figure 4. Calculated Vcyc(tot) in the rodent brain (green) and in the human brain (blue) for the first (solid) and the second scenario (dotted). Shaded areas delimit the maximal deviations observed with ±5% parameter fluctuations (see text). Note that
Vcyc(tot) here was calculated by us and differs from
Vcyc(tot) as plotted in Figures
1
C,D which was taken from the literature.
Finally, it is possible to evaluate the level of neuron-glia metabolic exchanges by comparing the balance of oxygen and glucose utilization in these two compartments. Indeed, complete oxidation of glucose requires six times more oxygen than glucose (
Gjedde, 2007
). Thus, combining the experimental values for CMR
O2(
S), CMR
glc(
S) (Figures
1
C,D) and the values we derived for
rO2(
S),
rglc(
S) (Figure
2
) into Eq. 10, it is possible to compute
Jcarbons(
S).
Jcarbons is positive if the compartment exports carbons (net transfer), that is, if the observed oxygen utilization in that compartment is smaller than six times the observed glucose utilization. On the contrary,
Jcarbons is negative if the compartment imports carbons, that is, if the observed oxygen utilization in that compartment is larger than six times the observed glucose utilization. Doing so, we find that
Jcarbons is systematically positive for astrocytes, systematically negative for neurons and very close to 0 in the case of state 1 for both the neuronal and the astrocytic compartments. This indicates that carbons are released from the glial compartment and are at least partially taken up by the neuronal compartment. In the case of state 1, glia and neurons are metabolically separated (no flux of carbons). The latter result is to be expected since the measured ratio CMR
O2(1)/CMR
glc(1) is very close to 6 indicating a well balanced system. Moreover, we imposed that neurons use exclusively glucose in this state when computing
rglc, thus preventing glia-to-neuron carbon exchanges. Figure
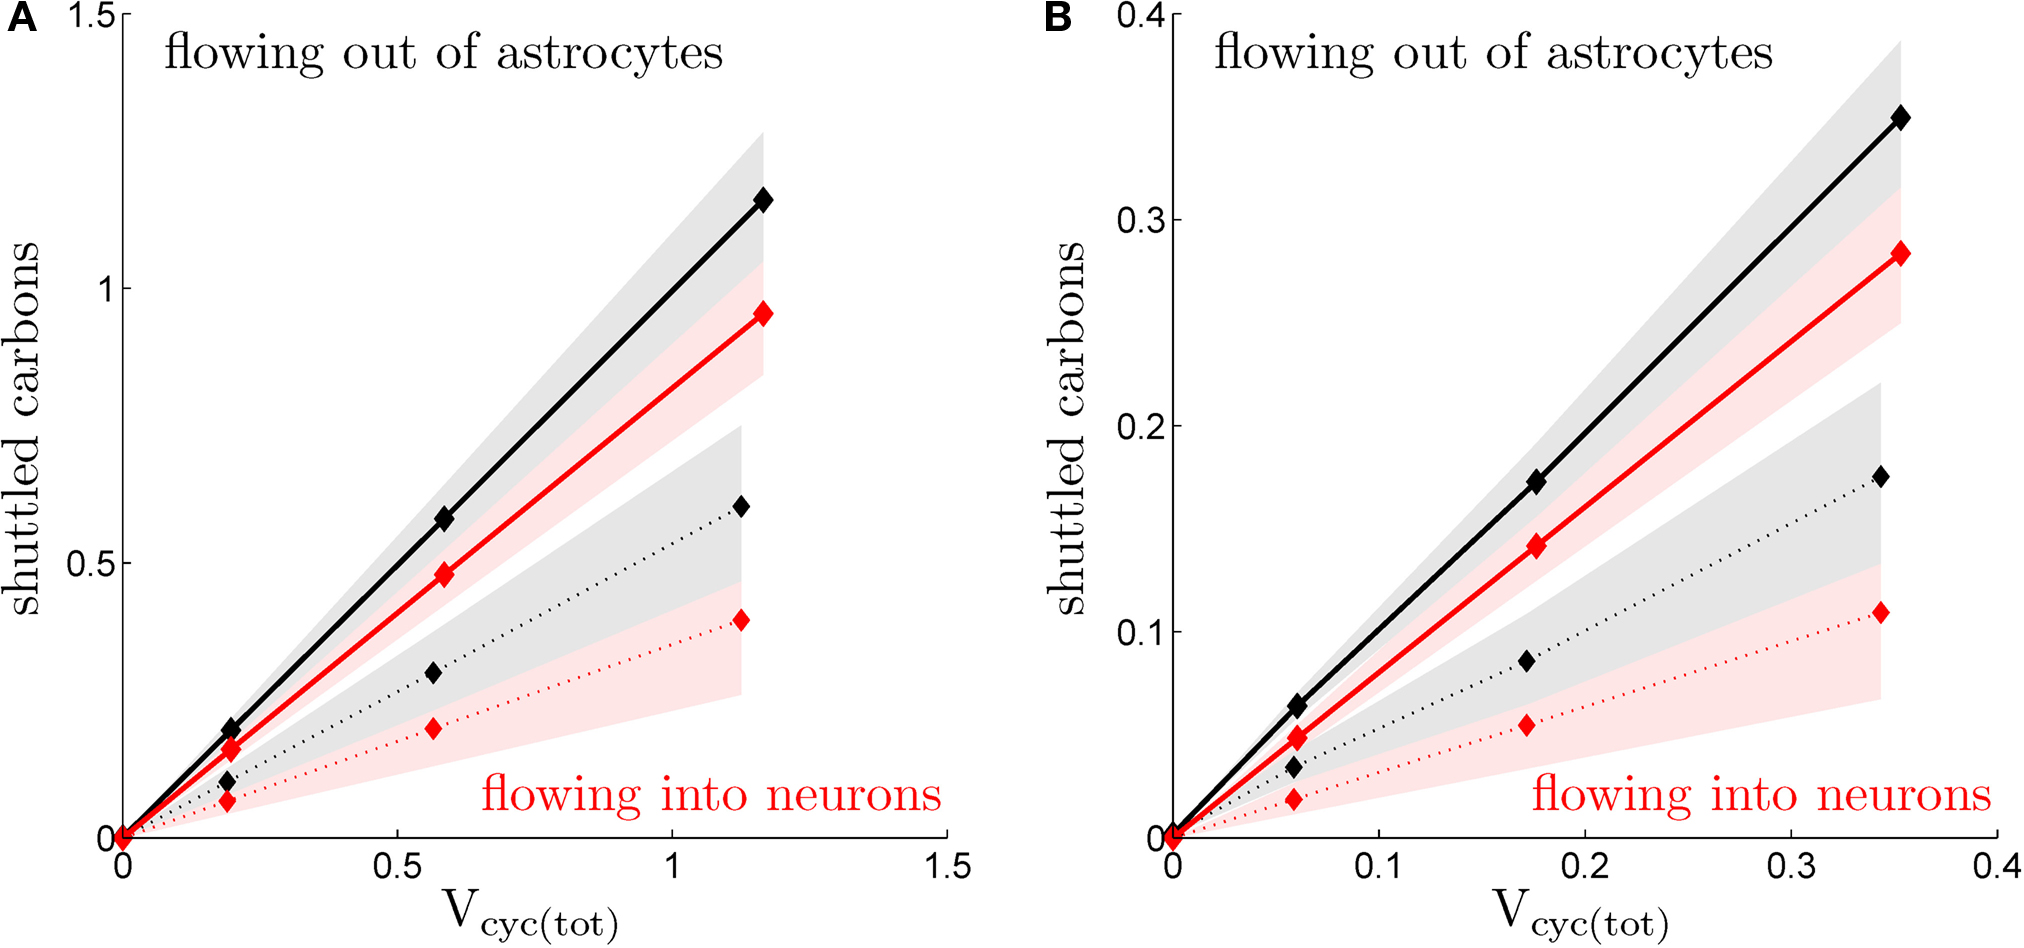
5
shows the absolute value of
Jcarbons versus the level of activation as embodied by the total cycling of neurotransmitters
Vcyc(tot)(
S).
Jcarbons is computed individually for neurons and glia as well as for both scenarios considered in this paper. In all cases, we observe a strong linear relationship (
R2 ≥ 0.99) indicating that the amplitude of the glia-to-neuron carbon exchange is proportional to the activity in the tissue measured as the total cycling of neurotransmitters. The overall amplitude of this coupling significantly depends on the scenario considered. It is significantly stronger in the first scenario (constant astrocytic oxygen utilization) than in the second scenario (astrocytic oxygen utilization increases by 15% from state 3 to state 4). Finally, the fact that astrocytes always export more carbons than neurons capture suggests that a small fraction of carbons is simply released by the system to the bloodstream consistent with findings that lactate is being released by the brain in various states (
Dalsgaard, 2006
).
Figure 5. Calculated transfer of carbons. (A) Flux of carbons leaving the astrocytes (black), alternatively entering the neurons (absolute values; red), in the rodent brain for the first (solid) and the second scenario (dotted; μmol g−1 min−1). (B) Same as in (A) in the human brain. Shaded areas delimit the maximal deviations observed with ±5% parameter fluctuations (see text).
Our analysis relies on the choice of three parameters,
A and
B characterizing the linear relation between

and
Vcyc(tot) and
Na representing the average cost of recycling one neurotransmitter molecule. In addition, we have arbitrarily selected two scenarios. In the first scenario, we assume constant astrocytic oxygen utilization (

), while in the second scenario we assume that the astrocytic oxygen utilization increases by 15% from state 3 to state 4 (

). None of the results presented in this paper was dramatically affected by ±5% fluctuations of the value of
A,
B and/or
Na. On the contrary, the choice of a scenario for the relative increase of the astrocytic oxygen utilization has a significant impact on the results as already illustrated in Figures
2 and
5
. In particular,
rglc is significantly smaller with
than with

(Figure
2
). Thus, increasing

progressively shifts the balance of glucose utilization from being mostly glial to being mostly neuronal. As a consequence, the amplitude of the carbon shuttle from glia to neurons progressively decreases with increasing values of

(Figure
5
). Increasing

beyond +15%, we find that the glia to neuron shuttle stops at

for humans and +23% for rodents yielding a situation where both cell types are metabolically independent and releasing excess carbons. Increasing

further, we find that a shuttle from neurons to glia takes place for values

and higher.
The exact principles underlying the coupling of metabolic processes in register with neuronal activity and in particular the nature and role of neuron-glia metabolic interactions are still a subject of active debate. Here, we have introduced a novel computational approach to decipher neuron-glia compartmentalization in the context of brain energy metabolism. Based on measurements of tissue glucose and oxygen utilization in different brain states (Figure
1
), our approach allows computing the fractions of oxygen and glucose taken up by glial cells (
rO2 and
rglc) and neurons (1-
rO2 and 1-
rglc respectively; Figure
2
). Our approach suggests that a significant portion of glucose is taken up by astrocytes while oxygen is mostly used within the neuronal population and that this bias increases with the level of activation. The exact proportion of astrocytic glucose uptake is dependent on the scenario considered with most glucose being taken up by astrocytes in the first scenario and a more balanced situation in the second scenario. We then computed an activity-dependent energy budget for the brain (Figure
3
) and assessed the balance of oxygen and glucose in both the neuronal and glial compartments (Figure
5
). Finally, we found that there is a probable transfer of glucose-derived metabolites from astrocytes to neurons, the amplitude of which is proportional to the level of activity as measured by the cycling of neurotransmitters. Our approach is systematically applied to both human and rodent data yielding similar results for both species.
Our findings are in general agreement with results by
Attwell and Laughlin (2001)
on the cost of cortical computation. With our top-down approach it is not possible to distinguish between the cost of action potentials and the cost of postsynaptic potentials which are pooled together with other mechanisms in the neuronal signaling component
fs,n. It is nevertheless possible to make a rough estimate of the cost of postsynaptic potentials using the same strategy as used in Eq. 7, that is allocating a fixed cost to postsynaptic potentials per recycled glutamate molecule while neglecting inhibition. After a quick calculation based on the study by Attwell and Laughlin using only the smallest reported value (that is 25.5 ATP/glutamate as a result of NMDA, non-NMDA and G-protein coupled receptors), we find that postsynaptic potentials would account for 47% of the total ATP utilization versus 35% for action potentials in humans and 58% versus 20% in rodents in the maximally activated state. These numbers suggest that postsynaptic potentials might contribute more to the energy budget than originally suggested by
Attwell and Laughlin (2001)
. This is consistent with the finding that metabolic response is more correlated with local field potentials, reflecting principally post-synaptic potentials, that to spiking activity (
Logothetis et al., 2001
).
The findings presented here are also consistent with an activity-regulated transfer of glucose-derived metabolites from astrocytes to neurons as it was originally proposed by
Pellerin and Magistretti (1994)
. Existence of this mechanism has been recently demonstrated in slices (
Rouach et al., 2008
). Our calculations show that such a shuttle from astrocytes to neurons is perfectly compatible with a relatively low cost associated to the recycling of neurotransmitters and with an upregulation of the astrocytic oxidative metabolism upon activation. Our approach does not allow us to determine the metabolic species involved in this shuttle but there is no doubt that lactate must be an important component of it, given the experimental evidence indicating lactate usage by neurons (
Schurr and Payne, 2007
). Of course the possibility that several metabolic species contribute to this shuttle cannot be excluded (see, e.g.,
Pfrieger, 2003
). The potential roles of this shuttle beyond feeding neurons remains to be determined. Interestingly, lactate was recently demonstrated to play a direct role in the regulation of the local blood flow (
Gordon et al., 2008
;
Yamanishi et al., 2006
), of neuronal activity in the retrotrapezoid nucleus (
Erlichman et al., 2008
) as well as in the regulation of the local inhibitory activity in the subfornical organ (
Shimizu et al., 2007
).
Our approach relies on the division of brain activity in states as defined by
Gjedde (2007)
. Average tissue glucose and oxygen utilization are provided for all these states (Figures
1
C,D). While this division might be perceived as slightly arbitrary, it allows us to compute the astrocytic and neuronal fractions of glucose and oxygen utilization (Figure
2
), the energy budget (Figure
3
) and the net transport of glucose-derived metabolites (Figure
5
) for a meaningful range of activation levels. These states should not be considered as fixed and well-defined categories but rather as individual samples along a continuum of brain activation states. For a better comparison with experimental results, it is then possible to convert these states into the corresponding amplitude of the cycling of neurotransmitters
Vcyc(tot) (Figure
4
) as illustrated for the case of the net transport of glucose-derived metabolites (Figure
5
). The same procedure can be applied to the glial and neuronal fractions of glucose and oxygen utilization and to the energy budget (not shown).
Our method is in part based on several assumptions that are rather common in the field. It is assumed that cells other than glia or neurons can be neglected since these two cell types constitute the vast majority of cells in the brain and occupy most of the cortical tissue volume (not counting extracellular space) (
Verkhratsky and Butt, 2007
). Even though ATP can be released as a neurotransmitter, notably by astrocytes, this release is unlikely to contribute significantly in comparison to the amount of ATP produced to fuel the system. Finally, like most modeling work and some experimental techniques in the field, our approach is restricted to the steady-state condition. It also relies on the hypothesis that the total energy used for signaling in the tissue is linearly proportional to the total cycling of neurotransmitters. While it is obvious that this hypothesis holds for the cost associated to neurotransmitters recycling, it is less clear that it holds for action potentials and postsynaptic potentials. However, the frequency versus current (
f-I) curve of cortical neurons is close to linear in the presence of noise (
Rauch et al., 2003
). One can therefore assume that this hypothesis also holds within a physiologically relevant regime although it may not be valid in pathological cases or at either very low or very high levels of activation. Also note that our approach is not strictly restricted by this hypothesis and could easily be extended to non-linear relationships. The analysis would be essentially the same but would then require extra data in order to estimate the additional parameters entering into Eq. 5 and characterizing the relation between
fs,tot(
S) and
Vcyc(tot)(
S).
The results derived here rely on a steady-state or quasi steady-state condition. In the first few seconds that follow the increase or decrease in brain activation, the tissue undergoes fast metabolic transitions and the system is undoubtedly out of steady-state. However, upon activation, cerebral blood flow reaches a new stationary level after a few seconds only. Moreover, it was recently shown that sustained neuronal activation raises metabolism to a new steady-state level (
Mangia et al., 2007
). In particular, lactate quickly reaches a new steady-state and so does pyruvate because of the dynamic equilibrium between these metabolites. Similarly, recovery from activation is very slow, taking place over minutes to tens of minutes as illustrated by the slow decay of accumulated lactate after stimulation (
Prichard et al., 1991
). Likewise, it seems reasonable to assume that different anesthetic levels correspond to different steady-states. Even though our formalism was developed under the assumption of steady-state conditions, we expect it to be valid except during the short transitions between different steady-states or quasi steady-states. Simulations of such non-steady-state transitions require alternative modeling methods.
As already discussed previously, our approach yields qualitatively robust results when we apply ±5% fluctuations in the parameters. This is true except for

which characterizes how much the astrocytic oxygen utilization increases with activation (from states 3 to 4). In particular, increasing

progressively shifts the balance of glucose utilization from being mostly glial to being mostly neuronal. As a consequence, the amplitude of the carbon shuttle from glia to neurons progressively decreases with increasing values of

(Figure
5
). While the value we chose for

is in line with the study by
Cruz et al. (2005)
(

), some of us have reported larger values in the range of +90% in rodents and +60% in humans (
Wyss et al., 2009
). However, it should be noted that the increase in CMR
glc between rest and activation observed by Wyss and colleagues is about +130%, much larger than the values used in this study (+79% in humans and +75% in rats). When increasing CMR
glc(4) so as to match such an increase, we could increase

as high as

in rodents with no significant qualitative change in the results presented above (not shown). Nevertheless, the importance of

as a control parameter in our approach suggests that the oxidative metabolism of astrocytes might play a very important role in the control of metabolic neuron-astrocyte interactions possibly inducing a change of regime from highly interdependent cell populations at the onset of activation when the astrocytic oxidative metabolism is not or only weakly upregulated (
Cruz et al., 2005
;
Kasischke et al., 2004
) to metabolically disconnected or weakly connected cell populations at later stages of stimulation (
Wyss et al., 2009
). The lactate produced in these late stages could diffuse away from the production site, possibly to other brain areas (
Dienel and Cruz, 2004
;
Dienel and Hertz, 2001
).
In our analysis, we have not considered glycogen, a potentially important energy substrate reservoir localized in astrocytes only. During strong activation, there is evidence that the stock of glycogen decreases (
Swanson et al., 1992
). Glycogen has been reported to be continuously degraded and resynthesized (
Shulman et al., 2001
;
Walls et al., 2009
). Glucose metabolism via this
glycogen shunt only produces one ATP versus two generated via the glycolysis. Notwithstanding, our main results should not be significantly affected by this simplification even though it implies that our estimate of the astrocytic contribution to the total energy budget might be slightly overestimated. It is important however to keep in mind that most of the ATP is produced oxidatively. Moreover, the size of the glycogen reservoir is relatively small and thus may not contribute to an extent that would affect the calculated energy budget. Similarly, neglecting glycogen does not change our findings on the astrocyte-neuron transfer of glucose-derived metabolites. Glycogen utilization can be interpreted as an increase in the effective astrocytic fraction of the total glucose used to feed ATP synthesis. Furthermore, the end product of glycogenolysis in astrocytes has been reported to be lactate (
Dringen et al., 1993
). This process is consistent with the concept of the astrocyte-neuron lactate shuttle hypothesis rather than with the exchange of substrates in the opposite direction (
Pellerin et al., 2007
).
It should be further emphasized that our results do not depend on any assumption about the distribution of glucose and lactate transporters or on a specific scheme of stimulation during activation. Likewise, they do not depend on the exact route followed by metabolites, the extracellular space very likely being the place of exchanges between astrocytes and neurons. Furthermore, our results are independent from the exact pathways involved in glucose oxidation. More specifically, they hold equally well whether lactate or pyruvate is the end product of aerobic glycolysis in neurons (
Schurr and Payne, 2007
). Finally, our approach bypasses considerations on what drives the lactate shuttle, glutamate capture by astrocytes (
Pellerin and Magistretti, 1994
) or activation of astrocytic AMPA receptors (
Caesar et al., 2008
), while producing estimates of the cost of recycling glutamate consistent with other studies (
Attwell and Laughlin, 2001
). Future work is needed to experimentally test the predictions and conclusions drawn from the present modelling work.
Conflict of Interest Statement
The authors declare that the research was conducted in the absence of any commercial or financial relationships that could be construed as a potential conflict of interest.
This work was supported by the Swiss National Science Foundation (grant PP00B-110751/1), the Novartis Research Foundation and the OPO Foundation (to BW). RJ is supported by a fellowship from the Roche Research Foundation and by a research grant from the Forschungskredit der Universität Zürich.
Attwell, D., and Laughlin, S. B. (2001). An energy budget for signaling in the grey matter of the brain.
J. Cerebr. Blood F. Met. 21, 1133–1145.
Aubert, A., Costalat, R., Magistretti, P. J., and Pellerin, L. (2005). Brain lactate kinetics: modeling evidence for neuronal lactate uptake upon activation.
PNAS 102, 16448–16453.
Aubert, A., Pellerin, L., Magistretti, P. J., and Costalat, R. (2007). A coherent neurobiological framework for functional neuroimaging provided by a model integrating compartmentalized energy metabolism.
PNAS 104, 4188–4193.
Berg, J. M., Tymoczko, J. L., and Stryer, L. (2006). Biochemistry, 6th Edn. New York: W. H. Freeman & Co Ltd.
Caesar, K., Hashemi, P., Douhou, A., Bonvento, G., Boutelle, M. G., Walls, A. B., and Lauritzen, M. (2008). Glutamate receptor-dependent increments in lactate, glucose and oxygen metabolism evoked in rat cerebellum
in vivo.
J. Physiol. 586.5, 1337–1349.
Chatton, J. Y., Pellerin, L., and Magistretti, P. J. (2003). GABA uptake into astrocytes is not associated with significant metabolic cost: Implications for brain imaging of inhibitory transmission.
PNAS 100, 12456–12461.
Choi, I. Y., Lei, H. X., and Gruetter, R. (2002). Effect of deep pentobarbital anesthesia on neurotransmitter metabolism in vivo: on the correlation of total glucose consumption with glutamatergic action.
J. Cerebr. Blood F. Met. 22, 1343–1351.
Cruz, N. F., Lasater, A., Zielke, H. R., and Dienel, G. A. (2005). Activation of astrocytes in brain of conscious rats during acoustic stimulation: acetate utilization in working brain.
J. Neurochem. 92, 934–947.
Dalsgaard, M. K. (2006). Fuelling cerebral activity in exercising man.
J. Cerebr. Blood F. Met. 26, 731–750.
Dienel, G. A., and Cruz, N. F. (2004). Nutrition during brain activation: does cell-to-cell lactate shuttling contribute significantly to sweet and sour food for thought?
Neurochem. Int. 45, 321–351.
Dienel, G. A., and Hertz, L. (2001). Glucose and lactate metabolism during brain activation.
J. Neurosci. Res. 66, 824–838.
Dringen, R., Gebhardt, R., and Hamprecht, B. (1993). Glycogen in astrocytes – possible function as lactate supply for neighboring cells.
Brain Res. 623, 208–214.
Erlichman, J. S., Hewitt, A., Damon, T. L., Hart, M., Kurascz, J., Li, A., and Leiter, J. C. (2008). Inhibition of monocarboxylate transporter 2 in the retrotrapezoid nucleus in rats: a test of the astrocyte–neuron lactate-shuttle hypothesis.
J. Neurosci. 28, 4888–4896.
Gjedde, A. (2007). Coupling of brain function to metabolism: evaluation of energy requirements. In Handbook of Neurochemistry and Molecular Neurobiology, A. Lajtha, G. E. Gibson and G. A. Dienel, eds (New York, Springer), pp. 343–400.
Gjedde, A., Marrett, S., and Vafaee, M. (2002). Oxidative and nonoxidative metabolism of excited neurons and astrocytes.
J. Cerebr. Blood F. Met. 22, 1–14.
Gordon, G. R., Choi, H. B., Rungta, R. L., Ellis-Davies, G. C., and MacVicar, B. A. (2008). Brain metabolism dictates the polarity of astrocyte control over arterioles.
Nature 456, 745–749.
Gruetter, R., Seaquist, E. R., and Ugurbil, K. (2001). A mathematical model of compartmentalized neurotransmitter metabolism in the human brain.
Am. J. Physiol. Endocrinol. Metab. 281, E100–E112.
Hertz, L., Peng. L., and Dienel, G. A. (2007). Energy metabolism in astrocytes: high rate of oxidative metabolism and spatiotemporal dependence on glycolysis/glycogenolysis.
J. Cerebr. Blood F. Met. 27, 219–249.
Hinkle, P. C., Kumar, M. A., Resetar, A., and Harris, D. L. (1991). Mechanistic stoichiometry of mitochondrial oxidative-phosphorylation.
Biochemistry 30, 3576–3582.
Hyder, F., Patel, A. B., Gjedde, A., Rothman, D. L., Behar, K. L., and Shulman, R. G. (2006). Neuronal-glial glucose oxidation and glutamatergic – GABAergic function.
J. Cerebr. Blood F. Met. 26, 865–877.
Jolivet, R., Allaman, I., Pellerin, L., and Magistretti, P. J. (2009). The astrocyte-neuron metabolic coupling index: a simple relation to assess the degree of metabolic coupling between astrocytes and neurons. In revision.
Kasischke, K. A., Vishwasrao, H. D., Fisher, P. J., Zipfel, W. R., and Webb, W. W. (2004). Neural activity triggers neuronal oxidative metabolism followed by astrocytic glycolysis.
Science 305, 99–103.
Kety, S. S. (1957). The general metabolism of the brain
in vivo. In Metabolism of The Nervous System, D. Richter, ed. (London, Pergamon), pp. 221–237.
Lebon, V., Petersen, K. F., Cline, G. W., Shen, J., Mason, G. F., Dufour, S., Behar, K. L., Shulman, G. I., and Rothman, D. L. (2002). Astroglial contribution to brain energy metabolism in humans revealed by C-13 nuclear magnetic resonance spectroscopy: elucidation of the dominant pathway for neurotransmitter glutamate repletion and measurement of astrocytic oxidative metabolism.
J. Neurosci. 22, 1523–1531.
Lennie, P. (2003). The cost of cortical computation.
Curr. Biol. 13, 493–497.
Lieth, E., LaNoue, K. F., Berkich, D. A., Xu, B. Y., Ratz, M., Taylor, C., and Hutson, S. M. (2001). Nitrogen shuttling between neurons and glial cells during glutamate synthesis.
J. Neurochem. 76, 1712–1723.
Logothetis, N. K., Pauls, J., Augath, M., Trinath, T., and Oeltermann, A. (2001). Neurophysiological investigation of the basis of the fMRI signal.
Nature 412, 150–157.
Magistretti, P. J. (2008). Brain energy metabolism. In Fundamental Neuroscience, 3rd Edn, L. R. Squire, F. E. Bloom and N. C. Spitzer, eds (San Diego, Academic Press), pp. 271–296.
Magistretti, P. J., and Pellerin, L. (1999). Cellular mechanisms of brain energy metabolism and their relevance to functional brain imaging.
Phil. Trans. R. Soc. Lond. B 354, 1155–1163.
Mangia, S., Tkác, I., Gruetter, R., Van de Moortele, P.-F., Maraviglia, B., and Ugurbil, K. (2007). Sustained neuronal activation raises oxidative metabolism to a new steady-state level: evidence from
1H NMR spectroscopy in the human visual cortex.
J. Cerebr. Blood F. Met. 27, 1055–1063.
Merle, M., Bouzier-Sore, A. K., and Canioni, P. (2002). Time-dependence of the contribution of pyruvate carboxylase versus pyruvate dehydrogenase to rat brain glutamine labelling from [1-C-13]glucose metabolism.
J. Neurochem. 82, 47–57.
Nawroth, J. C., Greer, C. A., Chen, W. R., Laughlin, S. B., and Shepherd, G. M. (2007). An energy budget for the olfactory glomerulus.
J. Neurosci. 27, 9790–9800.
Nehlig, A., Wittendorp-Rechenmann, E., and Lam, C. D. (2004). Selective uptake of [C-14]2-deoxyglucose by neurons and astrocytes: high-resolution microautoradiographic Imaging by cellular C-14-trajectography combined with immunohistochemistry.
J. Cerebr. Blood F. Met. 24, 1004–1014.
Öz, G., Berkich, D. A., Henry, P. G., Xu, Y. P., LaNoue, K., Hutson, S. M., and Gruetter, R. (2004). Neuroglial metabolism in the awake rat brain: CO2 fixation increases with brain activity.
J. Neurosci. 24, 11273–11279.
Patel, A. B., de Graaf, R. A., Mason, G. F., Rothman, D. L., Shulman, R. G., and Behar, K. L. (2005). The contribution of GABA to glutamate/glutamine cycling and energy metabolism in the rat cortex
in vivo.
PNAS 102, 5588–5593.
Pellerin, L., Bouzier-Sore, A. K., Aubert, A., Serres, S., Merle, M., Costalat, R., and Magistretti, P. J. (2007). Activity-dependent regulation of energy metabolism by astrocytes: an update.
Glia 55, 1251–1262.
Pellerin, L., and Magistretti, P. J. (1994). Glutamate uptake into astrocytes stimulates aerobic glycolysis – a mechanism coupling neuronal-activity to glucose-utilization.
PNAS 91, 10625–10629.
Pfrieger, F. W. (2003). Outsourcing in the brain: do neurons depend on cholesterol delivery by astrocytes?
Bioessays 25, 72–78.
Prichard, J., Rothman, D. L., Novotny, E. J., Petroff, O. A. C., Kuwabara, T., Avison, M., Howseman, A., Hanstock, C., and Shulman, R. G. (1991). Lactate rise detected by
1H NMR in human visual cortex during physiologic stimulation.
PNAS 88, 5829–5831.
Rauch, A., La Camera, G., Lüscher, H. R., Senn, W., and Fusi, S. (2003). Neocortical pyramidal cells respond as integrate-and-fire neurons to in vivo-like input currents.
J. Neurophysiol. 90, 1598–1612.
Rolfe, D. F. S., and Brown, G. C. (1997). Cellular energy utilization and molecular origin of standard metabolic rate in mammals.
Physiol. Rev. 77, 731?758.
Rouach, N., Koulakoff, A., Abudara, V., Willecke, K., and Giaume, C. (2008). Astroglial metabolic networks sustain hippocampal synaptic transmission.
Science 322, 1551–1555.
Schurr, A., and Payne, R. S. (2007). Lactate, not pyruvate, is neuronal aerobic glycolysis end product: an
in vitro electrophysiological study.
Neuroscience 147, 613–619.
Serres, S., Raffard, G., Franconi, J. M., and Merle, M. (2008). Close coupling between astrocytic and neuronal metabolisms to fulfill anaplerotic and energy needs in the rat brain.
J. Cerebr. Blood F. Met. 28, 712–724.
Shen, J., Petersen, K. F., Behar, K. L., Brown, P., Nixon, T. W., Mason, G. F., Petroff, O. A. C., Shulman, G. I., Shulman, R. G., and Rothman, D. L. (1999). Determination of the rate of the glutamate glutamine cycle in the human brain by in vivo C-13 NMR.
PNAS 96, 8235–8240.
Shimizu, H., Watanabe, E., Hiyama, T., Nagakura, A., Fujikawa, A., Okado, H., Yanagawa, Y., Obata, K., and Noda, M. (2007). Glial Na
x channels control lactate signaling to neurons for brain [Na
+] sensing.
Neuron 54, 59–72.
Shulman, R. G., Hyder, F., and Rothman, D. L. (2001). Cerebral energetics and the glycogen shunt: Neurochemical basis of functional imaging.
PNAS 98, 6417–6422.
Sibson, N. R., Dhankhar, A., Mason, G. F., Rothman, D. L., Behar, K. L., and Shulman, R. G. (1998). Stoichiometric coupling of brain glucose metabolism and glutamatergic neuronal activity.
PNAS 95, 316–321.
Sibson, N. R., Mason, G. F., Shen, J., Cline, G. W., Herskovits, A. Z., Wall, J. E. M., Behar, K. L., Rothman, D. L., and Shulman, R. G. (2001). In vivo C-13 NMR measurement of neurotransmitter glutamate cycling, anaplerosis and TCA cycle flux in rat brain during [2-C-13]glucose infusion.
J. Neurochem. 76, 975–989.
Sokoloff, L. (1960). The metabolism of the central nervous system
in vivo. In Handbook of Physiology, Section I, Neurophysiology, J. Field, H. W. Magoun and V. E. Hall, eds (Washington DC, American Physiological Society), pp. 1843–1864.
Swanson, R. A., Morton, M. M., Sagar, S. M., and Sharp, F. R. (1992). Sensory stimulation induces local cerebral glycogenolysis – demonstration by autoradiography.
Neuroscience 51, 451–461.
Tsacopoulos, M., Evequozmercier, V., Perrottet, P., and Buchner, E. (1988). Honeybee retinal glial-cells transform glucose and supply the neurons with metabolic substrate.
PNAS 85, 8727–8731.
Véga, C., Martiel, J. L., Drouhault, D., Burckhart, M. F., and Coles, J. A. (2003). Uptake of locally applied deoxyglucose, glucose and lactate by axons and Schwann cells of rat vagus nerve.
J. Physiol. London 546, 551–564.
Verkhratsky, A., and Butt, A. M. (2007). Glial Neurobiology. Chichester, John Wiley & Sons Ltd.
Walls, A. B., Heimburger, C. M., Bouman, S. D., Schousboe, A., and Waagepetersen, H. S. (2009). Robust glycogen shunt activity in astrocytes: effects of glutamatergic and adrenergic agents.
Neuroscience 158, 284–292.
Wong-Riley, M. T. T. (1989). Cytochrome oxidase: an endogenous metabolic marker for neuronal activity.
Trends Neurosci. 12, 94–101.
Wyss, M. T., Weber, B., Treyer, V., Heer, S., Pellerin, L., Magistretti, P. J., and Buck, A. (2009). Stimulation-induced increases of astrocytic oxidative metabolism in rats and humans investigated with 1-
11C-acetate.
J. Cerebr. Blood F. Met. 29, 44–56.
Xu, Y., Oz, G., LaNoue, K. F., Keiger, C. J., Berkich, D. A., Gruetter, R., and Hutson, S. H. (2004). Whole-brain glutamate metabolism evaluated by steady-state kinetics using a double-isotope procedure: effects of gabapentin.
J. Neurochem. 90, 1104–1116.
Yamanishi, S., Katsumura, K., Kobayashi, T., and Puro, D. G. (2006). Extracellular lactate as a dynamic vasoactive signal in the rat retinal microvasculature.
Am. J. Physiol. Heart Circul. Physiol. 290, H925–H934.
Zielke, H. R., Zielke, C. L., Baab, P. J., and Tildon, J. T. (2007). Effect of fluorocitrate on cerebral oxidation of lactate and glucose in freely moving rats.
J. Neurochem. 101, 9–16.