
 Joel Aanerud1
- 1 Department of Nuclear Medicine and Positron Emission Tomography Centre, Aarhus University Hospital, Aarhus, Denmark
- 2 Department of Neurology, Aarhus University Hospital, Aarhus, Denmark
- 3 Department of Neuroscience and Pharmacology and Center of Healthy Aging, Faculty of Health and Medical Sciences, University of Copenhagen, Copenhagen, Denmark
We tested the claim that inter-individual CBF variability in Alzheimer’s disease (AD) is substantially reduced after correction for arterial carbon dioxide tension (PaCO2). Specifically, we tested whether the variability of CBF in brain of patients with AD differed significantly from brain of age-matched healthy control subjects (HC). To eliminate the CO2-induced variability, we developed a novel and generally applicable approach to the correction of CBF for changes of PaCO2 and applied the method to positron emission tomographic (PET) measures of CBF in AD and HC groups of subjects. After correction for the differences of CO2 tension, the patients with AD lost the inter-individual CBF variability that continued to characterize the HC subjects. The difference (ΔK1) between the blood-brain clearances (K1) of water (the current measure of CBF) and oxygen (the current measure of oxygen clearance) was reduced globally in AD and particularly in the parietal, occipital, and temporal lobes. We then showed that oxygen gradients calculated for brain tissue were similar in AD and HC, indicating that the low residual variability of CBF in AD may be due to low functional demands for oxidative metabolism of brain tissue rather than impaired delivery of oxygen.
Introduction
CBF Variability
Cerebral blood flow (CBF) measures vary greatly among healthy individuals at rest (Ito et al., 2004; Aanerud et al., 2012). Some of this inter-individual variability may arise from intra-individual temporal fluctuations in CBF regulation, such as arterial CO2 tension changes or varying functional demands within each subject. At subject level, intra-individual measures of CBF variability also provide the basis for current functional brain mapping techniques with [15O]water in PET, and also with BOLD signals in functional Magnetic Resonance Imaging (fMRI). The inter-individual CBF variation among healthy people and patients with neurodegenerative disorders such as Alzheimer’s disease can therefore arise from separate classes of variation: (i) Individual transient fluctuations varying with time constants of seconds, minutes, or hours, and (ii) Intrinsic variability among the subjects’ ability to regulate blood flow. Separating these classes of variation becomes crucial in determining pathological conditions affecting either (i) or (ii) and in determining their causal relationship.
In this work we (A) develop a new method for estimating the change in CBF in response to PaCO2 (which is a well described regulator of CBF), and (B) we show that once the CO2 variation is factored out, there remains very little variation in a group of patients suffering from AD compared to a group of healthy aged control subjects. To analyze possible links between the loss of variability in AD and brain metabolism, we also (C) analyze the relationship between CBF and oxygen consumption CMRO2.
Factors Influencing CBF Variability
Some factors influencing the variability of CBF are known, including arterial blood pressure changes and variations of the arterial carbon dioxide tension (PaCO2), but the mechanisms of global and regional flow-metabolism coupling in response to changes of brain functional demands, embodied in part in the so-called neurovascular control unit, involving both microvessels and astrocytic endfeet, are unclear, despite many years of study (Berne et al., 1981; Kontos, 1981; Nicolakakis and Hamel, 2011; Peterson et al., 2011).
Changes in the cerebral microvascular endothelium may be implicated in the pathogenesis of neurodegenerative diseases and possibly even in the onset of AD, as regulatory deficiency can cause cerebral hypoperfusion which may precede or contribute to AD (Nagata et al., 2000; Farkas and Luiten, 2001; Grammas et al., 2011; van Beek et al., 2012). Thus, the evidence of amyloid-related pathogenesis of AD may bear directly on endothelial function (Deane et al., 2003; Grammas et al., 2011) and indirectly on the transient control of CBF, although the order of cause and effect remains uncertain (Chen et al., 2011). Indeed, the findings suggest that loss of vasomotor dynamics may contribute to the hypoperfusion, if the neurovascular mediators of functional flow variability are uncoupled from the response to CO2 (Iliff et al., 2003).
Pressure Autoregulation of CBF
In the following, we distinguish between purely vascular reactivity, which includes pressure autoregulation and CO2 response, on one hand, and the metabolic or functional reactivity, on the other (Nagata et al., 2000). Blood pressure autoregulation serves to minimize the effect of arterial blood pressure changes on cerebral blood flow. The mechanism is uncertain, but it differs fundamentally from the process that elicits changes of cerebral blood flow in response to changes of CO2. Thus, situations exist in which one of the two mechanisms is preserved and the other is impaired (Lauritzen, 1984; Panerai et al., 1999).
With transcranial laser Doppler technique in patients with mild AD, Claassen et al. found little impairment of cerebral autoregulation, but generally lower variability of CBF velocity (CBFV; Claassen et al., 2009; Claassen and Zhang, 2011). The low variability was reflected in the average baseline CBFV measure of 38 vs. 55 cm/s in AD vs. HC, although the authors later were unable to confirm the findings (van Beek et al., 2012). Using PET in AD, Zazulia et al. (2010) found that cerebral perfusion rates remained stable with a moderate 14% decline of blood pressure, although interpretations were complicated by the low blood pressure change and the use of nicardipine to modify the blood pressure (Claassen and Zhang, 2011).
CO2 Effect on CBF
The vasoactive response to carbon dioxide was established by Carl F. Schmidt as early as in 1928 and by the later reports of Kety and Schmidt on the effects of CO2 inhalation in pilots (Schmidt, 1928; Kety and Schmidt, 1946, 1948), followed by extensive confirmation until this date. Evidence suggests that CO2 reactivity is preserved in human AD (Jagust et al., 1997; Nagata et al., 2000), and likewise in transgenic mice that overexpress the amyloid precursor protein (APP; Niwa et al., 2002).
Corrections for CO2 Effect
The findings above suggest that the low, but relatively constant baseline perfusion in AD possibly is related to reduced activity of the neurovascular mediators of fluctuating functional demands. Thus, a fundamental loss of functional brain dynamics in AD can be revealed only when CBF variations related to PaCO2 change are eliminated. Here, we reveal the degree of reduction of the variability of CBF remaining after elimination of the CO2 effect. We use a novel approach to correction for PaCO2 changes, which corrects both individual and group measures of CBF, in relation to the average normocapnic PaCO2 and its corresponding CBF. The method as presented has broad applicability to CBF measurements, regardless of modality, including non-invasive measures of CO2 (for example with a finger monitor). We used this novel approach to determine how much of the CBF variability remained after the reactivity due to variations of PaCO2 was eliminated in a group of healthy individuals and a group of patients with AD.
Delivery of Oxygen after Loss of Variability
To understand how the loss of CBF variability related to functional demands in the AD patients, we tested whether the dependence of oxygen consumption on oxygen delivery to the brain (ΔK1) was affected in brain of the patients with AD.
Materials and Methods
The methods used in this study consist of three major parts
1) Derivation of the method used for factoring out the CO2 variability, and how to use it for other studies.
2) Methods pertaining to the acquisition of the data from the AD and HC subjects.
3) How to combine the CBF and CMRO2 data in order to estimate the oxygen gradient in the tissue.
Correction for CO2 Effect
The method used for factoring out the CO2 variability in humans was developed by modifying the functional relationship of CBF derived from a primate study, so that it fits well with the human response to CO2 changes in the blood. The regression for estimating the human parameters was done using previous published studies. The developed method1 can be generally applied to any new dataset where normocapnic set-point of mean CBF and mean CO2 are known.
Estimating the CO2 effect in humans from historic data
The correction factor fC is the relative change that an average baseline CBF value measured at a standard PaCO2 level undergoes as a function of a varying PaCO2 in the blood [see equation (8) below].
Corresponding single subject values of PaCO2 and CBF in hypo-, normo-, and hypercapnia of humans were extracted from values reported by Kety and Schmidt(1946, 1948), and digitized from Figure 2 reported by Ramsay et al. (1993). Normalized fractional values were calculated relative to the mean normal values presented by Ramsay et al. (1993). For each subject, the relative fractional hypocapnic and hypercapnic values of PaCO2 were converted to units of mmHg relative to the mean normocapnic PaCO2 tension of 39.5 mmHg. The single subject fractional CBF response was calculated relative to the normocapnic CBF value, as listed in Table 1. The relative PaCO2 values and fractional CBF response were used to estimate the correction factor fC. To do so, we considered several possible model functions of the data and chose the exponential relation given by Reivich (1964). In order to model the data for use as a practical correction, we modified the parameters of the shape of the response curve of Reivich (1964) to reflect the relative human CBF measures as function of the PaCO2 variation relative to the mean normocapnic PaCO2. The relationship presented as Figure 3 of Reivich (1964) for rhesus monkeys is a logistic curve in which the lower limit of hypocapnic CBF is 20.9 mL/100 g/min and the upper limit of hypercapnic CBF is 113.7 mL/100 g/min. By normalizing to the average measured baseline CBF of 49.3 mL/100 g/min in the present study, the relative relationship for rhesus monkeys became,
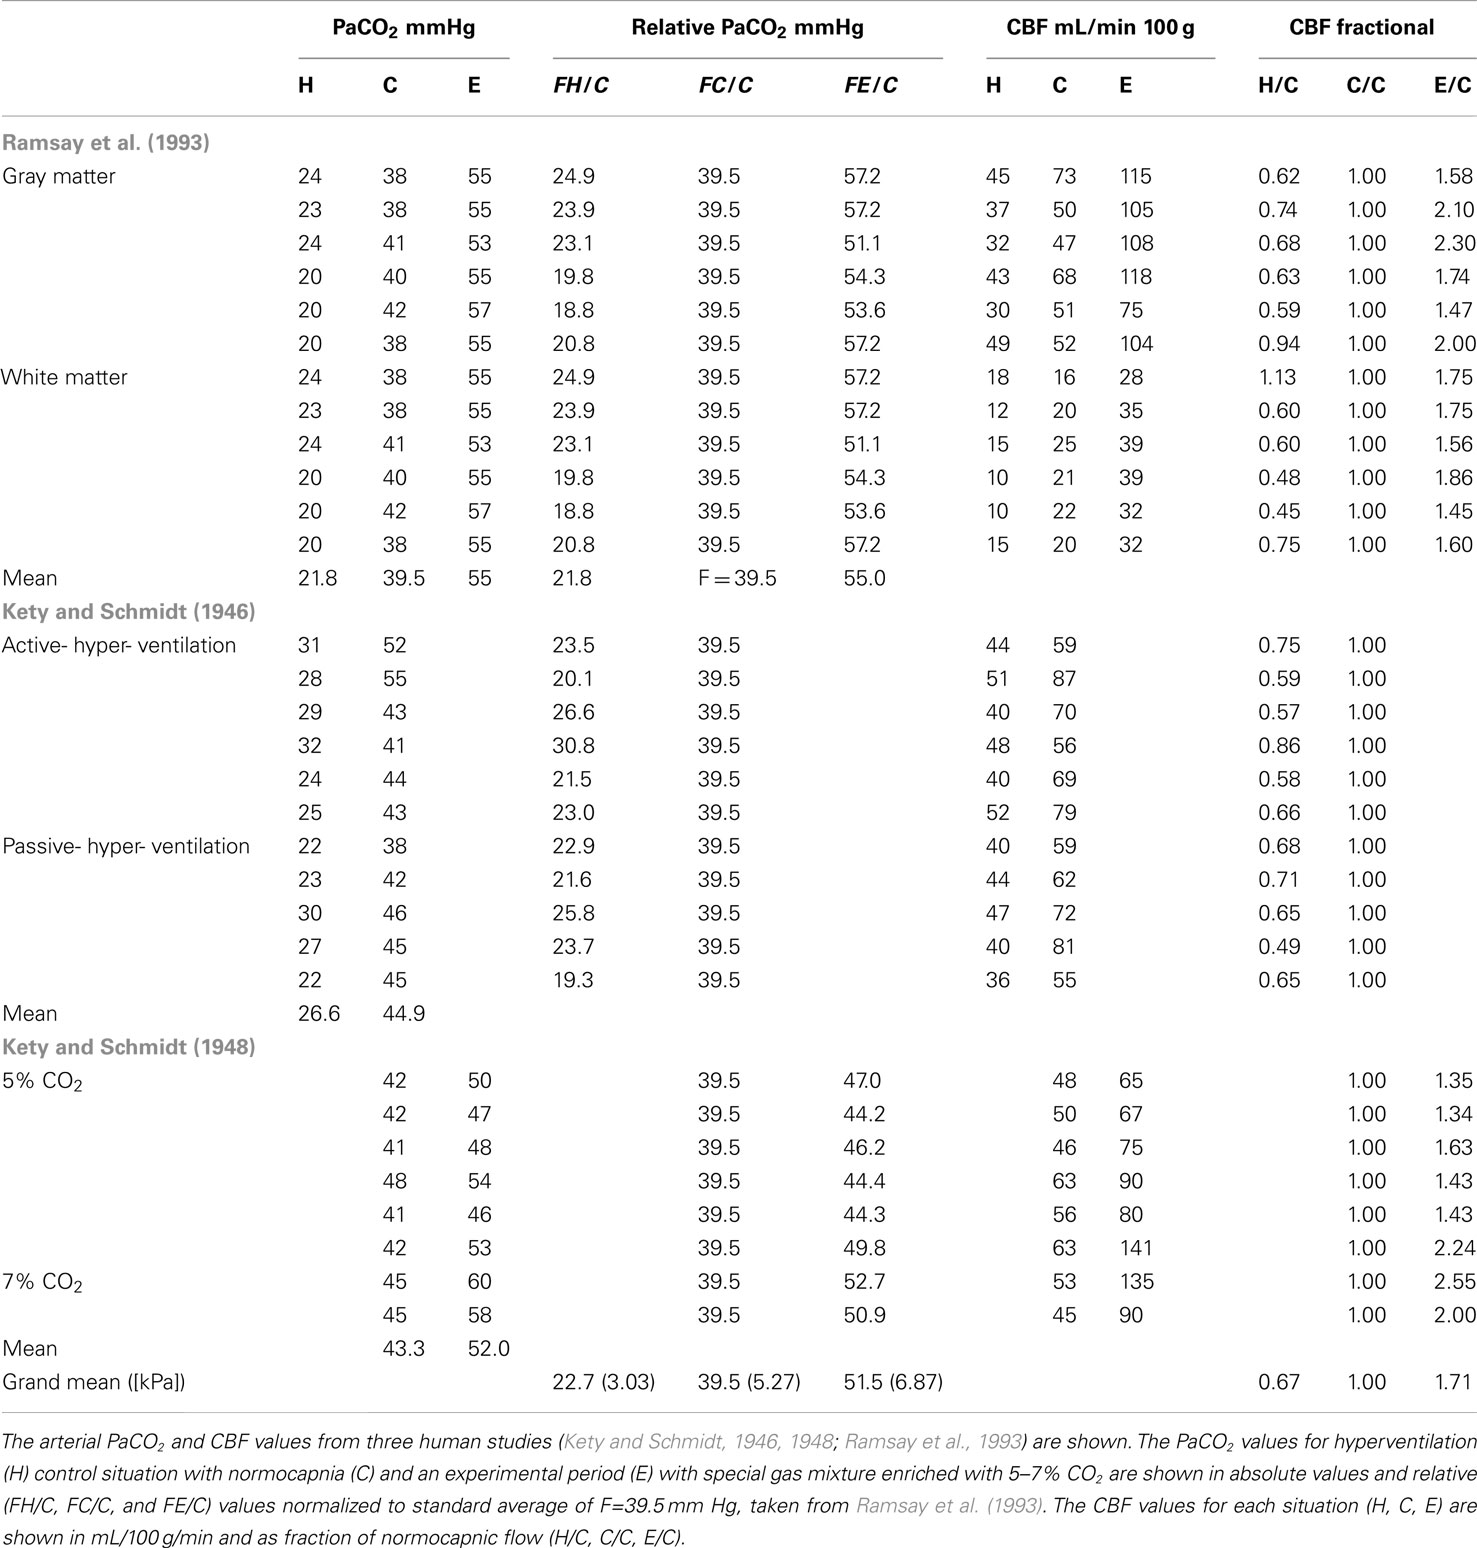
Table 1. Carbon dioxide reactivity.
where kr = − 5.251 and B = 10,570. By changing the logarithm from log10 to the natural logarithm using log10(x) = ln(x)/ln(10) equation (1) becomes
This simplifies the equation to
where ka = kr/ln(10) = − 2.2805 and B = 10,570. This equation describes the CO2-induced relative CBF changes compared to the average baseline CBF and therefore serves as a basis for correction. The values 0.42 and 2.31 are the minimum and maximum relative change the blood flow is predicted to deviate from a normalized CBF of 1.
To fit this function to human data, we determined the values of B and ka and the maximum correction for hypercapnia Hmax, and the minimum correction for hypocapnia Hmin. Because the hypocapnic values of CBF have less variation, Hmin represents an average relative decrease to 0.67 of the normocapnic flow. For hypercapnic values with greater variation of the CBF response, the theoretical maximum was chosen to be the maximally observed response of Hmax = 2.55, i.e., 2.55 times the normocapnic flow. Given that the function must pass through a normocapnic correction factor of unity (at the point 39.5,1), B was isolated as a function of ka,
This means that the correction factor fC is dependent only on the parameter constants Hmin, Hmax, and the remaining constant ka
from which we estimate the remaining parameter ka by regression such that fC is consistent with the average values for the hypo- and hypercapnic response. The fitted function is shown in Figure 1.
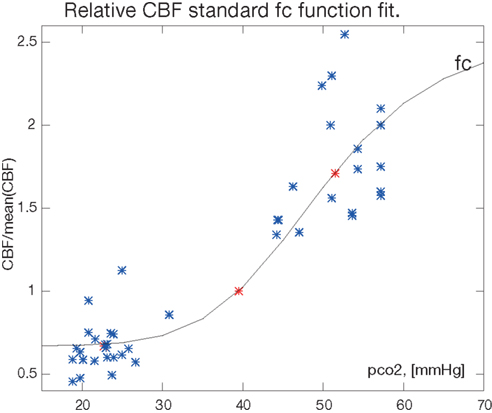
Figure 1. The fitted function for the correction factor fc. The factor and the fractional CBF values H/C, C/C, and C/E are shown in relation to the relative PaCO2 (pco2) measure in [mmHg]. The normocapnic points constrain the fit at relative CBF value C/C = 1 by definition. Single measurements from Table 1 are blue, mean values are red (*).
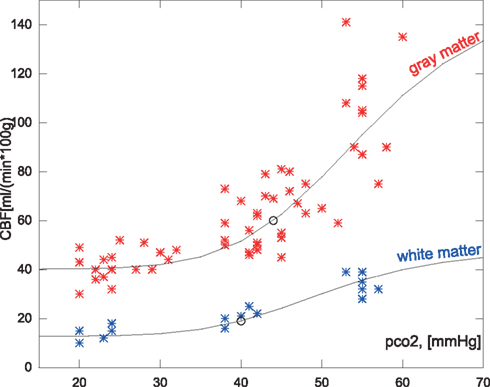
Figure 2. Measured hypocapnic, normocapnic, and hypercapnic quantitative CBF values in relation to the absolute measured PaCO2 (pco2) in mm Hg. The red values are cortical values taken from Ramsay et al. (1993) or measurements from Kety and Schmidt(1946, 1948), based on the nitrous oxide method. The blue values are white matter flow taken from Ramsay et al. (1993). The points are super-positioned with curves of the expected CBF values when using the correction function relative to a mean normocapnic flow.
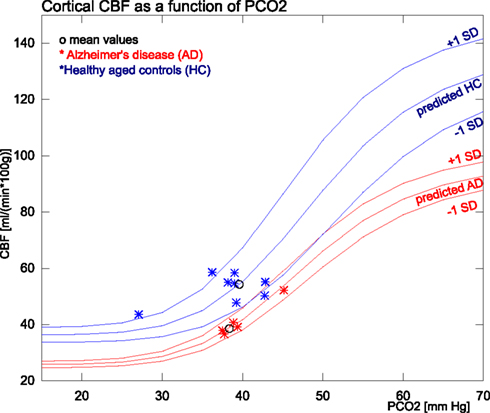
Figure 3. The figure shows the measured and predicted CBF values for AD and healthy subjects in relation to PaCO2 measures. The group means and SD used for the predictions are from within the normocapnic range of 35–45 mm Hg. The single SD estimates are based on and .
The fitted version of equation (5) with fixed human parameters Hmin, Hmax, B, and ka is the standard curve used for the subsequent correction of new data. The standard curve assumes standard baseline CO2 set-point (F) for normocapnia to be at F = 39.5 mmHg.
Application of CO2 correction
The application of the standard correction factor to an actual dataset consist of tree main parts:
I) Find the baseline CO2 set-point for the study, and define the scaling factor relative to the standard F = 39.5 mmHg.
II) Scale the measured CO2 value by R and insert in equation (8) to find fC.
III) Divide the measured flow (CBFmeasured) by the fC to get the corrected flow CBFcorrected.
For the application of the correction factor to an actual dataset, we need to know the baseline set-point of average normal PaCO2 for that dataset. Note that this is possibly different in different subgroups, but was not statistically different in the groups we studied. Therefore we used a common mean for both AD and HC groups. This baseline set-point is used relative to the standard CO2 value F = 39.5 mmHg used in the regression to scale new CO2 values relative to the standard CO2 range.
Having chosen the mean reference value whereby R becomes the correction factor fC for a measured flow (CBFmeasured) observed at can be found as a modified version of equation (5) with normocapnia set at the value of the dataset,
such that when fC = 1, no correction occurs.
The actual corrected CBF value is now readily found by dividing the measured flow by the estimated fC.
For a given normocapnic value of CBF (CBFnorm), the inverse predicted values for hypercapnia and hypocapnia CBFpredict can be found by the relationship,
Positron Emission Tomography
During a series of PET investigations in which values of PaCO2 were not deliberately varied, we measured the arterial PaCO2 tension in samples from a group of healthy age-matched healthy volunteers (HC, n = 8) and a group of patients with Alzheimer’s disease (AD, n = 5). The tracers used to determine rates of CBF and CMRO2, respectively, were [15O]water and [15O]O2.
Subjects
Five patients with AD (3 women, 2 men) with an average age of 64 (SD 7) years and moderately reduced Mini-mental State Examination (MMSE) scores of 22–25 volunteered to complete the tomography. The patients were recruited by the local Dementia Clinic and screened by an experienced neurologist for the presence of probable Dementia of Alzheimer’s Type (DAT). Eight healthy age-matched HC volunteers with MMSE and CAMCOG scores in the range of 28–30 with a mean age of 67 (SD = 6) years served as controls, recruited by public advertisement and screened with clinical, neurological, and neuropsychological testing including MMSE adapted to Danish (Lolk et al., 2000) to exclude cognitive impairment. We obtained written informed consent from all subjects to the protocols approved by the Regional Science Ethics Committee in accordance with the Declarations of Helsinki.
CBF and CMRO2
All subjects had one or two [15O]water and one or two [15O]O2 emission recordings in the 3D mode of the ECAT High Resolution Research Tomograph (HRRT, CTI/Siemens, Knoxville, TN, USA) in a quiet room with the subjects resting in a supine position with eyes open. The images were reconstructed with 3D-OP-OSEM point spread function reconstruction (Varrone et al., 2009) using 10 iterations and 16 subsets with FWHM at approximately 1.5 mm. The reconstructed images were corrected for random and scatter events, detector efficiency variations, and dead time. Tissue attenuation scans were performed using a rotating [68Ge] source. Dynamic emission recordings lasting 3 min (21 frames) were initiated upon bolus intravenous injection of [15O]water (500 MBq) or inhalation of [15O]O2 (1000 MBq). Catheters (Artflon and Venflon, Becton Dickinson, Swindon, UK) were inserted in the right radial artery and left cubital vein and arterial blood radioactivity was measured every half second for the duration of the PET scan by an automated blood sampling system (Allogg AB, Mariefred, Sweden), cross-calibrated with the tomograph, and then corrected for external delay and dispersion.
We quantified the CBF as the water clearance from the blood in units of mL/100 g/min with the linearized two-compartment model (Blomqvist, 1984) modification of Ohta et al. (1996) and the Lawson-Hanson non-negative least squares solution to general least squares functions (Lawson and Hanson, 1974).
We quantified the CMRO2 in units of μmol/100 g/min from the oxygen clearance from the blood by multiplying individual hemoglobin concentrations with the oxygen clearance obtained with the same linearized two-compartment model (Blomqvist, 1984) modification of Ohta et al. (1992) and the Lawson-Hanson non-negative least squares solution to general least squares functions (Lawson and Hanson, 1974). Arterial CO2 tensions were measured in manually drawn blood samples obtained in relation to the PET acquisitions with the ABL825flex blood analyzer.
Individual images for each group were averaged after spatial normalization, to produce average CBF and average CMRO2 values. To enable direct comparison with the average CBF values, we scaled the average CMRO2 values back to the value in units of mL/100 g/min, using the group mean hemoglobin concentration Hbmean for each subject.
Statistical difference between AD and HC group means were calculated for cortical values using a two-sample t-test of the null hypothesis of equal means. The analysis of variance between groups used the two-sample F-test of the null hypothesis of equal variances.
Tissue Oxygen Gradient
In order to estimate the oxygen gradient in the tissue, we combined measures of CBF and CMRO2 to calculate the capillary oxygen tension and subsequently the CMRO2 to estimate the mitochondrial oxygen tension decrease as a function of distance from the capillaries.
The derivation of the mitochondrial oxygen gradient in the tissue (Gjedde et al., 2002) proceeded as follows: The decline of oxygen tension from the capillaries to mitochondria determines the transport of oxygen and hence defines the rate of oxygen consumption (Gjedde et al., 2005),
where L is Krogh’s diffusion coefficient which depends on the distance from the capillaries, and and are the oxygen tensions in the capillaries and mitochondria, respectively. From this relationship, we defined the tissue gradient as a function of the diffusion capacity (Gjedde et al., 2010),
Given the average capillary oxygen tension and the CMRO2 the mitochondrial oxygen tension was plotted as a function of the diffusion capacity as shown in Figure 5.
is the average capillary oxygen tension that depends on the hemoglobin saturation and satisfies the Hill equation. can be expressed in terms of the half saturation constant of hemoglobin, the Hill coefficient for capillaries h, and the extraction fraction of oxygen For a complete derivation please see Chap. 22, pp. 523–549, in Gjedde (2005) and Vafaee and Gjedde(2000, 2004), Gjedde et al. (2005, 2010). This relation yields a formula that expresses the average capillary oxygen tension as a function of the oxygen extraction fraction and the hemoglobin oxygen dissociation curve, assuming 100% oxygen saturation of arterial hemoglobin,
which means that the capillary oxygen tension can be calculated from the extraction fraction (Gjedde et al., 2005) and by applying standard human values for and h = 2.7. This formulation of was used in equation (11) to express the tissue oxygen tension directly from the CBF and CMRO2
where is the arterial concentration of oxygen, in this case assumed equal to the hemoglobin concentration for fully saturated arterial blood.
Results
The results consist of three different parts:
1) The result of fitting the historic data and the parameters for the human correction factor. Application to subgroup data previously published.
2) The results of applying the standard correction method to a new dataset of AD and HC subjects.
3) Evaluation of oxygen gradients in order to explain the CBF influence on tissue oxygenation in AD.
Correction for Reactivity to CO2
To derive the equation that corrects for the PaCO2 variability in both groups, we adopted arterial PaCO2 and CBF values from three human studies reported in the literature (Kety and Schmidt, 1946, 1948; Ramsay et al., 1993), as listed in Table 1. These PaCO2 values refer to the hyperventilation (H), normocapnic (C), and experimental (E) conditions, where specific gas mixtures enriched with 5–7% CO2 yielded both with absolute values in units of mmHg and values relative to a standard average of 39.5 mmHg, adopted from Ramsay et al. (1993). The CBF values for each situation (H, C, E) are given in units of mL/100 g/min and as fractions of normocapnic flow (H/C, C/C, and E/C).
From the PaCO2 relative to the mean of 39.5 and fractional CBF values (i.e., fC), we fitted equation (5) to the H/C, C/C, and E/C response ratios reported in the range of 0.67- to 2.55-fold the average normal CBF (Figure 1). The parameters of the fitted standard function function 5 were Hmin = 0.67, Hmax′ = 2.55, B = 2.34 × 10¹¹, and ka = − 6.7.
In order to illustrate how this parameterized correction can be applied to individual data-sets with very different CBF group average and different mean CO2 level, we fitted the historic gray and white matter data separately using the steps (I), (II), and (III) previously described. The subgroup set-points used are listed in Table 2.

Table 2. Normocapnic CBF measures (historic).
As shown in Figure 2 the predicted the CBF in response to PaCO2 fits each of the subgroups well even though the data magnitudes involved are very different. A similar approach was used for the average values of regional values reported in Ito et al. (2008), as shown in Figure 6.
CBF Variability in AD and Healthy Aging
Subjects had spontaneous PaCO2 values as high as 45.2 mmHg and as low as 27.1 mmHg. Only data within the normocapnic range of 35–45 mm Hg was used to determine the normocapnic set-points. The mean was 39.6 (SD 2.4) mmHg in the healthy subjects, and 38.3 (SD 0.9) mmHg in the AD patients. These group-wise normocapnic means were used to determine the CO2 response curves used for correction for CO2 by the steps (I), (II), and (III) described in the Methods.
CBF values for the AD and HC groups are reported in Table 3. Mean CBF was significantly lower in the AD group compared to the HC group, both with (p < 0.0005) and without (p < 0.005) correction for CO2. The variation, however, was only significantly reduced in the AD group when data had been corrected for CO2 differences. The PaCO2 corrections indicated that substantial variability of CBF stemmed from the PaCO2 effect in both groups. Figure 3 shows the corresponding values of PaCO2 and CBF for the two groups. The healthy controls had considerable additional variation of CBF, which was not related to differences of PaCO2. In the AD patients, however, the average CBF was substantially lower and the entire variation was commensurate with the response predicted by PaCO2.
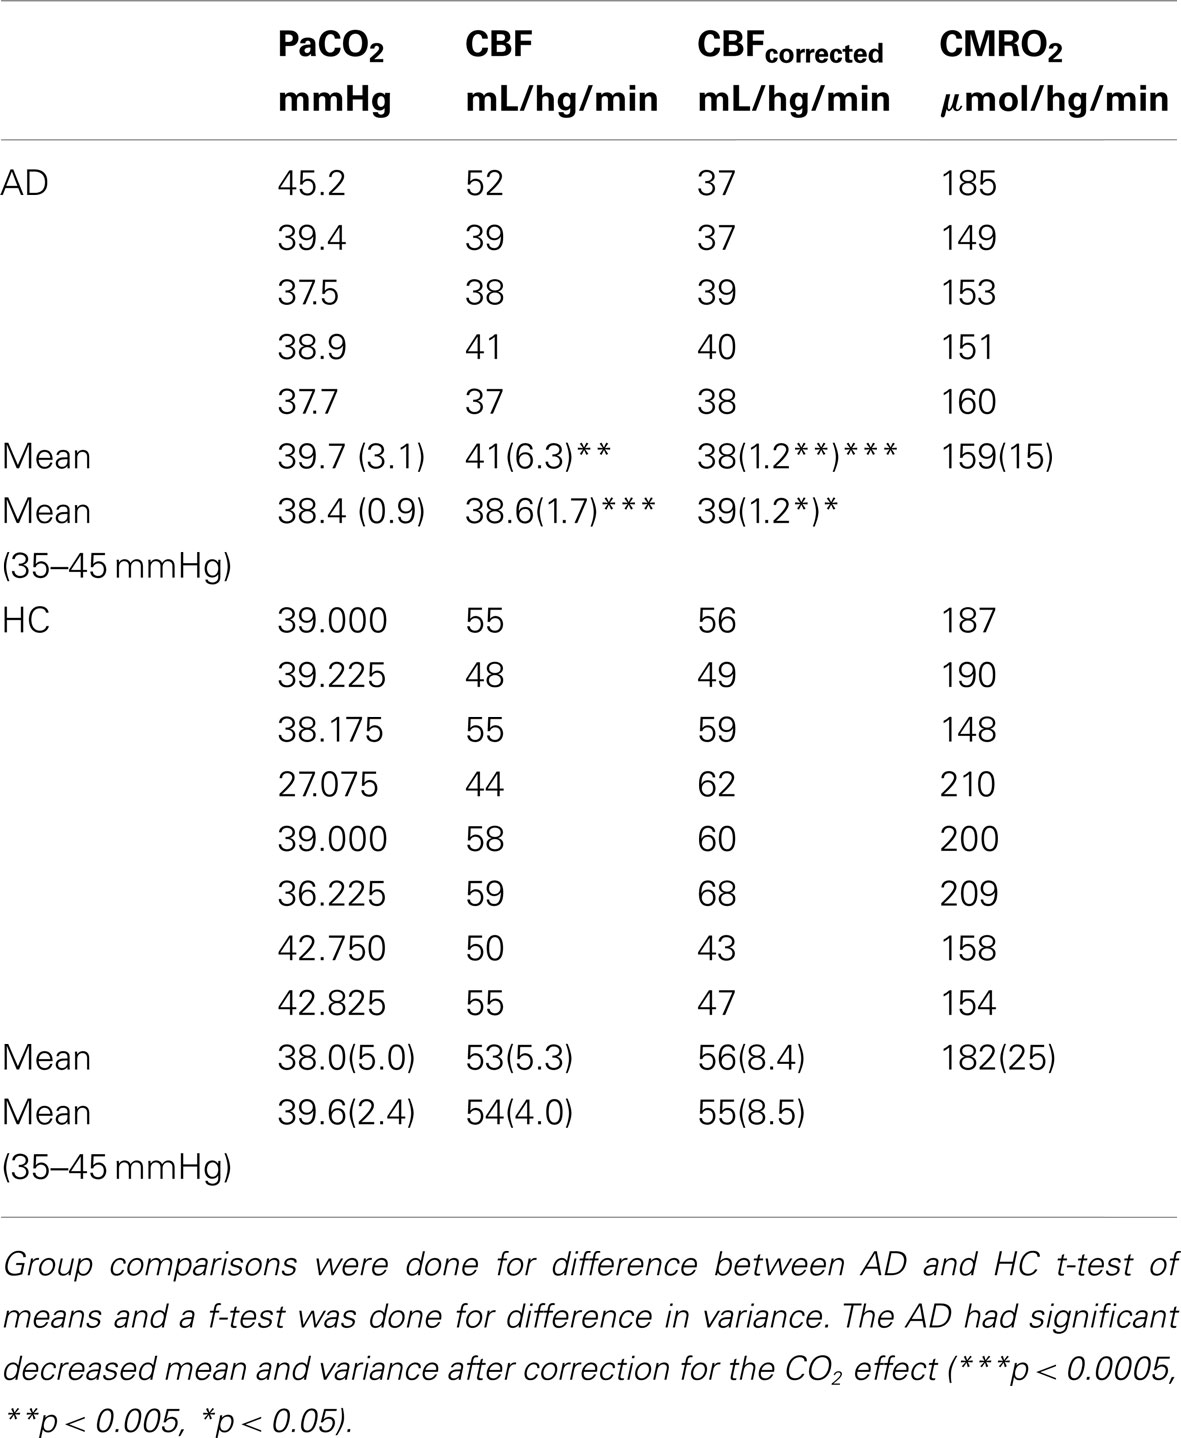
Table 3. CBF before and after correction for CO2.
CBF Variability and Tissue Oxygenation
To evaluate the extent to which the loss of additional variability of CBF in the AD patients is explained by uncoupling of CBF from oxygen metabolism, we determined the difference between the blood-brain clearances (K1) of water and oxygen (ΔK1), i.e., the component of CBF not devoted to the clearance of oxygen. As shown in Figure 4, for healthy controls, the association (non-primary) cortices of the frontal, occipital, parietal, and temporal lobes have the highest ΔK1 values, while K1 values in primary sensorimotor cortices were much closer to each other, also indicative of greater oxygen extraction. However, for the standard deviation among the HC subjects, rendered as a color-coded map shown in Figure 4, the higher variability of ΔK1 is evident in occipital, parietal, and temporal lobes compared to the frontal lobe.
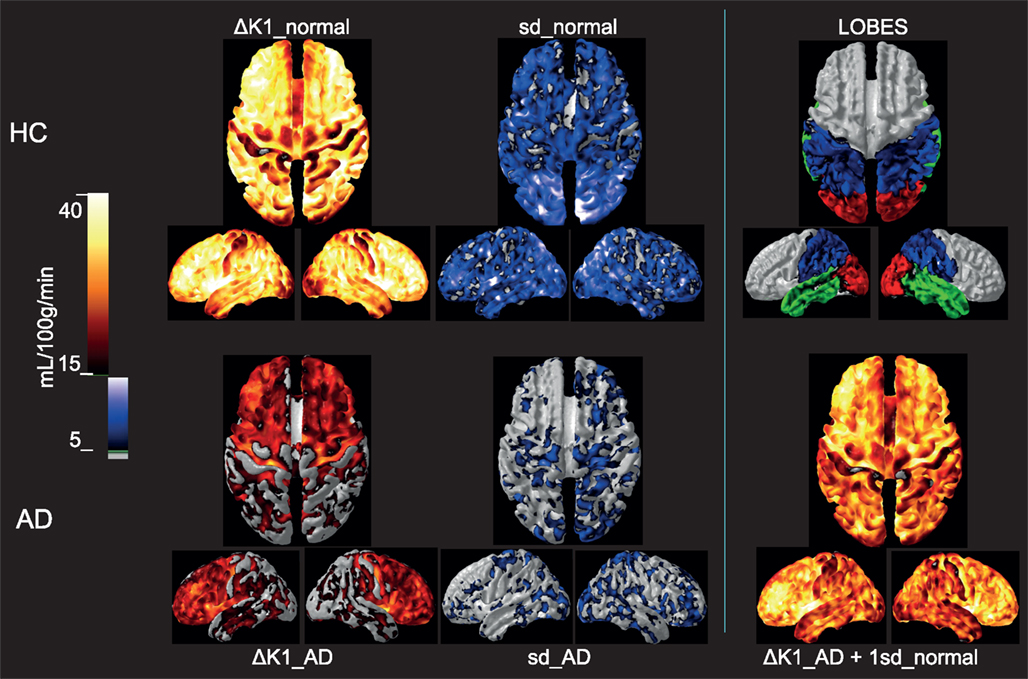
Figure 4. Upper row: Group mean ΔK1 and 1 SD images for the healthy control subjects as well as a lobe overview, Lower row: Group mean ΔK1 and 1 SD images for the Alzheimer’s patients. For comparison is added in the third column a calculated image of adding 1 SD of the healthy aged controls to the ΔK1 magnitude of the AD. Group mean ΔK1 images are colored using hot-metal color scale (values below 15 mL/100 g/min in gray). 1 SD images are shown in black, blue, and white color scale (values below 5 mL/100 g/min in gray). The lobe overview indicates the position of temporal lobes in green, occipital lobes in red and parietal lobes in blue. The standard deviations for AD patients were much lower than for the controls, and the group difference in ΔK1 possibly could be explained by the loss of variability in the patients. All images are mapped onto standard brain gray-white matter surfaces using FACE software from Aalborg University (Eskildsen and Østergaard, 2006).
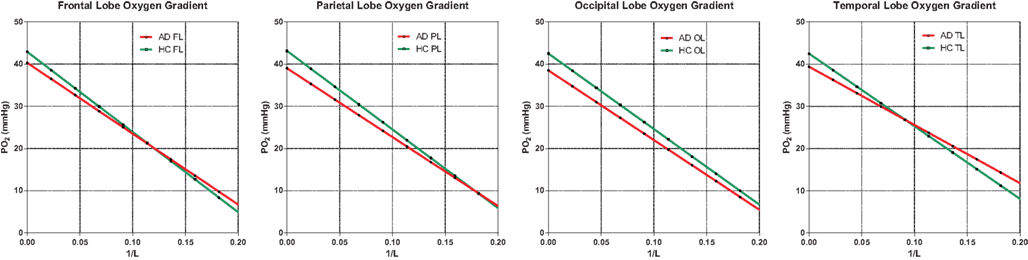
Figure 5. Oxygen gradient plotted through the tissue. AD gradients are not significantly below HC gradients, indicating no shortage of oxygen due to insufficient oxygen delivery. The assumption here is normal or high capillary density, translated into diffusion capacity (L), as generally observed in the literature. Capillary density would have to be significantly reduced to suggest hypoxic conditions in AD. The capillary oxygen tension is the oxygen tension for 1/L ; 0.0.
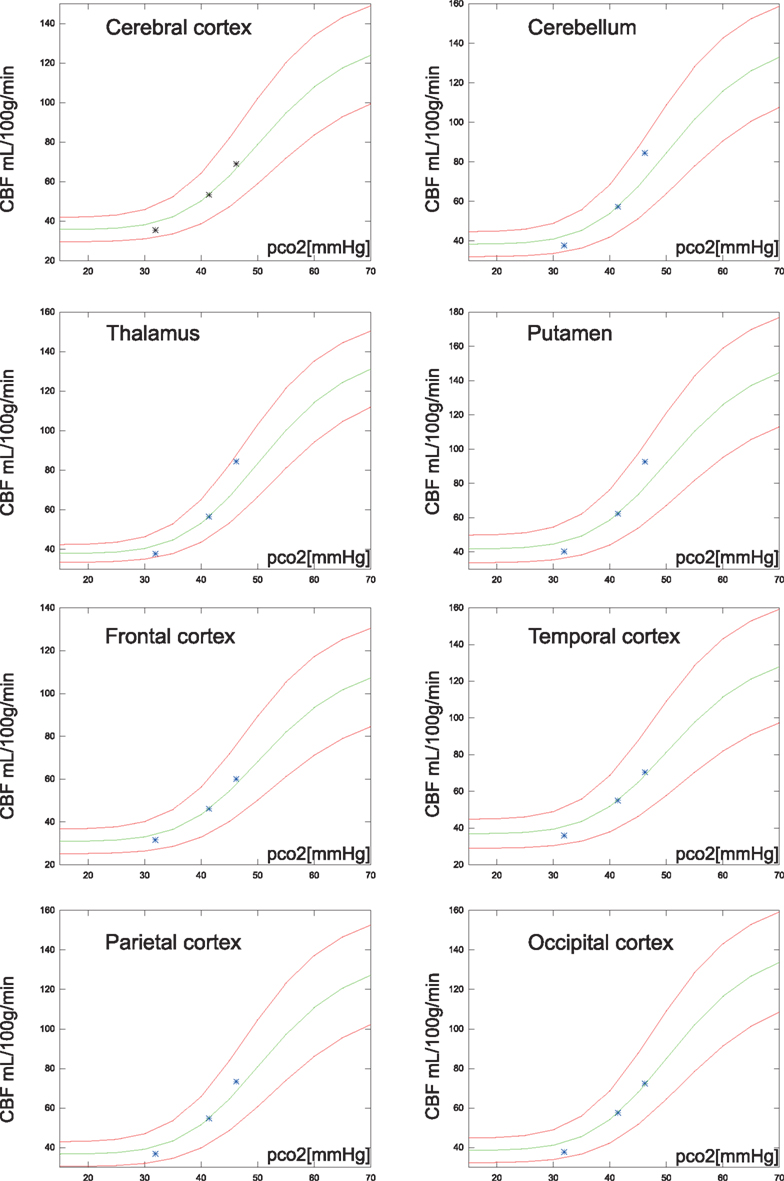
Figure 6. Regional average CBF values (N = 20) of the hypocapnia, normocapnia, and hypercapnia conditions. The green line is the estimated CBF based on application of the correction factor to the normocapnic values of PaCO2 and CBF. The red lines are estimates of CBF response, 95% confidence, i.e., 1.96 SD from normocapnic values of PaCO2 and CBF.
Average capillary oxygen tensions, calculated from equation (12), declined significantly in the AD patients compared to the age-matched HC subjects, as shown in Figure 5. In both groups, the decline of oxygen in the tissue depended on the degree of non-linear coupling of flow to oxygen consumption, and the resulting gradients of oxygen tension determined from equation (13) did not differ significantly between the groups and thus did not indicate deficient oxygen delivery in AD.
Discussion
General CO2 Correction Method
The method presented here is a practical approach to the correction of CBF data for changes of PaCO2 that relates individual measures to the normocapnic mean for an individual or a group. The correction factor is derived from historical data obtained from a broad spectrum of studies. The correction is independent of the absolute flow rates and thus applicable to both grey and white matter regions of the brain.
The range of PaCO2 values is established by intra-individual responses to the tomography such as anxiety-induced hyperventilation, and inter-individual and group variations of PaCO2, and the present approach accounts for all of these changes. In studies analyzed by general linear model (GLM) statistics, PaCO2 variation can be factored out as a covariate, but the procedure considers only the influence on the statistics, not the magnitude of the corrected flow. The GLM model is not appropriate for modeling non-linear relationships. Another approach to PaCO2 correction is a simple division of the CBF measure with the PaCO2 values (Ashwal et al., 1991), but the procedure yields a linear relationship and therefore does not account for the differences of the CBF/mmHg ratio in hypocapnia compared to hypercapnia. The result is consistent with hypocapnic reactivity but underestimates the hypercapnic response. Claassen et al. (2007) also applied a logistic model somewhat similar to the one introduced here. However it was applied to CBFV data and not CBF data at steady state, but they showed a good agreement with the logistic shape even at very high time resolution.
Although the methods of measuring and correcting for the hemodynamic response to changes of the arterial CO2 tension vary somewhat, the results of separate studies in man agree to a considerable extent when interpreted relative to normocapnic values, as demonstrated in Figure 1. In this figure, data extracted from three different human studies are represented. Data from references Kety and Schmidt (1946) and Kety and Schmidt (1948) include measures of healthy young men in whom control values of CBF were determined with the nitrous oxide method of Kety and Schmidt at normal ambient conditions and normal breathing. The effects of passive and active hyperventilation provided hypocapnic values for the same subjects. For hypercapnia, the subjects were exposed to an atmosphere of 21% oxygen with 5 or 7% added CO2. Intra-subject CBF measures with varying CO2 tensions were also reported by Ramsay et al. (1993). Because they also used PET to determine CBF, we adopted their mean normocapnic PaCO2 of 39.5 mmHg as the standard for which the correction factor is unity in the present PET study.
We modeled the data by the function originally introduced by Reivich (1964), which included theoretical values for maximum vasodilatation and -constriction. Although these values are uncertain in man, the functional relationship obtained with the parameter values proposed here fits the data well.
In primates, Reivich (1964) found the maximum response to be 42% of the average normal CBF of 49.3 mL/100 g/min for vasoconstriction and 231% of the average normal CBF for vasodilatation, corresponding to CO2 tensions of 15 mmHg (2 kPa) and 150 mm Hg (20 kPa), respectively.
In contrast, in man, measured extremes of PaCO2 are closer to 20 and 60 mmHg (Kety and Schmidt, 1946, 1948; Ramsay et al., 1993), corresponding to a measured range of response of 44–255% of the average normal CBF value. As the response in rhesus monkeys appears to be less than in humans, a CO2 tension of 60 mmHg yields a 146% increase of CBF in the monkeys but a 218% increase in humans, where the same increase is reached at 48 mmHg. In primates, the sensitivity to CO2 fits a logistic exponential relationship between carbon dioxide tensions and blood flow, and we chose to modify this relationship with different parameters descriptive of the human situation as the overall functional shape for humans.
Regional variation
The relationship among baseline CBF values and the regional vascular PaCO2 responses recently was revisited by Ito et al. (2008). Instead of individual numbers, the authors reported regional average CBF values for 20 subjects at hypo-, normo-, and hypercapnia. The correction proposed here is in good agreement with cortex values, but cerebellum, thalamus, and putamen had slightly higher vascular responses than those estimated from the present correction factor as shown in Figure 6.
Correction for AD Patients and Control Subjects
In the HC group estimates of the vasomotor response to CO2, the normal flow variation in the 35- to 45-mmHg PaCO2 range is variable and not explained by the predicted response to CO2. This discrepancy reflects the number of factors suspected of influencing CBF. In the AD group, however, we found very little variation in the normocapnic range and the variability of CBF was closely coupled to the predicted response. The markedly decreased variability in AD is consistent with a blunting of the general neurovascular control unit variability, with largely conserved CO2 regulation.
In a recent MRI study of familiar frontotemporal dementia (FTD-3) prior to symptom onset, the authors found a significant decrease of CBF in temporal, occipital, and parietal regions of familial carriers of the CHMP2B mutation, compared to family members not carrying the mutation. However, the reduction was observed only with spin echo sequences sensitive to deoxyhemoglobin in the capillary bed, suggesting that capillaries rather than arterioles are the mediators of the decrease, as befits a functional decline (Lunau et al., 2012). The carriers of the mutation had a marked loss of CBF variability in the same regions (temporal, occipital, and parietal regions) found to have declines of the ΔK1 estimates in the present study. Although the dementia of that study is different from the AD studied here, the observation is consistent with the claim that these regions are particularly important and vulnerable to the development of early signs of dementia.
Is ΔK1 important to glucose delivery?
As averaged for each group, the variability of the ΔK1 measure is related to the BOLD signal obtained with functional MRI, although it has lower time resolution. For the ΔK1 shown in Figure 4, much of the variation appears to be lost in the AD patients, as the ΔK1 magnitude is decreased overall but especially in the occipital, parietal, and temporal lobes. To illustrate how the loss of variability of the HC group coincides with the loss of ΔK1 for the AD group, we show the result of adding 1 SD of the normal variation to the low measure of the AD patients. The calculated AD image strikingly fits the distribution of the ΔK1 estimates of the age-matched HC controls. Although this has no direct physiological meaning it illustrates that the difference between AD and HC subjects may be correlated to a loss of CBF variability.
We speculate that this loss may by some means be related to the loss of ability or necessity of the vasculature to adjust the CBF to functional demands, especially in the posterior and temporal regions of the brain.
An important question is whether the lack of variability expressed as the ΔK1 estimate is consistent with an adequate supply of oxygen, or adequate transport of substrate such as glucose.
As for glucose, recent reports (Vaishnavi et al., 2010; Vlassenko et al., 2010) suggest that aerobic glycolysis in healthy young adults is spatially correlated with the depositions of amyloid-β in AD patients. The authors suggest the existence of a link between high rates of aerobic glycolysis in young adults and the later development of AD pathology. In the present study, the values of ΔK1 may suggest that CBF may normally be uncoupled from metabolism in the areas with higher aerobic glycolysis indices (Vaishnavi et al., 2010; Vlassenko et al., 2010) in the age-matched HC group. In the AD group, however, the loss of the ΔK1 reserve clearly is more pronounced in the posterior and temporal parts of the brain, as previously described.
Amyloid beta (Aβ) deposition has been implicated in decreased glucose transporter-1 levels and hippocampal atrophy in brains of aged APP/PS1 mice (Hooijmans et al., 2007) at the capillary level without decreased capillary density. The mechanism could be an interplay between the upstream Aβ oligomers and neurotrophic factors such as proNGF/NGF (Schliebs and Arendt, 2011), as neurotrophic factors also have been implicated in the reduction of GLUT-1 carrier density in the endothelial cells (Farkas and Luiten, 2001). With the exception of putamen and cerebellum, hexose transporters regionally were found to be about half as numerous in post mortem AD brains as in control brains (Kalaria and Harik, 1989).
Another indicator that the decrease of ΔK1 is consistent with a loss of aerobic glycolytic capability, is the reported observations that the absolute number of mitochondria in endothelial cells is conserved in AD, although the density per unit volume decreased due to endothelial basal membrane swelling or mitochondrial shrinkage, both implying impaired blood-brain barrier (BBB) capacity (Mancardi et al., 1985; Stewart et al., 1992) for glucose transport but not for the free diffusion of O2. We note here that microvascular basal membrane pathology in AD with the accumulation of laminin and heparan sulfate proteoglycans (HSPGs) in some studies has been linked to the perivascular astrocytes (Farkas and Luiten, 2001) which are more glucose dependent that neurons (Bolaños et al., 2010).
Is ΔK1 important to oxygen delivery?
For oxygen, the absent decline of capillary density in AD (Richard et al., 2010) allowed us to compare predicted oxygen gradients in the groups of AD patients and age-matched HC subjects and to show that the steady state gradients were nearly identical (Figure 5), except for the slightly lower capillary oxygen tensions associated with the higher oxygen extraction fractions of the AD patients. The lower oxygen tensions reflect the non-linearity of the relation between blood flow and oxygen consumption (and hence also the BOLD signal and the inter-individual ΔK1) that generally follows the ratio of oxy- to deoxyhemoglobin and therefore also elevates the oxygen extraction fraction when oxygen consumption declines, or lowers the extraction when oxygen consumption increases relative to blood flow during functional activation. Recent findings are consistent with the claim that the resulting O2 overshoot during activation prevents a sustained drop of oxygenation at tissue locations that are remote from the capillaries (Vafaee et al., 1999; Vafaee and Gjedde, 2000; Gjedde et al., 2005; Devor et al., 2011). The equivalent gradients of oxygen in the AD and HC subjects indicate that oxygen delivery at steady state is adequate for the attenuated functional excursions of brains with Alzheimer’s disease.
Limitations
The results could be influenced by changes in blood pressure and hemoglobin oxygenation (Rasmussen et al., 2007; van Beek et al., 2012). Also direct effects of CO2 on brain functional variability itself are possible (Xu et al., 2011).
Conflict of Interest Statement
The authors declare that the research was conducted in the absence of any commercial or financial relationships that could be construed as a potential conflict of interest.
Footnote
- ^A matlab® subroutine and a CBF image scaling script for the MINC format is freely distributed by email request to the corresponding author.
References
Aanerud, J., Borghammer, P., Chakravarty, M. M., Vang, K., Rodell, A. B., Jónsdottir, K. Y., Møller, A., Ashkanian, M., Vafaee, M. S., Iversen, P., Johannsen, P., and Gjedde, A. (2012). Brain energy metabolism and blood flow differences in healthy aging. J. Cereb. Blood Flow Metab. [Epub ahead of print]. doi:10.1038/jcbfm.2012.18
Ashwal, S., Perkin, R. M., Thompson, J. R., Tomasi, L. G., van Stralen, D., and Schneider, S. (1991). CBF and CBF/Pco2 reactivity in childhood strangulation. Pediatr. Neurol. 7, 369–374.
Berne, R. M., Winn, H. R., and Rubio, R. (1981). The local regulation of cerebral blood flow. Prog. Cardiovasc. Dis. 24, 243–260.
Blomqvist, G. (1984). On the construction of functional maps in position emission tomography. J. Cereb. Blood Flow Metab. 4, 629–632.
Bolaños, J. P., Almeida, A., and Moncada, S. (2010). Glycolysis: a bioenergetic or a survival pathway? Trends Biochem. Sci. 35, 145–149.
Chen, Y., Wolk, D. A., Reddin, J. S., Korczykowski, M., Martinez, P. M., Musiek, E. S., Newberg, A. B., Julin, P., Arnold, S. E., Greenberg, J. H., and Detre, J. A. (2011). Voxel-level comparison of arterial spin-labeled perfusion MRI and FDG-PET in Alzheimer disease. Neurology 77, 1977–1985.
Claassen, J. A., Diaz-Arrastia, R., Martin-Cook, K., Levine, B. D., and Zhang, R. (2009). Altered cerebral hemodynamics in early Alzheimer disease: a pilot study using transcranial Doppler. J. Alzheimers Dis. 17, 621–629.
Claassen, J. A., and Zhang, R. (2011). Cerebral autoregulation in Alzheimer’s disease. J. Cereb. Blood Flow Metab. 31, 1572–1577. [J. Appl. Physiol. 102, 870–877].
Claassen, J. A., Zhang, R., Fu, Q., Witkowski, S., and Levine, B. D. (2007). Transcranial Doppler estimation of cerebral blood flow and cerebrovascular conductance during modified rebreathing. J. Appl. Physiol. 102, 870–877.
Deane, R., Du Yan, S., Submamaryan, R. K., LaRue, B., Jovanovic, S., Hogg, E., Welch, D., Manness, L., Lin, C., Yu, J., Zhu, H., Ghiso, J., Frangione, B., Stern, A., Schmidt, A. M., Armstrong, D. L., Arnold, B., Liliensiek, B., Nawroth, P., Hofman, F., Kindy, M., Stern, D., and Zlokovic, B. (2003). RAGE mediates amyloid-peptide transport across the blood-brain barrier and accumulation in brain. Nat. Med. 9, 907–913.
Devor, A., Sakadzic, S., Saisan, P. A., Yaseen, M. A., Roussakis, E., Srinivasan, V. J., Vinogradov, S. A., Rosen, B. R., Buxton, R. B., Dale, A. M., and Boas, D. A. (2011). “Overshoot” of O2 is required to maintain baseline tissue oxygenation at locations distal to blood vessels. J. Neurosci. 31, 13676–13681.
Eskildsen, S. F., and Østergaard, L. R. (2006). Active surface approach for extraction of the human cerebral cortex from MRI, MICCAI 2006. Lect. Notes Comput. Sci. 4191, 823–830.
Farkas, E., and Luiten, P. G. (2001). Cerebral microvascular pathology in aging and Alzheimer’s disease. Prog. Neurobiol. 64, 575–611; 592.
Gjedde, A. (2005). “Blood-brain transfer and metabolism of oxygen,” in Blood-Brain Barriers: From Ontogeny to Artificial Interfaces, Vol. 2, Chap. 22, eds R. S. Dermietzel, D. C. Spray and M. Nedergaard (Hoboken: John Wiley and Sons, Ltd.), 523–549.
Gjedde, A., Johannsen, P., Cold, G. E., and Ostergaard, L. (2005). Cerebral metabolic response to low blood flow: possible role of cytochrome oxidase inhibition. J. Cereb. Blood Flow Metab. 25, 1183–1196.
Gjedde, A., Keiding, S., Vilstrup, H., and Iversen, P. (2010). No oxygen delivery limitation in hepatic encephalopathy. Metab. Brain Dis. 25, 57–63.
Gjedde, A., Marrett, S., and Vafaee, M. (2002). Oxidative and nonoxidative metabolism of excited neurons and astrocytes. J. Cereb. Blood Flow Metab. 22, 1–14.
Grammas, P., Martinez, J., and Miller, B. (2011). Cerebral microvascular endothelium and the pathogenesis of neurodegenerative diseases. Expert Rev. Mol. Med. 13, e19.
Hooijmans, C. R., Graven, C., Dederen, P. J., Tanila, H., van Groen, T., and Kiliaan, A. J. (2007). Amyloid beta deposition is related to decreased glucose transporter-1 levels and hippocampal atrophy in brains of aged APP/PS1 mice. Brain Res. 1181, 93–103.
Iliff, J. J., D’Ambrosio, R., Ngai, A. C., and Winn, H. R. (2003). Adenosine receptors mediate glutamate-evoked arteriolar dilation in the rat cerebral cortex. Am. J. Physiol. Heart Circ. Physiol. 284, H1631–H1637.
Ito, H., Kanno, I., Ibaraki, M., Suhara, T., and Miura, S. (2008). Relationship between baseline cerebral blood flow and vascular responses to changes in PaCO2 measured by positron emission tomography in humans: implication of inter-individual variations of cerebral vascular tone. Acta Physiol. (Oxf.) 193, 325–330.
Ito, H., Kanno, I., Kato, C., Sasaki, T., Ishii, K., Ouchi, Y., Iida, A., Okazawa, H., Hayashida, K., Tsuyuguchi, N., Ishii, K., Kuwabara, Y., and Senda, M. (2004). Database of normal human cerebral blood flow, cerebral blood volume, cerebral oxygen extraction fraction and cerebral metabolic rate of oxygen measured by positron emission tomography with 15O-labelled carbon dioxide or water, carbon monoxide and oxygen: a multicentre study in Japan. Eur. J. Nucl. Med. Mol. Imaging 31, 635–643.
Jagust, W. J., Eberling, J. L., Reed, B. R., Mathis, C. A., and Budinger, T. F. (1997). Clinical studies of cerebral blood flow in Alzheimer’s disease. Ann. N. Y. Acad. Sci. 826, 254–262.
Kalaria, R. N., and Harik, S. I. (1989). Reduced glucose transporter at the blood-brain barrier and in cerebral cortex in Alzheimer disease. J. Neurochem. 53, 1083–1088.
Kety, S. S., and Schmidt, C. F. (1946). The effects of active and passive hyperventilation on cerebral blood flow, cerebral oxygen consumption, cardiac output, and blood pressure of normal young men. J. Clin. Invest. 25, 107–119.
Kety, S. S., and Schmidt, C. F. (1948). The effects of altered arterial tensions of carbon dioxide and oxygen on cerebral blood flow and cerebral oxygen consumption of normal young men. J. Clin. Invest. 27, 484–492.
Lauritzen, M. (1984). Long-lasting reduction of cortical blood flow of the brain after spreading depression with preserved autoregulation and impaired CO2 response. J. Cereb. Blood Flow Metab. 4, 546–554.
Lawson, G., and Hanson, R. J. (1974). Solving Least Squares Problems. Englewood Cliffs: Prentice Hall Inc.
Lolk, A., Nielsen, H., Andersen, K., Andersen, J., and Kragh-Sørensen, P. (2000). CAMCOG as a screening instrument for dementia: the Odense study. Cambridge cognitive examination. Acta Psychiatr. Scand. 102, 331–335.
Lunau, L., Mouridsen, K., Rodell, A., Østergaard, L., Nielsen, J., Isaacs, A., and Johannsen, P. (2012). Presymptomatic cerebral blood flow changes in CHMP2B mutation carriers of familial frontotemporal dementia (FTD-3), measured with MRI. BMJ Open. doi:10.1136/bmjopen-2011-000368
Mancardi, G. L., Tabaton, M., and Liwnicz, B. H. (1985). Endothelial mitochondrial content of cerebral cortical capillaries in Alzheimer’s disease. An ultrastructural quantitative study. Eur. Neurol. 24, 49–52.
Nagata, K., Kondoh, Y., Atchison, R., Sato, M., Satoh, Y., Watahiki, Y., Hirata, Y., and Yokoyama, E. (2000). Vascular and metabolic reserve in Alzheimer’s disease. Neurobiol. Aging 21, 301–307.
Nicolakakis, N., and Hamel, E. (2011). Neurovascular function in Alzheimer’s disease patients and experimental models. J. Cereb. Blood Flow Metab. 31, 1354–1370.
Niwa, K., Kazama, K., Younkin, L., Younkin, S. G., Carlson, G. A., and Iadecola, C. (2002). Cerebrovascular autoregulation is profoundly impaired in mice overexpressing amyloid precursor protein. Am. J. Physiol. Heart Circ. Physiol. 283, H315–H323.
Ohta, S., Meyer, E., Fujita, H., Reutens, D. C., Evans, A., and Gjedde, A. (1996). Cerebral [15O]water clearance in humans determined by PET: I. Theory and normal values. J. Cereb. Blood Flow Metab. 16, 765–780.
Ohta, S., Meyer, E., Thompson, C. J., and Gjedde, A. (1992). Oxygen consumption of the living human brain measured after a single inhalation of positron emitting oxygen. J. Cereb. Blood Flow Metab. 12, 179–192.
Panerai, R. B., Dawson, S. L., and Potter, J. F. (1999). Linear and nonlinear analysis of human dynamic cerebral autoregulation. Am. J. Physiol. 277(3 Pt 2), H1089–H1099.
Peterson, E. C., Wang, Z., and Britz, G. (2011). Regulation of cerebral blood flow. Int. J. Vasc. Med. 2011, 8.
Ramsay, S. C., Murphy, K., Shea, S. A., Friston, K. J., Lammertsma, A. A., Clark, J. C., Adams, L., Guz, A., and Frackowiak, R. S. (1993). Changes in global cerebral blood flow in humans: effect on regional cerebral blood flow during a neural activation task. J. Physiol. (Lond.) 471, 521–534.
Rasmussen, P., Dawson, E. A., Nybo, L., van Lieshout, J. J., Secher, N. H., and Gjedde, A. (2007). Capillary-oxygenation-level-dependent near-infrared spectrometry in frontal lobe of humans. J. Cereb. Blood Flow Metab. 27, 1082–1093.
Richard, E., van Gool, W. A., Hoozemans, J. J., van Haastert, E. S., Eikelenboom, P., Rozemuller, A. J., and van de Berg, W. D. (2010). Morphometric changes in the cortical microvascular network in Alzheimer’s disease. J. Alzheimers Dis. 22, 811–818.
Schliebs, R., and Arendt, T. (2011). The cholinergic system in aging and neuronal degeneration. Behav. Brain Res. 221, 555–563.
Schmidt, C. F. (1928). The influence of cerebral blood flow on respiration. I. The respiratory responses to change in cerebral blood flow. II. The gaseous metabolism of the brain. III. The interplay of factors concerned in the regulation of respiration. Am. J. Physiol. 84, 202, 223, 242.
Stewart, P. A., Hayakawa, K., Akers, M. A., and Vinters, H. V. (1992). A morphometric study of the blood-brain barrier in Alzheimer’s disease. Lab. Invest. 67, 734–742.
Vafaee, M., Meyer, E., Marrett, S., Paus, T., Evans, A. C., and Gjedde, A. (1999). Frequency-dependent changes in cerebral metabolic rate of oxygen during activation of human visual cortex. J. Cereb. Blood Flow Metab. 19, 272–277.
Vafaee, M. S., and Gjedde, A. (2000). Model of blood-brain transfer of oxygen explains nonlinear flow-metabolism coupling during stimulation of visual cortex. J. Cereb. Blood Flow Metab. 20, 747–754.
Vafaee, M. S., and Gjedde, A. (2004). Spatially dissociated flow-metabolism coupling in brain activation. Neuroimage 21, 507–515.
Vaishnavi, S. N., Vlassenko, A. G., Rundle, M. M., Snyder, A. Z., Mintun, M. A., and Raichle, M. E. (2010). Regional aerobic glycolysis in the human brain. Proc. Natl. Acad. Sci. U.S.A. 107, 17757–17762.
van Beek, A. H., Lagro, J., Olde-Rikkert, M. G., Zhang, R., and Claassen, J. A. R. (2012). Oscillations in cerebral blood flow and cortical oxygenation in Alzheimer’s disease Neurobiol. Aging 33, 428.e21–428.e31.
Varrone, A., Sjöholm, N., Eriksson, L., Gulyás, B., Halldin, C., and Farde, L. (2009). Advancement in PET quantification using 3D-OP-OSEM point spread function reconstruction with the HRRT. Eur. J. Nucl. Med. Mol. Imaging 36, 1639–1650.
Vlassenko, A. G., Vaishnavi, S. N., Couture, L., Sacco, D., Shannon, B. J., Mach, R. H., Morris, J. C., Raichle, M. E., and Mintun, M. A. (2010). Spatial correlation between brain aerobic glycolysis and amyloid-b (Ab) deposition. Proc. Natl. Acad. Sci. U.S.A. 107, 17763–17767.
Xu, F., Uh, J., Brier, M. R., Hart, J. Jr., Yezhuvath, U. S., Gu, H., Yang, Y., and Lu, H. (2011). The influence of carbon dioxide on brain activity and metabolism in conscious humans. J. Cereb. Blood Flow Metab. 31, 58–67.
Keywords: Alzheimer’s disease, brain energy metabolism, cerebral blood flow, cerebral metabolic rate for oxygen, cerebral vasoreactivity
Citation: Rodell AB, Aanerud J, Braendgaard H and Gjedde A (2012) Low residual CBF variability in Alzheimer’s disease after correction for CO2 effect. Front. Neuroenerg. 4:8. doi: 10.3389/fnene.2012.00008
Received: 12 March 2012; Accepted: 04 June 2012;
Published online: 05 July 2012.
Edited by:
Bruno Weber, University of Zurich, SwitzerlandReviewed by:
Alfred Buck, University of Zurich, SwitzerlandRichard Buxton, University of California, USA
Copyright: © 2012 Rodell, Aanerud, Braendgaard and Gjedde. This is an open-access article distributed under the terms of the Creative Commons Attribution License, which permits use, distribution and reproduction in other forums, provided the original authors and source are credited and subject to any copyright notices concerning any third-party graphics etc.
*Correspondence: Anders Bertil Rodell, Department of Nuclear Medicine and Positron Emission Tomography Center, Aarhus University Hospital, Denmark (Research), Norrebrogade 44, Aarhus, Denmark. e-mail:YW5kZXJzLnJvZGVsbEBnbWFpbC5jb20=