
95% of researchers rate our articles as excellent or good
Learn more about the work of our research integrity team to safeguard the quality of each article we publish.
Find out more
ORIGINAL RESEARCH article
Front. Neuroenergetics , 09 June 2010
Volume 2 - 2010 | https://doi.org/10.3389/fnene.2010.00007
Part of this article's content has been mentioned in:
The Selfish Brain: Stress and Eating Behavior
 Britta Hitze
1
 Christian Hubold
1
 Regina van Dyken
2
 Kristin Schlichting
1
 Hendrik Lehnert
1
 Sonja Entringer
3
 Achim Peters
1*
During acute mental stress, the energy supply to the human brain increases by 12%. To determine how the brain controls this demand for energy, 40 healthy young men participated in two sessions (stress induced by the Trier Social Stress Test and non-stress intervention). Subjects were randomly assigned to four different experimental groups according to the energy provided during or after stress intervention (rich buffet, meager salad, dextrose-infusion and lactate-infusion). Blood samples were frequently taken and subjects rated their autonomic and neuroglycopenic symptoms by standard questionnaires. We found that stress increased carbohydrate intake from a rich buffet by 34 g (from 149 ± 13 g in the non-stress session to 183 ± 16 g in the stress session; P < 0.05). While these stress-extra carbohydrates increased blood glucose concentrations, they did not increase serum insulin concentrations. The ability to suppress insulin secretion was found to be linked to the sympatho-adrenal stress-response. Social stress increased concentrations of epinephrine 72% (18.3 ± 1.3 vs. 31.5 ± 5.8 pg/ml; P < 0.05), norepinephrine 148% (242.9 ± 22.9 vs. 601.1 ± 76.2 pg/ml; P < 0.01), ACTH 184% (14.0 ± 1.3 vs. 39.8 ± 7.7 pmol/l; P < 0.05), cortisol 131% (5.4 ± 0.5 vs. 12.4 ± 1.3 μg/dl; P < 0.01) and autonomic symptoms 137% (0.7 ± 0.3 vs. 1.7 ± 0.6; P < 0.05). Exogenous energy supply (regardless of its character, i.e., rich buffet or energy infusions) was shown to counteract a neuroglycopenic state that developed during stress. Exogenous energy did not dampen the sympatho-adrenal stress-responses. We conclude that the brain under stressful conditions demands for energy from the body by using a mechanism, which we refer to as “cerebral insulin suppression” and in so doing it can satisfy its excessive needs.
The brain occupies a primary position in energy metabolism (Peters et al., 2004 ). First evidence that the brain behaves in a “selfish” manner arose from data obtained by the pathologist Marie Krieger in 1921. She showed that the human brain mass is preserved during inanition, while all the other organs of the body such as heart, liver, kidneys, and pancreas lose about 40% of their mass (Krieger, 1921 ). Using modern state-of-the-art techniques, this observation has been confirmed both in humans and animals in adult and fetal life (Goodman et al., 1984 ; Gong et al., 1998 ; Miller et al., 2002 ; Kind et al., 2005 ; Muhlau et al., 2007 ; Bosy-Westphal et al., 2009 ). As early as 1889, Luigi Luciani interpreted his observations in fasting humans by speculating that the brain must actively demand energy from the body in order to maintain cerebral energy homeostasis (Luciani, 1889 ).
During acute mild mental stress, the energy supply of the human brain increases by 12% (Madsen et al., 1995 ). Such an instantaneous augmentation also suggests the existence of an underlying cerebral demand mechanism. Similarly, brain glucose consumption is augmented during focal physiologic neural activity in humans (Fox et al., 1988 ). Both during mental stress and increased focal neural activity, the concomitant rise in brain oxygen consumption is far less pronounced suggesting that the extra glucose taken up is not immediately oxidized (Fox et al., 1988 ; Madsen et al., 1995 ). Yet, animal experiments studying brain metabolism during cerebral activation imply that intermediary metabolic products accumulate which are subsequently oxidized (Madsen et al., 1999 ). On this background, it remains unclear whether the energetic need of the brain actually increases during stress.
Need, supply, and demand are terms used in the field of economics and logistics. We applied supply-chain principles and laws to further characterize the central and peripheral energy metabolism (Peters and Langemann, 2009 ). The supply-chain of the brain – with the central nervous system as the final consumer – describes the energy fluxes from the remote environment to the near environment, through the body, towards the brain. The supply-chain is branched, that means, it is possible to store energy in the side buffers like fat tissue, muscle, and liver. It is a general principle in economic supply-chains that the flux is determined by the supplier (push-component) and by the receiver (pull-component). In other words, the fluxes are regulated by supply and demand. In this connection, the “brain-pull” functions to demand energy from the body. We demonstrated data-based support of the hypothesis, which states that under conditions of food deprivation an efficient “brain-pull” mechanism is indispensable for the continuance of the brain’s high energy level.
How can the brain demand energy from the body? There are numerous human and animal experiments studying different details with respect to neuroendocrine mechanisms which qualify as brain-pull mechanisms. The brain can activate its stress systems, that is, the sympathetic nervous system (SNS) and the hypothalamus pituitary adrenal (HPA) axis. Once the stress networks in the upper brain stem including the ventromedial hypothalamus (VMH) and the paraventricular nucleus (PVN) are activated, energy – particularly glucose – is allocated to the brain. With SNS activation, insulin secretion from the beta cells is suppressed (Ahren, 2000 ) and the insulin-dependent glucose uptake via GLUT4 into the body periphery becomes limited. Here, we refer to this brain-pull mechanism as “cerebral insulin suppression (CIS)”. As a consequence of CIS, glucose is available via insulin-independent GLUT1-transport across the blood–brain barrier. However, there is no human experiment yet, which shows how cerebral need, supply, and demand are tuned, and whether CIS is actually working as a “brain-pull” mechanism.
A cerebral supply/need mismatch is known to occur in patients with Addison disease. This mismatch arises by reason of an altered cerebral demand. Addison patients, who display a disintegration of the entire stress system, have not only been shown to lack sympatho-adrenal activity, but also to suffer from neuroglycopenic symptoms (Klement et al., 2010 ) (“neuroglycopenia” refers to a shortage of energy [glucose] in the brain). This deficit in cerebral energy could partly be alleviated by the intake of high-calorie food (Klement et al., 2010 ). These findings provide evidence that an adequate demand, that is, an efficient “brain-pull”, is indispensible for the maintenance of cerebral energy homeostasis.
Another cerebral supply/need mismatch is known to occur during hypoglycemia. That mismatch arises by reason of an altered cerebral supply. When glucose is deficient in the blood circulation (e.g., due to insulin over dosage in patients with diabetes mellitus), the brain supply is too small to match the brain’s need. A neuroglycopenic state develops indicating a deficit in cerebral energy. The brain activates the SNS/HPA system to demand energy from the body. The subject experiences autonomic symptoms (heart beating, tremor, cold hands, sweating, excitement). Thus, functional “brain-pull” can be perceived by the individual. Ingestive behavior functions as a “body-pull” to replenish body stores and blood glucose. During hypoglycemia, the subject can experience the signs of ingestive “body-pull” by the feeling of “ravenous” hunger.
Is stress also characterized by a cerebral supply/need mismatch? If so, we expect the development of a neuroglycopenic state in the presence of normoglycemia, SNS/HPA activation during stress, and increased food intake to occur after stress – similar to the hallmarks of the hypoglycemic state. On this background, we address the following questions: Does psychosocial stress actually increase the brain’s need? How does the central nervous system exert “brain-pull” function to demand for extra cerebral energy during stress? And is there also an ingestive “body-pull” which enhances the body’s supply after stress?
Forty healthy men aged 18.0–33.0 years (22.2 ± 0.5 years) with a body mass index (BMI) in the normal range [19.8–25.2 (22.6 ± 0.3) kg/m2] were recruited by notice board postings. Participants met the following inclusion criteria: normal physical examination and routine laboratory tests, no physical or mental disease, no abuse of nicotine, alcohol or drugs, no nightshifts, no disturbed sleep, or exceptional stress during the past 2 weeks and no blood donation during the past 4 weeks prior to the study. Abnormalities in eating behavior and chronic stress were excluded by “Fragebogen zum Essverhalten” (Pudel and Westenhöfer, 1989 ) and by the questionnaire “Trier Inventar zum chronischen Stress” (Schulz et al., 2004 ) respectively. The study was approved by the local medical ethics committee of Luebeck University. All subjects provided their fully informed and written consent before participation.
Subjects were randomly assigned to four different experimental groups according to the energy provided [group 1: rich buffet + i.v. control (i.e., Ringer-infusion), group 2: meager salad + i.v. control, group 3: dextrose-infusion + oral control (i.e., meager salad) and group 4: lactate-infusion + oral control]. Each subject participated in two sessions (stress and non-stress intervention) with an interval of 7–14 days between these two sessions. The experiments were performed in a single-blind fashion with the order of sessions balanced across subjects (Figure 1 ).
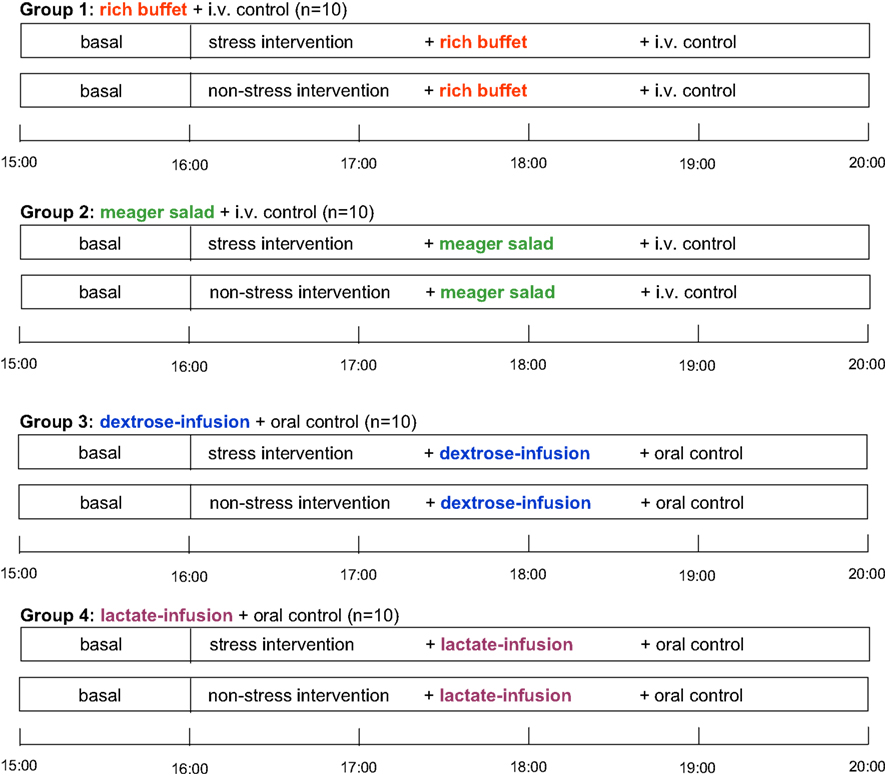
Figure 1. Schedule of this stress intervention study. i.v. control, placebo-infusion; oral control, meager salad.
Experiments took place in a sound attenuated room with the subjects resting on a bed. One venous catheter was placed in each arm. With one cannula the infusion was applied; the other cannula was connected to a long thin tube that enabled blood sampling from an adjacent room without awareness of the subject. A microphone and video camera were installed for communication and observation purposes.
After a fasting period of 2½ h, participants arrived at the medical research unit at 12:30. Adjacent to a short medical exploration and interview including study relevant medical history, each subject received a 250 ml Ringer-infusion (isomolar, consisting of sodium chloride, potassium chloride, calcium chloride, and water) to adjust the fluid balance and to compensate for the following blood loss. Weight was assessed to the nearest gram by an electronic scale. Height was measured to the nearest 0.5 cm by stadiometer. BMI was calculated as weight (kg)/height (m2). Afterwards, a standardized meal was offered consisting of potatoes, mixed vegetables, butter, chicken breast, margarine, gravy, tomatoes, and yoghurt dressing. Between 15:00 and 16:00 blood samples were taken every 15 min. At 16:00, the experimental infusions started, staying for 40 min. The Ringer-infusion was applied with an infusion rate of 7.5 ml/h/kg body mass (experimental groups 1 and 2). To determine an efficient and safe dosage of dextrose and lactate infusions, we performed a pre- experimental dosage finding. Dextrose-infusion (500 ml dextrose-infusion, 0.25 M) was applied with an infusion rate of 5.4 ml/h/kg body mass (experimental group 3). Lactate-infusion (500 ml lactate-infusion, 0.4 M) was applied with an infusion rate of 7.5 ml/h/kg body mass (experimental group 4). As can be seen in Figure 2 dextrose and lactate infusions result in an efficient and safe rise of glucose and lactate concentrations in both the stress and non-stress intervention.
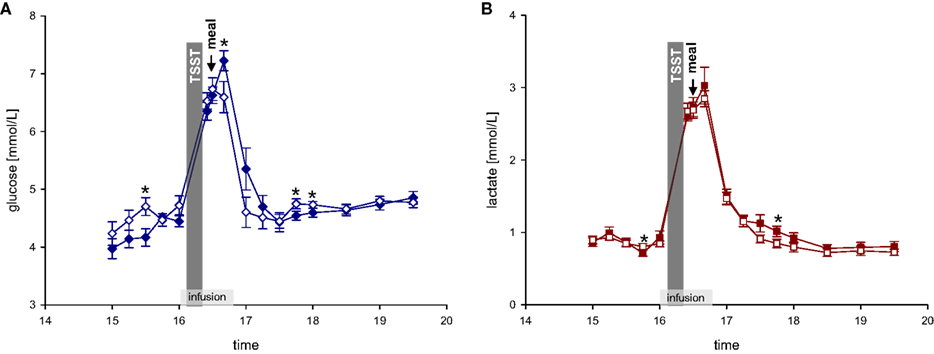
Figure 2. (A) Glucose concentrations during stress and non-stress intervention in 10 men applied a dextrose infusion. (B) Lactate concentrations during stress and non-stress intervention in 10 men applied a lactate infusion. Values are means ± SEM; closed symbols, stress intervention and open symbols, non-stress intervention. *P < 0.05, significantly different from non-stress intervention, by dependent t-test.
At 16:00, the Trier Social Stress Test (TSST) began. Directly after stress intervention (at 16:25 and 16:30), a blood sample was taken and food was offered at 16:30. Experimental group 1 was offered a rich buffet, from which they could choose food for 1 h (for composition of free-choice rich buffet see Table 1 ).
Consumed food was assessed and analyzed for its amounts of energy and macro-nutrients by a dietician. The experimental groups 2–4 received a meager salad (mean amount of energy: 173.1 ± 15.6 kJ, carbohydrates: 11.1 ± 2.7 g, fat: 0.2 ± 0.0 g and protein: 1.2 ± 0.1 g). During and after meal ingestion nine blood samples were taken according to the following schedule: 16:40; between 17:00 and 18:00 every 15 min and between 18:00 and 19:30 every 30 min. The proceeding in the non-stress session was the same, except that the stress test was omitted.
The TSST is a standard tool for the induction of psychological stress in laboratory settings (Kirschbaum et al., 1993 ). At 16:00, subjects were introduced to the task they would have to perform and then taken to another room, where an audience already sat at a table, and a microphone as well as video camera were installed. It was announced that a video analysis of the subject’s performance would be performed (Kirschbaum et al., 1993 ). After a brief preparation period (3 min), the subjects were asked to stand at the microphone and to deliver a free speech as a job applicant who was invited for a personal interview with the company manager (5 min). If the subject finished in less than five min, the audience told the subjects that he has still some time left. If the subject stopped a second time, the audience was quiet for some seconds and then started to ask prepared questions. Afterwards, subjects had to perform a mental arithmetic task consisting of serial substraction (5 min). On a failure, subjects had to restart (Kirschbaum et al., 1993 ).
Subjects were asked to rate their autonomic and neuroglycopenic symptoms at baseline (14:30), immediately after social stress intervention (16:25) and 1½ h after rich buffet/meager salad ingestion (18:00). Subjects rated the following symptoms from 0 (not at all) to 9 (severely): anxiety, sweating, tremor, palpitation, and nervousness (autonomic symptoms) as well as tingling, blurred vision, difficulty to concentrate, dizziness, and faintness (neuroglycopenic symptoms). Ratings were averaged for autonomic and neuroglycopenic symptoms respectively.
Together with the symptom scales (at 14:30, 16:25, and 18:00), a short form of the multidimensional mood state questionnaire, MDBF; Steyer et al., 1997 ) was delivered to assess mood and calmness. Subjects rated their mood from 0 (not at all) to 5 (severely) by the following adjectives: satisfied, bad, good, unwell. Likewise, calmness (restless, unperturbed, agitated, and relaxed) was assessed. Ratings were averaged for mood and calmness respectively.
To assess the perceived stress, the following statements were presented before (14:30) and after stress intervention (18:00): “I feel/felt stressed”, “I feel/felt upset”, “I feel/felt tense”, “I feel/felt anxious”, “I feel/felt threatened”, “I feel/felt well”, “I feel/felt strained”, and “I am/was angry”. Subjects rated perceived stress on a visual analog scale ranging from 0 to 100.
All blood samples were immediately centrifuged, and the supernatants were stored at −60°C till analysis. Plasma glucose was measured by hexokinase method (Abbott Clinical Chemistry, IL, USA, intra-assay and inter-assay CV: <5%). Using the Immulite 2000 system (Siemens, Los Angeles, CA, USA), serum insulin, plasma ACTH and serum cortisol were determined by immunometric assay (insulin: intra-assay CV: 3.3–5.5%; inter-assay CV: 4.1–7.3%; ACTH: intra-assay CV: 6.7–9.5%; inter-assay CV: 6.1–10.0%; cortisol: intra-assay CV: 5.2–7.4%, inter-assay CV: 7.2–9.4%). Plasma epinephrine and norepinephrine were analyzed by HPLC (Chromsystems Diagnostics by HPLC, Munich, Germany, intra-assay CV 1.7–11.4%, inter-assay CV 3.7–12.7%).
Data analysis was performed using SPSS statistical software (SPSS 12.0, Inc., Chicago, IL, USA). Descriptive statistics were given as mean ± SEM. Within-group differences were calculated by paired t-test. ANOVA for repeated measures was used to test differences in the variation of time between stress and non-stress intervention. In this approach, time and stress intervention were entered as within-subject factors. When appropriate, experimental groups were entered as between-subject-factors. The analysis of a set of stress ratings was performed by multivariate testing, that is, MANOVA. Two-level hierarchical linear modeling (HLM) growth curve analyses (Raudenbush and Bryk, 2002 ; Singer and Willett, 2003 ) were conducted using the HLM 6.01 for windows software package to predict changes in glucose and insulin concentrations after buffet ingestion by catecholamine and cortisol increase in response to the TSST. Level 1 captured time since buffet ingestion as random predictors of glucose and insulin, respectively. The area under the curve with respect to increase (AUCi, see Pruessner et al., 2003 ), was calculated for each individual from blood samples obtained between 16:00 and 16:30 (immediately before and after stress intervention) and entered at level 2 to capture changes in catecholamine and cortisol concentrations in response to the stress test. Correlation analysis between Cortisol-AUCi and carbohydrate intake was conducted. A P-value (two-sided) of 0.05 was considered significant.
We tested the hypothesis whether a social stress intervention increases food intake. Ten men were studied in two sessions, a stress and a non-stress intervention, and were offered a rich buffet immediately after stress intervention. We found that carbohydrate intake from a rich buffet increased from 149 ± 13 g in the non-stress session to 183 ± 16 g in the stress session; stressed subjects ate 34 g extra carbohydrates (main effect stress: F = 6.4; P < 0.05; effect of order of sessions: F = 0.0; P = 0.987).
With stress, the intake of protein (main effect stress: F = 0.0; n.s.), fat (main effect stress: F = 0.4; n.s.), and total energy (main effect stress: F = 1.8; n.s.) did not change (Figure 3 ).
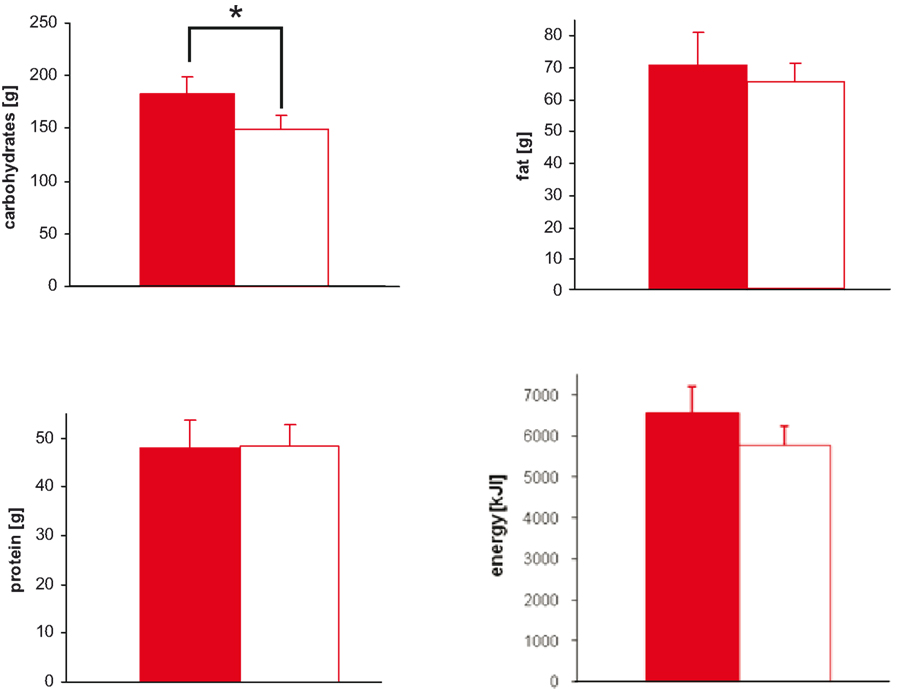
Figure 3. Macro-nutrient and energy intake during stress and non-stress intervention in 10 men provided a rich buffet. Legends as in Figure 2 ; *P < 0.05, significantly different from non-stress intervention, by ANOVA for repeated measures.
Subject did not prefer specific food when stressed (Table 2 ). Particularly, subjects did not display preference for sweet or non-sweet carbohydrates. These results demonstrate that a social stress intervention increases carbohydrate intake from a rich buffet without special emphasis on sweet food.
We next asked whether stress-extra carbohydrates enhance the increments of blood glucose concentrations. Therefore, blood glucose concentrations during and after rich buffet ingestion were measured every 15 min. In the stress session, blood glucose concentrations after rich buffet ingestion increased by 47%, but only by 33% in the non-stress session. Thus, the postprandial hyperglycemia was more pronounced after stress (Figure 4 A) (interaction time × stress: F = 3.8, P < 0.001; main effect time (16:00 and 16:40 till 17:30): F = 25.7, P < 0.001; main effect stress: F = 3.4, n.s.).
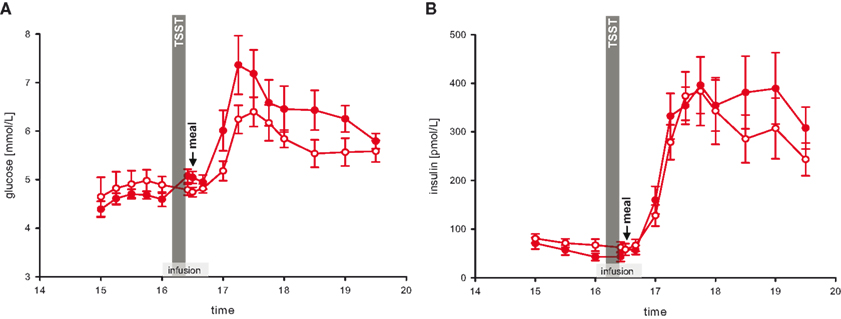
Figure 4. Glucose and insulin concentrations during stress and non-stress intervention in 10 men provided a rich buffet. Legends as in Figure 2 .
Referring to the postprandial hyperglycemia, we subsequently aimed at analyzing the accompanying rise in insulin. The increments in serum insulin concentrations after rich buffet ingestion were equal during stress and non-stress intervention (Figure 4 B) (interaction time × stress: F = 2.5, n.s.; main effect time (16:00 and 16:40 till 17:30): F = 39.8, P < 0.001; main effect stress: F = 0.1, n.s.). Thus, after stress the elevated postprandial blood glucose did not enhance insulin secretion (Figures 4 A,B).
This pattern was not only observed in the post-stress replenishment phase. Blood glucose concentrations increased by 11% from baseline pre-stress (16:00) to the measurement immediately after social stress intervention (16:25), whereas in the non-stress session glucose concentrations remained essentially equal (−2%) (Figure 4 A) (interaction time × stress: F = 7.6, P < 0.05; main effect time: F = 5.0, P = 0.05; main effect stress: F = 0.0, n.s.). In the stress session, raised blood glucose concentrations did not enhance insulin secretion (Figure 4 B) (interaction time × stress: F = 0.3, n.s.; main effect time: F = 0.3, n.s.; main effect stress: F = 3.1, n.s.). Thus, the increase in blood glucose did not enhance insulin concentrations both in the stress phase and in the post-stress replenishment phase, hence insulin was under a suppressive influence.
After that we hypothesized that the observed effects on insulin secretion were due to CIS, that is, the result of an activated stress-system. Therefore, catecholamine, ACTH and cortisol concentrations as well as autonomic symptoms were analyzed (Figure 5 , red symbols).
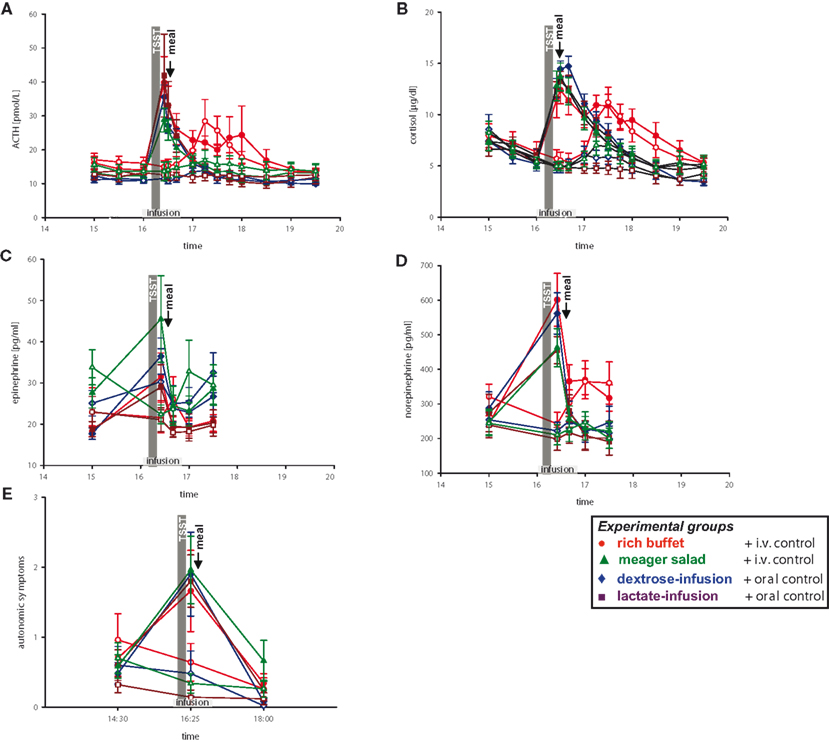
Figure 5 . Hormonal and autonomic symptomatic response during stress and non-stress intervention in all four experimental groups. Legends as in Figure 2 .
When compared with pre-stress baseline, social stress increased concentrations of epinephrine 72%, norepinephrine 148%, ACTH 184%, cortisol 131%, and autonomic symptoms 137% (Figure 5 , red symbols). Similar results were seen in another group of 10 subjects, who were offered a meager salad after stress intervention (Figure 5 , green symbols).
To address the question whether simultaneous energy supplementation during stress intervention affects the stress response, we infused dextrose in 10 men and lactate in 10 other men (Figure 5 , blue and violet symbols). We could show that the stress response, as seen in the increase of catecholamine, ACTH, and cortisol concentrations as well as autonomic symptoms, was unaffected by i.v. energy supplementation during stress (dextrose or lactate infusion vs. placebo-infusions; Table 3 , column a).
When testing all four experimental groups together (rich buffet, meager salad, dextrose-infusion, lactate-infusion), we were able to show that the stress-response of catecholamine, ACTH and cortisol concentrations as well as autonomic symptoms was robust (Figure 5 , all colors and Table 3 , column b). The social stress intervention induced an immediate hormonal and autonomic symptomatic response, which was unaffected by exogenous energy supply.
To further investigate the presence of CIS in the subjects, who received a rich buffet after stress intervention, we used a HLM to test whether the sympatho-adrenal stress response was linked to insulin secretion. Among the indicators of stress system activity (catecholamines, cortisol), cortisol was found to be associated with the pattern of insulin suppression in the 10 men who were offered the rich buffet. A higher increase in cortisol after stress was associated with a steeper increase in glucose concentrations after rich buffet ingestion (coefficient for interaction time slope glucose and AUCi cortisol = 0.000168, SE = 0.000068, P = 0.038, for stress intervention only; HLM), whereas cortisol concentrations were not associated with the increase in insulin concentrations after rich buffet ingestion (coefficient = 0.000702, SE = 0.000911, P = 0.463 for stress intervention only; HLM). Noteworthy, this pattern was seen independent of carbohydrate intake (correlation coefficient cortisol-AUCi and carbohydrate intake from rich buffet: r = −0.148; P = 0.68). Thus, the HLM-testing supports the notion that CIS was operative in our study subjects.
Subsequently we checked whether post-stress recovery is altered by energy intake or infusion. We were able to show that the recovery of catecholamine, ACTH and cortisol concentrations as well as autonomic symptomatic responses (Figure 5 ) was neither affected by ingestion of a rich buffet (Table 3 , column C) nor by i.v. energy supplementation (dextrose and lactate infusions; Table 3 , column D).
We then analyzed, whether the social stress intervention leads to a cerebral energy deficit. To answer this question, we analyzed neuroglycopenic symptoms in all four experimental groups. Subjects of all groups showed more neuroglycopenic symptoms immediately after social stress intervention (Figure 6 ) (interaction time × stress: F = 10.0, P < 0.01; main effect time (14:30 vs. 16:25): F = 7.0, P = 0.01; main effect stress: F = 5.1, P = 0.03). However, no immediate resolving effect on neuroglycopenic symptoms was observed when energy was intravenously supplemented during social stress exposition by dextrose or lactate infusion as compared to placebo-infusions (main effect group: F = 1.1, n.s.). Nevertheless, these results show that social stress intervention induces a prolonged neuroglycopenic state – indicating cerebral exhaustion. Noteworthy, neuroglycopenic symptoms, which typically occur only during hypoglycemia, occurred in the presence of normal blood glucose concentrations.
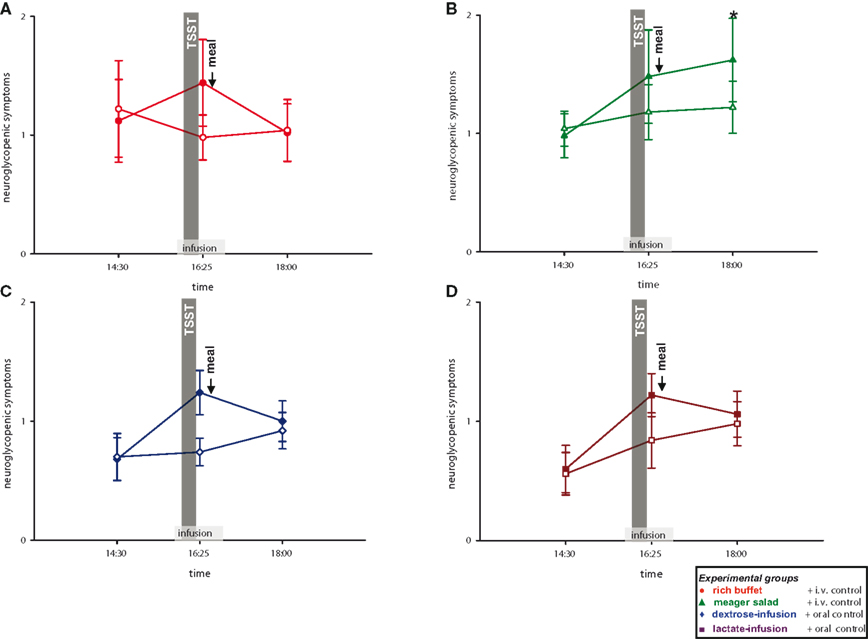
Figure 6. Neuroglycopenic symptoms during stress and non-stress intervention in all four experimental groups. Original scale of neuroglycopenic symptoms ranges from 0 to 9. Legends as in Figure 2 ; *P < 0.05, significantly different from non-stress intervention, by dependent t-test.
As stress induces neuroglycopenic symptoms, we aimed at determining if the prolonged neuroglycopenic state can be resolved by high energy supplementation. When comparing the three high-energy groups with the low-energy group, post-stress neuroglycopenic symptoms at 18:00 returned to the level of the non-stress control session in the three high-energy conditions (i.e., rich buffet, dextrose-infusion, and lactate-infusion). Thus, a delayed resolving effect on symptoms was observed with the dextrose and lactate infusions applied during stress intervention. In contrast, in the low-energy condition (only meager salad) neuroglycopenic symptoms at 18:00 persisted at a high level (interaction group × stress: F = 5.3, P = 0.03; main effect stress: F = 8.5, P < 0.01) (Figure 6 ). In all, the high-energy conditions (regardless of their character, i.e., rich buffet or energy infusions) resolved a prolonged post-stress neuroglycopenic state. These findings are in line with the view that an efficient brain-pull is required for resolving a stress-induced neuroglycopenic state. We could provide first evidence that an efficient brain-pull acts through mechanisms involving CIS. Moreover, our results support the view that the energy flux during and after stress is at least partly allocated to the brain.
Consequently we tested whether calmness and mood are impaired by social stress. To answer this question, subjects of all four experimental groups rated their calmness and mood at pre-stress baseline and after social stress intervention. Compared to the non-stress control session, calmness was rated to worsen in the stress session (interaction time × stress: F = 33.0, P < 0.01; main effect time (14:30 vs. 16:25): F = 37.4, P < 0.01; main effect stress: F = 36.3, P < 0.01); the same was with mood (interaction time × stress: F = 26.8, P < 0.01; main effect time (14:30 vs. 16:25): F = 27.8, P < 0.01; main effect stress: F = 22.4, P < 0.01) (Figure 7 ).
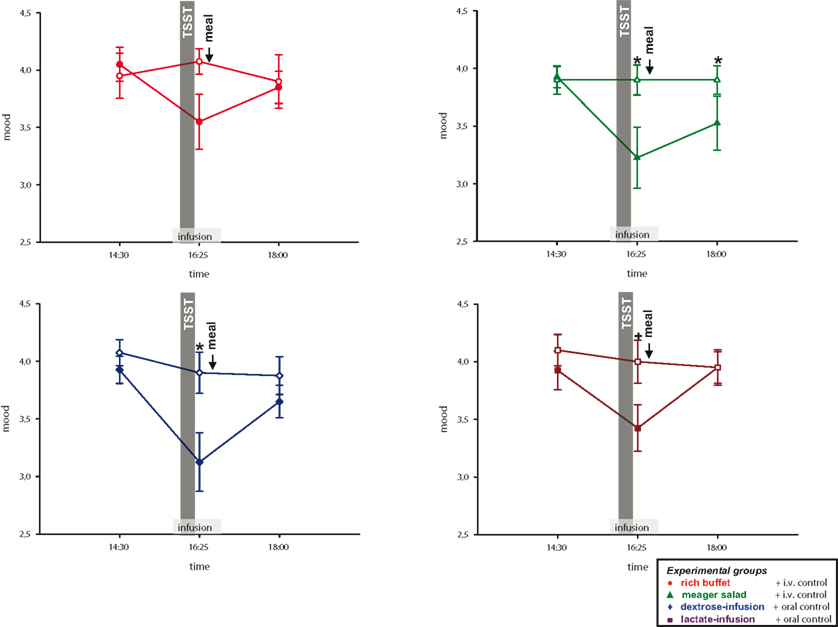
Figure 7. Mood ratings during stress and non-stress intervention in all four experimental groups. Original scales of mood ratings range from 0 to 9. Legends as in Figure 2 ; *P < 0.05, +P < 0.01, significantly different from non-stress intervention, by dependent t-test.
As neuroglycopenic symptoms were resolved in the high energy conditions, we now examined, whether this was also true for calmness and mood. Calmness and mood at 18:00 returned to the level of the non-stress control session in the three high-energy conditions (rich buffet, dextrose-infusion and lactate-infusion), whereas in the low-energy condition (meager salad) calmness and mood (Figure 7 ) were still worse (calmness: interaction time (14:30 and 18:00) × stress × group: F = 6.8; P < 0.05; mood: interaction time (14:30 and 18:00) × stress × group: F = 4.0; P = 0.052).
Finally we asked, whether the food offer (rich buffet vs. meager salad condition) influenced how the stressful experience of the TSST was memorized and valuated. To answer this question, subjects rated their tension twice with aid of eight sentences. A baseline rating was performed at 14:30 and a retrospective stress rating at 18:00 (after social stress and food intake). When comparing all four experimental groups, subjects who were offered the rich buffet retrospectively stated less burdening during social stress exposition than subjects who were offered the meager salad (group effect: F = 2.5, P = 0.03; MANOVA). Retrospective rating of a lesser burden after eating from the rich buffet could be shown in three of eight sentences (“I feel/felt upset”: F = 9.2, P = 0.004; “I feel/felt tense”: F = 13.1, P = 0.001; “I feel/felt strained”: F = 4.8, P = 0.036; MANOVA) (Figure 8 ). A post hoc analysis showed that there was no difference between the three meager salad groups (meager salad and dextrose-, lactate-, or placebo-infusion) (group effect: F = 1.1, P = 0.373; MANOVA). Post-stress carbohydrate intake from a rich buffet results in a retrospective trivialization of the stressful experience, whereas the energy supplementation by either dextrose-, or lactate-infusion during stress exposition had no effect on stress perception. Our results suggest that stress-extra carbohydrates have recharging and stabilizing effects on the cerebral metabolic and emotional homeostasis. Moreover, the awareness of having the stress-extra carbohydrates ingested additionally influences the perception of stress through higher evaluative processes in the cerebral hemispheres.
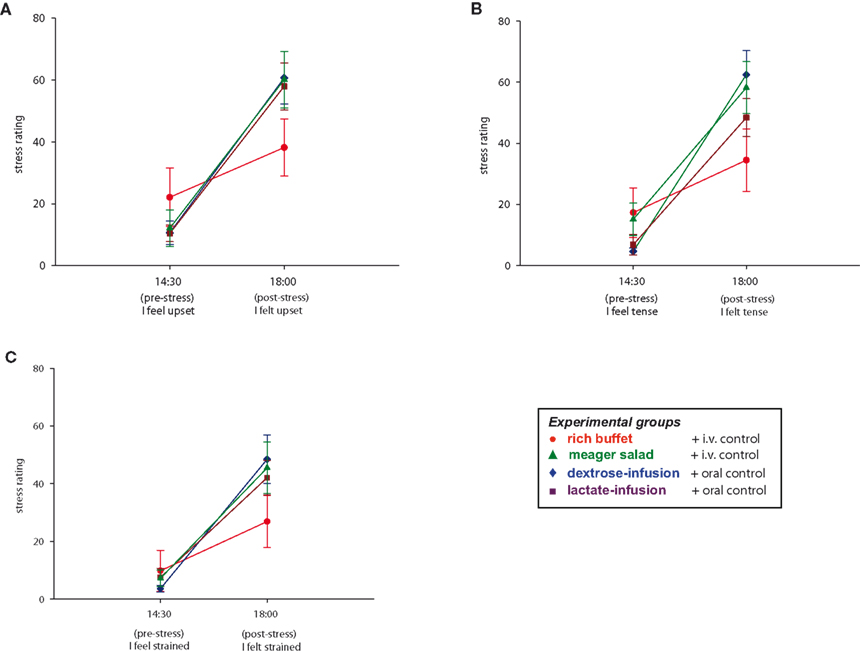
Figure 8 . Stress ratings during stress intervention in all four experimental groups. Values are means ± SEM.
The experiments presented here show how the brain can demand for energy from the body: by making use of cerebral insulin suppression. In this way, “CIS” can be interpreted as a “brain-pull” mechanism. Moreover, psychosocial stress did increase the brain’s need. After psychosocial stress, energy intake was found markedly increased to supply the brain and the body with energy for replenishment.
This study showed how the stressed brain demands for extra energy. Evidence for an increased brain demand is that during the stress session insulin secretion could not be directly influenced by increasing blood glucose. We could show that a strong SNS/HPA response was linked to the observed suppressive effect on serum insulin. These findings are in agreement with the presence of CIS. Thus, instead of storing glucose in peripheral tissues via GLUT-4 transport, circulating glucose is available for GLUT-1 transport across the blood brain barrier under stress conditions. Noteworthy, the stimulatory influence on CIS appears to be very robust, since various kinds of exogenous energy supplementation failed to dampen the SNS/HPA response.
The presence of a CIS-brain-pull mechanism has been found in two animal experiments studying the effects of cerebral ischemia. First, when mice underwent cerebral artery occlusions (MCAO) and received a glucose load 1 day later, they failed to increase their insulin secretion, while control rats (sham MCAO) exhibited a marked insulin rise (Harada et al., 2009 ). These findings are compatible with the presence of a CIS-mechanism, suggesting that the brain activates demand mechanisms to compensate for the cerebral energy depletion. In a second experiment, adult rats displayed the features of CIS after MCAO, and CIS was particularly pronounced in those rats, which had additionally undergone postnatal stress and which consequently displayed elevated serum cortisol in their later adult life (McPherson et al., 2009 ). Thus, cerebral energy demand mechanisms like CIS are not only present during psychosocial stress, but also during other kinds of cerebral metabolic crisis.
The second main finding is that the need of the brain is increased by stressful events. Evidence that the cerebral need is enlarged is that the stress-induced neuroglycopenic state developed at normal blood glucose concentrations. It is well known from the field of hypoglycemia research that neuroglycopenic symptoms typically develop below 2.7 mmol/l. Over more than 20 years of human research in this field, cerebral energy deficiency has been assessed by standardized symptom questionnaires (Mitrakou et al., 1991 ). Here, these questionnaires have been applied for the first time in humans under psychosocial stress conditions. The questionnaires appear to be more sensitive in detecting cerebral energy deficiency than phosphor magnet resonance spectroscopy, a method which could not detect reductions of high energy phosphates (e.g., ATP) at blood glucose levels of 2.7 mmol/l (Oltmanns et al., 2008 ). ATP depletion is likely to occur in more severe energy deficient states, for example, in cerebral ischemia. According to energy conservation, the cerebral energy content only decreases, if the brain’s need exceeds the brain’s supply. Because brain supply (as measured by global cerebral glucose uptake using the invasive Kety–Schmidt method) has been demonstrated to be augmented during mental stress (Madsen et al., 1995 ), our detection of a neuroglycopenic state (reduced cerebral energy content) immediately after stress is indicative of an increased cerebral need.
What are the physiological mechanisms that lead to the clinical picture occurring during neuroglycopenia? In the cerebral hemispheres and in the brain stem, neurons are equipped with ATP-sensitive potassium (KATP) channels. If the intraneuronal ATP concentrations decline, KATP channels are opened and the neuron is hyperpolarized, thereby shutting down neuronal firing rate. In the neuroglycopenic state, KATP channel activation throughout the cerebral hemisphere leads to mosaic-like neurological deficit symptoms, for example, tingling, blurred vision, difficulty to concentrate, etc. The clinical symptoms are manifold and include a large spectrum of symptoms indicating cerebral non-functioning. In this way, the energy deprived brain can switch to an energy sparing mode which shuts down brain function in order to maintain cerebral energy homeostasis. Thus, neuroglycopenic symptoms are indicative of an active brain process which serves neuroprotection. Besides, KATP channels located on GABAergic neurons in the VMH are able to sense small and early changes in cerebral ATP concentrations and thereby disinhibiting VMH glutamatergic mechanisms and in so doing stimulate the SNS/HPA system (Chan et al., 1991 ; Tong et al., 2007 ). Thus, cerebral KATP-channels mediate both the deactivation of neuronal functioning for sparing energy need and the activation of brain-pull mechanisms for energy demand.
In this study, the changes in cerebral energy state were parallel to the changes in mood. The psychosocial challenge induces a state of both neuroglycopenia and impaired mood, which is corrected by the supplementation of exogenous energy. However, contrary to the hypothesis that “comfort food” reduces the activity of the stress system and thereby relieves bad mood (Dallman et al., 2003 ), our subjects displayed robust sympatho-adrenal responses, which were not affected by exogenous energy (given orally or intravenously). That stress-induced mood changes were resolved by food ingestion cannot be attributed to changes in the stress system. Rather, it indicates that mood was restored by restoring cerebral energy homeostasis.
Surprisingly, all subjects who received or took up exogenous energy reported a relief of neuroglycopenic symptoms, mood and tension, but only those subjects who ate from the rich buffet retrospectively memorized the stressful experience as being endurable. In contrast, those subjects who received the intravenous dextrose or lactate, retrospectively evaluated their stressful experience as being unendurable. We suggest that exogenous energy supplementation can directly correct the neuroglycopenic state after stress, thereby relieving mood and tension, but that the subjective experience of the stressful event is also influenced by the awareness of having food ingested.
The third main finding is that after stress carbohydrate intake is largely increased, thereby enhancing the body’s supply for replenishment. In this way, we could confirm findings on enhanced eating behavior following a stressful episode (Rutters et al., 2009 ). Given that in an average man the daily carbohydrate intake is approximately 200 g and the daily cerebral glucose uptake 130 g, an amount of 34 g glucose for replenishment after a 10-min-mental-stress period appears remarkably high. Our results show that the glucose fluxes within the organism are mainly directed towards the brain, and are large enough to correct a neuroglycopenic state. The exact quantitative relation between energy fluxes to the brain and to the body periphery has to be assessed in future.
The three main findings presented in this human study indicate that the brain’s need, supply, and demand are increased by stress. All these findings had been predicted by the “Selfish Brain” theory, which was founded by Achim Peters in the period 1998–2004, postulating the existence of such allocative mechanisms and implementing them as functional elements serving to maintain the brain’s high energy content at the expense of the body (Peters et al., 2004 ). After having obtained experimental key results supporting the axioms of this theory previously (Peters et al., 2007 ; Steinkamp et al., 2007 ; Schweiger et al., 2008 ; Oltmanns et al., 2008 ; Klement et al., 2010 ), the current paper expands the theory’s scope of validity with respect to the mode of operation of brain-pull mechanisms during psychosocial stress in humans. By using the tools of economy and logistics we have reconstructed an overall picture of the central and peripheral energy metabolism under stress conditions. This reconstruction which incorporates and confirms the separate observation of previous investigators (Woods and Porte, 1974 ; Mitrakou et al., 1991 ; Magistretti et al., 1999 ; Swanson, 2000 ; Morton et al., 2006 ; McEwen, 2007 ; de Kloet et al., 2008 ; Rutters et al., 2009 ; Dallman, 2010 ) includes several new observations that provide a more complete understanding of the brain’s priority in energy metabolism.
The authors declare that the research was conducted in the absence of any commercial or financial relationships that could be construed as a potential conflict of interest.
We thank Ann-Sophie Schmidt-Thrun, Irena Zeiß, Saskia Otte, Kai Duysen, Kirstin Nordhausen and Jutta Schwanbom for their contribution in carrying out the experiments, their expert administrative and laboratory assistance. This work was supported by a grant from the German Research Foundation (Clinical Research Group KFO-126).
Ahren, B. (2000). Autonomic regulation of islet hormone secretion – implications for health and disease. Diabetologia 43, 393–410.
Bosy-Westphal, A., Kossel, E., Goele, K., Later, W., Hitze, B., Settler, U., Heller, M., Gluer, C. C., Heymsfield, S. B., and Müller, M. J. (2009). Contribution of individual organ mass loss to weight loss-associated decline in resting energy expenditure. Am. J. Clin. Nutr. 90, 993–1001.
Chan, S. L., Dunne, M. J., Stillings, M. R., and Morgan, N. G. (1991). The alpha 2-adrenoceptor antagonist efaroxan modulates K + ATP channels in insulin-secreting cells. Eur. J. Pharmacol. 204, 41–48.
Dallman, M. F. (2010). Stress-induced obesity and the emotional nervous system. Trends Endocrinol. Metab. 21, 159–165.
Dallman, M. F., Pecoraro, N., Akana, S. F., la Fleur, S. E., Gomez, F., Houshyar, H., Bell, M. E., Bhatnagar, S., Laugero, K. D., and Manalo, S. (2003). Chronic stress and obesity: a new view of “comfort food”. Proc. Natl. Acad. Sci. USA 100, 11696–11701.
de Kloet, E. R., Karst, H., and Joels, M. (2008). Corticosteroid hormones in the central stress response: quick-and-slow. Front. Neuroendocrinol. 29, 268–272.
Fox, P. T., Raichle, M. E., Mintun, M. A., and Dence, C. (1988). Nonoxidative glucose consumption during focal physiologic neural activity. Science 241, 462–464.
Gong, Q. Y., Roberts, N., Garden, A. S., and Whitehouse, G. H. (1998). Fetal and fetal brain volume estimation in the third trimester of human pregnancy using gradient echo MR imaging. Magn. Reson. Imaging 16, 235–240.
Goodman, M. N., Lowell, B., Belur, E., and Ruderman, N. B. (1984). Sites of protein conservation and loss during starvation: influence of adiposity. Am. J. Physiol. 246, E383–E390.
Harada, S., Fujita, W. H., Shichi, K., and Tokuyama, S. (2009). The development of glucose intolerance after focal cerebral ischemia participates in subsequent neuronal damage. Brain Res. 1279, 174–181.
Kind, K. L., Roberts, C. T., Sohlstrom, A. I., Katsman, A., Clifton, P. M., Robinson, J. S., and Owens, J. A. (2005). Chronic maternal feed restriction impairs growth but increases adiposity of the fetal guinea pig. Am. J. Physiol. Regul. Integr. Comp. Physiol. 288, R119–R126.
Kirschbaum, C., Pirke, K. M., and Hellhammer, D. H. (1993). The ‘Trier Social Stress Test’–a tool for investigating psychobiological stress responses in a laboratory setting. Neuropsychobiology 28, 76–81.
Klement, J., Hubold, C., Cords, H., Oltmanns, K. M., Hallschmid, M., Born, J., Lehnert, H., and Peters, A. (2010). High-calorie comfort food attenuates neuroglycopenic symptoms in patients with Addison’s disease. J. Clin. Endocr. Metab. 95, 522–528.
Krieger, M. (1921). [On the atrophy on human organs in inanition]. Z. Angew. Anat. Konstitutionsl. 7, 87–134.
Madsen, P. L., Cruz, N. F., Sokoloff, L., and Dienel, G. A. (1999). Cerebral oxygen/glucose ratio is low during sensory stimulation and rises above normal during recovery: excess glucose consumption during stimulation is not accounted for by lactate efflux from or accumulation in brain tissue. J. Cereb. Blood Flow Metab. 19, 393–400.
Madsen, P. L., Hasselbalch, S. G., Hagemann, L. P., Olsen, K. S., Bulow, J., Holm, S., Wildschiodtz, G., Paulson, O. B., and Lassen, N. A. (1995). Persistent resetting of the cerebral oxygen/glucose uptake ratio by brain activation: evidence obtained with the Kety-Schmidt technique. J. Cereb. Blood Flow Metab. 15, 485–491.
Magistretti, P. J., Pellerin, L., Rothman, D. L., and Shulman, R. G. (1999). Energy on demand. Science 283, 496–497.
McEwen, B. S. (2007). Physiology and neurobiology of stress and adaptation: central role of the brain. Physiol. Rev. 87, 873–904.
McPherson, R. J., Mascher-Denen, M., and Juul, S. E. (2009). Postnatal stress produces hyperglycemia in adult rats exposed to hypoxia-ischemia. Pediatr. Res. 66, 278–282.
Miller, S. L., Green, L. R., Peebles, D. M., Hanson, M. A., and Blanco, C. E. (2002). Effects of chronic hypoxia and protein malnutrition on growth in the developing chick. Am. J. Obstet. Gynecol. 186, 261–267.
Mitrakou, A., Ryan, C., Veneman, T., Mokan, M., Jenssen, T., Kiss, I., Durrant, J., Cryer, P. E., and Gerich, J. (1991). Hierarchy of glycemic thresholds for counterregulatory hormone secretion, symptoms, and cerebral dysfunction. Am. J. Physiol. 260, E67–E74.
Morton, G. J., Cummings, D. E., Baskin, D. G., Barsh, G. S., and Schwartz, M. W. (2006). Central nervous system control of food intake and body weight. Nature 443, 289–295.
Muhlau, M., Gaser, C., Ilg, R., Conrad, B., Leibl, C., Cebulla, M. H., Backmund, H., Gerlinghoff, M., Lommer, P., Schnebel, A., Wohlschlager, A. M., Zimmer, C., and Nunnemann, S. (2007). Gray matter decrease of the anterior cingulate cortex in anorexia nervosa. Am. J. Psychiatry 164, 1850–1857.
Oltmanns, K. M., Melchert, U. H., Scholand-Engler, H. G., Howitz, M. C., Schultes, B., Schweiger, U., Hohagen, F., Born, J., Peters, A., and Pellerin, L. (2008). Differential energetic response of brain vs. skeletal muscle upon glycemic variations in healthy humans. Am. J. Physiol. Regul. Integr. Comp. Physiol. 294, R12–R16.
Peters, A., and Langemann, D. (2009). Build-ups in the supply chain of the brain: on the neuroenergetic cause of obesity and type 2 diabetes mellitus. Front. Neuroenergetics 1, 2; doi:10.3389/neuro.14.002.2009.
Peters, A., Pellerin, L., Dallman, M. F., Oltmanns, K. M., Schweiger, U., Born, J., and Fehm, H. L. (2007). Causes of obesity: looking beyond the hypothalamus. Prog. Neurobiol. 81, 61–88.
Peters, A., Schweiger, U., Pellerin, L., Hubold, C., Oltmanns, K. M., Conrad, M., Schultes, B., Born, J., and Fehm, H. L. (2004). The selfish brain: competition for energy resources. Neurosci. Biobehav. Rev. 28, 143–180.
Pruessner, J. C., Kirschbaum, C., Meinlschmid, G., and Hellhammer, D. H. (2003). Two formulas for computation of the area under the curve represent measures of total hormone concentration versus time-dependent change. Psychoneuroendocrinology 28, 916–931.
Pudel, V., and Westenhöfer, J. (1989). [Fragebogen zum Eßverhalten (FEV) – Handanweisung]. Göttingen: Verlag für Psychologie Dr C J Hogrefe.
Raudenbush, S. W., and Bryk, A. S. (2002). Hierarchical Linear Models: Applications and Data Analysis Methods. Thousand Oaks: Sage Publications.
Rutters, F., Nieuwenhuizen, A. G., Lemmens, S. G., Born, J. M., and Westerterp-Plantenga, M. S. (2009). Acute stress-related changes in eating in the absence of hunger. Obesity (Silver Spring) 17, 72–77.
Schulz, P., Schlotz, W., and Becker, P. (2004). [Trier Inventar zum chronischen Stress (TICS)]. Göttingen: Verlag für Psychologie Dr C J Hogrefe.
Schweiger, U., Greggersen, W., Rudolf, S., Pusch, M., Menzel, T., Winn, S., Hassfurth, J., Fassbinder, E., Kahl, K. G., Oltmanns, K. M., Hohagen, F., and Peters, A. (2008). Disturbed glucose disposal in patients with major depression application of the glucose clamp technique. Psychosom. Med. 70, 170–176.
Singer, J. D., and Willett, J. B. (2003). Applied Longitudinal Data Analysis: Modeling Change and Event Occurrence. New York: Oxford University Press.
Steinkamp, M., Li, T., Fuellgraf, H., and Moser, A. (2007). K(ATP)-dependent neurotransmitter release in the neuronal network of the rat caudate nucleus. Neurochem. Int. 50, 159–163.
Steyer, R., Schwenkmezger, O., Notz, P., and Eid, M. (1997). [Der Mehrdimensionale Befindlichkeitsfragebogen (MDBF)]. Göttingen: Verlag für Psychologie Dr C J Hogrefe.
Swanson, L. W. (2000). Cerebral hemisphere regulation of motivated behavior. Brain Res. 886, 113–164.
Tong, Q., Ye, C., McCrimmon, R. J., Dhillon, H., Choi, B., Kramer, M. D., Yu, J., Yang, Z., Christiansen, L. M., Lee, C. E., Choi, C. S., Zigman, J. M., Shulman, G. I., Sherwin, R. S., Elmquist, J. K., and Lowell, B. B. (2007). Synaptic glutamate release by ventromedial hypothalamic neurons is part of the neurocircuitry that prevents hypoglycemia. Cell Metab. 5, 383–393.
Keywords: brain metabolism, brain-pull, cerebral insulin suppression, experimental human study, glucose allocation, selfish brain theory, stress, supply chain
Citation: Hitze B, Hubold C, van Dyken R, Schlichting K, Lehnert H, Entringer S and Peters A (2010) How the selfish brain organizes its supply and demand. Front. Neuroenerg. 2:7. doi: 10.3389/fnene.2010.00007
Received: 30 March 2010;
Paper pending published: 15 April 2010;
Accepted: 11 May 2010;
Published online: 09 June 2010
Edited by:
Luc Pellerin, University of Lausanne, SwitzerlandReviewed by:
Luc Tappy, University of Lausanne, SwitzerlandCopyright: © 2010 Hitze, Hubold, van Dyken, Schlichting, Lehnert, Entringer and Peters. This is an open-access article subject to an exclusive license agreement between the authors and the Frontiers Research Foundation, which permits unrestricted use, distribution, and reproduction in any medium, provided the original authors and source are credited.
*Correspondence: Achim Peters, Clinical Research Group SELFISH BRAIN Brainmetabolism, Neuroenergetics, Obesity and Diabetes, Medical Clinic I, University of Luebeck, Ratzeburger Allee 160, 23538 Luebeck, Germany. e-mail:YWNoaW0ucGV0ZXJzQHVrLXNoLmRl
Disclaimer: All claims expressed in this article are solely those of the authors and do not necessarily represent those of their affiliated organizations, or those of the publisher, the editors and the reviewers. Any product that may be evaluated in this article or claim that may be made by its manufacturer is not guaranteed or endorsed by the publisher.
Research integrity at Frontiers

Learn more about the work of our research integrity team to safeguard the quality of each article we publish.