

94% of researchers rate our articles as excellent or good
Learn more about the work of our research integrity team to safeguard the quality of each article we publish.
Find out more
OPINION article
Front. Neuroenergetics, 07 June 2010
Volume 2 - 2010 | https://doi.org/10.3389/fnene.2010.00004
This article is part of the Research TopicNeurovascular imagingView all 25 articles
There are hundreds of different neuronal cell types across the brain and perhaps a large variety of astrocytes too. Each one of these cell subtypes is exposed to a different energy load in terms of onset, intensity and duration; from cells that fire at 500 Hz for a few milliseconds, others that sustain 40 Hz for hours and cells that may fire only once in a lifetime. It may be thought therefore that each different cell subtype has evolved a specific way to solve the energy problem, i.e., how to match energy delivery to energy demand. However, most of this rich microscopic detail remains unknown because current techniques to measure metabolite concentrations and metabolic flux have limited spatiotemporal resolution. This Opinion Article discusses how energy metabolism in the brain tissue may appear when looked at the cell level and with resolution of seconds, a task that seems increasingly possible due to the recent introduction of new molecular probes and powerful microscopy techniques.
Picture a 100 meter sprint race. Within seconds of the start signal, the athletes’ hearts have increased their metabolic rate by five-fold and even stronger stimulations may be measured in the muscles of their legs. Meanwhile their brains stay unperturbed, for not even the hardest exercise or the most difficult chess move will provoke a significant increase in the overall fuel consumption of the organ. The metabolic rate of the brain does not decrease much either, and even during sleep, despite much diminished sensorial input and lack of movement, it only goes down by 15%. But this boring picture is deceiving, for very interesting things are bound to happen locally. The metabolic rate of individual neurons is highly variable. One moment they are at rest, consuming little energy in housekeeping functions like protein synthesis and intracellular trafficking; the next one they are at full throttle, recovering ion gradients challenged by postsynaptic currents and action potentials. For instance, as our sprinters leave the blocks, several neurons in their striata will have sprinted themselves from quiescence to 40 Hz, a firing rate that may be sustained for hours in a marathon race. Electrical activity means great energy expenditure, and from biophysical data it can be calculated that this level of electrical activity results in a 30-fold rise in fuel demand (Attwell and Laughlin, 2001 ).
The contrast between cell-level scintillation and organ-level constancy speaks of efficient averaging strategies whose nature we are only beginning to grasp. A first mechanism may be temporal averaging. Auditory neurons can fire at 500 Hz, which translates into a surge in energy demand in excess of 100-fold. However, these high-frequency neurons fire in bursts and the metabolic debt acquired during activity may be paid for during the resting phase. Neurons do not posses energy stores but they do have millimolar concentrations of glucose, lactate and glycolytic intermediaries to last for a short while. Though useful for phasic neurons, temporal averaging is of little use for tonic neurons like those in the striatum, which must sustain high rates of firing indefinitely, thus the need for spatial averaging. If the tissue architecture were arranged in such a way that active cells are surrounded by other cells that remain passive, the energy load may be shared over a larger volume. For instance, if every third neuron in a given area of the striatum were active during the sprint, the rise in regional energy demand would be reduced to more manageable 10-fold. Furthermore, it has been reported that active synapses inhibit their neighbors, a process mediated by purinergic signaling by astrocytes and thought to be instrumental for efficient information processing (Pascual et al., 2005 ). Given the direct relationship existing between activity and fuel consumption, it seems plausible that this functional contrast-enhancing is accompanied by metabolic inhibition of the neighbors and consequent fuel redistribution, a kind of “metabolic contrast-enhancing.” Spatial averaging is conditioned by diffusion, whose effect is dramatically reduced by distance. Over a few micrometers, e.g., the diameter of a neuronal soma, diffusion is highly efficient, mixing molecules much faster than the turnover rates of the transporters and enzymes that produce them (Barros and Martinez, 2007 ). This means that astrocytes and neuronal somata are essentially homogenous in terms of glucose, lactate, ATP and other metabolites, and that neighboring postsynaptic spines are metabolically coupled. The presence of plasma membranes determines dynamic concentration gradients, between the interstitium, the cytosols of neurons and glial cells and mitochondria, yet we do not know how strong these gradients are and in some cases not even their direction, notably the lactate gradient between neurons and interstitium. Over longer distances, diffusion becomes less effective, giving rise to a second source of compartmentation. The half-time of glucose equilibration between two locations separated by 1 mm is about 20 min, ten times longer than the typical half-time of glucose phosphorylation in the brain tissue (Barros et al., 2007 ). In other words, there will be no effective spatial averaging of a metabolic load over distances over 1 mm, which sets the maximum size for a metabolic unit in the brain tissue and the spatial resolution of micrometer probes inserted in the interstitium.
The fluctuations in metabolic flux that accompany neuronal activity and the nature of the averaging mechanisms that explain large scale constancy of metabolic flux are almost invisible to current techniques, and as a result we know precious little of how the energy load is handled by the brain tissue. Some of these methods techniques report metabolite concentration and other metabolic flux (Table 1 ).
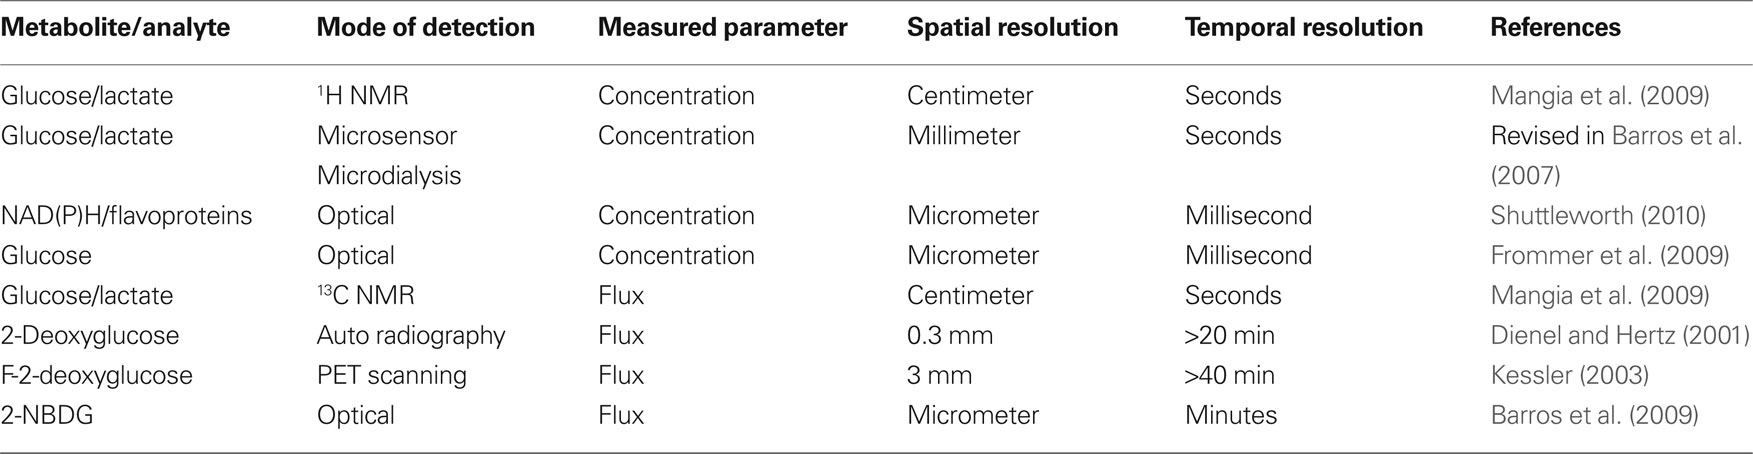
Table 1. Resolution of some techniques used in the study of brain energy metabolism.
Arguably the best technique to measure metabolic flux is the 2-deoxyglucose method, introduced by Louis Sokoloff in the 70s, which shows maximum increases of about 30–60% in local glycolytic rate in response to physiological activation in vivo (Dienel and Hertz, 2001 ). With a best lateral resolution of 300 μm, a single pixel in a 2-deoxyglucose autoradiograph integrates information from hundreds of cells over 20 min or more; Its non-invasive – though less sensitive – counterpart being Fluorodeoxyglucose PET scanning, of ample use in clinical practice and cognitive studies (Kessler, 2003 ). Better temporal resolution has been obtained with NMR spectroscopy and also with microprobes inserted in the tissue, which show that synaptic activity is followed within seconds by a decrease in interstitial glucose and an increase in interstitial lactate, changes that suggest local stimulation of glycolysis by a yet to be determined cell type (Barros et al., 2007 ; Mangia et al., 2009 ). Even better temporal resolution has been obtained by single photon and multiphoton microscopy recording of NAD(P)H and flavoprotein autofluorescence, reporters of the redox potential of mitochondria (revised in Shuttleworth, 2010 ), which suggest that synaptic activity is followed within hundreds of milliseconds of changes in mitochondrial metabolism, consistent with sequential activation of NADH usage and NADH production. However, changes in metabolite concentration do not inform unambiguously about flux and it is a given change in concentration may be observed with both increased and decreased flux. Recently, the uptake of fluorescent glucose analogs was measured in cerebellar slices using multiphoton microscopy, showing that Bergmann glial cells transport and metabolize sugars more efficiently than Purkinje cells and granule cells (Barros et al., 2009 ). This methodology is capable of measuring metabolic flux and can resolve single cells but its temporal resolution is hampered by the slow rate of dye transport into the cell, which precludes the study of acute metabolic modulation. The desired combination of high temporal resolution with high spatial resolution may be attained with genetically encoded nanosensors, which are currently available for an ample range of metabolites (Frommer et al., 2009 ). Their expression in specific cell types using transgenesis and their detection in vivo, perhaps using multiphoton microscopy, should facilitate a new level of understanding of brain energy metabolism.
This work was funded by Fondecyt 10070046. The Centro de Estudios Científicos (CECS) is funded by the Chilean Government through the Millennium Science Initiative and the Centers of Excellence Base Financing Program of CONICYT. CECS is also supported by a group of private companies which at present includes Antofagasta Minerals, Arauco, Empresas CMPC, Indura, Naviera Ultragas and Telefónica del Sur. CIN is funded by Conicyt and the Gobierno Regional de Los Ríos.
Attwell, D., and Laughlin, S. B. (2001). An energy budget for signaling in the grey matter of the brain. J. Cereb. Blood Flow Metab. 21, 1133–1145.
Barros, L. F., Bittner, C. X., Loaiza, A., and Porras, O. H. (2007). A quantitative overview of glucose dynamics in the gliovascular unit. Glia 55, 1222–1237.
Barros, L. F., Courjaret, R., Jakoby, P., Loaiza, A., Lohr, C., and Deitmer, J. W. (2009). Preferential transport and metabolism of glucose in Bergmann glia over Purkinje cells: a multiphoton study of cerebellar slices. Glia 57, 962–970.
Barros, L. F., and Martinez, C. (2007). An enquiry into metabolite domains. Biophys. J. 92, 3878–3884.
Dienel, G. A., and Hertz, L. (2001). Glucose and lactate metabolism during brain activation. J. Neurosci. Res. 66, 824–838.
Frommer, W. B., Davidson, M. W., and Campbell, R. E. (2009). Genetically encoded biosensors based on engineered fluorescent proteins. Chem. Soc. Rev. 38, 2833–2841.
Kessler, R. M. (2003). Imaging methods for evaluating brain function in man. Neurobiol. Aging 24(Suppl. 1), S21–S35.
Mangia, S., Giove, F., Tkac, I., Logothetis, N. K., Henry, P. G., Olman, C. A., Maraviglia, B., Di, S. F., and Ugurbil, K. (2009). Metabolic and hemodynamic events after changes in neuronal activity: current hypotheses, theoretical predictions and in vivo NMR experimental findings. J. Cereb. Blood Flow Metab. 29, 441–463.
Pascual, O., Casper, K. B., Kubera, C., Zhang, J., Revilla-Sanchez, R., Sul, J. Y., Takano, H., Moss, S. J., McCarthy, K., and Haydon, P. G. (2005). Astrocytic purinergic signaling coordinates synaptic networks. Science 310, 113–116.
Citation: Barros LF (2010) Towards single-cell real-time imaging of energy metabolism in the brain. Front. Neuroenerg. 2:4. doi:10.3389/fnene.2010.00004
Received: 27 January 2010;
Accepted: 04 April 2010;
Published online: 07 June 2010
Copyright: © 2010 Barros. This is an open-access article subject to an exclusive license agreement between the authors and the Frontiers Research Foundation, which permits unrestricted use, distribution, and reproduction in any medium, provided the original authors and source are credited.
*Correspondence: ZmJhcnJvc0BjZWNzLmNs
Disclaimer: All claims expressed in this article are solely those of the authors and do not necessarily represent those of their affiliated organizations, or those of the publisher, the editors and the reviewers. Any product that may be evaluated in this article or claim that may be made by its manufacturer is not guaranteed or endorsed by the publisher.
Research integrity at Frontiers
Learn more about the work of our research integrity team to safeguard the quality of each article we publish.