 Fred Hasselman
 Luciënne den Uil2,3
 Peter de Looff
- 1Behavioural Science Institute, Radboud University, Nijmegen, Netherlands
- 2Department of Research and Development, Pluryn, Nijmegen, Netherlands
- 3Fivoor Science and Treatment Innovation, Den Dolder, Netherlands
- 4Department of Developmental Psychology, Tilburg University, Tilburg, Netherlands
- 5Specialized Forensic Care, De Borg National Expert Center, Den Dolder, Netherlands
In the study of synchronization dynamics between interacting systems, several techniques are available to estimate coupling strength and coupling direction. Currently, there is no general ‘best’ method that will perform well in most contexts. Inter-system recurrence networks (IRN) combine auto-recurrence and cross-recurrence matrices to create a graph that represents interacting networks. The method is appealing because it is based on cross-recurrence quantification analysis, a well-developed method for studying synchronization between 2 systems, which can be expanded in the IRN framework to include N > 2 interacting networks. In this study we examine whether IRN can be used to analyze coupling dynamics between physiological variables (acceleration, blood volume pressure, electrodermal activity, heart rate and skin temperature) observed in a client in residential care with severe to profound intellectual disabilities (SPID) and their professional caregiver. Based on the cross-clustering coefficients of the IRN conclusions about the coupling direction (client or caregiver drives the interaction) can be drawn, however, deciding between bi-directional coupling or no coupling remains a challenge. Constructing the full IRN, based on the multivariate time series of five coupled processes, reveals the existence of potential feedback loops. Further study is needed to be able to determine dynamics of coupling between the different layers.
1 Introduction
In studies of the synchronization dynamics of interacting systems, many techniques are available to determine whether there is a (statistical) dependence between observed time series of the variables of interest, such as the cross-correlation function or the mutual information measure. A more complicated research question concerns causal inference from observed time series data, in which the goal is to quantify and qualify the nature of the coupling dynamics between the interacting systems in terms of strength and direction (unidirectional, symmetric, asymmetric bidirectional, etc.). Many different techniques are available like linear and nonlinear Granger causality (Granger, 1969; Marinazzo et al., 2011), various information theoretic measures such as transfer entropy (Schreiber, 2000), conditional mutual information (Paluš et al., 2001) and synergistic information (Quax et al., 2017), Cross-RQA (Zbilut et al., 1998; Shockley et al., 2002; Richardson et al., 2007) and Cross-Mapping techniques (Sugihara et al., 2012; Ma et al., 2014; Ma et al., 2017; Leng et al., 2020). The accurate identification of the coupling direction, however, remains a challenge (Feldhoff et al., 2012; Runge et al., 2019). Determining which technique is ‘best’ may depend on the specific context, because different techniques come with different sets of assumptions about the data generating process (e.g., linear, stationary, etc.) and different requirements for the observed data (e.g., time series length, noise levels). In addition, some measures of coupling direction have been shown to give inaccurate results based on the coupling strength and parameters such as frequency and phase differences between the signals (Feldhoff et al., 2012).
In the cognitive, behavioral and neurosciences, Cross-Recurrence Quantification analysis (CRQA) has frequently been used to study coupling dynamics of human behavior and physiology, for example, in postural sway, heart rate variability, interpersonal behavior and emotion dynamics (Shockley, 2005; Konvalinka et al., 2011; Cox et al., 2016; Main et al., 2016; Vink et al., 2018). In the present paper we demonstrate how measures obtained from inter-system recurrence networks (Feldhoff et al., 2012) can be used to analyze the synchronization between physiological signals that were simultaneously observed in two interacting individuals. Inter system recurrence networks are an extension of multilayer recurrence networks, in which the cross-recurrence matrix is used to quantify the interdependence between different network layers (Zou et al., 2019). The goal is not to present an optimal method for detecting coupling direction, but to explore the applicability of inter-system recurrence networks to analyze empirical data observed in a healthcare setting. One reason to choose the (multiplex) recurrence network framework is the potential for application in clinical practice (Hasselman, 2022). Due to affordable wearable sensors and electronic devices that allow experience sampling and momentary ecological assessment (self-reports of physiological, psychological, or emotional states), many healthcare institutes are looking for ways to integrate such process monitoring data into diagnostic and intervention (Fartacek et al., 2016; Olthof et al., 2019; Hasselman, 2022), and explore opportunities to personalize such procedures (Schiepek et al., 2016; Olthof et al., 2023).
The data analyzed in the present paper concern a client in residential care with severe to profound intellectual disabilities (SPID) and their professional caregiver, both equipped with wearable sensors which recorded a number of physiological signals (acceleration, blood volume pressure, electrodermal activity, heart rate and skin temperature) during regular daily shifts (Simons et al., 2021). A substantial percentage of people with SPID show severely challenging behavior, which most frequently includes aggression and self-injury (Janssen et al., 2002). In residential care, incidents in which SPID clients display challenging behavior are obviously a stressor for the client, but also for their environment, in particular the professional caregiver tasked with resolving as well as preventing such incidents. The frequency of occurrence and the severity of such incidents is known to affect caregivers’ wellbeing and consequently the quality of the care they are able to provide (Devereux et al., 2009). The focus of the analysis will be to assess the coupling strength and direction of physiological signals in the period before an incident with challenging behavior occurred (see Figure 4 for an example of the data). The goal is to gain insight in the role of physiological coupling dynamics between individuals leading up to an incident which may inform methods to reduce or prevent the frequency of occurrence and severity of such incidents. First, we formally introduce the concept of inter-system networks (IRN) and the measures that can be used to quantify coupling dynamics, second, we use simulated data to demonstrate the behavior of IRN measures in different coupling scenarios, finally we present an analysis of the empirical client-caregiver data using the same measures.
2 Inter-system recurrence networks (IRN)
Recurrence networks represent a graph-theoretical approach to time series analysis that is based on recurrence analysis, which evaluates the proximity of phase space trajectories. The structural properties of the recurrence network are associated to the geometry of the underlying attractor (Zou et al., 2019). In this section we describe how to construct a so-called inter-system recurrence network which is a representation of 2 (or more) interacting recurrence networks and examines to what extent the different systems can be understood to share the same state space or show evidence of coupled dynamics.
2.1 Constructing a recurrence network
An
in which
The recurrence matrix can be used to generate a graph, a so-called recurrence network (RN) (Zou et al., 2019). In a recurrence network, each vertex (node) represents a time point and each edge (a connection between 2 vertices) indicates that the values observed at these time points are recurring values, given the threshold
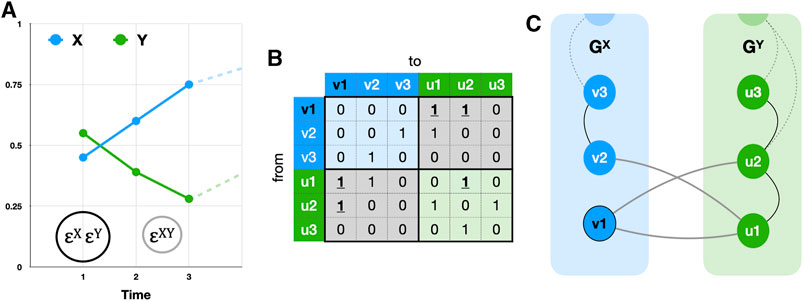
FIGURE 1. (A) shows two time series X (blue) and Y (green) and thresholds εX = εY (black circle) and εXY = εYX (grey circle). (B) shows the composite adjacency matrix built from the recurrence matrices of X (top left, blue cells) and Y (bottom right, green cells) and their cross-recurrence matrices (bottom left and top right, grey cells). (C) shows two recurrence networks GX and GY, joined together through the cross-recurrence matrix as an interconnected recurrence network. To calculate triangle-based measures like the clustering coefficient, intersystem as well as intra system edges must be evaluated, for example, the triangle starting in v1: E(GXY) = {(v1, u1), (u1, u2), (u2, v1)}, see the bold, underlined 1s in (B). Here, the cross-edge density 𝜌XY = 𝜌YX = 0.33, cross-clustering CXY = 0.33 ≠ CYX = 0.
2.2 Constructing an inter-system recurrence network
An extension of RQA developed to study synchronization and coupling dynamics is called Cross-RQA (Marwan and Kurths, 2002; Shockley et al., 2002) and involves evaluating whether the state evolution of two systems
where
with
where
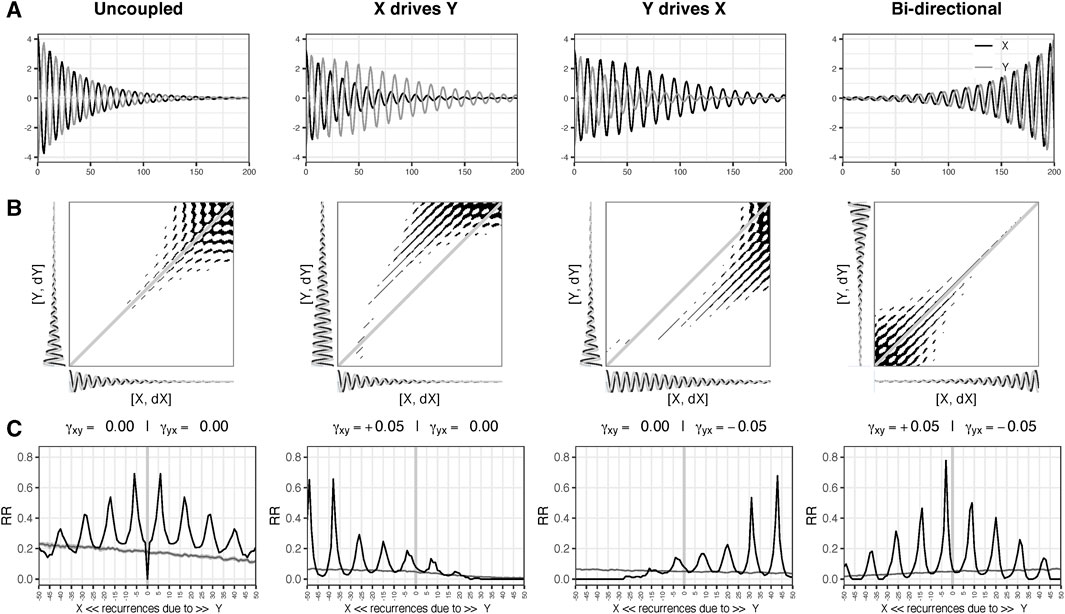
FIGURE 2. (A) shows simulation of 201 time steps of 2 damped oscillators X and Y (standardized) in anti-phase for 4 different types of coupling scenarios: Uncoupled, X driving Y, Y driving X, and Competitive bi-directional. The panels in row (B) show the Cross Recurrence Plots (CRPs) based on the joint 2D state space of X (X, dX) and Y (Y, dY). Row (C) shows the Diagonal Cross-Recurrence Profiles (DCRP), representing the distribution of recurrent points around the main diagonal (0 on the x-axis of the DCRP). The grey lines are based on 39 surrogate DCRP analyses in which the temporal order of Y was randomized. If the (black) line falls above or below the grey line the observed value is above/below what may be expected based on chance (p < .05).
2.3 IRN measures
The first measure of interest for an IRN is the local vertex cross-degree:
with
2.3.1 The cross-edge density
is a proportion representing the total number of cross-edges over the maximum possible number of edges which is equal to the cross-recurrence rate
The local cross-clustering coefficient is an estimate of the probability that two neighbors of vertex
with
which gives
The cross-clustering coefficient measures provide information about the way the two systems are coupled and can be used to infer a coupling direction. In Section 3 we demonstrate the behavior of these measures for different coupling scenarios.
3 Simulation study: coupled oscillators
3.1 Method
The cross-clustering coefficients that can be computed from an IRN have been shown to take on different values for different coupling scenarios (Donges et al., 2011; Feldhoff et al., 2012). Predictions can be made about the expected relative magnitudes of the measures, here we demonstrate the behavior of these measures using two coupled damped oscillators, because our goal is to analyze physiological signals, which are usually periodic and may vary in amplitude and frequency over time. However, the expectations presented here do not differ from previous studies (Donges et al., 2011; Feldhoff et al., 2012).
If the oscillators are uncoupled, any cross-recurrences found will be spurious, however, they are expected because of the similarity between the oscillators, the only difference will be a phase lag. Therefore, the expectation is that
The analysis scripts are available at https://osf.io/5n9kv/.
3.1.1 Procedure
To study the behavior of inter-system recurrence network measures, two linear damped oscillators X and Y were simulated:
Parameters
To analyze the data, auto-recurrence matrices for
3.2 Results
Figure 2 shows the cross-recurrence plots (CRP) in row B and the DCRPs in row C. Recurrent points in the diagonals of the upper triangle of the CRP are due to values occurring first in X (negative numbers on the x-axis of the DCRP), recurrent points in the lower triangle (positive diagonal numbers) are due to values occurring first in Y. If a peak is centered on the main diagonal this would suggest the systems are fully synchronized and display the same states at approximately the same point in time. If a peak is centered around diagonals in the lower or upper triangle of the matrix the inference can be made either system
The interpretation by visual inspection of the DCRPs is facilitated by our knowledge of the system under study. With an unknown system, the unidirectional coupling would not pose a problem in this case, but distinguishing between the uncoupled scenario and the bi-directional coupling would likely be uncertain. Figure 3C shows the IRN for the scenario “Y drives X” as two coupled recurrence networks (Figures 3A, B) in a spiral layout (Hasselman and Bosman, 2020).
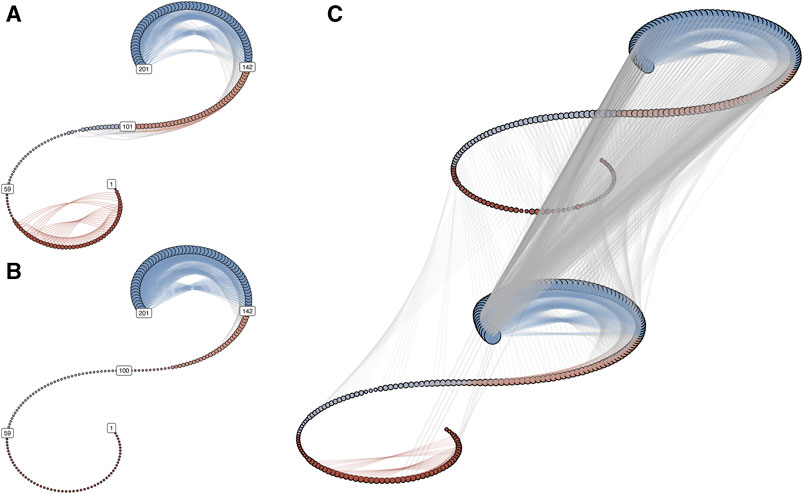
FIGURE 3. (A,B) represent the recurrence networks of oscillator X and Y for the coupling scenario “Y drives X.” In the spiral graph layout, the temporal order is retained, with t = 1 at the lower end of the spiral and t = 201 at the upper end. The vertices are colored to distinguish 4 epochs of equal length. If edges connect vertices from the same epoch, the edge color is the same as the vertex color. The size of the vertices scales with the vertex degree of each node. (C) shows the inter-system recurrence network. The grey lines connecting the spirals represent the cross-edges.
Table 1 shows the results for the cross-clustering coefficients, as well as the different thresholds used to generate the (cross-)recurrence matrices. The magnitude differences are all in the expected direction, that is, the difference between the uncoupled and bi-directional scenarios are
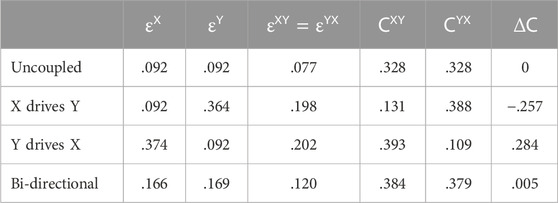
TABLE 1. Inter-system recurrence network threshold parameters and clustering measures.
To study the relationship between coupling strength and the magnitude of the cross-clustering coefficient, further simulations were conducted in which
Figure 4 is a graphical representation of the 41 by 41 matrix. It shows that if both coupling strengths become very large, the two signals become very similar and as expected, the cross-clustering coefficients do not distinguish anymore between the true coupling differences (i.e.,
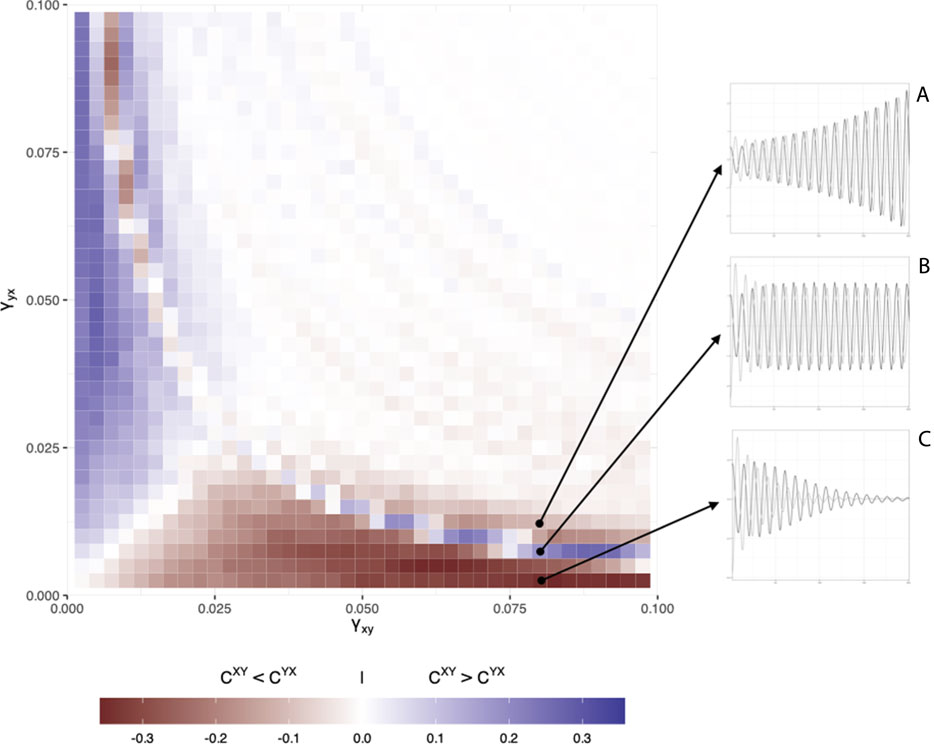
FIGURE 4. Simulation results for the 41 × 41 matrix of different coupling strength values. Color coding represents the difference
4 Coupling between physiological processes
4.1 Method
Data were collected in the context of a larger study of the relation between physiological stress and challenging behavior in clients in residential care with severe to profound intellectual disabilities (SPID) (Simons et al., 2021). The goal of the study was to examine whether information about the dynamics of physiological stress in clients with SPID and their professional caregivers can be used to understand the emergence of challenging behavior and potentially prevent incidents from occurring. In the present study we examine whether a coupling direction can be detected in physiological signals between client and caregiver in the period before an incident occurred.
4.1.1 Participants, materials and procedure
The study was approved by the Faculty Ethics Committee of the Radboud University (NL-number: NL71683.091.19) 12 February 2020. Informed consent was obtained from caregivers and parents or legal representatives of clients. We analyzed 33 incidents experienced by one client-caregiver dyad over the course of 12 days between 3 August 2022 and 27 September 2022 during regular shifts of the caregiver. Both participants wore an Empatica E4 wristband (Milstein and Gordon, 2020; Schuurmans et al., 2020) which records acceleration (ACC), blood volume pressure (BVP), electrodermal activity (EDA), heart rate variability (HR) and temperature (TEMP). Whenever an incident with challenging behavior occurred the time was logged by pressing the event marker button on the wristband. After the incident, the time was also logged manually by the caregiver, providing more detailed information about the incident.
4.1.2 Data analysis
The raw data from the Empatica E4 wristband were imported using R package wearables (de Looff et al., 2022). Figure 5 is an example of the data centered on the time at which an incident occurred; the analyses are based on the 35 min before the incident. There were 4 incidents for which 2 or more timeseries were shorter than 25 min. The most prominent cause was that the incident occurred within 25 min of putting on the wristband, other cases were due to sensor failure. These timeseries were removed, leaving 29 incidents with 5 timeseries. All timeseries were resampled to the same frequency (1 Hz), yielding time series of length 2,100. To construct the IRN, two auto-recurrence matrices were created (one for the client and one for the caregiver) and one cross-recurrence matrix for each incident and each variable. The matrices are based on state space vectors constructed from delay embedded time series. For each incident and variable separately, the embedding lag and embedding dimension were determined for client and caregiver using the mutual information criterion to determine the optimal embedding lag and false nearest neighbor analysis to determine the embedding dimension (Marwan et al., 2007). One set of parameters was chosen for all embeddings (embedding lag = 100 and embedding dimension = 5). The recurrence threshold for the auto-recurrence matrices was chosen to get 5% recurrent points and the cross-recurrence matrix to get 4% recurrent points. Subsequently, the local and global cross-clustering coefficients were calculated.
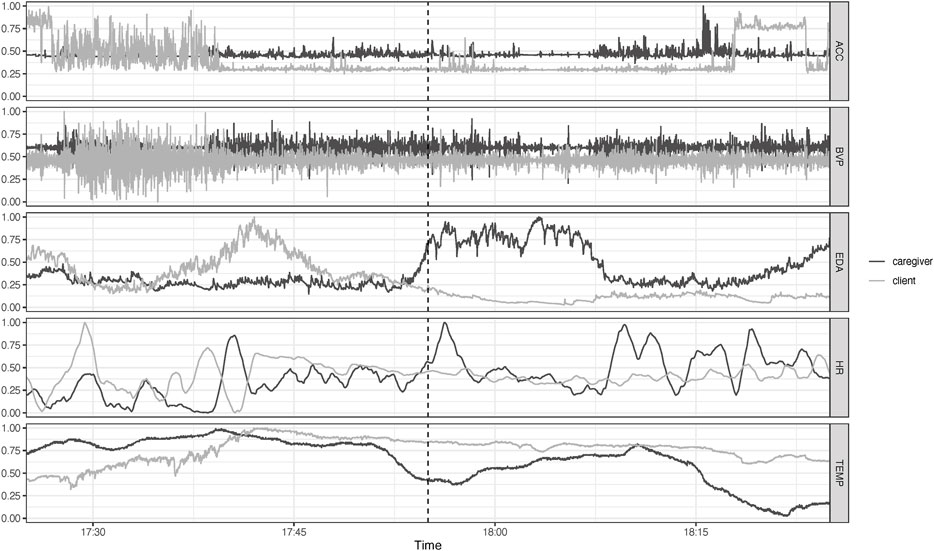
FIGURE 5. Raw time series data from caregiver and patient 30 min before and after an incident with challenging behavior occurred (dotted line at 17:55). Shown are acceleration (ACC), blood volume pressure (BVP), electrodermal activity (EDA), heart rate (HR) and temperature (TEMP).
4.2 Results
Figure 6 displays the global cross-clustering coefficients for the 29 incidents, for the client (X) and the caregiver (Y). The location of the dots above or below the line
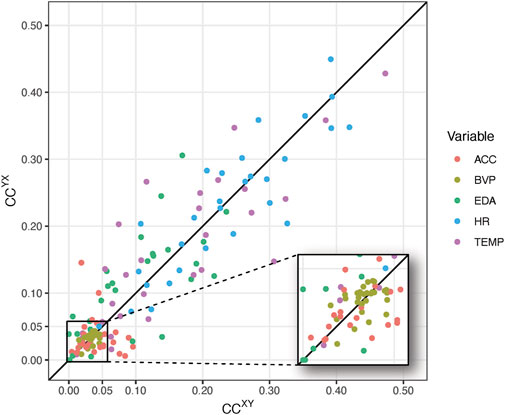
FIGURE 6. Global cross-clustering coefficients for 29 incidents for 5 different inter-system networks based on different physiological time series observed in a client (X) and a caregiver (Y). The inset shows cross-clustering coefficients in range [0,0.05].
The points in the magnified area represent cases in which
Table 2 shows the frequencies with which client and caregiver were driving the interaction, or whether the interaction was bi-directional or uncoupled, for each variable. If the difference
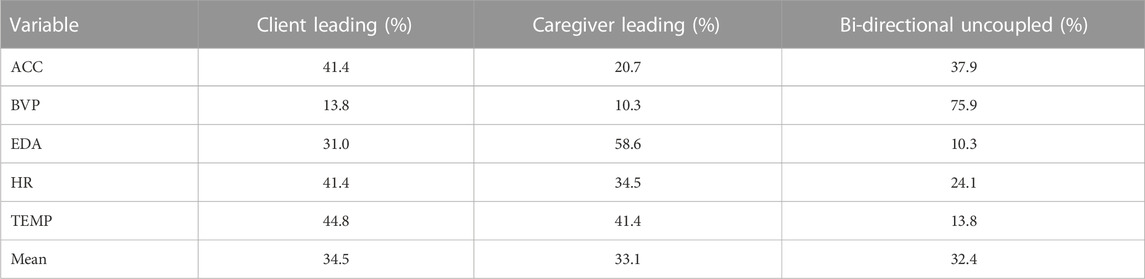
TABLE 2. Frequency of coupling directions per variable across all 29 incidents (percentage).
Across all 29 incidents the three types of coupling dynamics occur with equal frequency (see the row Total in Table 2), however, there are differences between the variables. Most notable: Compared to the caregiver the client leads twice as often for the variable ACC, for BVP the bi-directional/uncoupled type was clearly dominant, and for EDA the caregiver most often was leading the interaction.
Finally, due to the choice for one sampling frequency and one set of embedding parameters for all variables, it is possible to calculate a cross-recurrence matrix for all variable pairs, so a full IRN representing all the observed variables can be constructed. The adjacency matrix has the auto-recurrence matrices of the 5 variables on its main diagonal, all off-diagonal cells represent cross-recurrence matrices between different variable pairs. Figure 7 is a representation of such a multiplex inter-system recurrence network for 1 incident. The edge weights represent the absolute clustering coefficient difference and have been colored to reflect the implied coupling direction. The size of a vertex represents its weighted degree, the vertex strength (Barrat et al., 2004). For this incident an interesting path can be seen that connects the vertices with the greatest strength: The edges connecting EDA–HR–TEMP, are characterized by the client driving the dynamics. A path connecting the second largest set of 3 vertices in terms of strength, is ACC–TEMP–HR. In this loop, the dynamics between ACC–TEMP and ACC–HR are driven by the caregiver, as mentioned before, TEMP–HR is driven by the client.
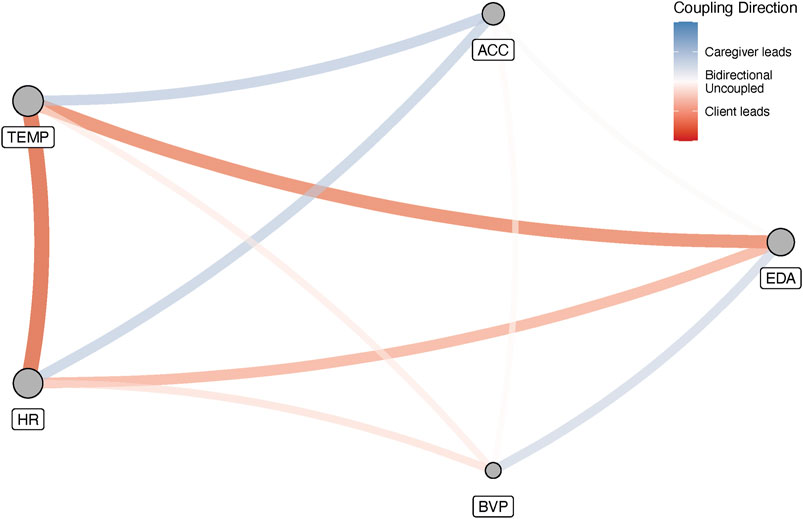
FIGURE 7. The complete multiplex inter-system recurrence network for 1 incident. Edges represent the differences between the cross-clustering coefficients for each variable. The colors are labelled according to the implied coupling direction. The vertex size reflects their strength (weighted degree).
5 General discussion and conclusion
The purpose of the present paper was to examine whether inter-system recurrence networks can be used to determine the coupling direction between physiological signals associated with stress measured simultaneously in a client-caregiver dyad, in which challenging behavior by the client can lead to incidents that are stressful for everyone involved. The question is whether such analyses can inform potential intervention or prevention efforts intended to reduce the number of incidents.
The simulation study in Section 3 provides results that are similar to previous studies (Feldhoff et al., 2012), showing that the magnitudes of the cross-coupling coefficients are associated to coupling strength and can be used to determine a coupling direction. In addition, we show that the qualification of the patterns of DCRPs agree with the inferred coupling direction. However, analogous to previous studies (Feldhoff et al., 2012), we also find parameter settings that may lead to uncertain or incorrect inferences about the coupling direction, given the true coupling strengths. In this particular case, the question is whether this should be considered an error of the method. If we were presented with the time series that yielded this result (e.g., the inset in Figure 4), absent any knowledge of the data generating process, we would conclude the estimated coupling direction to be accurate. It is indeed the case that the oscillator indicated by the cross-clustering coefficients is driving the interaction. The conclusion should be that these analyses do not recover the “true” coupling parameters, if such a thing is even possible, but instead estimate the observed, or implied coupling direction. An open question to be resolved is how to deal with coefficient differences close to 0. These could imply bidirectional, as well as completely uncoupled dynamics. One could argue that completely uncoupled, independent dynamics are unlikely in a measurement context in which individuals are in fact interacting, however, we cannot be completely certain based exclusively on the estimate.
The analysis of the physiological data related to 29 incidents with challenging behavior (Section 4) yielded interpretable results, as well as some corroboration of theoretical constraints on the measures described in Section 2. To start with the latter, Figure 6 clearly shows the expected relationship between (anti-)persistent correlations and edge density. The cross-clustering coefficients for the anti-persistent signal BVP are all equal or smaller than the recurrence rate of .05. For variable ACC there are 8 points outside the magnified region, but in those cases one of the two cross-clustering coefficients is always smaller than .05.
Based on Table 2 one can conclude that this dyad does not have a clear driver of the (physiological) interaction dynamics in the 35 min before an incident occurs. There are some differences between the individual variables, but Figure 7 shows that such differences at the aggregate level may be less informative to understand the interaction dynamics preceding a particular incident. The figure reveals that when all possible cross-edges between variables are considered, feedback loops can be identified that span two or more physiological signals. In Figure 7 there is clearly a strong coupling across heart rate, electrodermal activity and skin temperature that is completely driven by the client. A second motif connects heart rate and temperature to acceleration, which are both driven by the caregiver. What cannot be determined based on the current analyses is a temporal precedence for the emergence of these feedback loops. That is, we cannot claim the caregiver’s movements as measured by the acceleration variable drive the heart rate coupling dynamics which causes a reinforcing feedback loop in the client involving heartrate, electrodermal activity and temperature, that raise the stress levels of both client and caregiver to a level beyond which an incident is inevitable. The opposite scenario could also be true, in which the heart rate of the client causes the caregiver to drive the acceleration interaction dynamics, which in turn reinforces the driving of the heartrate dynamics by the client via temperature.
Future studies should explore whether imposing temporal constraints on the recurrence networks, i.e., turning them into directed networks (Hasselman, 2022) can provide more detailed information about temporal precedence in coupling dynamics. In regular directed networks, cross-clustering coefficients can be calculated to represent different types of connected triples, such as cycles, fanning in, fanning out and middleman patterns (Fagiolo, 2007). It is also possible to create weighted (and/or directed) recurrence networks (Hasselman and Bosman, 2020), for example, by keeping the distance values of the points that fall below the recurrence threshold
To summarize, the inter-system recurrence network approach to the analysis of coupled, multivariate systems produces estimates of coupling direction that are interpretable relative to the measurement context and provide insights into complex dependencies between different variables. These initial results suggest that IRN measures can at least inform post-hoc evaluations of interaction dynamics, which, in the present context, could occur as soon as the Empatica4 data become available. More research is required to determine whether the method can eventually be used to inform decisions related to intervention/prevention of behavior during real-time process monitoring of physiological and/or psychological variables.
Data availability statement
The raw data supporting the conclusion of this article will be made available by the authors, without undue reservation.
Ethics statement
The studies involving humans were approved by Faculty Ethics Committee of the Radboud University (NL-number: NL71683.091.19) 12 February 2020. The studies were conducted in accordance with the local legislation and institutional requirements. Written informed consent for participation in this study was provided by the participants’ legal guardians/next of kin.
Author contributions
FH: Conceptualization, Methodology, Visualization, Writing–original draft, Writing–review and editing. LU: Data curation, Project administration, Writing–review and editing. RK: Data curation, Project administration, Writing–review and editing. PL: Data curation, Methodology, Project administration, Writing–review and editing. RO: Data curation, Project administration, Writing–review and editing.
Funding
The authors declare that no financial support was received for the research, authorship, and/or publication of this article.
Conflict of interest
The authors declare that the research was conducted in the absence of any commercial or financial relationships that could be construed as a potential conflict of interest.
Publisher’s note
All claims expressed in this article are solely those of the authors and do not necessarily represent those of their affiliated organizations, or those of the publisher, the editors and the reviewers. Any product that may be evaluated in this article, or claim that may be made by its manufacturer, is not guaranteed or endorsed by the publisher.
References
Barrat, A., Barthélemy, M., Pastor-Satorras, R., and Vespignani, A. (2004). The architecture of complex weighted networks. Proceedings of the National Academy of Sciences of the United States of America.
Cox, R. F., van der Steen, S., Guevara, M., de Jonge-Hoekstra, L., and van Dijk, M. (2016). “Chromatic and anisotropic cross-recurrence quantification analysis of interpersonal behavior,” in Recurrence plots and their quantifications: expanding horizons (Springer), 209–225.
de Looff, P., Duursma, R., Noordzij, M., Taylor, S., Jaques, N., Scheepers, F., et al. (2022). Wearables: an R package with accompanying shiny application for signal analysis of a wearable device targeted at clinicians and researchers. Front. Behav. Neurosci. 16, 856544. doi:10.3389/fnbeh.2022.856544
Devereux, J., Hastings, R., and Noone, S. (2009). Staff stress and burnout in intellectual disability services: work stress theory and its application. J. Appl. Res. Intellect. Disabil. 22 (6), 561–573. doi:10.1111/j.1468-3148.2009.00509.x
Donges, J. F., Schultz, H. C. H., Marwan, N., Zou, Y., and Kurths, J. (2011). Investigating the topology of interacting networks—theory and application to coupled climate subnetworks. Eur. Phys. J. B 84 (4), 635–651. Article 4. doi:10.1140/epjb/e2011-10795-8
Fagiolo, G. (2007). Clustering in complex directed networks. Phys. Rev. E 76 (2), 026107. doi:10.1103/PhysRevE.76.026107
Fartacek, C., Schiepek, G., Kunrath, S., Fartacek, R., and Plöderl, M. (2016). Real-time monitoring of non-linear suicidal dynamics: methodology and a demonstrative case report. Front. Psychol. 7, 130. doi:10.3389/fpsyg.2016.00130
Feldhoff, J. H., Donner, R. V., Donges, J. F., Marwan, N., and Kurths, J. (2012). Geometric detection of coupling directions by means of inter-system recurrence networks. Phys. Lett. A 376 (46), 3504–3513. doi:10.1016/j.physleta.2012.10.008
Granger, C. W. J. (1969). Investigating causal relations by econometric models and cross-spectral methods. Econometrica 37 (3), 424–438. doi:10.2307/1912791
Hasselman, F. (2022). Early warning signals in phase space: geometric resilience loss indicators from multiplex cumulative recurrence networks. Front. Physiology 13, 859127. doi:10.3389/fphys.2022.859127
Hasselman, F., and Bosman, A. M. T. (2020). Studying complex adaptive systems with internal states: a recurrence network approach to the analysis of multivariate time-series data representing self-reports of human experience. Front. Appl. Math. Statistics 6. doi:10.3389/fams.2020.00009
Janssen, C. G. C., Schuengel, C., and Stolk, J. (2002). Understanding challenging behaviour in people with severe and profound intellectual disability: a stress-attachment model. J. Intellect. Disabil. Res. 46 (6), 445–453. doi:10.1046/j.1365-2788.2002.00430.x
Konvalinka, I., Xygalatas, D., Bulbulia, J., Schjødt, U., Jegindø, E.-M., Wallot, S., et al. (2011). Synchronized arousal between performers and related spectators in a fire-walking ritual. Proc. Natl. Acad. Sci. U. S. A. 108, 8514–8519. doi:10.1073/pnas.1016955108
Leng, S., Ma, H., Kurths, J., Lai, Y.-C., Lin, W., Aihara, K., et al. (2020). Partial cross mapping eliminates indirect causal influences. Nat. Commun. 11 (1), 2632. doi:10.1038/s41467-020-16238-0
Ma, H., Aihara, K., and Chen, L. (2014). Detecting causality from nonlinear dynamics with short-term time series. Sci. Rep. 4 (1), 7464. Article 1. doi:10.1038/srep07464
Ma, H., Leng, S., Tao, C., Ying, X., Kurths, J., Lai, Y.-C., et al. (2017). Detection of time delays and directional interactions based on time series from complex dynamical systems. Phys. Rev. E 96 (1), 012221. doi:10.1103/PhysRevE.96.012221
Main, A., Paxton, A., and Dale, R. (2016). An exploratory analysis of emotion dynamics between mothers and adolescents during conflict discussions. Emotion 16 (6), 913–928. doi:10.1037/emo0000180
Marinazzo, D., Liao, W., Chen, H., and Stramaglia, S. (2011). Nonlinear connectivity by Granger causality. NeuroImage 58 (2), 330–338. doi:10.1016/j.neuroimage.2010.01.099
Marwan, N., and Kurths, J. (2002). Nonlinear analysis of bivariate data with cross recurrence plots. Phys. Lett. A 302 (5–6), 299–307. doi:10.1016/s0375-9601(02)01170-2
Marwan, N., Romano, M. C., Thiel, M., and Kurths, J. (2007). Recurrence plots for the analysis of complex systems. Phys. Reports-Review Sect. Phys. Lett. 438 (5–6), 237–329. doi:10.1016/j.physrep.2006.11.001
Milstein, N., and Gordon, I. (2020). Validating measures of electrodermal activity and heart rate variability derived from the Empatica E4 utilized in research settings that involve interactive dyadic states. Front. Behav. Neurosci. 14, 148. doi:10.3389/fnbeh.2020.00148
Olthof, M., Hasselman, F., Aas, B., Lamoth, D., Scholz, S., Daniels-Wredenhagen, N., et al. (2023). The best of both worlds? General principles of psychopathology in personalized assessmen. J. Psychopathol. Clin. Sci. 132, 808–819. doi:10.1037/abn0000858
Olthof, M., Hasselman, F., Strunk, G., van Rooij, M., Aas, B., Helmich, M. A., et al. (2019). Critical fluctuations as an early-warning signal for sudden gains and losses in patients receiving psychotherapy for mood disorders. Clin. Psychol. Sci. 8 (1), 25–35. doi:10.1177/2167702619865969
Paluš, M., Komárek, V., Hrnčíř, Z., and Štěrbová, K. (2001). Synchronization as adjustment of information rates: detection from bivariate time series. Phys. Rev. E 63 (4), 046211. doi:10.1103/PhysRevE.63.046211
Petzold, L. (1983). Automatic selection of methods for solving stiff and nonstiff systems of ordinary differential equations. SIAM J. Sci. Stat. Comput. 4 (1), 136–148. doi:10.1137/0904010
Quax, R., Har-Shemesh, O., and Sloot, P. M. A. (2017). Quantifying synergistic information using intermediate stochastic variables. Entropy 19 (2), 85. Article 2. doi:10.3390/e19020085
R Core Team (2022). R: a language and environment for statistical computing. Vienna, Austria: R Foundation for Statistical Computing.
Richardson, D. C., Dale, R., and Kirkham, N. Z. (2007). The art of conversation is coordination: common ground and the coupling of eye movements during dialogue. Psychol. Sci. 18 (5), 407–413. doi:10.1111/j.1467-9280.2007.01914.x
Runge, J., Bathiany, S., Bollt, E., Camps-Valls, G., Coumou, D., Deyle, E., et al. (2019). Inferring causation from time series in Earth system sciences. Nat. Commun. 10 (1), 2553. Article 1. doi:10.1038/s41467-019-10105-3
Schiepek, G., Stöger-Schmidinger, B., Aichhorn, W., Schöller, H., and Aas, B. (2016). Systemic case formulation, individualized process monitoring, and state dynamics in a case of dissociative identity disorder. Front. Psychol. 7, 1545. doi:10.3389/fpsyg.2016.01545
Schreiber, T. (2000). Measuring information transfer. Phys. Rev. Lett. 85 (2), 461–464. doi:10.1103/PhysRevLett.85.461
Schuurmans, A. A. T., de Looff, P., Nijhof, K. S., Rosada, C., Scholte, R. H. J., Popma, A., et al. (2020). Validity of the Empatica E4 wristband to measure heart rate variability (hrv) parameters: a comparison to electrocardiography (ecg). J. Med. Syst. 44 (11), 190. doi:10.1007/s10916-020-01648-w
Shockley, K. (2005). “Cross recurrence quantification of interpersonal postural activity,” in Tutorials in contemporary nonlinear methods for the behavioral sciences, 142–177. Available at: http://nsf.gov/sbe/bcs/pac/nmbs/chap4.pdf.
Shockley, K., Butwill, M., Zbilut, J. P., and Webber, C. L. (2002). Cross recurrence quantification of coupled oscillators. Phys. Lett. A 305 (1–2), 59–69. doi:10.1016/s0375-9601(02)01411-1
Simons, R., Koordeman, R., de Looff, P., and Otten, R. (2021). Physiological measurements of stress preceding incidents of challenging behavior in people with severe to profound intellectual disabilities: longitudinal study protocol of single-case studies. JMIR Res. Protoc. 10, e24911. doi:10.2196/24911
Soetaert, K., Petzoldt, T., and Setzer, R. W. (2010). Solving differential equations in R: package deSolve. J. Stat. Softw. 33, 1–25. doi:10.18637/jss.v033.i09
Sugihara, G., May, R., Ye, H., Hsieh, C., Deyle, E., Fogarty, M., et al. (2012). Detecting causality in complex ecosystems. Sci. (New York, N.Y.) 338 (6106), 496–500. doi:10.1126/science.1227079
Vink, R., Hasselman, F., Cillessen, A. H., Wijnants, M. L., and Bosman, A. M. (2018). Does competence determine who leads in a dyadic cooperative task? A study of children with and without a neurodevelopmental disorder. Complexity.
Wallot, S., and Leonardi, G. (2018). Analyzing multivariate dynamics using cross-recurrence quantification analysis (CRQA), diagonal-cross-recurrence Profiles (DCRP), and multidimensional recurrence quantification analysis (MdRQA) – a tutorial in R. Front. Psychol. 9, 2232. doi:10.3389/fpsyg.2018.02232
Zbilut, J. P., Giuliani, A., and Webber, C. L. (1998). Detecting deterministic signals in exceptionally noisy environments using cross-recurrence quantification. Phys. Lett. A 246 (1–2), 122–128. doi:10.1016/s0375-9601(98)00457-5
Keywords: synchronization, complex networks, inter-system recurrence networks, coupling direction, physiological stress, severe intellectual disabilities
Citation: Hasselman F, den Uil L, Koordeman R, de Looff P and Otten R (2023) The geometry of synchronization: quantifying the coupling direction of physiological signals of stress between individuals using inter-system recurrence networks. Front. Netw. Physiol. 3:1289983. doi: 10.3389/fnetp.2023.1289983
Received: 06 September 2023; Accepted: 19 October 2023;
Published: 01 November 2023.
Edited by:
John G. Holden, University of Cincinnati, United StatesReviewed by:
Kevin Shockley, University of Cincinnati, United StatesNorbert Marwan, Potsdam Institute for Climate Impact Research (PIK), Germany
Copyright © 2023 Hasselman, den Uil, Koordeman, de Looff and Otten. This is an open-access article distributed under the terms of the Creative Commons Attribution License (CC BY). The use, distribution or reproduction in other forums is permitted, provided the original author(s) and the copyright owner(s) are credited and that the original publication in this journal is cited, in accordance with accepted academic practice. No use, distribution or reproduction is permitted which does not comply with these terms.
*Correspondence: Fred Hasselman, ZnJlZC5oYXNzZWxtYW5AcnUubmw=